parameters of flow glottogram and egg for vocal...
TRANSCRIPT
Parameters of Flow Glottogram and EGG for Vocal Registers - Modal, Falsetto and voce faringea Alexander Mayr
Abstract The voice source created in the laryngeal apparatus is conveyed through a pulsing trans-glottal air flow, and can be depicted in a wave form (flow glottogram) where important aspects of phonation are revealed. Since the two main vocal registers - modal and falsetto - are directly related to the voice source, we can assume that sounds from these register mechanisms yield distinct wave forms in the wave glottogram. For the purposes of this study, a professional tenor/countertenor sang sound samples that underwent a process of reverse filtering, in three vocal registers - modal, falsetto and voce faringea - whereupon various parameters were measured for the voice source. In addition to the flow glottogram, an electro-glottogram and a long-term average spectrum (LTAS) were employed, and a formant analysis was made. Also, the sub-glottal air pressure (Psub) was measured using an inter-oral device, as were the closed phase of the vocal folds (Qclosed), the pulse amplitude, the maximum flow declination rate (MFDR), the normalized amplitude quotient (NAQ), and the difference in volume between the two lowest partials (H1-H2). As compared with falsetto, the modal register yielded higher values for Qclosed, MDFR and Psub, and lower values for NAQ and H1-H2. Compared to falsetto, the voce faringea showed higher values for Qclosed and MDFR, and lower values for NAQ, H1-H2, pulse amplitude, and Psub. The glottogram parameters measured for sound samples in falsetto and modal register showed the expected differences and were consistent with the earlier studies. However, the values for tones produced in voce faringea indicate that this register consists of tones produced in falsetto with a clearly modal sound quality.
Introduction The central focus of my artistic/scientific research project constituting the frame for this study is the artistic and scientific reconstruction of a certain register mechanism employed particularly by the tenori di grazia up into the 19th century. This register mirrors in an exemplary fashion a pre-romantic vocal ideal of sound that seems clearly divergent from ones prevalent today. Historical sources, such as textbooks of vocal technique and physiological studies as well as reviews and articles in musical journals, provide evidence for the extraordinary aesthetic qualities of this mode of phonation employed by famous tenors of that era.
In his 1951 book, The Voice of the Mind, Edgar Herbert-Caesari calls this mechanism voce faringea (pharyngeal voice).1 Other names from the 18th and 19th century for this vocal function were voix pharyngienne, voix sur-laryngienne, faucet, voix mixte, voce mezzo falso, and “feigned voice”. The voce faringea was seen as a kind of link between modal register and falsetto, and/or a mixed form of both vocal functions.
1 Herbert-Caesari, The Voice of the Mind, 1951, pp. 333-354. 1
We can assume that this meant a falsetto-dominant register mechanism with considerably increased vocal fold adduction and m. vocalis activity.
Titze describes vocal registers as distinct observable regions in the voice where the sound quality retains constancy throughout a certain range2; according to Sundberg, “register” can be defined as an area of phonation frequency within which all notes seem produced in a similar fashion, with a similar timbre.3
Although preferred register terminology notoriously diverges among voice researches, voice teachers and singers4, certain relations between modal and falsetto vocal registers - with attendant vibrational characteristics of the vocal folds - can be today accepted as established conclusions from modern research. For decades, the physiological/functional differences between modal and falsetto register have been a focus of scientific voice research. According to van der Berg5, the chest register (modal register) differs from the falsetto register through an increased tension in the m. vocalis (m. thyroarytaenoieus, TA), whereas falsetto entails a greater longitudinal tension of the ligament, with the m. cricothyroideus (CT) relatively dominant. Through increased activity of the TA, the main body of the vocal folds becomes thicker, with a greater vibrating mass during phonation. Characteristic for the sound produced in modal register is the stronger presence of high-frequency overtones, whereas in falsetto the fundamental frequency has greater amplitude.
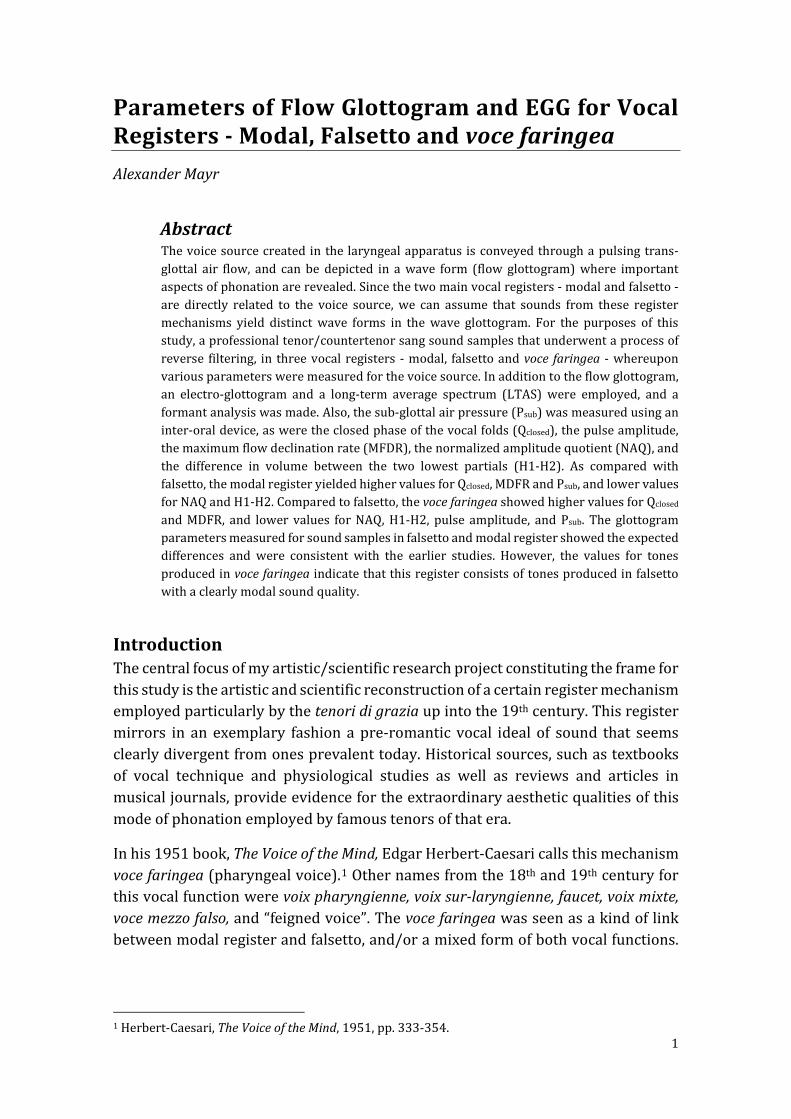
In his body-cover model, Hirano6 describes varying conditions of contraction in various layers of the vocal folds. In the modal register, the main body of the vocal folds is stiffened against their surface through a tensed vocalis muscle, which leads to a mucosal wave with clearly vertical phase lag. In falsetto, due to stretching in the outer layers of the vocal folds and minimal activity of the vocalis muscle, there is a considerable reduction in the mucosal wave and hence also a shorter closed phase of the glottis. Results obtained from electro-glottograms
2 „perceptually distinct regions of vocal quality that can be maintained over some ranges of pitch and loudness“. Titze, 2000, p. 282. 3 Sundberg, Die Wissenschft von der Singstimme, 1997, p. 74. 4 In 1963, Marianne Mörner et al. documented 107 terms for the various registers. (Mörner, Fransson and Fant, 1963) 5 Van der Berg, 1963. 6 Hirano, 1974.
Figure 1: The layers of the vocal folds: epithelium, lamina propria and M. vocalis (TA). After Hirano: Titze., 1994
2
(EGG)7 confirm Hirano’s body-cover model. It is known that in a register shift from modal to falsetto, an alteration in EGG signal form occurs exactly corresponding to the contact area of the vocal folds. The EGG curve for the modal register reveals a longer contact period of the vocal folds and thus a prolonged closed phase of the glottis as compared to falsetto.
On the basis of these findings, falsetto and modal registers can be identified through differing patterns of vibration in the vocal folds. Vibration cycles with varying periods of the glottis’ open and closed phase can also be derived from the curve form of trans-glottal air flow. A typically long open-quotient of the glottis for the falsetto register (i.e., the time within a vibration cycle during which no contact occurs between the vocal folds) can be recognized via a higher pulse amplitude and a rounded wave form, whereas the modal register can be identified by its smaller and pointed amplitude.
The wave form of the flow glottogram can be represented by means of inverse filtering. Through a filtering process, the resonance influence of the vocal tract can be eliminated. The result of this inverse filtering is the flow glottogram - which exhibits the wave form of the voice source. This signal corresponds to the physiological vibration cycle of the vocal folds, and thus in turn indicates the opened and closed phases of the glottis. From the curve form, many important parameters of phonation can be derived: a large pulse amplitude usually accompanies a shorter or even incomplete closure of the vocal folds, which indicates a hypofunctional (breathy) phonation; a hyperfunctional (pressed) phonation can be detected from a smaller pulse amplitude and a clearly observable, relatively long closure of the glottis.
The characteristics of the vocal spectrum stand in direct relation to the form and amplitude of the pulsating trans-glottal air flow: for “breathy” phonation, the spectrum exhibits a considerably larger amplitude of the fundamental frequency (first partial: H1, F0) compared with the second partial (H2) - and for “pressed” phonation, a relatively greater presence of the second harmonic.8
Results from earlier studies9 on the differences between modal and falsetto registers as detected through flow glottograms and sub-glottal air pressure relationships showed higher values for sub-glottal breath pressure in the modal register as compared to falsetto. In addition, for sound samples of the same approximate pitch and volume, higher pulse amplitudes and a shorter closed phase of the glottis were observed for falsetto, as well as increased adduction of the vocal folds and a relatively lesser use of breath for the modal register.
7 Colton 1972, Askenfelt et al. 1980, Roubeau 1987. 8 Brickley, 1982; Stevens et al., 1995. 9 Södersten, 1994; Högset, 2001.
3

This study aims to describe physiological and acoustic characteristics of phonation in the vocal function of voce faringea, and to compare these results with those found for the modal register and falsetto. Towards this aim, a flow glottogram, and electro-glottogram and an LTAS were employed for each vocal function. To supplement this, sub-glottal pressure was measured and an analysis was made of the formant structure. In this way, I sought particularly to establish whether differences observed in vocal timbre between falsetto and voce faringea could be confirmed through measurable data.
For the purposes of this study, “falsetto” will be termed a usage of the falsetto register appropriate in classical singing. Herbst also described this form of falsetto - as opposed to non-adductive (abductive), “naïve” falsetto - as countertenor falsetto or adducted falsetto. He attributes the difference between this falsetto and “collapsed” falsetto10 to the adduction of the posterior-ligament and medial membranous portions of the vocal folds (i.e., their membranous medialisation) in adducted falsetto. Through these adductive forces, a “surface bulging” - thickening of the vocal folds’ surface - occurs, and therefore also a stronger mucosal wave as well as a longer period of vocal fold contact than in “abducted” falsetto.11
The experimental subject was a professional opera singer and voice pedagogue with 16 years’ experience as tenor and countertenor (the author of this study). Through experimentation with his own voice, the author had developed a vocal technique that enabled him to alter the timbre of his countertenor falsetto in such a way that it acquired a modal character. This technique is based on physiological and functional modifications of the voice source created by the vocal folds and the resonance apparatus in the vocal tract. The timbre of the resulting vocal function - to be termed here voce faringea - sounds, through this modification, more similar to his tenor voice than to the falsetto he employs as a countertenor. Through this mode of phonation, the singer can achieve a blend of timbre and strength between modal and falsetto registers - as was demanded in various vocal pedagogy manuals from the 18th and 19th centuries.
As regards phonation in the voce faringea, the author describes an intentional and subjectively observed increase in glottal adduction, particularly in the posterior area of the glottis, as well as an increased medial tension in the membranous portion of the vocal folds. As compared to in falsetto, he also reports a subjectively observed thickening of the vertical areas of vocal fold contact, indicating increased TA activity. According to the author’s study, the development from falsetto to voce faringea is initiated through an increase in adductive strength - which Herbst also deemed an important factor in his distinction between “naïve” and countertenor falsetto. A decisive factor in the transformation of falsetto into voce faringea is the level of adduction, as well as a subtly altered relationship between CT and TA activity. As
10 See Hussler and Rodd-Marling 1965, p. 88. 11 Herbst, 2008.
4

regards breath and breathing, the author reports that his tendency to inhale is increased for phonation in voce faringea. Differences in resonance (as compared to countertenor falsetto) were to be found in the forming of an aryepiglottal sphincter, through increased proximity of the epiglottis and arytenoid cartilage in the upper area of the vestibulum laryngis, as well as a narrowing he reported in certain sections of the vocal tract - for instance, lateral contractions of the laryngeal apparatus and upper pharynx, and increased proximity between the tongue and a lowered velum.
Method Sound samples were recorded by the author in the modal, falsetto and voce faringea registers at a studio of the Department of Speech, Music and Hearing at the Royal Institute of Technology in Stockholm, together with Professor Dr. Johan Sundberg. 28 bars from the aria “Verdi prati”, from Händel’s opera Alcina, were sung in each register, in mid-range keys12, at similar volume, both on the syllable “pae” and in a version with the original text.
During the closed phase of the lips when the consonant “p” is articulated, the sub-glottal pressure typically corresponds to the intra-oral pressure. This means that measuring the intra-oral air pressure during phonation of the syllable “pae” offers a non-invasive possibility for indirectly measuring the sub-glottal pressure. The values measured for intra-oral pressure will hereafter be described as sub-glottal pressure (Psub). To measure this pressure during the recording, a thin plastic tube was held in the right corner of the singer’s mouth, which was connected to a pressure-transducer with a manometer. The data from this measurement were digitalized, together with the signals recorded via microphone and electro-glottogram, in a multi-channel audio database, and stored onto a computer in “wav” format.
As subjects for flow glottogram analysis 10 sound samples for each vocal register from the same passage of the aria were selected for inverse filtering, using SoundSwellTM Signal Workstation. Before this filtering process, frequency and bandwith of the formant up to 8 KHz were measured, with the signal adjusted so that a ripple free closed phase of the glottis could be depicted.
The following parameters were measured employing the wave glottogram with its derivative and EGG signal: sub-glottal air pressure (Psub); duration of the closed phase of the vocal folds relative to their period of vibration (Qclosed); pulse amplitude; maximum flow declination rate (MFDR); and the normalized amplitude quotient (NAQ, pulse amplitude/MFDR* fundamental frequency). The difference in volume of the two lowest partial tones (H1-H2) was calculated using a spectrum of each wave form supplied by a subroutine of the SoundSwellTM Signal Workstation.
12 Falsetto and voce faringea: C major; modal: G major. 5

Figure 2: The primary sound measurement using a flow glottogram, with attendant derivate and spectrum, supplied by the SoundSwellTM Signal Workstation. Thalèn 2010.
In addition, a long-term average spectrum (LTAS) was made, which is an efficient tool for vocal analysis. Via the LTAS, average strengths for various frequency areas of the vocal sound can be represented over a longer period of time. These reflect both the characteristics of the glottis function as well as of the vocal tract, and thus the formant structure of the sound.
Results For falsetto, the wave glottogram’s curve form is rounded, comparable to a Romanesque arch (Figure 3), whereas for the modal register it has a clear peak (Figure 5 In the voce faringea wave form, a tendency towards peaking with a basic shape of the Gothic arch can be observed (Figure 4).
Figure 3: A rounded pulse form in falsetto.
Figure 4: Pulse form with a tendency towards peaking in voce faringea.
Figure 5: Clearly peaked pulse form in the modal register.
6

A round pulse form can usually be seen during higher air flow during the closed phase of the vocal folds. A rounded wave form in the flow glottogram is typical for falsetto, as a peaked curve is for the modal register. Thickened vocal folds in the modal register (Figure 6, above) indicate a clear phase lag between the lower and upper layers of the vocal folds; the movement of closure on the part of the lower layers interrupt the opening movement on the part of the upper layers. This results in a peaked wave form. Thin (i.e., not thickened) vocal folds (Figure 6, below) vibrate with more or less negligible phase lag. Therefore, the resulting curve takes a round form. According to Högset and Sundberg, a triangular wave form generates a less dominant fundamental frequency F0 than a rounded wave form.13
Results from the wave glottogram show higher average pulse amplitude values for falsetto than for voce faringea (Figure 7). Typically, high pulse amplitude is associated with a shorter closed phase of the glottis and thus a smaller value for Qclosed.
13 Högset and Sundberg, 2001.
Figure 7: Pulse amplitude in voce faringea and falsetto..
Figure 8: Vocal fold closure quotient for voce faringea and falsetto.
1
1,2
1,4
1,6
1,8
2
2,2
2,4
2,6
2,8
3
1 1,5 2 2,5 3
Fals
ett
voce faringea
Puls amplitude
0
0,1
0,2
0,3
0,4
0,5
0 0,1 0,2 0,3 0,4 0,5
Fals
ett
voce faringea
Qclosed
Figure 6: Schematic depiction of the effect of vocal fold thickening on the curve form of the glottogram. (Högset and Sundberg, 2001)
7

Qclosed values measured for the sound samples in modal register ranged from .28 to .52. The phrase in question was sung in midrange, relatively gentle tone color and at medium volume. The values for Qclosed normally rise with fundamental frequency and increased sub-glottal pressure. For falsetto, values were recorded between .22 and .41, and for voce faringea between .22 and .49. On the average, higher Qclosed values were shown for voce faringea than for falsetto (Figure 8).
The maximum flow declination rate (MFDR) is determined through the vocal folds’ speed of closure, and is a significant parameter for the voice’s strength. A higher MFDR value reflects high vocal intensity and can be recognized in a sharply descending curve of the flow glottogram signal; a lower MFDR value can be recognized through a flatter curve shape for the closed phase. Values measured were highest for the modal register (between 1128.83 and 2307.09), moderate for voce faringea (between 994.74 and 2192.93) and less in falsetto (between 928.56 and 2033.40). Figure 9 shows the higher average MFDR values for voce faringea compared to falsetto.
Another important parameter for glottis function is the adductive strength of the vocal folds, which can be represented through the normalized amplitude quotient (NAQ: pulse amplitude/MFDR* fundamental frequency). A lower NAQ - i.e., stronger adduction of the vocal folds - is typically higher for phonation in the modal register, with a higher NAQ for phonation in falsetto. A decrease in NAQ values, along with an increase in adductive energy, can be expected when pitch rises. In the modal register, values between .104 and .082 were recorded, in voce faringea between .189 and .104, and in falsetto between .187 and .135. Figure 10 demonstrates the higher average NAQ values for falsetto compared to those for voce faringea.
Figure 1 MFDR (maximum flow declination rate) in voce faringea and falsetto.
Figure 10: NAQ (normalized amplitude quotient: pulse amplitude/MFDR* fundamental frequency) in voce faringea and falsetto.
0
500
1000
1500
2000
2500
0 500 1000 1500 2000 2500
Fals
etto
voce faringea
MFDR
0
0,02
0,04
0,06
0,08
0,1
0,12
0,14
0,16
0,18
0,2
0 0,02 0,04 0,06 0,08 0,1 0,12 0,14 0,16 0,18 0,2
Fals
etto
voce faringea
NAQ
8
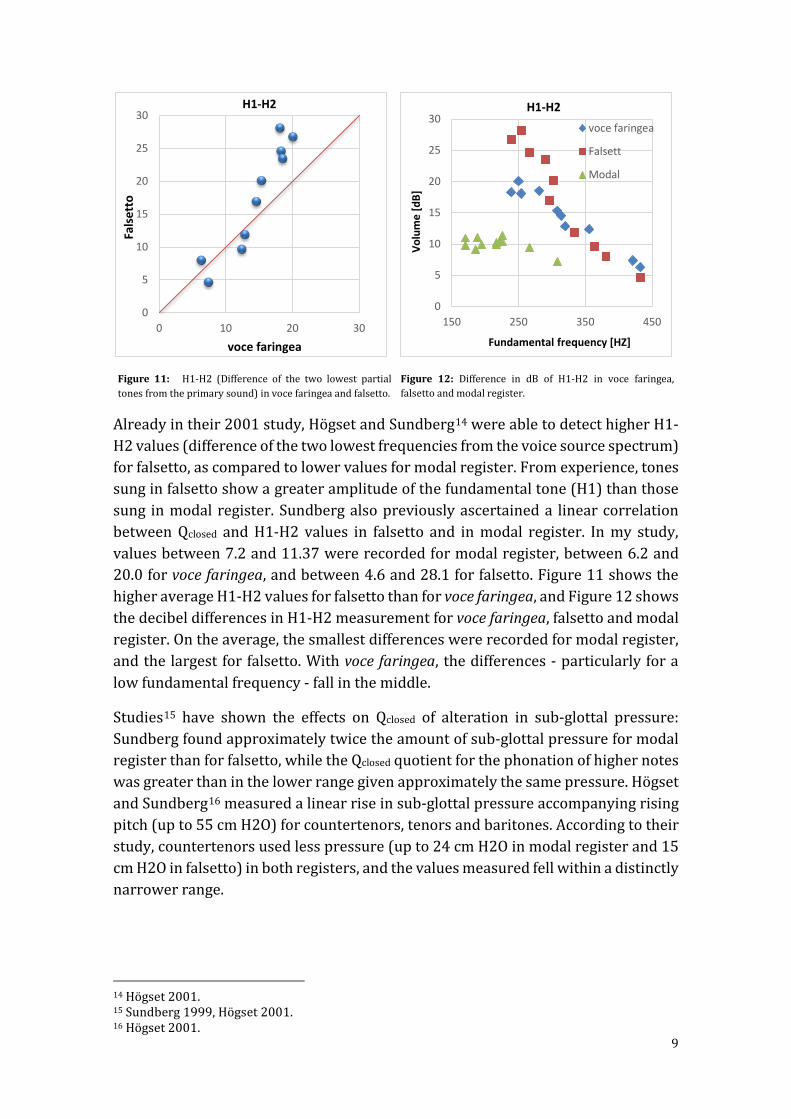
Already in their 2001 study, Högset and Sundberg14 were able to detect higher H1-H2 values (difference of the two lowest frequencies from the voice source spectrum) for falsetto, as compared to lower values for modal register. From experience, tones sung in falsetto show a greater amplitude of the fundamental tone (H1) than those sung in modal register. Sundberg also previously ascertained a linear correlation between Qclosed and H1-H2 values in falsetto and in modal register. In my study, values between 7.2 and 11.37 were recorded for modal register, between 6.2 and 20.0 for voce faringea, and between 4.6 and 28.1 for falsetto. Figure 11 shows the higher average H1-H2 values for falsetto than for voce faringea, and Figure 12 shows the decibel differences in H1-H2 measurement for voce faringea, falsetto and modal register. On the average, the smallest differences were recorded for modal register, and the largest for falsetto. With voce faringea, the differences - particularly for a low fundamental frequency - fall in the middle.
Studies15 have shown the effects on Qclosed of alteration in sub-glottal pressure: Sundberg found approximately twice the amount of sub-glottal pressure for modal register than for falsetto, while the Qclosed quotient for the phonation of higher notes was greater than in the lower range given approximately the same pressure. Högset and Sundberg16 measured a linear rise in sub-glottal pressure accompanying rising pitch (up to 55 cm H2O) for countertenors, tenors and baritones. According to their study, countertenors used less pressure (up to 24 cm H2O in modal register and 15 cm H2O in falsetto) in both registers, and the values measured fell within a distinctly narrower range.
14 Högset 2001. 15 Sundberg 1999, Högset 2001. 16 Högset 2001.
Figure 11: H1-H2 (Difference of the two lowest partial tones from the primary sound) in voce faringea and falsetto.
Figure 12: Difference in dB of H1-H2 in voce faringea, falsetto and modal register.
0
5
10
15
20
25
30
0 10 20 30
Fals
etto
voce faringea
H1-H2
0
5
10
15
20
25
30
150 250 350 450
Volu
me
[dB]
Fundamental frequency [HZ]
voce faringea
Falsett
Modal
H1-H2
9
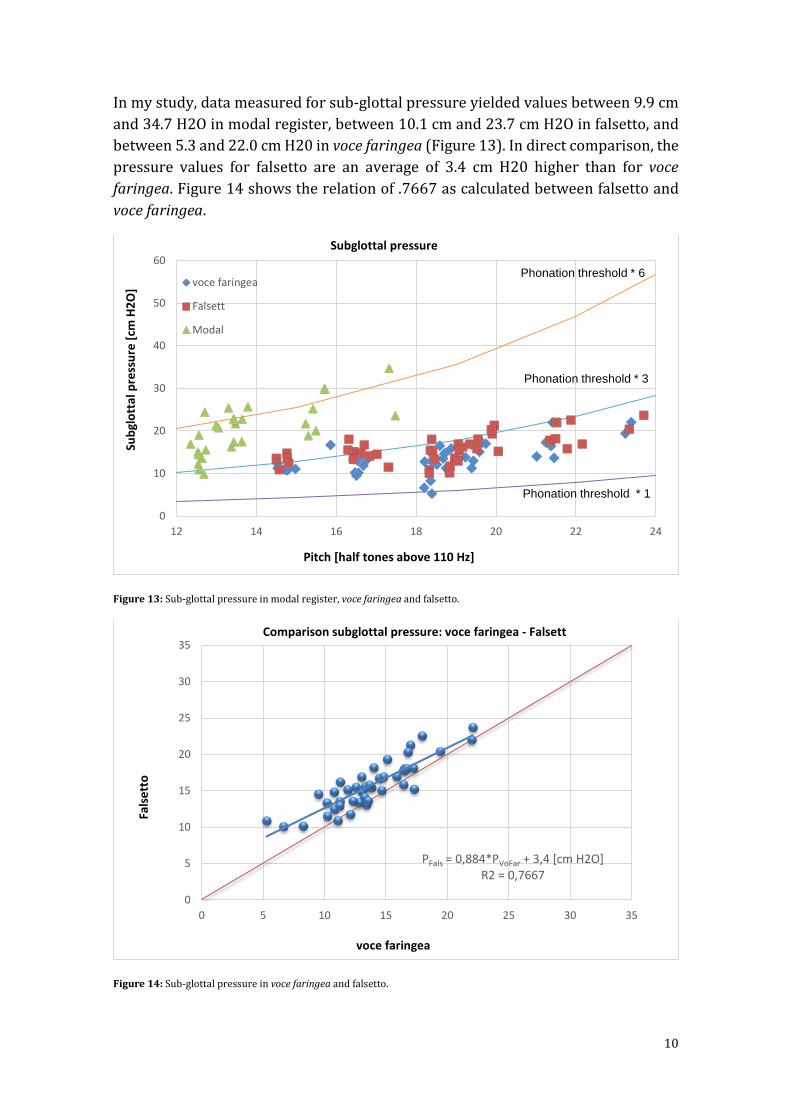
In my study, data measured for sub-glottal pressure yielded values between 9.9 cm and 34.7 H2O in modal register, between 10.1 cm and 23.7 cm H2O in falsetto, and between 5.3 and 22.0 cm H20 in voce faringea (Figure 13). In direct comparison, the pressure values for falsetto are an average of 3.4 cm H20 higher than for voce faringea. Figure 14 shows the relation of .7667 as calculated between falsetto and voce faringea.
Figure 13: Sub-glottal pressure in modal register, voce faringea and falsetto.
Figure 14: Sub-glottal pressure in voce faringea and falsetto.
0
10
20
30
40
50
60
12 14 16 18 20 22 24
Subg
lott
al p
ress
ure
[cm
H2O
]
Pitch [half tones above 110 Hz]
Subglottal pressure
voce faringea
Falsett
Modal
Phonation threshold * 6
Phonation threshold * 3
Phonation threshold * 1
PFals = 0,884*PVoFar + 3,4 [cm H2O]R2 = 0,7667
0
5
10
15
20
25
30
35
0 5 10 15 20 25 30 35
Fals
etto
voce faringea
Comparison subglottal pressure: voce faringea - Falsett
10
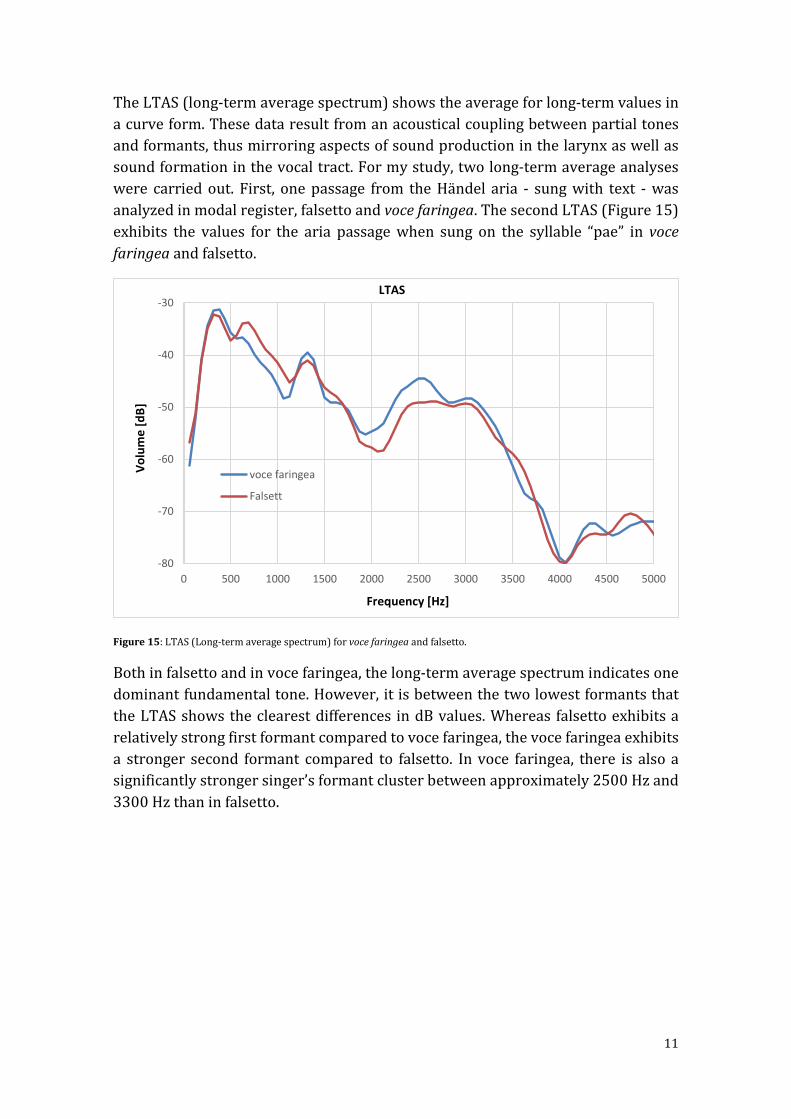
The LTAS (long-term average spectrum) shows the average for long-term values in a curve form. These data result from an acoustical coupling between partial tones and formants, thus mirroring aspects of sound production in the larynx as well as sound formation in the vocal tract. For my study, two long-term average analyses were carried out. First, one passage from the Händel aria - sung with text - was analyzed in modal register, falsetto and voce faringea. The second LTAS (Figure 15) exhibits the values for the aria passage when sung on the syllable “pae” in voce faringea and falsetto.
Figure 15: LTAS (Long-term average spectrum) for voce faringea and falsetto.
Both in falsetto and in voce faringea, the long-term average spectrum indicates one dominant fundamental tone. However, it is between the two lowest formants that the LTAS shows the clearest differences in dB values. Whereas falsetto exhibits a relatively strong first formant compared to voce faringea, the voce faringea exhibits a stronger second formant compared to falsetto. In voce faringea, there is also a significantly stronger singer’s formant cluster between approximately 2500 Hz and 3300 Hz than in falsetto.
-80
-70
-60
-50
-40
-30
0 500 1000 1500 2000 2500 3000 3500 4000 4500 5000
Volu
me
[dB]
Frequency [Hz]
LTAS
voce faringea
Falsett
11
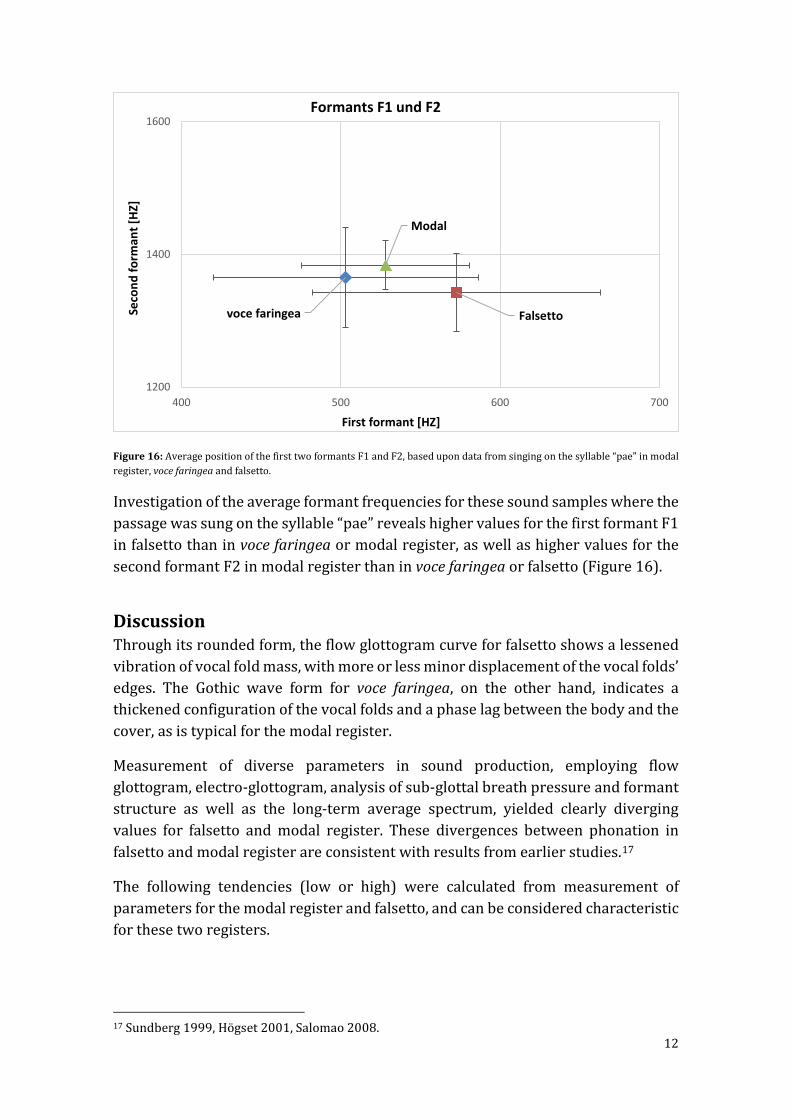
Figure 16: Average position of the first two formants F1 and F2, based upon data from singing on the syllable “pae” in modal register, voce faringea and falsetto.
Investigation of the average formant frequencies for these sound samples where the passage was sung on the syllable “pae” reveals higher values for the first formant F1 in falsetto than in voce faringea or modal register, as well as higher values for the second formant F2 in modal register than in voce faringea or falsetto (Figure 16).
Discussion Through its rounded form, the flow glottogram curve for falsetto shows a lessened vibration of vocal fold mass, with more or less minor displacement of the vocal folds’ edges. The Gothic wave form for voce faringea, on the other hand, indicates a thickened configuration of the vocal folds and a phase lag between the body and the cover, as is typical for the modal register.
Measurement of diverse parameters in sound production, employing flow glottogram, electro-glottogram, analysis of sub-glottal breath pressure and formant structure as well as the long-term average spectrum, yielded clearly diverging values for falsetto and modal register. These divergences between phonation in falsetto and modal register are consistent with results from earlier studies.17
The following tendencies (low or high) were calculated from measurement of parameters for the modal register and falsetto, and can be considered characteristic for these two registers.
17 Sundberg 1999, Högset 2001, Salomao 2008.
Modal
Falsettovoce faringea
1200
1400
1600
400 500 600 700
Seco
nd fo
rman
t [HZ
]
First formant [HZ]
Formants F1 und F2
12
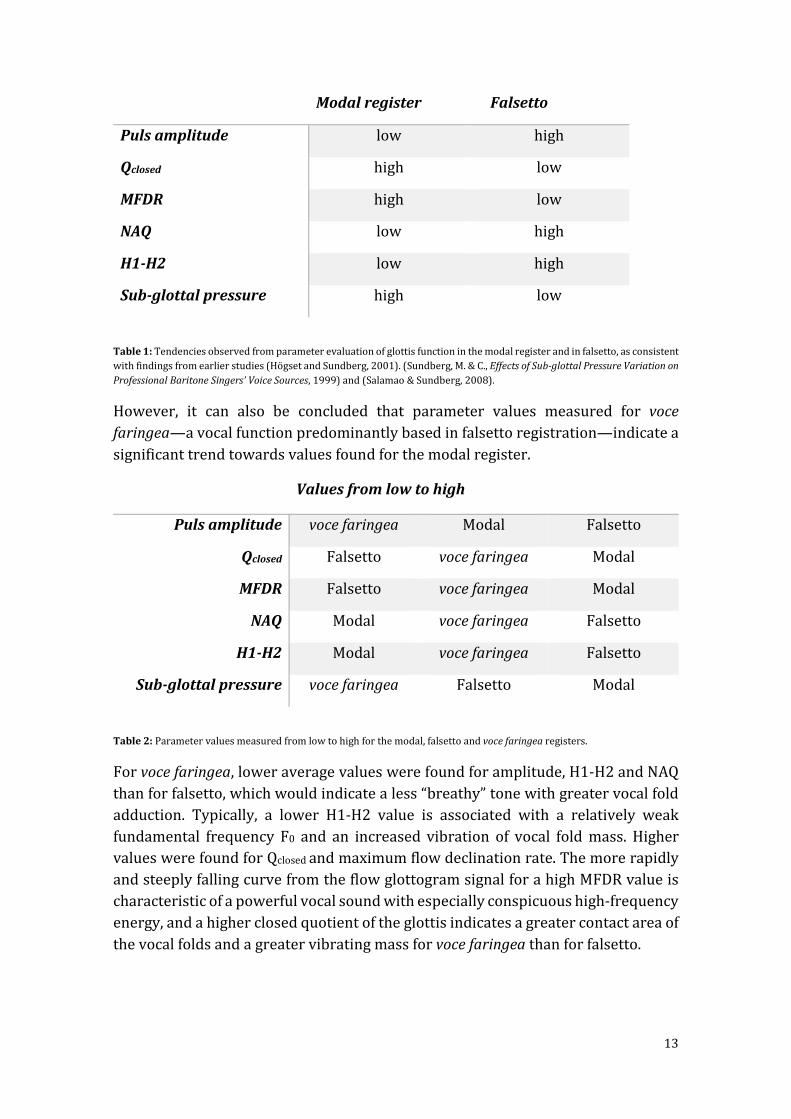
Modal register Falsetto
Puls amplitude low high
Qclosed high low
MFDR high low
NAQ low high
H1-H2 low high
Sub-glottal pressure high low
Table 1: Tendencies observed from parameter evaluation of glottis function in the modal register and in falsetto, as consistent with findings from earlier studies (Högset and Sundberg, 2001). (Sundberg, M. & C., Effects of Sub-glottal Pressure Variation on Professional Baritone Singers’ Voice Sources, 1999) and (Salamao & Sundberg, 2008).
However, it can also be concluded that parameter values measured for voce faringea—a vocal function predominantly based in falsetto registration—indicate a significant trend towards values found for the modal register.
Values from low to high
Puls amplitude voce faringea Modal Falsetto
Qclosed Falsetto voce faringea Modal
MFDR Falsetto voce faringea Modal
NAQ Modal voce faringea Falsetto
H1-H2 Modal voce faringea Falsetto
Sub-glottal pressure voce faringea Falsetto Modal
Table 2: Parameter values measured from low to high for the modal, falsetto and voce faringea registers.
For voce faringea, lower average values were found for amplitude, H1-H2 and NAQ than for falsetto, which would indicate a less “breathy” tone with greater vocal fold adduction. Typically, a lower H1-H2 value is associated with a relatively weak fundamental frequency F0 and an increased vibration of vocal fold mass. Higher values were found for Qclosed and maximum flow declination rate. The more rapidly and steeply falling curve from the flow glottogram signal for a high MFDR value is characteristic of a powerful vocal sound with especially conspicuous high-frequency energy, and a higher closed quotient of the glottis indicates a greater contact area of the vocal folds and a greater vibrating mass for voce faringea than for falsetto.
13

Values measured for sub-glottal pressure in falsetto and modal register correlate with those measured in other studies.18 Typically, sub-glottal air pressure is twice as strong in modal register as in falsetto. A correlation has also been documented between rising Qclosed values and sub-glottal air pressure.19 Surprisingly, even lower average air pressure was found for voce faringea than for falsetto, in spite of higher Qclosed values. One explanation for this could be the increased strength of inhalation on the part of breathing musculature (appogio in petto, la forza natural del petto) accompanied by increased adduction of the vocal folds. For countertenors in falsetto register, Högset and Sundberg document significantly lower sub-glottal pressure20, and speculate that this could be explained by the particular technique employed by countertenors. In order to prolong the contact period between the vocal folds - as when singing in modal register - in spite of lower breath pressure, it seems necessary in voce faringea to increase the adduction of the vocal folds.
The long-term average spectrum shows a relatively strong second formant in voce faringea as compared to falsetto. However, in voce faringea the decibel level of the first formant F1 is weaker than in falsetto. In voce faringea, the singer’s formant cluster is considerably more developed in the general area between 2.5 and 3.5 kHz. In contrast to male voices, the singer’s formant cluster for female voices is less significant. A predominant registration strategy sopranos and mezzo-sopranos in their middle and upper ranges is to set the first formant F1 to the fundamental frequency H1. This results in the so-called “whoop”21 or “hoot”22 timbre. This strategy is also employed by countertenors for their high notes in the falsetto register.
In 2013, Titze23 reported that the wave form of the EGG24 is related to the cross-section of the vocal folds, i.e., a form of the EGG-wave should approximate the vocal folds’ cross-section. Figures 20, 21 and 22 show models of the vocal folds for the phonation of modal, falsetto and voce faringea registers, made on the basis of the wave form of each EGG signal. The more thickened shape of vocal fold cross-section for the modal register (Figure 20) indicates an increased activity of the m. vocalis (m. thyroarytaenoideus, TA) and phonation with greater vibratory mass in modal register than in falsetto (Figure 21). Characteristic for the modal register is the knee shape in the EGG’s wave form (Figure 17), which represents the incipient motion of opening in the upper edge of the vocal folds’ mucosa.25 In contrast to the EGG form for falsetto, Figure 19 shows a clearly prolonged closed phase of the vocal folds for
18 Högset 2001, Södersten et al. 1994. 19 Sundberg 1999, Högset 2001. 20 Högset 2001. 21 Bozeman, 2013, p.23. 22 Miller, D.G., Resonance in Singing, Voice Building through Acoustic Feedback, 2008, p. 52. 23 Titze, 2013. 24 In contrast to the wave form of the flow glottogram, the wave curve represents the closed phase and the wave trough the opened phase of the glottis. 25 The wave motion of the mucosal wave begins first in the lowest area oft he mucous membranes, then proceeding upwards.
14

voce faringea, also indicating a certain similarity between the wave forms of voce faringea and modal register. According to Titze26, that characteristic knee shape in the wave form typically occurs in the case of conspicuous posterior glottal adduction and through the thickening of the vocal folds’ edges (“surface bulging”) in the modal register. The vibration pattern of the vocal folds exhibits a clear phase lag between the main body of the vocal folds and their cover, resulting in an enlargement of the vertical glottal contact area.
The form of the EGG signal for voce faringea (Figure 19) indicates an increased posterior glottal adduction (adduction of the ligamental areas and medialization of the membranous areas of the vocal folds) during phonation, as well as a relatively large vibrating mass due to increased vocalis muscle activity. The knee shape shown by the EGG signal for the modal register and voce faringea is, not unsurprisingly, absent in the curve form of the falsetto EGG.
The data from my study, derived from analysis of sound samples for the vocal registers modal, falsetto and voce faringea, confirmed my assumption that the parameter values for voce faringea would exhibit a significant tendency towards those for the modal register. We may also ask whether on the basis of these data, conclusions could be drawn as to perceptions of the voce faringea - whether, for example, we can conclude that the vocal color of voce faringea is clearly distinct from falsetto and tends towards the color of the modal register.
In her 2008 study, Salomao27 documents clear correlations between certain parameter values of the glottis function in falsetto and in modal register on the one hand, and on the other hand assessments of a jury of experts who attempted to
26 Titze I. R., 1989. Titze, 1990. 27 Salomao, 2008.
Figure 17: Egg wave form modal.
Figure 18: EGG wave form falsetto.
Figure 19: EGG wave form voce faringea.
Figure 20: Cross-section of the vocal folds in modal register, from the EGG wave form.
Figure 21: Cross-section of the vocal folds in falsetto, from the EGG wave form.
Figure 22: Cross-section of the vocal folds in voce faringea, from the EGG wave form.
15
distinguish between 52 sound samples sung by 13 choral singers as to whether they were in modal or falsetto register. Here, they found the greatest correlation between parameter values and voices for the modal register with high Qclosed and MFDR values, and low H1-H2 and pulse amplitude values.
The values measured in my study that are particularly significant regarding the perceptive distinguishing between modal register and falsetto (high Qclosed and MFDR, low H1-H2) support the assumption that the vocal timbre of the voce faringea exhibits a clearly more modal character than does falsetto.
Summary Sound samples were sung by a test person (the author, a professional tenor and countertenor) in the modal, falsetto, and voce faringea registers and then analyzed for the purposes of this study. The following methods were employed:
1. A flow glottogram, for investigating trans-glottal air flow (corresponding to the voice source generated by the vocal folds).
2. An electro-glottogram, for measuring alterations in electrical impedance in the larynx, which have a relationship to the contact phase and opened phase of the glottis.
3. The measuring of sub-glottal breath pressure, with the help of a manometer. 4. A long-term average spectrum (LTAS), for determining the average
concentration of acoustical energy in the spectrum over a given time period. 5. An analysis of the sound sample’s formant structure.
Through the results from the flow glottogram, electro-glottogram and measuring the sub-glottal air pressure, values could be determined for such diverse parameters of glottis function such as Qclosed, pulse amplitude, NAQ, MFDR, H1-H2 and Psub. Analysis of data thus measured yielded the expected results for the modal register and falsetto, consistent with earlier studies. On the whole, the parameter values for voce faringea exhibit a clear trend towards the modal register: compared to falsetto, a smaller pulse amplitude, lower H1-H2 and NAQ values, higher Qclosed and higher MFDR values were measured for voce faringea. The sub-glottal pressure had the lowest average value for voce faringea for all three categories of phonation.
The signal form of the flow glottogram for voce faringea exhibits a peaked upward shape. This indicates a clear phase lag between the upper and lower layers of the vocal folds which is typical for increased mass vibration in the modal register.
Long-term average spectra for the three vocal registers also showed similarities in formant structure between voce faringea and modal register: a higher and stronger F2, and a lower, weaker F1. Finally, the wave forms from the flow glottogram and electro-glottogram also indicate significant similarities between voce faringea and the modal register.
16
With consideration also given to Salomao’s findings regarding the correlation between parameter values from the flow glottogram and EGG and perceptions of modal and falsetto singing, we can conclude from the values measured in this study that voce faringea indeed has a modal sound character.
Acknowledgements and Thanks The experimental data for this study were obtained during the author’s research sojourn at the Royal Institute of Technology in Stockholm in April of 2012. Special thanks are due to Professor Dr. Johan Sundberg for his leadership of the recording process and deriving the data, as well as his eminently competent leadership and generous support in interpretation those data. My sincere thanks also to the leadership of the Doctor artium program at the University for Music and performing Arts Graz for their support of this study.
References Askenfeld, A., Gauffin, J., Sundberg, J., & Kitzing, P. (1980). A comparison of contact
microphone and electroglottograph for the measurement of vocal fundamental fequency. In: Journal of Speech, Language, and Hearing Research, p 23: 258-273.
Bozeman, K. (2013). Practical vocal acoustics, pedagogic applications for teachers and singers. Hillsdale, NY: Pendragon Press.
Brickley, C. A. (1982). Acoustic Analysis and Perception of Breathy Vowls. In: Speech Communication Group Working Papers, MA: Research aboratory of Electronics, MIT2, p 71-81.
Colton, R. (1972). Spectral characteristics of the modal and the falsetto registers. In: Folia Phoniatrica, p 24: 337-344.
Herbert-Caesari, E. (1951). The Voice of the Mind. London: Robert Hale Ltd.
Herbst, C., Hovard, D., & Schlömicher-Thier, J. (2008). Using Electroglottographic Real-Time Feedback to Control Posterior Glottal Adduction during Phonation. In: Journal of Voice, Vol. 24, Nr. 1, p 72-85.
Hirano, M. (1974). Morphological structure of the vocal cord as a vibrator and its variations. In: Folia Phoniatrica et Logopaedica 26, p 89-94.
Högset, C., & Sundberg, J. (2001). Voice source differences between falsetto and modal registers in counter tenors, tenors and baritones. In: Logopedics Phoniatrics Vocology Nr. 26, p 26-36.
Hussler, F., & Rodd-Marling, Y. (1965). Singen. Die physische Natur des Stimmorgans. Mainz: Schott.
17
Miller, D. G. (2008). Resonance in Singing, Voice Building through Acoustic Feedback. Princeton: Inside View Press.
Mörner, M., Fransson, N., & Fant, G. (1963). Voice register terminology and standard pitch. In: Speech Transmission Laboratory Quarterly Progress and Status Report 4, p 17-23.
Roubeau, B., Chevrie-Muller, C., & Arabia-Guidet, C. (1987). Electroglottographic study of the changes of voice registers. In: Folia Phoniatrica, Nr. 39. p 280-289.
Salomao, G., & Sundberg, J. (Juli 2008). Relation between perceived voice register and flow glottogramm parameters in males. In: Journal of the Acoustical Society of America, p 546-551.
Södersten, M. & Hanson, H. (1993). Glottal aiflow and subglottal pressure in the falsetto and modal register of counter tenor singers. In: A. I. Friberg, Proceedings of SMAC 93 (Stockholm Music Acoustic Conference 1993), Publication Nr. 79. Stockholm: Royal Swedish Academy of Music. p 249-253
Stevens, K. & Hanson, H. (1995). Classification of glottal vibration from acoustic mesurements. In: Fujimora O, Hirano M. (Hrsg.), Vocal Fold Physiology: Voice Quality Control. San Diego, CA: Singular Publishing Group. p 147-170.
Sundberg, J., Andersson, M. & Hultquist, C. (1999). Effects of subglottal pressure variation on professional baritone singers' voice sources. In: Journal of the Acoustical Society of America, Nr. 105. p 1965-1971.
Sundberg, J. (1997). Die Wissenschaft von der Singstimme. (F. Papst, & D. Mürbe, Übers.) Bonn: Orpheus-Verlag GmbH.
Thalén, M., & Sundberg, J. (2009). What is "Twang"? In: Journal of Voice, Vol 24, Nr. 6, p 654-660.
Titze, I. (1994). Principles of Voice Production. Englewood Cliffs, NJ: Prentice Hall.
Titze, I. R. (2000). Principles of Voice Production. Denver: National Center for Voice and Speech.
Titze, I. R. (1989). A four parameter model of the glottis and vocal fold contact area. In: Speech Communication, 8, p 191-201.
Titze, I. R. (1 1990). Interpretation of the electroglottographic signal. In: Journal of Voice, Volume 4, Issue 1, p 1-9.
18

Titze, I. (2013). How the Vocal Tract Affects Voice Registration. Presentation at the Pan European Voice Conference 2013 in Prague.
van den Berg, J.-W. (Dezember 1963). Vocal ligaments versus registers. In: Journal of the National Association of Teachers of Singing, p 16-21.
19