parameters’ identification of perzyna and chaboche
TRANSCRIPT

ENGINEERING TRANSACTIONS • Engng. Trans. • 62, 3, 291–305, 2014Polish Academy of Sciences • Institute of Fundamental Technological Research (IPPT PAN)
National Engineering School of Metz (ENIM) • Poznan University of Technology
Parameters’ Identification of Perzyna and Chaboche
Viscoplastic Models for Aluminum Alloy
at Temperature of 120◦C
Paweł KŁOSOWSKI, Anna MLECZEK
Gdańsk University of Technology, Faculty of Civil and Environmental EngineeringDepartment of Structural Mechanics and Bridge Structures
Narutowicza 11/12, 80–233 Gdańsk, Polande-mail: {klosow, annmlecz}@pg.gda.pl
The main purpose of this paper is the parameters identification of the Perzyna and theChaboche models for the aluminum alloy at elevated temperature. The additional purpose iscomparison of the results for these viscoplastic models. The results have been verified by thenumerical simulation of the laboratory tests. The material parameters have been calculated onthe basis of the uniaxial tension test. The determination of the Perzyna model’s parameters hasbeen made on the basis of the ideas presented in papers of Perzyna [14–16, 18]. Then the pa-rameters identification of the Chaboche model has been performed using concept presented in[2, 5, 6]. The elastic and inelastic properties have been estimated using the non-linear approxi-mation by the least-squares method in Marquardt-Levenberg variant [12, 13]. The correctnessassessment of the performed approximation has been verified by correlation and determinationcoefficients.
Key words: identification, viscoplasticity, Perzyna model, Chaboche model, aluminum, ele-vated temperature, constant strain-rate tests.
1. Introduction
The viscoplastic constitutive laws defined for small strains can be dividedinto two groups with respect to the mathematical formulation. The difference be-tween both groups lays in the concept of the creep surface. The first of them, doesnot use the concept of the creep surface. To this group of models belong: Bod-ner – Partom, Miller, Krempl, Thanimur, Korhonen, Krieg and Walker models.Therefore, a more complicated mathematical formulation is required to definethe transition from the linear elastic range to the inelastic range of deformation.This can be simplified by application of the isotropic internal stress, describingviscoplastic creep surface, which determines the transition between the linear

292 P. KŁOSOWSKI, A. MLECZEK
part and nonlinear part of the strain-stress function. On the other hand it isimpossible to take into account the accumulated creep for stresses in the re-gion of the quasi-linear strain-stress function in models. The second group oflaws consists of: Perzyna, Chaboche, Aubertin, Lehmann – Imataniand Freed –Virrilli models [9].The first modern model describing the evolution of viscous effects was pro-
posed by Perzyna in the 1960’s [17]. Due to small number of parameters andwith relative simple procedure of identification the Perzyna model is still oftenused for material description in many engineering applications [1]. The exten-sion of the Perzyna law leads to the Chaboche model. The simplest variantof this model is described by seven parameters. The viscoplastic equations ofthe Chaboche model have been developed and modified many times. The severalvariants of this model with their practical engineering applications are presentedin [2, 5, 22].
2. General formulation of Perzyna model and Chaboche model
The viscoplastic constitutive law of Perzyna is based on the condition ofperpendicularity of the plastic strain vector increment to the neutral surface(creep surface) in plastic conditions [20]. This is the conclusion of the Druckerpostulate. The general formulation of the Perzyna model can be expressed by:
(2.1) EIij =
3
2γ(T ) 〈Φ(F )〉
S′
ij
J(S′),
where EIij are components of the inelastic strain rate tensor, γ(T ) is viscous co-
efficient dependent on temperature γ ∈ (0,∞), S′
ij are components of the stressdeviator, J(S′) is the second invariant of the stress deviator S′
ij , Φ(F ) is optionalnon-linear function of the viscoplastic potential F , which can determined by theformula:
(2.2) Φ(F ) =
⟨J(S′ij)
R− 1
⟩n
,
or
(2.3) Φ(F ) =
⟨exp
(J(S′ij)
R− 1
)− 1
⟩,
where R is temperature dependent hardening parameter (for materials withouthardening R = k), where k is initial plasticity limit for zero value of the strainrate, n is the viscous coefficient. It is possible to meet more complex forms ofthe function Φ [17] used by the Author for high strain rates 0÷ 104 s−1 andassuming γ = 1.
PARAMETERS’ IDENTIFICATION OF PERZYNA AND CHABOCHE. . . 293
The Chaboche model can be treated as the extension of the Perzyna law.It also assumes existence of the viscoplastic potential [5, 6]. The general formu-lation of the Chaboche model can be expressed as:
(2.4) EIij =
3
2p
S′
ij −X ′
ij
J(S′rs −X ′rs),
where p is the positive scalar function so-called accumulated inelastic strain ratedetermined by the formula:
(2.5) p = γ
⟨J(S′ij −X ′ij
)−R− k
K
⟩n
,
where K is the viscosity parameter, X ′ij are components of the internal stressdeviator associated with the kinematic hardening, γ = 1 [s−1] [9].
3. Experiment description
The tests have been performed on the specimens cut out from a 3 mm thickaluminum sheet. The width of each of the specimens is b = 24 mm, while the ac-tive length (the distance between the grips of the strength machine) l = 70 mm.The tests have been performed on a strength machine Zwick/Roell Z400 with themechanical extensometer (active length l0 = 30 mm) and a thermal chamber.Due to the fact that viscoplastic phenomena in metals manifests particularly atelevated temperature it has been decided that the tests would be carried outat temperature of 120◦C. The experiments have been conducted for five strainrates: 10−4, 5 · 10−4, 10−3, 5 · 10−3, 10−2 s−1. For each strain rate at least threetests have been performed. In each tests about 2000 sets of time, displacementand force values have been recorded using a computer.
4. Identification of parameters
4.1. Identification of the elastic properties
The linear range for each test has been estimated on the basis of the stress-strain graphs. Next, the elasticity modulus E has been calculated. Generally,the stress-strain function for the tested specimens is linear for the strain rangeof between about 0.0005 to 0.002. This strain range corresponds to the stressrange of approximately from 30 to 90 MPa (Fig. 1).The value Young’s modulus E in each test has been determined by per-
forming a linear approximation in the range specified above. The final values ofthe elasticity modulus obtained at elevated temperature (120◦C) are shown inTable 1.

294 P. KŁOSOWSKI, A. MLECZEK
Fig. 1. Identification of an elasticity modulus E.
Table 1. The values of the Young’s modulus.
Referencestrain rate[s−1]
Values of Young’smodulus[GPa]
Average valuesof Young’s modulus
[GPa]
Values of standarddeviationσy [GPa]
Values of coefficientof variation
s [%]
35.5
10−4 39.3 38.1 1.840 4.8
39.5
38.8
5·10−4 46.0 41.2 3.394 8.2
38.8
41.3
10−3 47.9 44.1 2.774 6.3
43.2
56.1
5·10−3 59.7 56.5 2.428 4.3
53.8
62.9
10−2 53.6 57.5 3.955 6.9
55.9
While analyzing this table, it has been noted that at temperature of 120◦Cthe values of the elasticity modulus increase with the strain rate increase. Thisis why the average value of the Young’s modulus has been calculated for eachstrain rate separately.

PARAMETERS’ IDENTIFICATION OF PERZYNA AND CHABOCHE. . . 295
4.2. Identification of inelastic parameters
4.2.1. The identification process of Perzyna model. The parameters iden-tification should begin with the determination of the initial plasticity limit atzero strain rate, what gives the value of the parameter k. For this purpose thestress-strain rate graph has been created, and stress value at the plasticity limitfor each of five strain rates has been determined. For this purpose the criterionof the plasticity limit is chosen according to [19]. It is the value of stress whendifference between the experimental curve and the elastic function obtained inthe Young’s modulus identification is bigger than 0.2% (Fig. 2). It can be alsointerpreted as the value of stress when the inelastic strain is equal to εp = 0.2%.
Fig. 2. Calculating the plasticity limit on the basis of the stress-strain graph.
It has been assumed that in the initial phase of inelastic deformation theinelastic strain rate is almost equal to the total strain rate εp ≈ ε. Therefore inthis paper, when determining parameters, the values of the inelastic strain rateεp have been replaced with the values of the total strain rate ε in all equations. Atthe same time, the values of the strain rate have been calculated on the basis ofthe experimental results to validate the settings of the strength machine. It hasbeen assumed that the tests have been made at a constant strain rate. The time-strain graphs have been made in order to confirm the validity of the assumption.In the tests (especially with higher strain rates) it has been difficult to reachassumed strain rate already in the elastic range of deformation. Consequentlyduring tests the elasticity limit has been achieved with the values of the strain

296 P. KŁOSOWSKI, A. MLECZEK
rate different than it was assumed before the test. Thus, calculating k parameter,the real strain rate corresponding to the plasticity limit has been used. Theobtained results of the strain rate and of the plasticity limit for all the tests arepresented in Table 2.
Table 2. The values of the plasticity limit and strain rate.
Referencestrain rate[s−1]
Valuesof plasticitylimit[MPa]
Average valuesof the plasticity
limit[MPa]
Actual valueof strain rate[s−1]
Average valuesof strain rate[s−1]
114.850 1.078·10−4
10−4 116.300 114.909 1.838·10−4 1.606·10−4
113.578 1.901·10−4
114.185 8.830·10−4
5·10−4 116.771 115.523 8.668·10−4 9.406·10−4
115.612 1.072·10−3
116.505 1.864·10−3
10−3 118.207 116.854 1.511·10−3 1.610·10−3
115.850 1.454·10−3
118.451 5.666·10−3
5·10−3 117.715 117.395 6.346·10−3 6.724·10−3
116.018 8.161·10−3
118.013 1.452·10−2
10−2 116.819 117.747 1.226·10−2 1.259·10−2
118.409 1.100·10−2
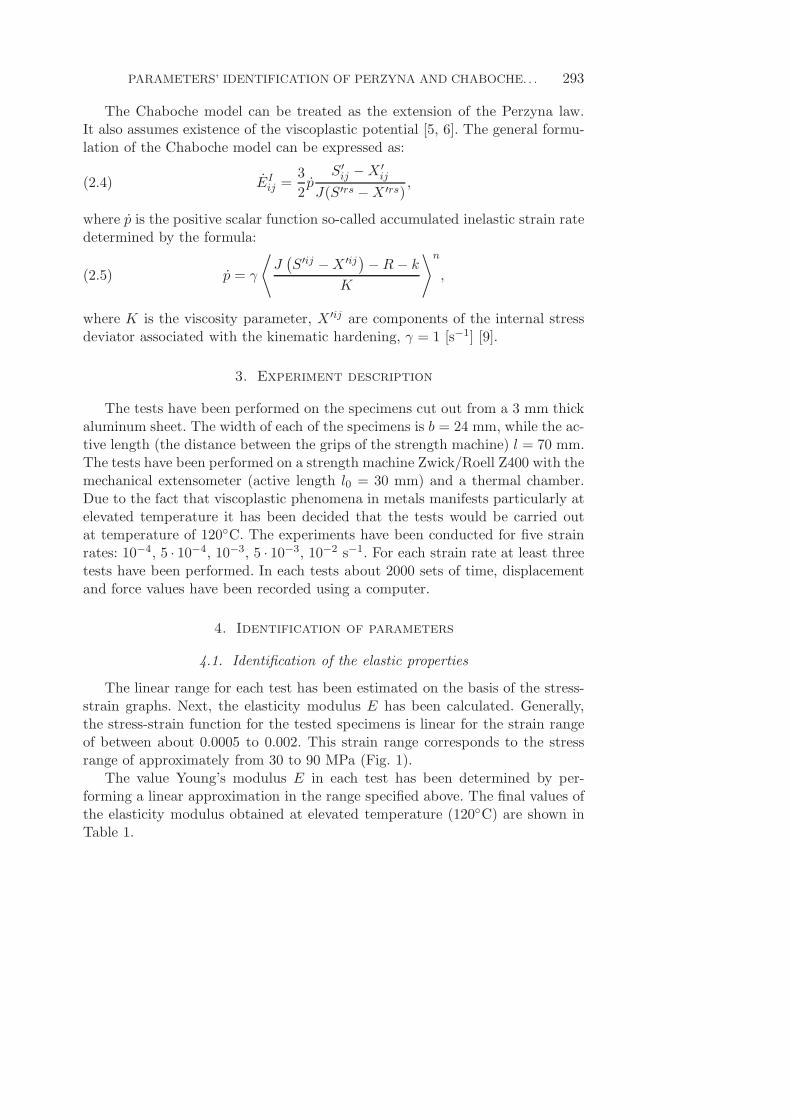
Next, the stress-strain rate graph has been made due to calculated averagevalues of the elastic limit and the average values of the strain rate shown inTable 2. This function has been approximated with the formula:
(4.1) σ = y0 + a(1− exp(−bεp)) + c(1 − exp(−dεp)),
where y0, a, b, c, d are requested coefficient of this equation. This graph withthe approximated function has been shown in Fig 3.According to this graph the value of parameter k = 114 [MPa]. This value
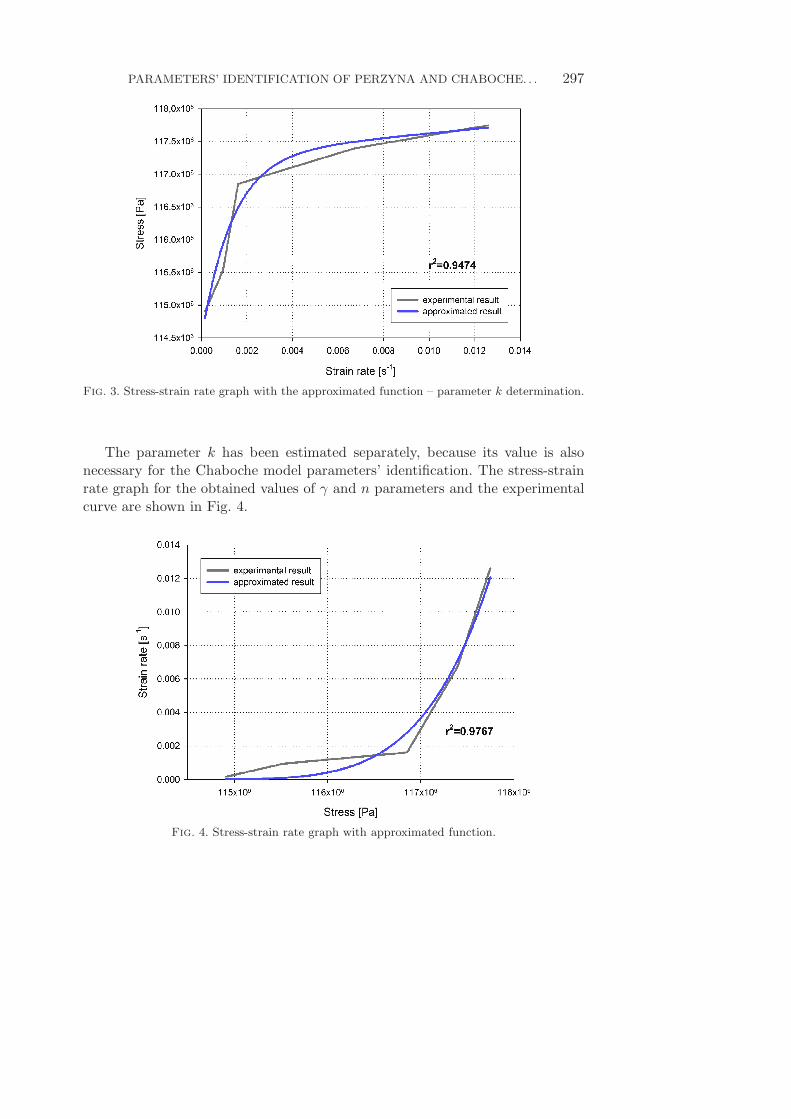
has been used for estimation of two other parameters γ and n. For the samestress-strain rate graph has been determined other parameters of the Perzynamodel have been obtained from the equation in uniaxial variant using the non-linear regression:
(4.2) εp = γ(σk− 1
)n.
PARAMETERS’ IDENTIFICATION OF PERZYNA AND CHABOCHE. . . 297
Fig. 3. Stress-strain rate graph with the approximated function – parameter k determination.
The parameter k has been estimated separately, because its value is alsonecessary for the Chaboche model parameters’ identification. The stress-strainrate graph for the obtained values of γ and n parameters and the experimentalcurve are shown in Fig. 4.
Fig. 4. Stress-strain rate graph with approximated function.

298 P. KŁOSOWSKI, A. MLECZEK
The obtained values of parameters of the Perzyna model are presented inTable 3.
Table 3. Parameters of Perzyna’s model.
Parameter Unit Values of the parameters
k MPa 114.0
n – 5.37
γ s−1 1.10·106
4.2.2. The identification process of Chaboche model. In case of the Chabochemodel the best way of parameters identification is using the results of the cyclictests [11]. But this tests cannot be performed for many kinds of materials andshapes of specimens, due to the buckling effect or properties of the material (e.g.for textile fabrics, soft composites). In this paper identification on the basis ofuniaxial tension tests is presented. Such regression is rather difficult, becauseit is necessary to identify from non-linear equations all parameters at the sametime. It is not possible to separate hardenings functions from viscous effects.The basis variant of the Chaboche model have the following seven number ofparameters: k, K, n, a, c, b, R1. The first parameter k has been estimated in theprevious chapter. The other six parameters have to be calculated on the basisof the equation for the uniaxial load case. Such set of equations can be obtainedfrom relations given in Chapter 2.
(4.3)
p = |εp| = γ
⟨ |σ −X| −R− k
K
⟩n
,
εp = γ
⟨ |σ −X| −R− k
K
⟩n
sgn(σ −X),
(4.4)X =
2
3aεp − cX |εp| ,
R = b(R1 −R) |εp| ,
where a is the saturation value of internal stress Xij in the uniaxial case, c isparameter, which controls the convergence velocity of a model to stabilized cycle,b is the coefficient, which influences the convergence rate of a model to stabilizedcycle, R1 is parameter, which is responsible for the cyclic fatigue effects (R1 < 0)or cyclic strengthening effects (R1 > 0), what means that increases or decreases

PARAMETERS’ IDENTIFICATION OF PERZYNA AND CHABOCHE. . . 299
the amplitude of plastic strain in each cycles. Both hardening functions in theuniaxial stress state can be integrated explicitly:
(4.5)X = ν
2
3
a
c+
(X0 −
2
3
a
c
)exp (−c (εp − εp0)) ,
R = R1 (1− exp (−b |εp|)) ,
where X is kinematic hardening,X0 is initial kinematic hardening, εp is inelasticstrain, εp0 is initial inelastic strain, ν = sgn(σ −X) = ±1 for uniaxial tensiontest ν = 1, R is isotropic hardening. The final formula for stresses useful for theidentification of parameters has the form:
(4.6) σ = X(εp,X0, εp0) + νR (|εp|) + νk + νK |εp|1/n ,
where εp is inelastic strain rate. For uniaxial tension tests proceed X0 = 0 andεp0 = 0, therefore the hardening functions can be expressed as:
(4.7)X =
2
3
a
c[1− exp(−cεp)],
R = R1[1− exp(−bεp)].
For the identification process one representative test for each strain ratehas been selected. First, the stress-time and strain-time functions have beenapproximated using the least – squares method. It has been made as the dif-ferentiation of these functions is necessary. The stress-time functions have beenapproximated by the four-parameters Weibull’s functions. Then the strain-timefunctions have been determined by the polynomial functions. According to thecharacter of the certain test the fifth – degree, fourth – degree or third – degreepolynomial functions have been applied. For the lower strain rate test higherorder of the polynomial function has been used. Next by the numerical differ-entiation (central differences method) the strain rate function has been found.In order to estimate the parameters of the Chaboche model, it has been col-lated data of stress, strain and strain rate for selected tests. Then such collectedfunction has been approximated using the Eqs. (4.6) and (4.7). The parame-ters identification has been performed by the Marquardt-Levenberg algorithm[12, 13]. The results are shown in Fig. 5. The presented regression method re-quires the initial values of the desired parameters. In case of the Chabochemodel, identification results often depend on the initial values of parameters,so can be ambiguous. In this paper, the initial values of parameters have beenassumed from the literature [9]. The values of parameters identification of theChaboche model have been presented in Table 4.

300 P. KŁOSOWSKI, A. MLECZEK
Fig. 5. Number of measuring points – stress graph with approximated function.
Table 4. Parameters of Chaboche model.
Parameter Unit Values of the parameters
k MPa 114.0
K MPa −11.69
n – −13.66
a MPa 3.429·104
c – 905
b – 15.84
R1 MPa 3.262
The values of the correlation and determination coefficients are close or equalto 1.0, what indicates good quality of the performed approximation. The addi-tional formulas on the basis of which the accuracy of the approximation hasbeen evaluated, can be found in the works [7] and [21].
5. Verification of approximation results
The next important step determining the inaccuracy of the identificationassessing is the verification of obtained results by the numerical simulation ofexperiments. The algorithm which has been used for the verification relates to

PARAMETERS’ IDENTIFICATION OF PERZYNA AND CHABOCHE. . . 301
the system with one degree of freedom and allows to simulate the static tensiletests made in different conditions. The details of the algorithm implementedin the program are given in [9]. The results of the verification for the Perzynaand Chaboche models’ parameters have been compared with the experimentalresults by the stress-strain function. In order to assess the accuracy of the per-
Fig. 6. The results of the numerical simulation of the tension tests of the aluminum alloy atthe strain rate of 10−4 [s−1] compared with the results for each specimen (a, b, c).
Fig. 7. The results of the numerical simulation of the tension tests of the aluminum alloy atthe strain rate of 5·10−4 [s−1] compared with the results for each specimen (a, b, c).

302 P. KŁOSOWSKI, A. MLECZEK
Fig. 8. The results of the numerical simulation of the tension tests of the aluminum alloy atthe strain rate of 10−3 [s−1] compared with the results for each specimen (a, b, c).
Fig. 9. The results of the numerical simulation of the tension tests of the aluminum alloy atthe strain rate of 5·10−3 [s−1] compared with the results for each specimen (a, b, c).
formed verification with the experimental data the determination coefficients r2
have been calculated. Figures 6–10 present the comparison of the results of theperformed numerical simulation with the experimental results for selected tests.Calculations confirm good quality of the identification results.

PARAMETERS’ IDENTIFICATION OF PERZYNA AND CHABOCHE. . . 303
Fig. 10. The results of the numerical simulation of the tension tests of the aluminum alloy atthe strain rate of 10−2 [s−1] compared with the results for each specimen (a, b, c).
6. Conclusions
In the paper examples of successful identification of viscoplastic constitutivemodels for aluminum alloy has be performed. Two viscoplastic models, havingthe same origin have been considered. The older one (Perzyna model) in thepresented historical form has the isotropic hardening (in the implicit form) andno kinematic hardening function and is restricted to three inelastic parame-ters. The Choboche model, which is extension of the Perzyna model in fact hasexplicit kinematic and isotropic hardening functions. On the other hand it isnecessary to identify at least 7 material parameters. The best way to receivethem is to make fully reversed cyclic test, but this type of tests for large groupof materials and structures is not possible. Identification from tensile tests withdifferent strain rates is also possible, but is much more difficult what also meansthat is less accurate.The performed verification of the tests show that both investigated constitu-
tive model can express behavior of the investigated aluminum alloy in elevatedtemperature. The authors confirmed once more that a simpler constitutive laws(like Perzyna model) can express quite well material behavior. The similar con-clusion can be found in [3, 4] and [8], where the example of explosion on alu-minum shell is investigated.In the current research the dependence of the Young’s modulus on the strain
rate at elevated temperature is observed.Obtained conclusions will be confirmed in the near future by following ex-
periments and calculations of structures.
304 P. KŁOSOWSKI, A. MLECZEK
References
1. Ambroziak A., Kłosowski P., Nowicki M., Schmidt R., Implementation of continuumdamage in elasto-viscoplastic constitutive equations, Task Quarterly, 10, 2, 207–220, 2006.
2. Ambroziak A., Kłosowski P., The elasto-viscoplastic Chaboche model, Task Quarterly10, 1, 49–61, 2006.
3. Argyris J., Balmer H.A., Doltsinis I.St., On Shell Models for Impact Analysis, TheWinter Annual Meeting of the American Society of Mechanical Engineers, 3, 443–456,1989.
4. Belytschko T., Wong B.L., Chiang H.Y., Improvements in Low-Order Shell Elementsfor Explicit Transient Analysis, The Winter Annual Meeting of the American Society ofMechanical Engineers, 3, 383–398, 1989.
5. Chaboche J.L., Constitutive equations for cyclic plasticity and cyclic viscoplasticity, Int.J. Plasticity, 5, 247–302, 1989.
6. Chaboche J.L., Viscoplastic constitutive equations for the description of cyclic andanistropic behavior of metals, 17th Polish Conf. on Mechanics of Solid, Szczyrk, Bul.De l’Acad. Polonaise des Sciences, Serie Sc. Et Techn., 25, 33–42, 1977.
7. Chapra S.C., Canale R.P., Numerical Methods for Engineers, McGraw-Hill Book Com-pany, New York, 1988.
8. Kłosowski P., Nonlinear numerical analysis and experimental tests of vibrations ofelastic-viscoplastic plates and shells [in Polish], Monographs, Ed. Gdańsk University ofTechnology, Gdańsk, 1999.
9. Kłosowski P., Woznica K., Nonlinear viscoplastic constitutive models in selected appli-cations of structures analysis [in Polish], Ed. Gdańsk University of Technology, Gdańsk,2007.
10. Kłosowski P., Zagubień A., Woznica K., Investigation on rheological properties oftechnical fabric “Panama”, Arch. Appl. Mech., 73, 661–681, 2004.
11. Lemaitre J., Chaboche J.L.,Mechanics of Solid Materials, Cambridge University Press,Cambridge, 1990.
12. Levenberg K., A method for the solution of certain problems in least squares, Quart.Appl. Math., 2, 164–168, 1944.
13. Marquardt D.W., An Algorithm for Least Squares Estimation of Parameters, Journalof the Society of Industrial and Applied Mathematics, 11, 431–441, 1963.
14. Perzyna P., Fundamental problems in viscoplasticity, Advances in Mechanics, 9, 243–377,1966.
15. Perzyna P., On the constitutive equations for work-hardening and rate sensitive plasticmaterials, Proc. Vibr. Probl., 4, 281–290, 1963.
16. Perzyna P., The constitutive equations for rate sensitive plastic materials, Quart. Appl.Mech., 20, 321–32, 1963.
17. Perzyna P., The study of the dynamic behavior of rate sensitive plastic materials,Archives of Mechanics, 1, 15, 113–129, 1963.
18. Perzyna P., Theory of viscoplasticity [in Polish], PWN, Warsaw, 1966.
PARAMETERS’ IDENTIFICATION OF PERZYNA AND CHABOCHE. . . 305
19. Rowley M.A., Thornton E.A., Constitutive Modeling of the Visco-Plastic Responseof Hastelloy – X and Aluminium Alloy 8009, Jour. of Engng. Materials and Technology,118, 19–27, 1996.
20. Skrzypek J., Plasticity and creep [in Polish], PWN, Warsaw, 1986.
21. Taylor J.R., Introduction to error analysis, PWN, Warsaw, 1995.
22. Woznica K., Dynamique des structures elasto-viscoplastiques, Cahiers de Mecanique,Lille, 1998.
Received May 29, 2014; revised version November 2, 2014.