parallels, tangents, and loops: reflections on the
TRANSCRIPT

ABSTRACT While attention in Research Through Design (RtD) is often on the findings, in this pictorial, we choose to attend to the ‘through’ part of RtD in order to reveal the messy stories of how those insights were arrived at—stories that are often untold, truncated, or streamlined. We use a yearlong RtD project on human-data entanglements in the home as a case study to explore the contours of this process. We detail how our messy lines of inquiry crossed, dead ended, wove together, and looped. Grounded in illustrations of lines, we offer practical reflections on experiences we encountered while navigating these scribbly lines.
INTRODUCTIONAs RtD flourishes into a legitimate and more commonly used mode of inquiry in design and human-computer interaction (HCI), design researchers continue to refine ways to communicate the rich findings it can generate. Examples include the Pictorial track established at ACM DIS 2014 to create conference proceedings that relied on visual communication, or the biannual RtD conference (since 2015) that emphasizes the relationship between artifacts and writing.
While efforts in finding appropriate ways of disseminating the results of RtD are crucial for the growth of this field, in this pictorial, we attend to the messiness of the research and design process. As we streamline RtD stories to communicate to other
researchers and practitioners, what is left behind? If RtD is inherently about design as a mode of inquiry, what can we learn by being more open about the meandering, confusing at times, and ambiguous explorations in the process?
In this pictorial, we provide practical reflections on the experiences we encountered in a yearlong RtD project (2018-2019). Our contribution is two-fold. We offer the beginnings of an illustrated taxonomy of the ‘messy through lines’ within RtD processes with the intention that other RtD practitioners might find opportunities to reflect on their own practice. We do this by detailing the various, and sometimes convoluted lines of inquiry in our own project on human-data entanglements as a way to support transparency and rigor in RtD.
KNOWLEDGE IN RtDRtD is a foundational concept for approaching inquiry through the practice of design, resulting in the production of new knowledge [4,14,19,45,46]. This knowledge is often referred to as intermediary design knowledge [24,25]: situated between a specific artifact (an exemplar) and broader theories—with a focus on, for instance, tacit design knowledge, aesthetics, process, and design decisions. Design and RtD, as generative practices, are likely to produce theories that are “provisional, contingent, and aspirational” [19:940]. A core challenge for RtD in recent years has been to find ways to articulate how that knowledge
Parallels, Tangents, and Loops: Reflections on the ‘Through’ Part of RtD
Permission to make digital or hard copies of all or part of this work for personal or classroom use is granted without fee provided that copies are not made or distributed for profit or commercial advantage and that copies bear this notice and the full citation on the first page. Copyrights for components of this work owned by others than the author(s) must be honored. Abstracting with credit is permitted. To copy otherwise, or republish, to post on servers or to redistribute to lists, requires prior specific permission and/or a fee. Request permissions from [email protected] ’20, July 6–10, 2020, Eindhoven, Netherlands© 2020 Copyright is held by the owner/author(s). Publication rights licensed to ACM.ACM ISBN 978-1-4503-6974-9/20/07 $15.00https://doi.org/10.1145/3357236.3395586
Authors Keywordsresearch-through-design, RtD, design, process, lines, IoT, data, messy
Audrey Desjardins1 and Cayla Key2
1 School of Art + Art History + Design, University of Washington, Seattle, USA, [email protected] DJCAD, University of Dundee, Dundee, United Kingdom, [email protected]
Tracing Design Research Journeys DIS ’20, July 6–10, 2020, Eindhoven, Netherlands
2133
produced via RtD is valid or reliable while remaining true to the approach, which often is open and messy.
While there are still debates around what constitutes or validates RtD knowledge [19,24,46], a recent focus on the lack of documentation of the RtD process [4,5,40] highlights the need for more transparency to establish validity and rigor. Claisse et al. argue: “The lack of RtD documentation means that, often, outcomes cannot be legitimized or recognized as contribution to knowledge: if an artifact is to function as a means of conveying new knowledge, justifications of those claims should be provided and traced back” [8:5]. By opening up the process, it becomes possible to see a chain of reasoning that leads to a final artifact [5,8,39] and clearer links between artifact and the knowledge generated. In this work, we aim to contribute to this discussion by showing that sometimes the chain is more of a mesh of lines that cross. In those cases, we see the artifacts of RtD emerge within and throughout the mesh, instead of appearing as an end point of the chain. To continue exploring the particular types of knowledge produced in RtD, we attend to the various dimensions (aesthetic, methodological, theoretical, etc.) in the ‘through’ parts of the process.
REPRESENTING AND DOCUMENTING RtDDesign has long been seen as a messy, unpredictable, or hard to follow process within HCI (e.g. [44]). Recently, RtD practitioners aim at reflecting and disseminating this process in various forms such as annotated portfolios [7,17], workbooks [18], and pictorials [6]. A dynamic corpus of works offer detailed accounts of the process of making or producing the artifacts themselves (e.g. [22,29,30,36]) as a place where knowledge is produced. Others have offered reflexive accounts of the methodological decisions they have taken in their RtD processes, also as a locale for knowledge production in RtD (e.g. [8,13,16,20,39]).
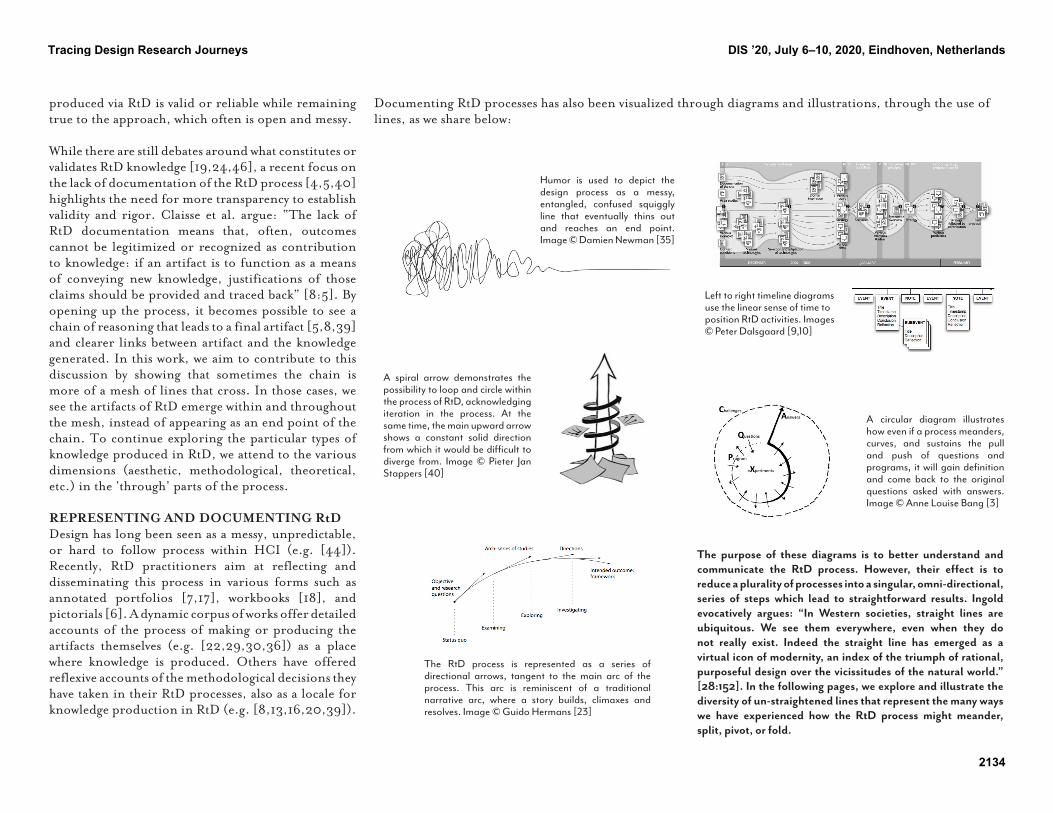
Humor is used to depict the design process as a messy, entangled, confused squiggly line that eventually thins out and reaches an end point. Image © Damien Newman [35]
A circular diagram illustrates how even if a process meanders, curves, and sustains the pull and push of questions and programs, it will gain definition and come back to the original questions asked with answers. Image © Anne Louise Bang [3]
A spiral arrow demonstrates the possibility to loop and circle within the process of RtD, acknowledging iteration in the process. At the same time, the main upward arrow shows a constant solid direction from which it would be difficult to diverge from. Image © Pieter Jan Stappers [40]
The RtD process is represented as a series of directional arrows, tangent to the main arc of the process. This arc is reminiscent of a traditional narrative arc, where a story builds, climaxes and resolves. Image © Guido Hermans [23]
The purpose of these diagrams is to better understand and communicate the RtD process. However, their effect is to reduce a plurality of processes into a singular, omni-directional, series of steps which lead to straightforward results. Ingold evocatively argues: “In Western societies, straight lines are ubiquitous. We see them everywhere, even when they do not really exist. Indeed the straight line has emerged as a virtual icon of modernity, an index of the triumph of rational, purposeful design over the vicissitudes of the natural world.” [28:152]. In the following pages, we explore and illustrate the diversity of un-straightened lines that represent the many ways we have experienced how the RtD process might meander, split, pivot, or fold.
Left to right timeline diagrams use the linear sense of time to position RtD activities. Images © Peter Dalsgaard [9,10]
Documenting RtD processes has also been visualized through diagrams and illustrations, through the use of lines, as we share below:
Tracing Design Research Journeys DIS ’20, July 6–10, 2020, Eindhoven, Netherlands
2134

When we were thinking through our making and deploying of the activity Imaginary Data Interactions Card Game (see description on pages 4 and 5) we iterated on different word options. Many of them related to lines or evoked a directionality, however we explored other metaphors which felt like they spoke to the tacit qualities of that activity and our reflections.
We used sketching to play with levels of abstraction and fidelity, and to refine the representations.
We were guided by what felt right in our guts. Of course, our guts did not always agree. When debating using a blur (the top three sketches) or a magnetic field (the bottom three) to represent the Imaginary Data Interactions Card Game we used sketches, diagrams, and conversations to bring clarity and depth to how that activity took place and to help us find consensus—in this case we settled on blurs.
OUR APPROACHIn the next pages, we report on the RtD process we conducted in a project which foregrounded data’s lively, local, and entangled encounters with home dwellers. The project aimed at understanding current ways in which people engage (or not) with the data produced by their Internet of Things (IoT) devices at home and to conceptualizing other encounters between home dwellers and data. While we articulated the manifestations, roles, trajectories, and new framings of data in the homes of our interlocutors in [12], in this pictorial we focus on communicating the non-linear and messy RtD process of conducting this ongoing research.
We began with a reflexive analysis of our process grounded in our weekly meeting notes, our first-person experiment logs, email exchanges with participants, photos taken of our ideation walls, and the documents we generated to analyze the interviews and home tours we conducted. We used a spreadsheet to piece together the details of our process, tracing back where each research activity began, converged, tapered, or transformed and adding reflective notes. With the spreadsheet as a starting point, we extensively discussed each activity, remembering parts together, and asking each other questions that provoked searching our memory further.
We used reference materials such as diagrams for inspiration when ideating on possible titles for each activity’s role in our process.
We found ourselves using metaphor and rhetoric to embody the qualities of each activity’s trajectory.
Image © Rice University [38]
Tracing Design Research Journeys DIS ’20, July 6–10, 2020, Eindhoven, Netherlands
2135

October. First-person Experiment with Google Clips. We experimented with this data form by writing a script to aggregate the image metadata.
October-February. Imaginary Data Interactions Card Game. Our goal was to co-create short imaginary scenarios about data that could be exchanged, processed, or created using random word pairings during our home tours.
October-December. Mad Libs. The goal of this lightweight activity was twofold, 1) help interlocutors imagine new encounters with their house, objects, and data, and 2) ease into more abstract co-speculating.
January-April. Real and Imaginary Postcards. Our goal was to investigate how to broaden the types of data that are captured in the home, and how those data are tracked and represented.October. Contacting Phillips, Tile,
and Google. We wanted to know more about data’s thresholds, algorithms, storage, and how we might access more.
October. First-person Experiments. (e.g. [11,15,31,34]). Our goal was to collect different data forms and structures.
March-April. Imaginary Sensors. Our goal was to co-speculate [13,43] with participants Lucy and Samantha on other forms of data in their homes.
February. Data Physicalization Review (e.g. [26,33]). To inform our goal of offering alternative encounters with data as physicalizations, we conducted a literature review and survey.
April-June. Speculative Concepts. Our goal was to sketch in relation to the observations from the Home Tours (e.g. [1,42]), as well as our own intuition and curiosity.
May. Revisiting Data Physicalization. We returned to our literature review and survey to better understand previous works’ goals and limitations.
May-June. Writing while Refining Concepts. With the goal of organizing and further synthesize thinking across all research activities and reflecting that in our sketches we finalized five conceptual sketches, one for each theme developed in our analysis.
July-September. Writing with Concept Feedback. We wanted to share back with participants (a process inspired by calls for connecting back to participants in forms such as design workbooks, and zines [13,16,18]).
overview of research activitiesHere we present an overview of the research activities we undertook in this project next to their associated lines. One activity not represented by a line, yet which was foundational, was the Home Tours (October-February) we conducted with 10 people in 8 households [37]. Many of the early activities in this timeline took place during these 60-90 minutes visits or in preparation for them.
Tracing Design Research Journeys DIS ’20, July 6–10, 2020, Eindhoven, Netherlands
2136

Throughout the process, there were moments where we knew the path ahead, we could see it being traced in front of us, and we simply had to move along that path. These ‘lines’ illustrate periods where we felt direction and clarity in the upcoming steps.
For example, at the beginning of our process, we needed to develop vocabulary and literacy around IoT data in order to conduct insightful interviews with participants about their data. To prepare, we conducted first-person experiments by setting our own IFTTT applets [27] and building quick data gathering devices. This process helped us anticipate what participants might show us and gave us clarity on what to ask. Step by step, with each small first-person experiment, we learned what home IoT data looked like, what it felt like, and how to access it.
Reflection: Because we were working with a material (data) which was new to most of us, we needed small straightforward steps in order to ground our fieldwork and to help us navigate all of the ill-defined and oblique paths which lay ahead.
As much as ‘lines’ supported a path to get us started, blurs, in contrast, offered an elusive sense that things were indeed moving along, but their success or benefit felt incommunicable, unpresentable, and at times inexplicable.
For instance, when we deployed the Imaginary Data Interactions Card Game with participants (at the end of the home tours) we could see excitement and imagination in our interlocutors as they worked with card pairings. We often left those discussions with the feeling that we had pushed beyond common assumptions about data and connected devices in the home. However, as we looked back through the transcripts of those moments and tried to use parts of those discussions when synthesizing, there was hardly anything to grasp! The discussions were not offering easy to categorize or abstract insights. The photos of the card pairings were similarly too
This activity was a playful and open co-speculation. In one example (above) the researchers and participant Aaron discussed what a banana-combiner could be. Ideas included a smart singles bar, a smart martini mixer, and a smart cake recipe generator. It is easy to see how difficult it was to extract communicable value form conversations like these.
open to disambiguate. And yet, we felt that this activity strongly influenced how we came to make sense of people’s entanglements with IoT data.
Reflection: The undeniably valuable yet fuzzy effects of this activity caused tension in our writing process. We felt drawn to share and recognize this method’s contribution but struggled to find a way to do so within the structure of our paper. Although it was mentioned as a method used (in [12]), we ultimately did not find a way to communicate the value we saw.
LINES BLURS
The options available through the IFTTT app were limited (as seen above). Although it was useful to link to existing data structures (such as Nest Thermostat data), what we could link those to was not very whimsical or imaginative (e.g. email).
Our other first-person experiments however, allowed us to create or extract everyday data such as timestamps for how many times a sock drawer was opened or closed during a day (as seen below) which were more personal and fun.
Tracing Design Research Journeys DIS ’20, July 6–10, 2020, Eindhoven, Netherlands
2137

Reflection: We unknowingly leveraged our positions as researchers to scaffold and motivate freer and more open imagining about possible IoTs during the card game. Without careful attunement to these power dynamics, we misread the fragile relationship between us, the activity and our interlocutors.
All of the lines we pursued have intricate yet traceable paths in and throughout the larger mesh of lines in this project. With retrospect we can see where they entered, how they entangled with which line, and where they meandered off to. There are instances, however, where a line quickly dead ends instead of developing a complex relationship with the rest of the mesh.
As a fun and perspective shifting exercise, we created 10 IoT inspired Mad Libs and left them for each home dweller to fill out on their own time after our home tours. After the apparent success of the Imaginary Data Interactions Card Game, we hoped this activity would be met with the same enthusiasm and creativity. Unlike the card game however, the completed Mad Libs offered no thread to pull on.
When we collected and read the returned Mad Libs, we were forced to ask ourselves why the card game seemed to inspire and entertain while this activity fell flat. We realized that during the card game activity we were very active in our encouragement, excitement, and collaboration.
DEAD ENDSPOROUS DEAD ENDS
While some lines dead ended and remained dead, others had a way of allowing something to remain, to linger, and resonate further along in the project.
As part of our early first-person experiments one researcher set up a Google Clip (a small camera which uses facial recognition to take photos automatically) in her kitchen to see what it might be like to extract and play with image metadata. The camera was set up for one week and collected hundreds of photos. We were only interested in the data log (including timestamps, exposure settings, etc.), but the images themselves (another form of data) turned out to be interestingly uncanny and eerie in their mundanity.
Although some participants had devices which captured images, none had archives of the metadata. Because of this mismatch, this experiment initially seemed like nothing more than a dead end. However, the uncanny experience sifted through the porous bounds of the stated goal. The tacit
knowledge re-emerged when a participant (Samantha) echoed those sentiments as she described watching videos from her smart camera where she could see herself washing dishes in the reflection in her kitchen window.
Reflection: Although the experiences of the researcher and participant were different, they were drawn closer through the lingering sense of inimitability. Though the phenomena were personal and singular they were also uniquely shared.
It turns out that watching yourself make a peanut butter sandwich or putting away napkins day after day from the perspective of a camera is mesmerizingly defamiliarizing.
Tracing Design Research Journeys DIS ’20, July 6–10, 2020, Eindhoven, Netherlands
2138

When interesting themes were developed in the fieldwork data, we tried to represent and explore them in our sketches. As a group, we collectively added layers of nuance based on our personal histories, knowledge of participants, intuitions, or curiosities. Our intention was to create concepts to gather participants reactions to our higher-level findings. However, we found that by sketching in parallel with analysis, those acts of making, exploring, and sharing deepened our findings in a significant way, pushing our analysis even further.
Reflection: Although we saw a real benefit to allowing these two lines to play out in close proximity, this happy accident was the result of needing to do these things in tandem to meet deadlines and pursue other obligations. The constraints of the situation forced us to get creative with our approach and stretch our thinking to include multiple explorations at once.
Parallels
At every stage in this project we were perusing many different avenues of investigation at once. This process felt natural and inevitable, and on occasion yielded some generative crossings. We see this most clearly when looking back on our simultaneous activities of concept sketching and early analysis of fieldwork data.
We approached concept ideation with a suspension of feasibility. This allowed us to explore early themes such as ‘glitches and false triggers’ with freedom and humor. One example (on the green sticky note) depicts an animatronic bust which dials up a developer in the company of the device which is malfunctioning and requests they explain the false trigger or data glitch to you.
Perpen
dic
ulars
Where parallel lines represent the harmony that can be achieved when two lines work in partnership, perpendiculars result when one line’s influence causes friction, disruption, and upheaval.
One such upheaval resulted when our studio took on two new members. We asked them to gather examples of current (actual or theoretical) data physicalization to further our understanding of this branch of the project. Seeing all of the examples printed out on our wall provided a very different perspective on that goal. It was clear to us that they were still fairly prescriptive, represented limited sets of data, and lacked an element of whimsy integral to our group’s ethos. This set us on a new trajectory where instead of building bespoke data physicalizations (as was our intention) we tried to better understand the nature of data’s existing materiality and the costs vs benefits of designing data to be in the foreground as it is with most physicalizations.
Reflection: We were very focused on arriving at bespoke physicalizations from the onset of the project. It took a substantial disruption in our studio dynamic to make us pause and provoke us to confront, trouble, critique, and reposition a core idea within our project.
Tracing Design Research Journeys DIS ’20, July 6–10, 2020, Eindhoven, Netherlands
2139

Although zigs do occur it is perhaps more common to encounter zags. Zags represent moments when we were lulled into believing a line of inquiry was on a fast track to somewhere very exciting, only to realize that our effort was spent moving in the opposite direction.
To test the Real and Imaginary Data Postcards, we each spent a week filling out a set of our own. When the studio met again to share the postcards we all felt excited and believed that we had discovered a nice way to pay attention to data collection and representation. After reviewing participants’ postcards with disappointment, however, we reread our attempts with newly critical eyes. We were initially focused on how easy and approachable it would be to find things to track, and then to take the time to actually track them. We spent less time concerned with what we chose to track, why, and if that lent insight. The activity was indeed easy to approach and to engage with but upon reflection it was lighter that we had hoped.
Reflection: We realized that we had all approached looking for and collecting data like computers. In other words, as objective sensors. We had unwittingly formulated this activity to employ ways of perceiving rather than ways of knowing.
Reflection: We truly believed that more data existed and would be available to anyone with enough moxie to seek it out. It was thanks to our naïveté that this search revealed a much more essential yet distant aspect of data’s worlds.
Looking back we also realized how much we were motivated by the aesthetic possibility of beautifully messy data drawings (as in Dear Data [32]). However, we collectively failed at realizing that potential (as in the examples above). Conversations like this one with Google
Clips tech support (above) illustrates how not only data are not for us as consumers, they are not meant for support persons either. The gatekeepers of these data are very removed from the homes and lives with which they entangle.
ZIGS
ZAGSBecause our research process was divergent and nonlinear we were open to various meanderings and outcomes, however some lines of inquiry surprised us and were not what they initially seemed. Zigs occurred when a research activity yielded unexpectedly useful results.
Early on, in addition to the first-person experiments, we attempted to access data from existing devices (e.g. Nest Thermostat, Wyze Camera etc.). Although most home IoT devices make data archives available, not all of them do, and there are a lot of missing data. Our primary goal was to be able to show our participants how to access their devices’ data, but we also wanted to understand data’s journeys as holistically as possible. This led us to reach out to tech companies. We called Philips’ tech support and chatted with Tile and Google Clips support.
Insofar as accessing more data, these conversations were complete failures. Instead of a sense of empowerment, we were left with the feeling that data is just not designed for us (users) to fully access and appreciate. This paradigm came up during our subsequent fieldwork and ended up becoming a major theme (i.e. Data for others, data as others) of our findings [12].
Cayla 1:00 AM i’d like to access the data on what it is detecting when it determines what it is is memorable
Grant 1:03 AM I see, To be honest it’s all based on its AI technoogy. Me myself already tried it first have once the face was recognized it will start capturoig the moment you do something.
Cayla 1:05 AM do you or someone in your office know of a way to access that data?
Grant 1:08 AM I’m afraid the data your referring to is the AI feature of the camera that is not possible to check within the app.
Tracing Design Research Journeys DIS ’20, July 6–10, 2020, Eindhoven, Netherlands
2140

In our process, we encountered lines of inquiry which started in parallel but at some point veered off. In these cases, the lines do not dead end or taper. They wind up going somewhere interesting, however it is only tangentially related to our inquiry and therefore not particularly useful.
This was the case with our second round of probes which were created for two of the original ten participants. Each participant received a box with three physical objects individually designed and crafted to live in their homes as Imaginary Sensors (inspired by cultural probes [21]). We created a YouTube channel (which we prepopulated with mock videos created by the studio) and asked participants to record and upload short videos explaining their new sensors. One participant eagerly recorded and uploaded her videos. Although they were humorous and energetic they were not as revealing as we had hoped. The second participant never even started hers.
Reflection: All of the time and energy spent designing and crafting these probes to be engaging and prevocational was wildly unbalanced to the thin insights derived. However, we kept following the path since we were deeply curious about the types of videos that could emerge from this new co-speculation.
Tan
gen
ts
Loops
Reflection: Questioning the goals, assumptions, and precedents of and around a project is a healthy aspect of reflective practice and need not throw the entire body of work into chaos. Sometimes a major disruption in one line of inquiry is what gives birth to a more nuances and honest piece of work.
As we have shown, not all lines have direct trajectories. Loops represent when a line starts to curve and bend away from its original direction and dramatically loops around to reorient itself as a parallel to the original trajectory.
After the friction caused by our survey of data physicalizations we did not want that line to die completely, we saw a way to push through and loop back to our research questions. We wanted to find if there was a productive critique aligned with our findings. We returned to those examples as well as our early literature review on the subject and tried to assess what their goals and motivations were. Reflection and self-improvement were dominant goals of most data physicalization examples that sat in contrast to our findings on current modes of data engagement, as well as diverse ways of noticing and being with data (i.e. noticing and being do not always have to be in the foreground). By looping back within our process, we enhanced our findings and broadened our argument.
These open-ended probes were meant to be manipulated, played with, and integrated into the specific home they were designed for. This example was modeled after a mid-century modern clock (responding to the participant’s beautifully hipster chic home where wood, brass, leather, and touches of color were part of the interior design) and can articulate on 5 axes.
Tracing Design Research Journeys DIS ’20, July 6–10, 2020, Eindhoven, Netherlands
2141

Weaving was about how we used the writing process to pull together all of our threads of inquiry and start to form the texture of our narrative and evolve our concepts. In the last line of this process we used participants’ reactions to those concepts to expand our argument and complicate our story.
Once the concepts were finalized we sent one set out to all of the original participants who expressed interest (4 out of 10 in total). Once we began to analyze the feedback from the reaction section on each concept card we began to see really dynamic and interesting reactions to our themes. These responses pushed back, unsettled, broadened, and intensified our thinking. We carefully began the process of stitching these new ideas onto the narrative which was almost fully developed. Because they came back to us so late, instead of those ideas being woven into the rest of the analysis we used them to expand on top of what we had already created as another layer of findings bursting forth with curiosity.
Reflection: By using this last line of inquiry as a layer expanding out as opposed to being deeply woven into our main analysis we were able to expand our voice without needing to develop those arguments as fully. This allowed us to dip our toes into explorations beyond the initial scope of the project.
Expanding
WeavingParallels (as presented previously) describe how we explored sketches in unison with starting to thematically organize the data from our home visits. Weaving represents the moment when we began the writing process which wove together all our threads from the year—data, themes, theory, critique—and continued iteration of sketches.
As we moved thread by thread, we advanced our thoughts around themes for a paper [12], the descriptions of the speculative concepts, and the sketches themselves. Every delicate interlacing of another thread unearthed nuances or provided a new perspective which could be incorporated into the sketches. The result was a much more closely interwoven relationship between our fieldwork data and the finalized conceptual sketches.
Reflection: We refrained from sending these speculative sketches to participants until the last possible moment to ensure the concept sketches were as close to our final themes as possible. Although we were happy with this decision in the end, waiting left us in a precarious position—we ran the risk of getting them back too late in our writing process.
The concept Data Epics (above) was initially created in response to a theme about data’s lively yet dependent otherness. And yet participants’ reactions made visible an entirely unique aspect of data’s performativity—how participants started to realize that their actions, almost like an act, were ‘making’ the data. This new layer of understanding was exciting and well worth the wait.
Tracing Design Research Journeys DIS ’20, July 6–10, 2020, Eindhoven, Netherlands
2142

ON SKETCHING LINESAs we reflect on our process for crafting this pictorial, we observe how the iterative naming and drawing of lines were processes that opened new channels of communication and reflection for parts of RtD that were difficult to communicate. These illustrations are not meant to be decorative, or mere accompaniments to the text. The lines themselves are the ways by which we were able to make sense of our own process.
In some cases, drawing the lines felt like a way to look back at those moments in the process where we managed to pause for reflection and attend to them with more care and thoroughness. This process of drawing helped us detail those earlier thoughts as well as give form to new ones. For example, even though the uncanny experience with the Google Clip photos (as in Porous Dead Ends) resurfaced with participant Samantha’s experience with her camera video feed, it took a large step back to see the relationship that connection had to our themes, or to the way it illuminated how much we saw the Google Clips experiment as a failure. The line’s porosity only became apparent after a lot of thought and iteration in the reflection.
For other lines, we needed the iterative and embodied act of drawing, evaluating visually, and discussing to bring the activity into focus and to understand and define its trajectories at all. For instance, when drawing the Loop, we finalized 2 variations. To choose, we asked ourselves which one best represented the process of realigning our work on data physicalization into a new orientation based on our learnings up until this point. We opted for option 2 as it shows a continuity in directionality (before and after the loop) but also acknowledges that it slightly reoriented the line. Similarly, when drawing the Perpendiculars, we asked: do these lines touch? Do they cross? Or are they perpendicular but from afar, on different planes? What are the consequences of each?
Attending to our Perpendicular and Loop activities with hindsight resulted in pivotal discussions on their effects on our project and personal practices. Reconciling this rollercoaster of an event and its subsequent shifts in our direction is what led to our reflections for these lines and will influence future reflective practice for both authors.
This embodied attention to detail and nuances guided us to reveal and articulate how we truly felt about moments of the RtD process. It also served as a locale to engage in discussions with each other about how to communicate (visually and rhetorically) the process of RtD. How would our process have looked if we were using this practice of reflecting through
line and metaphor as a tool at multiple stages during the project? Would we have communicated some of these activities better in our first publication about the project?
ON RIGOR AND TRANSPARENCYIn this pictorial, we focus on line segments and their individual qualities (across multiple dimensions such as rhetorical, aesthetic, trajectories, enmeshments, etc.). We chose to zoom in as a strategy to attune ourselves to the movements within these lines, and to step away from the teleological relationships of question-to-answer or action-to-outcome which require a straightening of the lines. Through this close reading of the process, we found an honest, albeit messy, way of reporting on the rigor of our work. We found a tapestry of various lines (“the parliament of lines” as Ingold says [28:5]), not a singular line with many points (which sit isolated from the other points in a space).
Reporting on RtD processes and findings inevitably means choosing what to share and what will remain a private part of the process. The lines that we drew in the previous pages can help shed light on the reasons why some parts are more easily shared than others. In some cases (for example with Blurs), the impact of a method or activity is so indistinguishable, so hard to put a finger on, that it has more chances of remaining unarticulated during the dissemination phase. Instead of agonizing over what isn’t told, it might be more relevant to acknowledge how each line, as crisp or blurry as it might be, plays a role in the overall RtD process, or as Taylor puts it: “how lines that surround us afford a becoming in the world” [41].
Option 1 (left): The line loops around and reunites exactly with the main stroke. Option 2 (right): The line loops around but deviates slightly when reuniting with the main stroke.
Option 1 (left): The line crashes into the main stroke and all movement is halted. Option 2 (right): The line crashes into but keeps moving and passes through the main stroke. Here we opted for option 1.
Tracing Design Research Journeys DIS ’20, July 6–10, 2020, Eindhoven, Netherlands
2143

LOOSE ENDS Lastly, we attend to some of our ‘loose ends’: “Indeed it is in the very nature of lines that they always seem to wriggle free of any classification one might seek to impose on them, trailing loose ends in every direction” [28:50]. Our reflections on this process were more numerous than what we could represent in the main pages of this pictorial: there are probably hundreds of little lines and threads. As an opening for further discussions around RtD, we start to draw the contours of some of these additional lines here.
First-person approaches as orientating practicesOur reflexive analysis allowed us to see the benefits of first-person research within a RtD process. As a starting point for the project (working with IFTTT, collecting logs and meta data, contacting Phillips and Tile, etc.), we were able to orient ourselves within data’s worlds, through personal encounters. This process yielded not only first-hand knowledge but also became a surprisingly helpful way to relate to participants later on. As we moved along the process, first-person approaches became a default position for our team when trying new methods (e.g. the Real and Imaginary Postcards, the videos of Imaginary Sensors). First-person research approaches mean recognizing and acknowledging the researchers’ first-hand experiences as a factor in orientating our engagement with participants, in our methodological choices, and in our writing. Although the use of first-person research is not new it is often one of the stories left out—perhaps because it is sometimes seen as preparatory work for upcoming RtD researchers activities. Instead, we argue that the knowledge produced in moments of ‘getting up to speed’ is as relevant and insightful as what will come next. We challenge RtD as well as other practitioners to recognize and validate these first-hand knowledges as much as participant knowledge during both formal and informal dissemination.
Human relations in RtD Before we conclude, we also want to discuss the human relations that this RtD process relied upon, like many other RtD projects. Throughout our work, we had the intention of connecting with participants during home visits, as a starting point to establishing a relationship that could grow into more research and creative activities. In this evolving relationship we encountered many different types of participants. We met our ‘star participant’: a woman who was always fast at responding, enthused by our activities, and creative in her engagements with us. In contrast, we also met interlocutors who were engaged, welcoming, and maybe overly polite when the time came to tell us they did not want to pursue working with us (and instead ignored our attempts at reaching out by fear of telling us ‘no’).
These are just two examples of people we met, and yet they highlight the very human ways in which RtD also works when involving interlocutors. These are also stories that are often flattened when we choose what stories to tell in our academic writings. We applaud Balaam et al. [2] for sharing deeply personal first-person accounts around the emotion work that arises in experience-centered design, accounts that resonated strongly with us as we were remembering our own process. In the through parts of RtD, we argue that we also must be attuned to how our interlocutors perceive and feel the work, connections, pressures, and enjoyment that are encompassed within the creative activities. Moreover, these human stories are also vastly entangled in the RtD knowledge production. Interlocutors are not only participating when we refer to their home visits or quote them, but all our interactions with them shaped how the research continued to evolve. We invite the DIS community to strive to find ways to acknowledge these people’s hidden contributions when documenting and reporting on the collective work. We also recognize, however, that this still only serves the researcher’s community. We need
to find ways to acknowledge and appreciate the breath of participant labor in ways visible and actionable by those communities and individuals doing the work.
CONCLUSION In this pictorial, we offered a reflexive account and the first steps of an illustrated taxonomy of the messy lines that constituted our RtD project around data-human entanglements. Those lines show how the processes of designing, engaging with interlocutors, following first-person approaches, and writing are intertwined in intricate, drawn-out, surprising, and also beautiful ways. Those lines also broaden how we understand how RtD knowledge is produced—partly through designing, but also through all these other modes of engaging in inquiry and people. The lines we drew stemmed from our own RtD process. However, we hope that their visual qualities (their simplicity, their directionality, and their names) will resonate with other RtD practitioners and inspire them to draw their own lines throughout their projects, in moments of pause throughout, as well as with hindsight. We ask, what would a corner, a funnel, a fading line, or a rooted line mean or represent? We have illustrated one way to bring into focus a process which is, and should remain, squishy, murky, and uncontained yet benefits from better communication, transparency, and documentation.
ACKNOWLEDGMENTSWe thank our generous and welcoming interlocutors. Special thanks to our design research team: Heidi Biggs, Netty Lim, Jena McWhirter, Jack Sinclair, and Jeremy Viny. This work is supported by a Mozilla Research Grant 2018H2.
Tracing Design Research Journeys DIS ’20, July 6–10, 2020, Eindhoven, Netherlands
2144

REFERENCES[1] Ryan Aipperspach, Ben Hooker, and Al-
lison Woodruff. 2008. The Heterogeneous Home. In Proceedings of the 10th Interna-tional Conference on Ubiquitous Comput-ing (UbiComp ’08), 222–231. https://doi.org/10.1145/1409635.1409666
[2] Madeline Balaam, Rob Comber, Rachel E. Clarke, Charles Windlin, Anna Ståhl, Kristina Höök, and Geraldine Fitzpatrick. 2019. Emo-tion Work in Experience-Centered Design. In Proceedings of the 2019 CHI Confer-ence on Human Factors in Computing Sys-tems (CHI ’19), 602:1–602:12. https://doi.org/10.1145/3290605.3300832
[3] Anne Louise Bang and Mette Agger Eriksen. 2019. Experiments all the Way in Program-matic Design Research. Artifact 6, 1: 4.1-4.20. https://doi.org/10.1386/art_00004_1
[4] Jeffrey Bardzell, Shaowen Bardzell, Peter Dalsgaard, Shad Gross, and Kim Halskov. 2016. Documenting the Research Through Design Process. In Proceedings of the 2016 ACM Conference on Designing Interac-tive Systems (DIS ’16), 96–107. https://doi.org/10.1145/2901790.2901859
[5] Michael A. R. Biggs and Daniela Büchler. 2007. Rigor and Practice-based Research. De-sign Issues 23, 3: 62–69.
[6] Eli Blevis, Sabrina Hauser, and William Odom. 2015. Sharing the Hidden Treasure in Picto-rials. interactions 22, 3: 32–43. https://doi.org/10.1145/2755534
[7] John Bowers. 2012. The Logic of Anno-tated Portfolios: Communicating the Value of “Research Through Design.” In Proceed-ings of the Designing Interactive Systems
doi.org/10.1162/DESI_a_00447
[15] Carolyn Ellis, Tony E. Adams, and Arthur P. Bochner. 2010. Autoethnography: An Overview. Forum Qualitative Sozialforschung / Forum: Qualitative Social Research 12, 1. Retrieved October 31, 2014 from http://www.qualitative-research.net/index.php/fqs/article/view/1589
[16] Sarah Fox and Daniela K. Rosner. 2016. Continuing the Dialogue: Bringing Research Accounts Back into the Field. In Proceedings of the 2016 CHI Conference on Human Factors in Computing Systems (CHI ’16), 1426–1430. https://doi.org/10.1145/2858036.2858054
[17] Bill Gaver and John Bowers. 2012. Annotated Portfolios. interactions 19, 4: 40–49. https://doi.org/10.1145/2212877.2212889
[18] William Gaver. 2011. Making spaces: how design workbooks work. In Proceedings of the SIGCHI Conference on Human Factors in Computing Systems (CHI ’11), 1551–1560. https://doi.org/10.1145/1978942.1979169
[19] William Gaver. 2012. What should we ex-pect from research through design? In Proceedings of the 2012 ACM annual con-ference on Human Factors in Computing Systems (CHI ’12), 937–946. https://doi.org/10.1145/2208516.2208538
[20] William Gaver, John Bowers, Tobie Kerridge, Andy Boucher, and Nadine Jarvis. 2009. Anatomy of a Failure: How We Knew when Our Design Went Wrong, and What We Learned from It. In Proceedings of the SIGCHI Con-ference on Human Factors in Computing Systems (CHI ’09), 2213–2222. https://doi.org/10.1145/1518701.1519040
Conference (DIS ’12), 68–77. https://doi.org/10.1145/2317956.2317968
[8] Caroline Claisse, Daniela Petrelli, and Nick Dulake. 2019. Design synthesis: An act of Research through Design. https://doi.org/10.6084/m9.figshare.7855826.v1
[9] Peter Dalsgaard and Kim Halskov. 2012. Reflective Design Documentation. In Pro-ceedings of the Designing Interactive Systems Conference (DIS ’12), 428–437. https://doi.org/10.1145/2317956.2318020
[10] Peter Dalsgaard, Kim Halskov, and Rune Nielsen. 2008. Maps for Design Reflec-tion. Artifact 2, 3–4: 176–189. https://doi.org/10.1080/17493460802526412
[11] Audrey Desjardins and Aubree Ball. 2018. Revealing Tensions in Autobiographical Design in HCI. In Proceedings of the 2018 Designing Interactive Systems Conference (DIS ’18), 753–764. https://doi.org/10.1145/3196709.3196781
[12] Audrey Desjardins, Heidi R. Biggs, Cayla Key, and Jeremy E. Viny. 2020. IoT Data in the Home: Observing Entanglements and Drawing New Encounters. In Proceedings of the 2020 CHI Conference on Human Factors in Com-puting Systems, 1–13.
[13] Audrey Desjardins, Cayla Key, Heidi R. Biggs, and Kelsey Aschenbeck. 2019. Bespoke Book-lets: A Method for Situated Co-Speculation. In Proceedings of the 2019 on Designing Interac-tive Systems Conference (DIS ’19), 697–709. https://doi.org/10.1145/3322276.3322311
[14] Abigail C. Durrant, John Vines, Jayne Wallace, and Joyce S. R. Yee. 2017. Research Through Design: Twenty-First Century Makers and Ma-terialities. Design Issues 33, 3: 3–10. https://
Tracing Design Research Journeys DIS ’20, July 6–10, 2020, Eindhoven, Netherlands
2145

[21] William Gaver, Tony Dunne, and Elena Pacenti. 1999. Design: Cultural probes. interactions 6, 1: 21–29. https://doi.org/10.1145/291224.291235
[22] William W. Gaver, John Bowers, Kirsten Boehner, Andy Boucher, David W.T. Camer-on, Mark Hauenstein, Nadine Jarvis, and Sarah Pennington. 2013. Indoor weather stations: investigating a ludic approach to environmental HCI through batch prototyping. In Proceedings of the SIGCHI Conference on Human Factors in Computing Systems (CHI ’13), 3451–3460. https://doi.org/10.1145/2470654.2466474
[23] Guido Hermans. 2015. Opening Up Design : Engaging the Layperson in the Design of Every-day Products. Umeå University. Retrieved April 14, 2020 from http://urn.kb.se/resolve?urn=urn:nbn:se:umu:diva-108348
[24] Kristina Höök, Peter Dalsgaard, Stuart Reeves, Jeffrey Bardzell, Jonas Löwgren, Erik Stolter-man, and Yvonne Rogers. 2015. Knowledge Production in Interaction Design. In Pro-ceedings of the 33rd Annual ACM Confer-ence Extended Abstracts on Human Factors in Computing Systems (CHI EA ’15), 2429–2432. https://doi.org/10.1145/2702613.2702653
[25] Kristina Höök and Jonas Löwgren. 2012. Strong concepts: Intermediate-level knowledge in interaction design research. ACM Trans. Comput.-Hum. Interact. 19, 3: 23:1–23:18. https://doi.org/10.1145/2362364.2362371
[26] Samuel Huron, Pauline Gourlet, Uta Hinrichs, Trevor Hogan, and Yvonne Jansen. 2017. Let’s Get Physical: Promoting Data Physicalization in Workshop Formats. In Proceedings of the 2017 Conference on Designing Interactive Systems (DIS ’17), 1409–1422. https://doi.
of the Designing Interactive Systems Con-ference (DIS ’12), 514–523. https://doi.org/10.1145/2317956.2318034
[35] Damien Newman. The Design Squiggle. Re-trieved April 17, 2020 from https://thedesigns-quiggle.com/
[36] William Odom, Ishac Bertran, Garnet Hertz, Henry Lin, Amy Yo Sue Chen, Matt Hark-ness, and Ron Wakkary. 2019. Unpacking the Thinking and Making Behind a Slow Tech-nology Research Product with Slow Game. In Proceedings of the 2019 on Creativity and Cognition (C&C ’19), 15–28. https://doi.org/10.1145/3325480.3326567
[37] Sarah Pink, Kerstin Leder Mackley, Roxana Morosanu, Val Mitchell, Tracy Bhamra, Rosie Cox, and Victor Buchli. 2017. Making Homes: Ethnography and Design. Bloomsbury Academ-ic, London ; New York.
[38] Rice University. Magnetic Field Lines. Re-trieved April 16, 2020 from https://cnx.org/contents/SXdeOFrb@1/Magnetic-Field-Lines
[39] Zoë Sadokierski. 2019. Critical Journal / Con-textual Portfolio: A framework for document-ing and disseminating RtD as scholarly research. In Proceedings of the 4th Biennial Research Through Design Conference, 1–16. https://doi.org/10.6084/m9.figshare.7855829.v1
[40] Pieter Jan Stappers and Elisa Giaccardi. Re-search through Design. The Interaction Design Foundation. Retrieved September 19, 2017 from https://www.interaction-design.org/literature/book/the-encyclopedia-of-human-computer-interaction-2nd-ed/research-through-design
[41] Alex S. Taylor. 2017. What Lines, Rats, and
org/10.1145/3064663.3064798
[27] IFTTT. IFTTT. Retrieved July 26, 2019 from https://ifttt.com
[28] Tim Ingold. 2016. Lines: A Brief History. Routledge.
[29] Nadine Jarvis, David Cameron, and Andy Boucher. 2012. Attention to Detail: Anno-tations of a Design Process. In Proceedings of the 7th Nordic Conference on Human-Computer Interaction: Making Sense Through Design (NordiCHI ’12), 11–20. https://doi.org/10.1145/2399016.2399019
[30] Henry Lin, Ron Wakkary, and Doenja Oogjes. 2019. The Tilting Bowl: Electronic Design for a Research Product. In Proceedings of the 2019 on Designing Interactive Systems Conference (DIS ’19), 345–357. https://doi.org/10.1145/3322276.3323701
[31] Andrés Lucero, Audrey Desjardins, Carman Neustaedter, Kristina Höök, Marc Hassenzahl, and Marta E. Cecchinato. 2019. A Sample of One: First-Person Research Methods in HCI. In Companion Publication of the 2019 on Designing Interactive Systems Conference 2019 Companion (DIS ’19 Companion), 385–388. https://doi.org/10.1145/3301019.3319996
[32] Giorgia Lupi and Stefanie Posavec. 2016. Dear Data. Princeton Architectural Press, New York.
[33] Deborah Lupton. 2017. Feeling your data: Touch and making sense of personal digital data. New Media & Society 19, 10: 1599–1614. https://doi.org/10.1177/1461444817717515
[34] Carman Neustaedter and Phoebe Sen-gers. 2012. Autobiographical Design in HCI Research: Designing and Learning Through Use-it-yourself. In Proceedings
Tracing Design Research Journeys DIS ’20, July 6–10, 2020, Eindhoven, Netherlands
2146

Sheep Can Tell Us. Design Issues 33, 3: 25–36. https://doi.org/10.1162/DESI_a_00449
[42] Alex S. Taylor, Susan P. Wyche, and Joseph “Jofish” Kaye. 2008. Pottering by Design. In Proceedings of the 5th Nordic Conference on Human-computer Interaction: Building Bridges (NordiCHI ’08), 363–372. https://doi.org/10.1145/1463160.1463200
[43] Ron Wakkary, Doenja Oogjes, Henry W. J. Lin, and Sabrina Hauser. 2018. Philosophers Living with the Tilting Bowl. In Proceedings of the 2018 CHI Conference on Human Factors in Computing Systems (CHI ’18), 94:1–94:12. https://doi.org/10.1145/3173574.3173668
[44] Tracee Vetting Wolf, Jennifer A. Rode, Jer-emy Sussman, and Wendy A. Kellogg. 2006. Dispelling “Design” As the Black Art of CHI. In Proceedings of the SIGCHI Con-ference on Human Factors in Computing Systems (CHI ’06), 521–530. https://doi.org/10.1145/1124772.1124853
[45] John Zimmerman, Jodi Forlizzi, and Shel-ley Evenson. 2007. Research through design as a method for interaction design research in HCI. In Proceedings of the SIGCHI Con-ference on Human Factors in Computing Systems (CHI ’07), 493–502. https://doi.org/10.1145/1240624.1240704
[46] John Zimmerman, Erik Stolterman, and Jodi Forlizzi. 2010. An analysis and critique of Re-search through Design: towards a formalization of a research approach. In Proceedings of the 8th ACM Conference on Designing Interac-tive Systems (DIS ’10), 310–319. https://doi.org/10.1145/1858171.1858228
Tracing Design Research Journeys DIS ’20, July 6–10, 2020, Eindhoven, Netherlands
2147