paragon technologies, inc.pgntgroup.com/wp-content/uploads/2014/02/5_fy2006-q2-quarterly...yes ⌧...
TRANSCRIPT

UNITED STATES SECURITIES AND EXCHANGE COMMISSION
Washington, D.C. 20549
FORM 10-Q
QUARTERLY REPORT PURSUANT TO SECTION 13 OR 15(d) OF THE SECURITIES EXCHANGE ACT OF 1934
For The Quarterly Period Ended June 30, 2006
Commission File Number: 1-15729
PARAGON TECHNOLOGIES, INC. (Exact Name Of Registrant As Specified In Its Charter)
Delaware 22-1643428 (State or Other Jurisdiction of Incorporation or Organization) (I.R.S. Employer
Identification No.)
600 Kuebler Road, Easton, Pennsylvania 18040 (Address of Principal Executive Offices) (Zip Code)
Registrant’s Telephone Number, Including Area Code: 610-252-3205 Indicate by checkmark whether the Registrant (1) has filed all reports required to be filed by Section 13 or 15(d) of the Securities Exchange Act of 1934 during the preceding 12 months (or for such shorter period that the Registrant was required to file such reports), and (2) has been subject to such filing requirements for the past 90 days. Yes ⌧ No Indicate by checkmark whether the Registrant is a large accelerated filer, an accelerated filer, or a non-accelerated filer. See definition of accelerated filer and large accelerated filer in Rule 12b-2 of the Exchange Act. (Check one): Large Accelerated Filer Accelerated Filer Non-Accelerated Filer ⌧ Indicate by checkmark whether the Registrant is a shell company (as defined in Rule 12b-2 of the Exchange Act). Yes No ⌧ The number of shares of the Registrant’s Common Stock, $1.00 par value, outstanding as of July 31, 2006 was 3,202,800.
Paragon Technologies, Inc.
TABLE OF CONTENTS
Page
Number PART I — FINANCIAL INFORMATION
Item 1. Financial Statements: Consolidated Balance Sheets (Unaudited) ..................................... 1 Consolidated Statements of Operations (Unaudited)...................... 3 Consolidated Statements of Cash Flows (Unaudited) .................... 4 Notes to Consolidated Financial Statements (Unaudited) .............. 6
Item 2. Management’s Discussion and Analysis of Financial Condition and Results of Operations ............................................. 18
Item 3. Quantitative and Qualitative Disclosures About Market Risk ............ 28
Item 4. Controls and Procedures ................................................................... 28
PART II — OTHER INFORMATION
Item 1. Legal Proceedings ............................................................................. 29
Item 1A. Risk Factors....................................................................................... 29
Item 2. Unregistered Sales of Equity Securities and Use of Proceeds ......... 29
Item 3. Defaults Upon Senior Securities........................................................ 30
Item 4. Submission of Matters to a Vote of Security Holders ........................ 30
Item 5. Other Information............................................................................... 30
Item 6. Exhibits .............................................................................................. 30
SIGNATURES.......................................................................................................... 31
EXHIBIT INDEX ....................................................................................................... 32

PART I - FINANCIAL INFORMATION Item 1. Financial StatementsParagon Technologies, Inc. and Subsidiary Consolidated Balance Sheets June 30, 2006 and December 31, 2005 (In Thousands, Except Share Data)
(UNAUDITED) June 30,
2006 December 31,
2005 Assets Current assets: Cash and cash equivalents........................... $ 2,804 687 Short-term investments................................. 13,000 16,710 Total cash and cash equivalents and short-term investments ....................... 15,804 17,397 Receivables: Trade ......................................................... 2,042 2,029 Notes and other receivables...................... 660 1,066 Total receivables .................................... 2,702 3,095 Costs and estimated earnings in excess of billings.................................................... 570 616 Inventories: Raw materials ............................................ 82 108 Work-in-process ........................................ 137 26 Finished goods .......................................... 358 210 Total inventories ..................................... 577 344 Deferred income tax benefits........................ 358 353 Prepaid expenses and other current assets . 245 329 Total current assets................................ 20,256 22,134 Property, plant and equipment, at cost: Machinery and equipment ............................ 1,172 1,160 Less: accumulated depreciation .................. 875 911 Net property, plant and equipment ............ 297 249 Deferred income tax benefits ........................... 184 203 Other assets..................................................... 10 10 Total assets...................................................... $ 20,747 22,596
See accompanying notes to consolidated financial statements.
1

Item 1. Financial Statements (Continued) Paragon Technologies, Inc. and Subsidiary Consolidated Balance Sheets June 30, 2006 and December 31, 2005 (In Thousands, Except Share Data)
(UNAUDITED) June 30,
2006 December 31,
2005 Liabilities and Stockholders’ Equity Current liabilities: Accounts payable.......................................... $ 1,447 1,391 Customers’ deposits and billings in excess of costs and estimated earnings ................................... 1,865 2,044 Accrued salaries, wages, and commissions.............................................. 148 102 Income taxes payable................................... 591 650 Accrued product warranty............................. 249 189 Deferred gain on sale-leaseback .................. 165 165 Accrued other liabilities................................. 777 796 Total current liabilities............................. 5,242 5,337 Long-term liabilities: Deferred gain on sale-leaseback .................. 110 193 Total long-term liabilities......................... 110 193 Commitments and contingencies Stockholders’ equity: Common stock, $1 par value; authorized 20,000,000 shares; issued and outstanding 3,342,000 shares as of June 30, 2006 and 3,539,019 shares as of December 31, 2005 ........... 3,342 3,539 Additional paid-in capital............................ 6,588 7,004 Retained earnings ..................................... 5,465 6,523 Total stockholders’ equity....................... 15,395 17,066 Total liabilities and stockholders’ equity . $ 20,747 22,596
See accompanying notes to consolidated financial statements.
2

Item 1. Financial Statements (Continued) Paragon Technologies, Inc. and Subsidiary Consolidated Statements of Operations (Unaudited) For the Three and Six Months Ended June 30, 2006 and 2005 (In Thousands, Except Share and Per Share Data)
Three Months Ended Six Months Ended
June 30,
2006 June 30,
2005 June 30,
2006 June 30,
2005 Net sales.................................... $ 4,823 3,729 9,043 7,595 Cost of sales.............................. 3,315 2,839 6,248 5,613 Gross profit on sales.................. 1,508 890 2,795 1,982 Selling, general and administrative expenses ........ 1,429 1,147 2,801 2,184 Product development costs ....... 60 19 216 23 Interest expense ........................ - - 1 1 Interest income .......................... (148) (61) (276) (74) Other income, net ...................... (47) (36) (76) (76) 1,294 1,069 2,666 2,058 Income (loss) from continuing operations before income taxes.......................... 214 (179) 129 (76) Income tax expense (benefit) .... 43 (69) (43) (30) Income (loss) from continuing operations............. 171 (110) 172 (46) Income from discontinued operations, net of income taxes.......................... - 819 - 949 Net income ................................ $ 171 709 172 903 Basic earnings (loss) per share: Income (loss) from continuing operations.......... $ .05 (.03) .05 (.01) Income from discontinued operations...... - .20 - .22 Net income............................. $ .05 .17 .05 .21 Diluted earnings (loss) per share: Income (loss) from continuing operations.......... $ .05 (.03) .05 (.01) Income from discontinued operations...... - .19 - .22 Net income............................. $ .05 .16 .05 .21 Weighted average shares outstanding................. 3,495,389 4,272,629 3,514,088 4,269,871 Dilutive effect of stock options .......................... 7,190 61,017 7,569 55,511 Weighted average shares outstanding assuming dilution ................... 3,502,579 4,333,646 3,521,657 4,325,382
See accompanying notes to consolidated financial statements.
3

Item 1. Financial Statements (Continued) Paragon Technologies, Inc. and Subsidiary Consolidated Statements of Cash Flows (Unaudited) For the Six Months Ended June 30, 2006 and 2005 (In Thousands, Except Share Data)
Six Months Ended
June 30,
2006 June, 30,
2005 Cash flows from operating activities: Net income........................................................... $ 172 903 Less: Income from discontinued operations ....... - 949 Income (loss) from continuing operations............ 172 (46) Adjustments to reconcile net income to net cash provided (used) by operating activities: Depreciation of plant and equipment ............ 47 42 Loss on disposition of equipment.................. 2 - Deferred tax expenses .................................. 14 80 Amortization of deferred gain on sale- leaseback ................................................... (83) (83) Stock-based compensation........................... 18 9 Change in operating assets and liabilities: Receivables ............................................ 393 (414) Costs and estimated earnings in excess of billings ................................. 46 (325) Inventories .............................................. (233) (10) Prepaid expenses and other current assets ...................................... 84 52 Accounts payable ................................... 56 556 Customers’ deposits and billings in excess of costs and estimated earnings............................................... (179) 267 Accrued salaries, wages, and commissions........................................ 46 50 Income taxes payable............................. (59) 148 Accrued product warranty....................... 60 (203) Accrued other liabilities........................... (19) 13 Net cash provided by operating activities of discontinued operations ......................... - 1,048 Net cash provided by operating activities............................................ 365 1,184 Cash flows from investing activities: Proceeds from sales of short-term investments....................................................... 4,210 250 Purchases of short-term investments .................. (500) (400) Purchases of property, plant and equipment....... (97) (77) Net cash used by investing activities of discontinued operations................................ - (243) Net cash provided (used) by investing activities ............................................................ 3,613 (470)
See accompanying notes to consolidated financial statements.
4

Item 1. Financial Statements (Continued) Paragon Technologies, Inc. and Subsidiary Consolidated Statements of Cash Flows (Unaudited) (Continued) For the Six Months Ended June 30, 2006 and 2005 (In Thousands, Except Share Data)
Six Months Ended
June 30,
2006 June 30,
2005 Cash flows from financing activities: Sale of common shares in connection with employee incentive stock option plan.............. - 160 Repurchase and retirement of common stock.................................................. (1,861) - Net cash provided (used) by financing activities ..................................... (1,861) 160 Increase in cash and cash equivalents.............................................. 2,117 874 Cash and cash equivalents, beginning of period .......................................... 687 1,702 Cash and cash equivalents, end of period.................................................... $ 2,804 2,576 Supplemental disclosures of cash flow information: Cash paid (received) during the period for: Interest ...................................................... $ 1 1 Income taxes............................................. $ (371) 62
See accompanying notes to consolidated financial statements.
5

Item 1. Financial Statements (Continued) Paragon Technologies, Inc. and Subsidiary Notes To Consolidated Financial Statements (Unaudited) For the Three and Six Months Ended June 30, 2006 and 2005 (1) In the opinion of the management of Paragon Technologies, Inc. (“Paragon” or the
“Company”), the unaudited interim financial statements furnished reflect all adjustments and accruals that are necessary to present a fair statement of results for the interim periods. The comparative financial information for the period ended June 30, 2005 includes the accounts of the Company and Ermanco Incorporated ("Ermanco"), a wholly owned subsidiary company that was sold on August 5, 2005, after elimination of intercompany balances and transactions. Certain prior year amounts have been reclassified to conform to the current year’s presentation. Results for interim periods are not necessarily indicative of results expected for the full fiscal year. This quarterly report should be read in conjunction with, and is qualified in its entirety by reference to, the Consolidated Financial Statements of the Company and the related Notes thereto appearing in our annual report on Form 10-K for the year ended December 31, 2005 as filed with the Securities and Exchange Commission on March 30, 2006. Refer to the Company's annual report on Form 10-K for the year ended December 31, 2005 for more complete financial information. See Discontinued Operations – Sale of Ermanco in Note 2 of the Notes to Consolidated Financial Statements for further information regarding the sale of substantially all of the assets and liabilities of Ermanco.
Use of Estimates The preparation of the financial statements, in conformity with U.S. generally
accepted accounting principles, requires management to make estimates and assumptions that affect the amounts reported in the financial statements and accompanying notes. Actual results could differ from those estimates. The judgments made in assessing the appropriateness of the estimates and assumptions utilized by management in the preparation of the financial statements are based on historical and empirical data and other factors germane to the nature of the risk being analyzed. Materially different results may occur if different assumptions or conditions were to prevail. Estimates and assumptions are mainly utilized to establish the appropriateness of the inventory reserve, warranty reserve, and revenue recognition.
(2) Discontinued Operations — Sale of Ermanco On May 20, 2005, the Company and Ermanco entered into an Asset Purchase
Agreement (the “Asset Purchase Agreement”) with TGW Transportgeräte GmbH, an Austrian corporation (“Buyer Parent”), and Malibu Acquisition, Inc., a Michigan corporation and wholly owned subsidiary of Buyer Parent (“Buyer”), pursuant to which Paragon agreed to sell to Buyer substantially all of the assets and liabilities of Ermanco, Paragon’s conveyor and sortation subsidiary located in Spring Lake, Michigan. The terms of the Asset Purchase Agreement provided that Buyer pay cash in the amount of $23 million (subject to a working capital adjustment and an accounts receivable adjustment) and assume certain liabilities of Ermanco, as more fully described in the Asset Purchase Agreement, a copy of which was filed as an attachment to the Company’s definitive proxy statement with the Securities and Exchange Commission on July 1, 2005. At a Special Meeting of Stockholders held on August 3, 2005, the Company received approval from its stockholders to sell substantially all of the assets and liabilities of Ermanco.
On August 5, 2005, the Company completed the sale of substantially all of the assets
and liabilities of Ermanco, and received cash consideration of $23,055,000 (subject to a working capital adjustment and an accounts receivable adjustment). Transaction costs associated with the sale of the assets and liabilities of Ermanco were approximately $1,038,000. During the fourth quarter of 2005, the Company paid approximately $448,000 to the Buyer in connection with the working capital
6

Item 1. Financial Statements (Continued) Paragon Technologies, Inc. and Subsidiary Notes To Consolidated Financial Statements (Unaudited) For the Three and Six Months Ended June 30, 2006 and 2005 adjustment and $61,000 in connection with the accounts receivable adjustment.
Therefore, the Company received cash consideration of $21,508,000, net of transactions costs and the working capital and accounts receivable adjustments in connection with the sale of the assets and liabilities of Ermanco, thereby resulting in a pre-tax loss on the sale of approximately $964,000.
Ermanco and Paragon indemnified the Buyer and Buyer Parent for, among other
things, a breach of any representation, warranty, covenant, or agreement set forth under the terms of the Asset Purchase Agreement. Paragon and Ermanco will have no liability to Buyer or Buyer Parent with respect to claims for breaches of representations and/or warranties until the aggregate amount of loss relating to such breaches exceeds $230,000, and then only for such amount that exceeds $230,000. The overall aggregate indemnification liability of Paragon and Ermanco shall not exceed $5,750,000. At the closing of the asset sale, Paragon delivered to the Buyer an irrevocable letter of credit in the amount of $2 million as security for its indemnification obligations. The letter of credit remained in place through August 4, 2006, the one-year anniversary of the closing of the asset sale. There was no claim under the letter of credit during its existence.
Ermanco and Paragon agreed that for a period of 3 years following the closing of the
transaction, each will not solicit any employee, customer, or supplier of Buyer to leave Buyer’s employment or alter its business dealings with the Buyer.
The results of operations for Ermanco’s business activities are reported as a
discontinued operation. The following are the condensed results of operations for Ermanco for the three and six months ended June 30, 2005 (in thousands):
Three Months
Ended Six Months
Ended June 30, 2005 June 30, 2005
Net sales ............................................................ $ 14,958 21,400 Income from operations before income taxes .................................................. $ 1,277 1,481 Income tax expense ........................................... 458 532 Income from discontinued operations, net of income taxes ........................................ $ 819 949 (3) Short-Term Investments The Company’s short-term investments are comprised of a certificate of deposit and
debt securities, all classified as trading, that are carried at cost, which approximates fair value of the investments at period end. The debt securities include state and municipal bonds, are on deposit with a major financial institution, and are supported by letters of credit.
7
Item 1. Financial Statements (Continued) Paragon Technologies, Inc. and Subsidiary Notes To Consolidated Financial Statements (Unaudited) For the Three and Six Months Ended June 30, 2006 and 2005 (4) Accrued Product Warranty The Company’s products are warranted against defects in materials and
workmanship for varying periods of time depending on customer requirements and the type of system sold, with a typical warranty period of one year. The Company provides an accrual for estimated future warranty costs and potential product liability claims based upon a percentage of cost of sales, typically two percent of the cost of the system being sold, and a detailed review of products still in the warranty period is performed each quarter.
A roll-forward of warranty activities is as follows (in thousands):
Beginning Balance
January 1
Additions (Reductions) Charged to Costs and Expenses Deductions
Ending Balance June 30
2006 ......................... $ 189 91 31 249 2005 ......................... $ 490 (163) 40 287 (5) Business Operations
Company Overview Paragon provides a variety of material handling solutions, including systems,
technologies, products, and services for material flow applications. The Company’s capabilities include horizontal transportation, rapid dispensing, order fulfillment, computer software, sortation, integrating conveyors and conveyor systems, and aftermarket services.
The Company’s Easton, Pennsylvania operation (hereafter referred to as "SI Systems") is a specialized systems integrator supplying SI Systems’ branded automated material handling systems to manufacturing, assembly, order fulfillment, and distribution operations customers located primarily in North America, including the U.S. government. SI Systems is brought to market as two individual brands, SI Systems’ Order Fulfillment Systems (hereafter referred to as “SI Systems OFS”) and SI Systems’ Production & Assembly Systems (hereafter referred to as “SI Systems PAS”). Each brand has its own focused sales force, utilizing the products and services currently available or under development within the Company.
The SI Systems OFS sales force focuses on providing order fulfillment systems to order processing and distribution operations, which may incorporate the Company’s proprietary DISPEN-SI-MATIC® and automated order fulfillment solutions and specialized software from the SINTHESIS™ Software Suite. SINTHESIS™ is comprised of eight proprietary software groups, with 26 extendible software modules that continually assess real-time needs and deploy solutions to accurately facilitate and optimize planning, warehousing, inventory, routing, and order fulfillment within the distribution process. The SI Systems PAS sales force focuses on providing automated material handling systems to manufacturing and assembly operations and the U.S. government, which may incorporate the Company’s proprietary LO-TOW® and CARTRAC® horizontal transportation technologies.
8
Item 1. Financial Statements (Continued) Paragon Technologies, Inc. and Subsidiary Notes To Consolidated Financial Statements (Unaudited) For the Three and Six Months Ended June 30, 2006 and 2005 The Company’s automated material handling systems are marketed, designed, sold,
installed, and serviced by its own staff or subcontractors as labor-saving devices to improve productivity, quality, and reduce costs. The Company’s integrated material handling solutions involve both standard and specially designed components and include integration of non-proprietary automated handling technologies so as to provide turnkey solutions for its customers' unique material handling needs. The Company’s engineering staff develops and designs computer control programs required for the efficient operation of the systems and for optimizing manufacturing, assembly, and fulfillment operations.
Following the sale of Ermanco, the Company has continued to review opportunities with the goal of maximizing resources, increasing stockholder value, and considering strategies and transactions intended to provide liquidity. At this time, the Company believes that an increase in stockholder value will be best obtained through a redeployment of assets from Ermanco to the Company’s remaining business, through increases in the Company’s internal technology base, strengthening the Company’s sales and marketing capabilities, growth of the Company’s continuing operations and other higher growth markets, in particular, by the enhancement of the Company’s products with advanced proprietary software capabilities through research and development efforts and/or possible acquisitions, mergers, and joint ventures. Although the Company enters into preliminary discussions and non-disclosure agreements from time to time, the Company does not have any material definitive agreements in place. There is no assurance that the Company will be able to consummate any such acquisition at all or an acquisition on terms that the Company would consider reasonable.
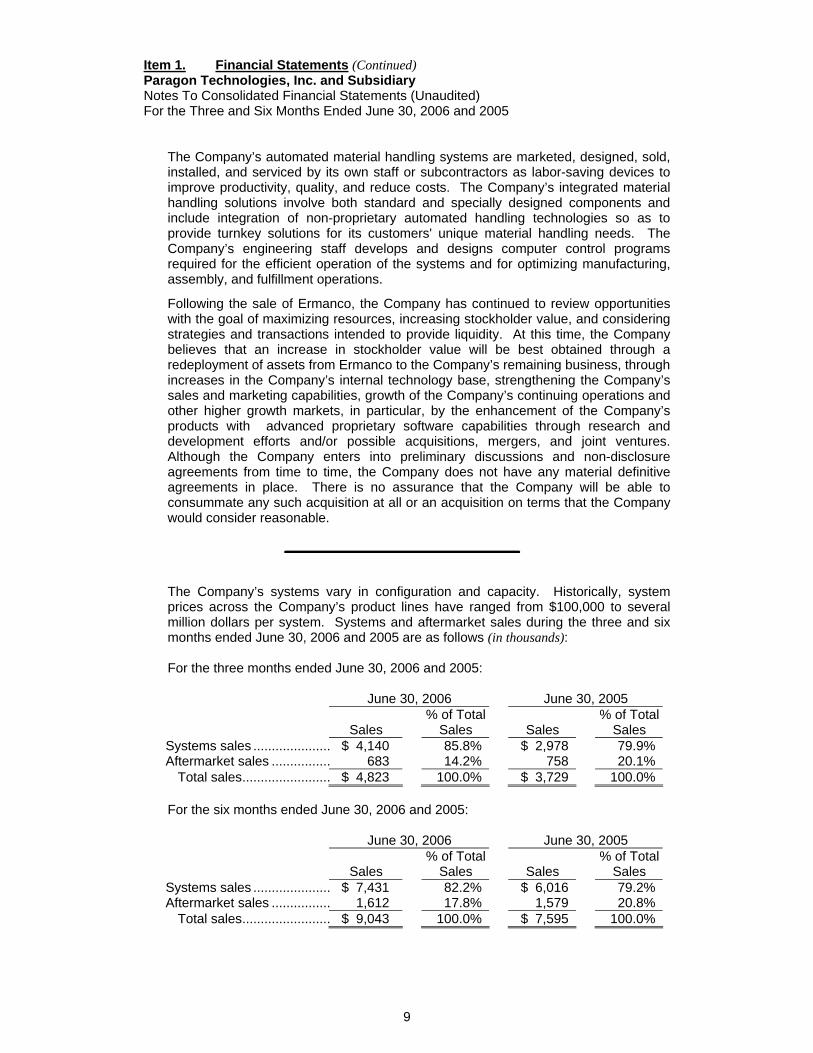
The Company’s systems vary in configuration and capacity. Historically, system
prices across the Company’s product lines have ranged from $100,000 to several million dollars per system. Systems and aftermarket sales during the three and six months ended June 30, 2006 and 2005 are as follows (in thousands):
For the three months ended June 30, 2006 and 2005:
June 30, 2006 June 30, 2005
Sales % of Total
Sales Sales % of Total
Sales Systems sales ..................... $ 4,140 85.8% $ 2,978 79.9% Aftermarket sales ................ 683 14.2% 758 20.1% Total sales........................ $ 4,823 100.0% $ 3,729 100.0%
For the six months ended June 30, 2006 and 2005:
June 30, 2006 June 30, 2005
Sales % of Total
Sales Sales % of Total
Sales Systems sales ..................... $ 7,431 82.2% $ 6,016 79.2% Aftermarket sales ................ 1,612 17.8% 1,579 20.8% Total sales........................ $ 9,043 100.0% $ 7,595 100.0%
9

Item 1. Financial Statements (Continued) Paragon Technologies, Inc. and Subsidiary Notes To Consolidated Financial Statements (Unaudited) For the Three and Six Months Ended June 30, 2006 and 2005 The Company’s products are sold worldwide through its own sales personnel.
Domestic and international sales during the three and six months ended June 30, 2006 and 2005 are as follows (in thousands):
For the three months ended June 30, 2006 and 2005:
June 30, 2006 June 30, 2005
Sales % of Total
Sales Sales % of Total
Sales
Domestic sales.................... $ 4,712 97.7% $ 3,679 98.7% International sales ............... 111 2.3% 50 1.3% Total sales........................ $ 4,823 100.0% $ 3,729 100.0%
For the six months ended June 30, 2006 and 2005:
June 30, 2006 June 30, 2005
Sales % of Total
Sales Sales % of Total
Sales
Domestic sales.................... $ 8,901 98.4% $ 7,053 92.9% International sales ............... 142 1.6% 542 7.1% Total sales........................ $ 9,043 100.0% $ 7,595 100.0%
All of the Company’s sales originate in the United States, and there are no long-lived
assets existing outside the United States. The Company’s backlog of orders at June 30, 2006 and June 30, 2005 were
$8,292,000 and $7,773,000, respectively. The Company’s business is largely dependent upon a limited number of large
contracts with a limited number of customers. This dependence can cause unexpected fluctuations in sales volume. Various external factors affect the customers’ decision-making process on expanding or upgrading their current production or distribution sites. The customers’ timing and placement of new orders is often affected by factors such as the current economy, current interest rates, and future expectations. The Company believes that its business is not subject to seasonality, although the rate of new orders can vary substantially from month to month. Since the Company recognizes sales on a percentage of completion basis for its systems contracts, fluctuations in the Company's sales and earnings occur with increases or decreases in major installations.
(6) Recently Issued Accounting Pronouncements In November 2004, the Financial Accounting Standards Board issued SFAS No. 151,
“Inventory Costs an Amendment of ARB No. 43, Chapter 4” (“FAS 151”). FAS 151 provides for certain fixed production overhead cost to be reflected as a period cost and not capitalized as inventory. FAS 151 is effective for the beginning of 2006. The adoption of FAS 151 did not have a material impact on the Company’s financial statements.
10

Item 1. Financial Statements (Continued) Paragon Technologies, Inc. and Subsidiary Notes To Consolidated Financial Statements (Unaudited) For the Three and Six Months Ended June 30, 2006 and 2005 In December 2004, the Financial Accounting Standards Board issued SFAS No. 123
(revised) “Share-Based Payment” (“FAS 123R”). FAS 123R addresses all forms of share-based payment awards, including shares issued under employee stock purchase plans, stock options, restricted and nonvested stock, and stock appreciation rights. It requires companies to recognize in the statement of operations the grant-date fair value of stock options and other equity-based compensation issued to employees. The statement eliminates the intrinsic value-based method prescribed by APB Opinion No. 25, Accounting for Stock Issued to Employees, and related interpretations, that the Company used prior to January 1, 2006. The Company adopted FAS 123R on January 1, 2006.
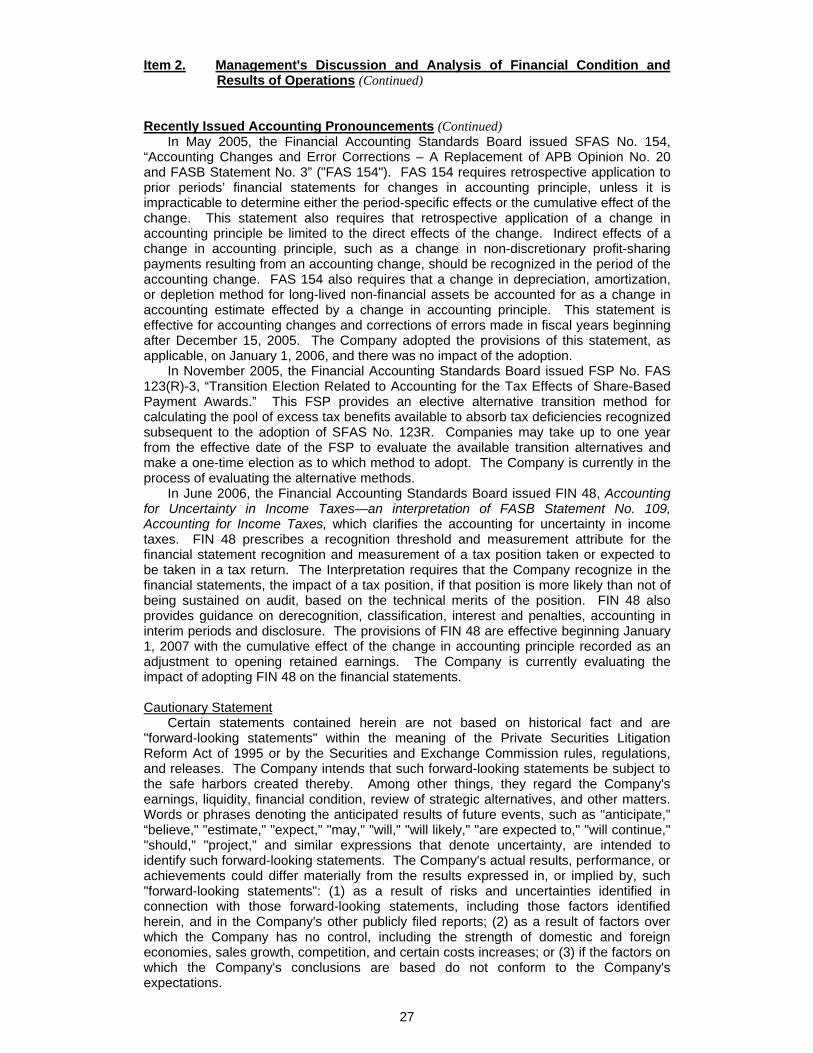
In May 2005, the Financial Accounting Standards Board issued SFAS No. 154,
“Accounting Changes and Error Corrections – A Replacement of APB Opinion No. 20 and FASB Statement No. 3” ("FAS 154"). FAS 154 requires retrospective application to prior periods’ financial statements for changes in accounting principle, unless it is impracticable to determine either the period-specific effects or the cumulative effect of the change. This statement also requires that retrospective application of a change in accounting principle be limited to the direct effects of the change. Indirect effects of a change in accounting principle, such as a change in non-discretionary profit-sharing payments resulting from an accounting change, should be recognized in the period of the accounting change. FAS 154 also requires that a change in depreciation, amortization, or depletion method for long-lived non-financial assets be accounted for as a change in accounting estimate effected by a change in accounting principle. This statement is effective for accounting changes and corrections of errors made in fiscal years beginning after December 15, 2005. The Company adopted the provisions of this statement, as applicable, on January 1, 2006, and there was no impact of the adoption.
In November 2005, the Financial Accounting Standards Board issued FSP No. FAS
123(R)-3, “Transition Election Related to Accounting for the Tax Effects of Share-Based Payment Awards.” This FSP provides an elective alternative transition method for calculating the pool of excess tax benefits available to absorb tax deficiencies recognized subsequent to the adoption of SFAS No. 123R. Companies may take up to one year from the effective date of the FSP to evaluate the available transition alternatives and make a one-time election as to which method to adopt. The Company is currently in the process of evaluating the alternative methods.
In June 2006, the Financial Accounting Standards Board issued FIN 48, Accounting
for Uncertainty in Income Taxes—an interpretation of FASB Statement No. 109, Accounting for Income Taxes, which clarifies the accounting for uncertainty in income taxes. FIN 48 prescribes a recognition threshold and measurement attribute for the financial statement recognition and measurement of a tax position taken or expected to be taken in a tax return. The Interpretation requires that the Company recognize in the financial statements, the impact of a tax position, if that position is more likely than not of being sustained on audit, based on the technical merits of the position. FIN 48 also provides guidance on derecognition, classification, interest and penalties, accounting in interim periods and disclosure. The provisions of FIN 48 are effective beginning January 1, 2007 with the cumulative effect of the change in accounting principle recorded as an adjustment to opening retained earnings. The Company is currently evaluating the impact of adopting FIN 48 on the financial statements.
11

Item 1. Financial Statements (Continued) Paragon Technologies, Inc. and Subsidiary Notes To Consolidated Financial Statements (Unaudited) For the Three and Six Months Ended June 30, 2006 and 2005 (7) Sale-Leaseback The Company’s principal office is located in a 173,000 square foot, concrete, brick,
and steel facility in Easton, Pennsylvania. In connection with the February 2003 sale of the Company’s Easton, Pennsylvania facility, the Company entered into a leaseback arrangement for 25,000 square feet of office space for five years. The leasing agreement requires fixed monthly rentals of $18,781 (with annual increases of 3%). The terms of the lease also require the payment of a proportionate share of the facility’s operating expenses. The leasing agreement is secured with a $200,000 letter of credit. The lease expires on February 21, 2008. In accordance with SFAS No. 13 and SFAS No. 28, the leaseback does not meet the criteria for classification as a capital lease; hence, it is classified as an operating lease. The sale-leaseback resulted in a total gain of $2,189,000, of which $1,363,000 was recorded as a gain in 2003. The seller-lessee (Company) retained more than a minor part (25,000 square feet) but less than substantially all of the use of the property (173,000 square feet) through the leaseback and realized a profit on the sale in excess of the present value of the minimum lease payments over the lease term. The present value of the stream of lease payments utilizing the Company’s incremental borrowing rate of 10.0% was $826,000. The $826,000 of deferred profit is amortized in equal amounts as a reduction in rent expense over the five-year term of the lease. During the three months ended June 30, 2006 and 2005, $41,000 and $41,000, respectively, of the deferred gain was recognized. During the six months ended June 30, 2006 and 2005, $83,000 and $83,000, respectively, of the deferred gain was recognized.
(8) Line of Credit The Company has a line of credit facility which may not exceed $5,000,000 and is to
be used primarily for working capital purposes. Interest on the line of credit facility is at the LIBOR Market Index Rate plus 1.4%. Effective August 5, 2005 the Company issued a $2,000,000 letter of credit in connection with the sale of substantially all of the assets and liabilities of Ermanco, thereby reducing the amount of available line of credit to $2,800,000. The letter of credit remained in place through August 4, 2006, the one-year anniversary of the closing of the asset sale. There was no usage under the letter of credit during its existence. As of August 5, 2006, the amount of available line of credit was $4,800,000. As of June 30, 2006, the Company did not have any borrowings under the line of credit facility, and the line of credit facility expires effective June 30, 2007.
The line of credit facility contains various non-financial covenants and is secured by
all accounts receivables and inventory. The Company was in compliance with all covenants as of June 30, 2006.
(9) Stock Repurchase Program On August 12, 2004, the Company’s Board of Directors approved a program to
repurchase up to $1,000,000 of its outstanding common stock. The Company’s Board of Directors amended its existing stock repurchase program on several occasions during 2005 and in 2006 by increasing the amount it has authorized management to repurchase from up to $1,000,000 of the Company’s common stock to up to $12,000,000. There were no repurchases during the three months ended March 31, 2006. During the three and six months ended June 30, 2006, the Company repurchased 209,519 shares of common stock at a weighted average cost, including brokerage commissions, of $8.88 per share. Cash expenditures for the stock repurchases during the three and six months ended June 30, 2006 were $1,861,470. Through June 30, 2006, the Company repurchased 1,068,319 shares of
12

Item 1. Financial Statements (Continued) Paragon Technologies, Inc. and Subsidiary Notes To Consolidated Financial Statements (Unaudited) For the Three and Six Months Ended June 30, 2006 and 2005 common stock at a weighted average cost, including brokerage commissions, of
$9.61 per share. Cash expenditures for the stock repurchases since the inception of the program were $10,267,984. As of June 30, 2006, $1,732,016 remained available for repurchases under the stock repurchase program. Based on market conditions and other factors, additional repurchases may be made from time to time, in compliance with SEC regulations, in the open market or through privately negotiated transactions at the discretion of the Company. There is no expiration date with regards to the stock repurchase program. The purchase price for the shares of the Company’s common stock repurchased was reflected as a reduction to stockholders’ equity. The Company allocates the purchase price of the repurchased shares as a reduction to common stock for the par value of the shares repurchased, with the excess of the purchase price over par value being allocated between additional paid-in capital and retained earnings. All shares of common stock that were repurchased by the Company since the inception of the program were subsequently retired.
In July 2006, the Company’s Board of Directors amended its existing stock
repurchase program by increasing the amount it has authorized management to repurchase from up to $12,000,000 of the Company’s common stock to up to $14,000,000, of which approximately $2,515,619 remains available for repurchases under the stock repurchase program.
(10) Stock-Based Compensation Effective January 1, 2006, the Company adopted SFAS No. 123R and related
interpretations and began expensing the grant-date fair value of employee stock options over the related requisite service period. Prior to January 1, 2006, the Company applied Accounting Principles Board (APB) Opinion No. 25, “Accounting for Stock Issued to Employees,” and related interpretations in accounting for its stock option plans. Accordingly, no compensation expense was recognized in net income for employee stock options, as options granted had an exercise price equal to the market value of the underlying common stock on the date of grant. The Company recognized compensation expense on options granted to non-employee directors. The estimated impact of adopting SFAS No. 123R in 2006 is approximately $7,000 and is not expected to have a significant impact on basic and diluted earnings per share for the year. The pro forma impact of expensing employee stock options in 2005 would have been $27,000 or a reduction of basic and diluted earnings per share by approximately $.01 for the year based on the disclosures required by SFAS No. 123.
The Company adopted SFAS No. 123R using the modified prospective transition
method and therefore has not restated prior periods. Under this transition method, compensation cost associated with employee stock options recognized in 2006 includes attribution of the fair value related to the remaining unvested portion of stock option awards granted prior to January 1, 2006, and attribution related to new awards granted after January 1, 2006.
The expense associated with stock-based compensation arrangements is a non-cash
charge. In the Consolidated Statements of Cash Flows, stock-based compensation expense is an adjustment to reconcile net income to cash provided (used) by operating activities.
13

Item 1. Financial Statements (Continued) Paragon Technologies, Inc. and Subsidiary Notes To Consolidated Financial Statements (Unaudited) For the Three and Six Months Ended June 30, 2006 and 2005 Prior to the adoption of SFAS No. 123R, the Company presented tax benefits, if any,
resulting from stock-based compensation as operating cash flows in the Consolidated Statements of Cash Flows. SFAS No. 123R requires that certain cash flows resulting from tax deductions in excess of compensation cost recognized in the financial statements be classified as financing cash flows. For the first six months of 2006, no excess tax benefits were generated.
SFAS No. 123R modified the disclosure requirements related to stock-based
compensation. Accordingly, the disclosures prescribed by SFAS No. 123R are included below.
For stock options granted prior to the adoption of SFAS No. 123R, the effect on net
income and earnings per share if the Company had applied the fair value recognition provisions of SFAS No. 123, “Accounting for Stock-Based Compensation,” to its stock option plan would have been as follows:
Three Months Ended
June 30, 2005
Six Months Ended
June 30, 2005 Net income, as reported ......................................... $ 709 $ 903 Deduct: total stock-based employee compensation expense determined under fair value based method, net of related tax effects.... (11) (22) Pro forma net income ............................................. $ 698 $ 881 Basic earnings per share: As reported .......................................................... $ .17 $ .21 Pro forma ............................................................. $ .16 $ .21 Diluted earnings per share: As reported .......................................................... $ .16 $ .21 Pro forma ............................................................. $ .16 $ .20 In November 2005, the FASB issued FSP No. FAS 123(R)-3, “Transition Election
Related to Accounting for the Tax Effects of Share-Based Payment Awards.” This FSP provides an elective alternative transition method for calculating the pool of excess tax benefits available to absorb tax deficiencies recognized subsequent to the adoption of SFAS No. 123R. Companies may take up to one year from the effective date of the FSP to evaluate the available transition alternatives and make a one-time election as to which method to adopt. The Company is currently in the process of evaluating the alternative methods.
1997 Equity Compensation Plan The Company has a stock-based compensation program, the 1997 Equity
Compensation Plan (“ECP”), which will expire in July 2007. The ECP provides for grants of stock options, restricted and nonvested stock, and stock appreciation rights to selected key employees, key advisors who perform valuable services, and directors of the Company. In addition, the ECP provides for grants of performance units to employees and key advisors. The ECP, as amended by stockholders in August 2000 and June 2001, authorizes up to 1,012,500 shares of common stock for issuance pursuant to the terms of the plan. Under the Company’s ECP, officers, directors, and key employees have been granted options to purchase shares of common stock at the market price at the date of grant. Options become exercisable
14

Item 1. Financial Statements (Continued) Paragon Technologies, Inc. and Subsidiary Notes To Consolidated Financial Statements (Unaudited) For the Three and Six Months Ended June 30, 2006 and 2005 in increments of 25% on the anniversary date of the grant; thus, at the end of four
years, the options are fully exercisable. Vested stock option awards may be exercised through payment of cash, exchange of mature shares, or through a broker. As of June 30, 2006, 51,035 options are outstanding under the plan, and all options have a term of five or seven years.
The compensation cost charged against income during the three and six months
ended June 30, 2006 for stock-based compensation programs was $10,000 and $18,000, respectively. Stock-based compensation costs during the three and six months ended June 30, 2006 consisted of expensing $2,000 and $3,000, respectively, for employee stock options, and $0 and $4,000, respectively, for directors’ stock options, and $8,000 and $11,000, respectively, for nonvested stock. All of the compensation cost recognized was a component of selling, general and administrative expenses.
Stock Options On March 8, 2006, the Board of Directors of the Company granted 12,500 stock
options to its executive officers. The fair value of options granted in the first quarter of 2006 was estimated using the Black Scholes option valuation model that used the assumptions noted in the table below. Expected volatility and expected dividend yield are based on actual historical experience of the Company’s stock and dividends over the historical period equal to the option term. The dividend yield on the Company’s common stock is assumed to be zero since the Company has not paid any cash dividends since 1999 and has no present intention to declare cash dividends. The expected life represents the period of time that options granted are expected to be outstanding and was calculated using the simplified method. The assumptions given below results from certain groups of employees exhibiting different behavior. Separate groups of employees that have similar historical exercise behavior were considered separately for valuation purposes. The Company does not expect to have any forfeitures of its recent stock option awards based on the historical experience of the group of employees that received the stock option awards. The risk-free rate is based on the U. S. Treasury Securities with terms equal to the expected time of exercise as of the grant date.
Expected volatility ............................................................... 18.0% Expected dividend yield ...................................................... 0.0% Expected life (in years)........................................................ 4.75 Risk-free interest rate.......................................................... 4.75%
The grant-date fair value of options granted during the first quarter of 2006 was $2.60
per option.
15

Item 1. Financial Statements (Continued) Paragon Technologies, Inc. and Subsidiary Notes To Consolidated Financial Statements (Unaudited) For the Three and Six Months Ended June 30, 2006 and 2005 A summary of stock option activity is presented below:
Options
Weighted Average Exercise
Price
Weighted Average
Remaining Contractual
Term (In Years)
Aggregate Intrinsic Value
Outstanding at January 1, 2006........ 38,535 $ 7.86 Granted........................................... 12,500 10.01 Exercised........................................ - - Forfeited.......................................... - - Outstanding at June 30, 2006 ........... 51,035 $ 8.39 2.1 $ 128,000 Exercisable at June 30, 2006............ 38,535 $ 7.86 .5 $ 95,000
There were no stock options exercised during the three and six months ended June
30, 2006. The compensation cost charged against income during the three and six months ended June 30, 2006 for stock options was $2,000 and $7,000, respectively. Compensation cost is recognized on a straight-line basis over the stated vesting period consistent with the terms of the arrangement.
As of December 31, 2005, there were no unvested employee stock options.
Therefore, no compensation cost related to stock options granted to employees prior to January 1, 2006 will be recognized.
Nonvested Stock The grant-date fair value of nonvested stock is determined on the date of grant based
on the market price of the stock, and compensation cost is generally amortized to expense on a straight-line basis over the vesting period during which employees perform related services.
On March 8, 2006, the Company issued 12,500 shares of nonvested stock to its
executive officers. Participants are entitled to cash dividends and to vote their respective shares. The shares are subject to forfeiture if employment is terminated prior to March 8, 2010.
A summary of restricted stock activity is presented below:
Restricted
Shares Grant Date Fair Value
Nonvested at January 1, 2006.................................... - $ - Granted ................................................................... 12,500 10.01 Vested ..................................................................... - - Forfeited .................................................................. - - Nonvested at June 30, 2006....................................... 12,500 $ 10.01
The compensation cost charged against income during the three and six months ended June 30, 2006 for restricted stock awards was $8,000 and $11,000, respectively. The total compensation cost is expected to be recognized over the four-year vesting period.
16

Item 1. Financial Statements (Continued) Paragon Technologies, Inc. and Subsidiary Notes To Consolidated Financial Statements (Unaudited) For the Three and Six Months Ended June 30, 2006 and 2005 (11) Income Taxes Deferred tax assets and liabilities are recognized for the future tax consequences
attributable to differences between the financial statement carrying amounts of existing assets and liabilities and their respective tax bases. Deferred tax assets and liabilities are measured using enacted tax rates expected to apply to taxable income in the years in which those temporary differences are expected to be recovered or settled. The effect on deferred tax assets and liabilities of a change in tax rates is recognized in income in the period that includes the enactment date.
The Company recognized income tax expense of $43,000 and an income tax benefit
of $43,000, respectively, during the three and six months ended June 30, 2006 compared to an income tax benefit of $69,000 and $30,000, respectively, during the three and six months ended June 30, 2005. Income tax expense for the three months ended June 30, 2006 was lower than the statutory federal and state tax rates due primarily to tax-exempt interest on certain investments, while the income tax benefit for the six months ended June 30, 2006 was higher than statutory federal and state tax rates due primarily to the reversal of accruals for the expiration of tax return statutes and tax-exempt interest on certain investments. The income tax benefit for the three and six months ended June 30, 2005 was generally recorded at statutory federal and state tax rates.
(12) Legal Proceedings The Company is involved in various claims and legal actions arising in the ordinary
course of business. In the opinion of management, the ultimate disposition of these matters will not have a material adverse effect on the Company's consolidated financial position, results of operations, or liquidity.
17

Item 2. Management's Discussion and Analysis of Financial Condition and Results of Operations
The following discussion and analysis of the Company’s financial condition and results of operations should be read in conjunction with the unaudited consolidated financial statements for the period ended June 30, 2006, and the cautionary statements and consolidated financial statements and related notes thereto included in the Company’s Annual Report on Form 10-K for the year ended December 31, 2005. The discussion and analysis contains “forward-looking statements” based on management’s current expectations, assumptions, estimates, and projections. These forward-looking statements involve risks and uncertainties. The Company’s actual results could differ materially from those included in these “forward-looking statements” as a result of risks and uncertainties, identified in connection with those forward-looking statements, including those factors identified herein, and in the Company’s other publicly filed reports.
Business Overview Paragon Technologies, Inc. provides a variety of material handling solutions, including systems, technologies, products, and services for material flow applications. Founded in 1958, the Company’s material handling solutions are based on core technologies in horizontal transportation and order fulfillment and are aimed at improving productivity for manufacturing, assembly, and distribution center operations. On August 5, 2005, the Company completed the sale of substantially all of the assets and liabilities of Ermanco, and received cash consideration of $23,055,000 (subject to a working capital adjustment and an accounts receivable adjustment). Transaction costs associated with the sale of the assets and liabilities of Ermanco were approximately $1,038,000. During the fourth quarter of 2005, the Company paid $448,000 to the Buyer in connection with the working capital adjustment and $61,000 in connection with the accounts receivable adjustment. Therefore, the Company received cash consideration of $21,508,000, net of transaction costs and the working capital and accounts receivable adjustments in connection with the sale of the assets and liabilities of Ermanco, thereby resulting in a pre-tax loss of approximately $964,000. See Note 2 of the Notes to Consolidated Financial Statements for further information regarding the sale of substantially all of the assets and liabilities of Ermanco. The discussion that follows reflects the operations of the Company following the sale of substantially all of the assets and liabilities of Ermanco.
18
Item 2. Management's Discussion and Analysis of Financial Condition and Results of Operations (Continued)
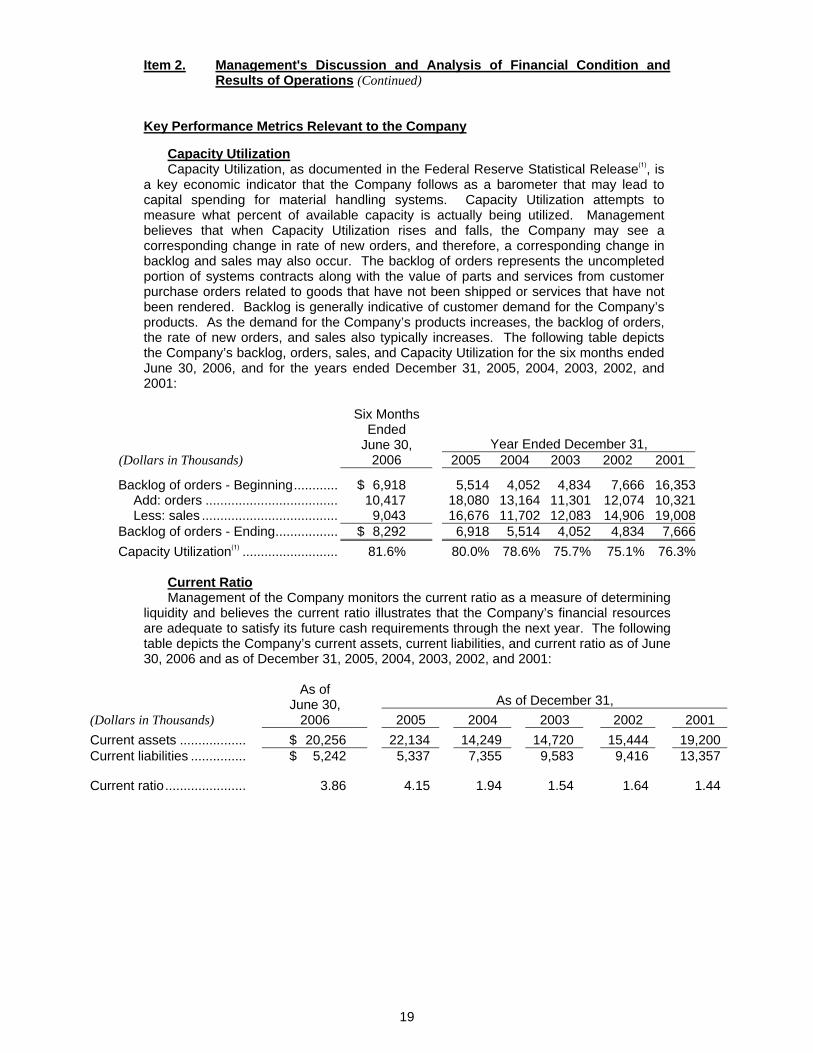
Key Performance Metrics Relevant to the Company Capacity Utilization Capacity Utilization, as documented in the Federal Reserve Statistical Release(1), is a key economic indicator that the Company follows as a barometer that may lead to capital spending for material handling systems. Capacity Utilization attempts to measure what percent of available capacity is actually being utilized. Management believes that when Capacity Utilization rises and falls, the Company may see a corresponding change in rate of new orders, and therefore, a corresponding change in backlog and sales may also occur. The backlog of orders represents the uncompleted portion of systems contracts along with the value of parts and services from customer purchase orders related to goods that have not been shipped or services that have not been rendered. Backlog is generally indicative of customer demand for the Company’s products. As the demand for the Company’s products increases, the backlog of orders, the rate of new orders, and sales also typically increases. The following table depicts the Company’s backlog, orders, sales, and Capacity Utilization for the six months ended June 30, 2006, and for the years ended December 31, 2005, 2004, 2003, 2002, and 2001:
Year Ended December 31, (Dollars in Thousands)
Six Months Ended
June 30, 2006 2005 2004 2003 2002 2001
Backlog of orders - Beginning............ $ 6,918 5,514 4,052 4,834 7,666 16,353 Add: orders .................................... 10,417 18,080 13,164 11,301 12,074 10,321 Less: sales ..................................... 9,043 16,676 11,702 12,083 14,906 19,008Backlog of orders - Ending................. $ 8,292 6,918 5,514 4,052 4,834 7,666Capacity Utilization(1) .......................... 81.6% 80.0% 78.6% 75.7% 75.1% 76.3%
Current Ratio Management of the Company monitors the current ratio as a measure of determining liquidity and believes the current ratio illustrates that the Company’s financial resources are adequate to satisfy its future cash requirements through the next year. The following table depicts the Company’s current assets, current liabilities, and current ratio as of June 30, 2006 and as of December 31, 2005, 2004, 2003, 2002, and 2001:
As of December 31, (Dollars in Thousands)
As of June 30,
2006 2005 2004 2003 2002 2001 Current assets .................. $ 20,256 22,134 14,249 14,720 15,444 19,200Current liabilities ............... $ 5,242 5,337 7,355 9,583 9,416 13,357 Current ratio...................... 3.86 4.15 1.94 1.54 1.64 1.44
19

Item 2. Management's Discussion and Analysis of Financial Condition and Results of Operations (Continued)
Debt to Equity Ratio With an emphasis over the past several years on generating cash flows to eliminate the Company’s senior and subordinated debt, the Company has eliminated its financial leverage as evidenced by its debt to equity ratio, which is the ratio of total debt to stockholders’ equity. Management believes the absence of debt provides greater protection for its stockholders and enhances the Company’s ability to obtain additional financing, if required. The following table illustrates the calculation of the debt to equity ratio as of June 30, 2006 and as of December 31, 2005, 2004, 2003, 2002, and 2001 and also includes the number of shares outstanding at the end of each fiscal period:
As of
June 30, As of December 31, (Dollars in Thousands) 2006 2005 2004 2003 2002 2001 Current installments of long-term debt ............. $ - - - - 1,437 2,305Long-term debt .............. - - - - 7,263 9,900Total debt....................... - - - - 8,700 12,205Total stockholders’ equity (1)...................... $ 15,395 17,066 23,308 22,061 17,885 16,912 Debt to equity ratio ........ - - - - .49 .72 Number of shares outstanding at the end of the fiscal period........................... 3,342,000 3,539,019 4,265,310 4,277,595 4,256,098 4,221,635
(1) During the year ended December 31, 2005, the Company repurchased 824,100
shares of common stock at a weighted average cost, including brokerage commissions, of $9.81 per share. Cash expenditures for the stock repurchases during the year ended December 31, 2005 were $8,080,882. During the six months ended June 30, 2006, the Company repurchased 209,519 shares of common stock at a weighted average cost, including brokerage commissions, of $8.88 purchase. Cash expenditures for the stock repurchases during the six months ended June 30, 2006 were $1,861,470. See Stock Repurchase Program in Note 9 of the Notes to Consolidated Financial Statements regarding the Company’s Stock Repurchase Program.
Critical Accounting Policies and Estimates The discussion and analysis of our financial condition and results of operations are based upon our consolidated financial statements, which have been prepared in accordance with U.S. generally accepted accounting principles. The preparation of these financial statements requires us to make estimates and judgments that affect the reported amount of assets and liabilities, revenues and expenses, and other financial information, including the related disclosure of commitments and contingencies at the date of our financial statements. Actual results may, under different assumptions and conditions, differ significantly from our estimates. We believe that our accounting policies related to revenue recognition on system sales, warranty, and inventories are our “critical accounting policies.” These policies have been reviewed with the Audit Committee of the Board of Directors and are discussed in greater detail below.
20

Item 2. Management's Discussion and Analysis of Financial Condition and Results of Operations (Continued)
Revenue Recognition on Systems Sales Revenues on systems contracts, accounted for in accordance with SOP 81-1 of the American Institute of Certified Public Accountants, are recorded on the basis of the Company's estimates of the percentage of completion of individual contracts. Gross margin is recognized on the basis of the ratio of aggregate costs incurred to date to the most recent estimate of total costs. As contracts may extend over one or more years, revisions in cost and profit estimates during the course of the work are reflected in the accounting periods in which the facts requiring revisions become known. At the time a loss on a contract becomes known, the entire amount of the estimated ultimate loss is accrued. As of June 30, 2006, there are no contracts that are anticipated to result in a loss. The Company believes that it has the ability to reasonably estimate the total costs and applicable gross profit margins at the inception of the contract for all of its systems contracts. However, where cost estimates change, there could be a significant impact on the amount of revenue recognized. The Company’s failure to estimate accurately can result in cost overruns which will result in the loss of profits if the Company determines that it has significantly underestimated the costs involved in completing contracts. The Company has not had any significant cost overruns resulting in loss of profits during the three and six months ended June 30, 2006. Accrued Product Warranty The Company’s products are warranted against defects in materials and workmanship for varying periods of time depending on customer requirements and the type of system sold, with a typical warranty period of one year. The Company provides an accrual for estimated future warranty costs and potential product liability claims based upon a percentage of cost of sales, typically two percent of the cost of the system being sold, and a detailed review of products still in the warranty period is performed each quarter. Historically, the level of warranty reserve has been appropriate based on management’s assessment of estimated future warranty claims. However, if unanticipated warranty issues arise in the future, there could be a significant impact on the recorded warranty reserve. The recorded warranty reserve as of June 30, 2006 was $249,000. Inventories Inventories are valued at the lower of average cost or market. The Company provides an inventory reserve determined by a specific identification of individual slow moving items and other inventory items based on historical experience. The reserve is considered to be a write-down of inventory to a new cost basis. Upon disposal of inventory, the new cost basis is removed from the accounts.
21
Item 2. Management's Discussion and Analysis of Financial Condition and Results of Operations (Continued)
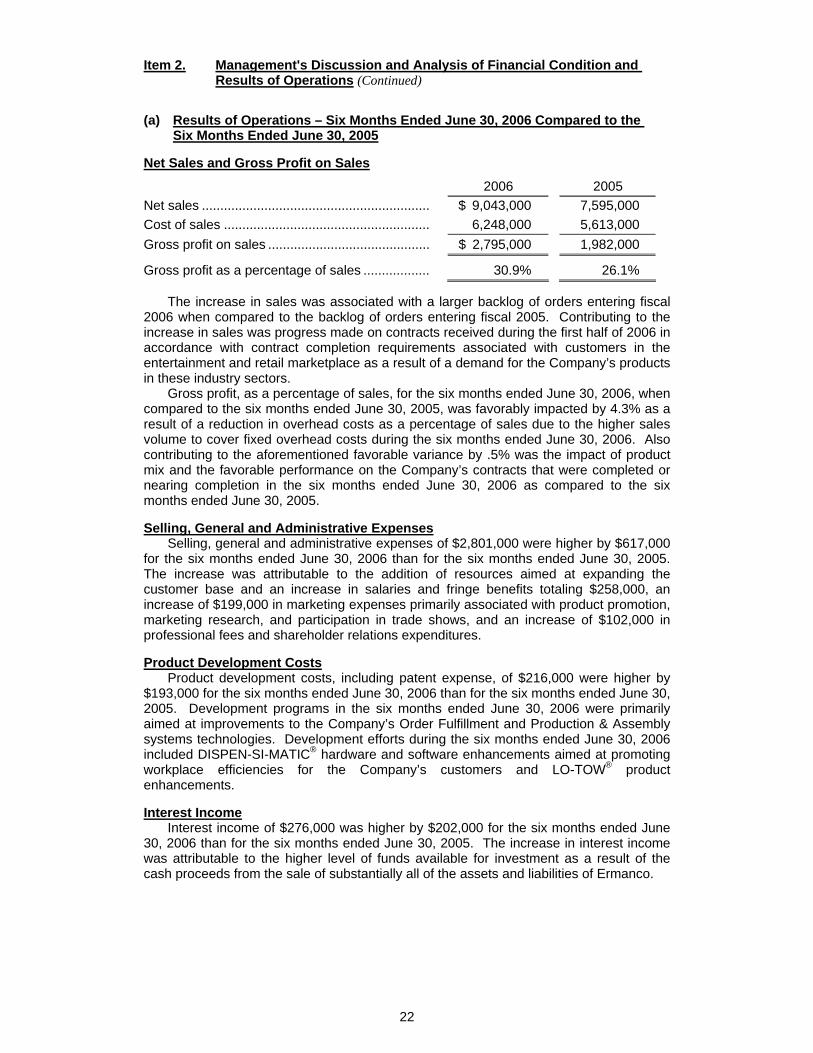
(a) Results of Operations – Six Months Ended June 30, 2006 Compared to the Six Months Ended June 30, 2005 Net Sales and Gross Profit on Sales
2006 2005 Net sales .............................................................. $ 9,043,000 7,595,000 Cost of sales ........................................................ 6,248,000 5,613,000 Gross profit on sales ............................................ $ 2,795,000 1,982,000
Gross profit as a percentage of sales .................. 30.9% 26.1% The increase in sales was associated with a larger backlog of orders entering fiscal 2006 when compared to the backlog of orders entering fiscal 2005. Contributing to the increase in sales was progress made on contracts received during the first half of 2006 in accordance with contract completion requirements associated with customers in the entertainment and retail marketplace as a result of a demand for the Company’s products in these industry sectors. Gross profit, as a percentage of sales, for the six months ended June 30, 2006, when compared to the six months ended June 30, 2005, was favorably impacted by 4.3% as a result of a reduction in overhead costs as a percentage of sales due to the higher sales volume to cover fixed overhead costs during the six months ended June 30, 2006. Also contributing to the aforementioned favorable variance by .5% was the impact of product mix and the favorable performance on the Company’s contracts that were completed or nearing completion in the six months ended June 30, 2006 as compared to the six months ended June 30, 2005. Selling, General and Administrative Expenses Selling, general and administrative expenses of $2,801,000 were higher by $617,000 for the six months ended June 30, 2006 than for the six months ended June 30, 2005. The increase was attributable to the addition of resources aimed at expanding the customer base and an increase in salaries and fringe benefits totaling $258,000, an increase of $199,000 in marketing expenses primarily associated with product promotion, marketing research, and participation in trade shows, and an increase of $102,000 in professional fees and shareholder relations expenditures. Product Development Costs Product development costs, including patent expense, of $216,000 were higher by $193,000 for the six months ended June 30, 2006 than for the six months ended June 30, 2005. Development programs in the six months ended June 30, 2006 were primarily aimed at improvements to the Company’s Order Fulfillment and Production & Assembly systems technologies. Development efforts during the six months ended June 30, 2006 included DISPEN-SI-MATIC® hardware and software enhancements aimed at promoting workplace efficiencies for the Company’s customers and LO-TOW® product enhancements. Interest Income Interest income of $276,000 was higher by $202,000 for the six months ended June 30, 2006 than for the six months ended June 30, 2005. The increase in interest income was attributable to the higher level of funds available for investment as a result of the cash proceeds from the sale of substantially all of the assets and liabilities of Ermanco.
22

Item 2. Management's Discussion and Analysis of Financial Condition and Results of Operations (Continued)
(a) Results of Operations – Six Months Ended June 30, 2006 Compared to the Six Months Ended June 30, 2005 (Continued) Income Tax Expense (Benefit) The Company recognized an income tax benefit of $43,000 during the six months ended June 30, 2006 compared to an income tax benefit of $30,000 during the six months ended June 30, 2005. The income tax benefit for the six months ended June 30, 2006 was higher than the statutory federal and state tax rates primarily due to the reversal of accruals for the expiration of tax return statutes and tax-exempt interest on certain investments. The income tax benefit for the six months ended June 30, 2005 was generally recorded at statutory federal and state tax rates. (b) Results of Operations – Three Months Ended June 30, 2006 Compared to the Three Months Ended June 30, 2005 Net Sales and Gross Profit on Sales
2006 2005 Net sales .............................................................. $ 4,823,000 3,729,000 Cost of sales ........................................................ 3,315,000 2,839,000 Gross profit on sales ............................................ $ 1,508,000 890,000
Gross profit as a percentage of sales .................. 31.3% 23.9% The increase in sales was associated with a larger backlog of orders entering fiscal 2006 when compared to the backlog of orders entering fiscal 2005. Contributing to the increase in sales was progress made on contracts received during the first half of 2006 in accordance with contract completion requirements associated with customers in the entertainment and retail marketplace as a result of a demand for the Company’s products in these industry sectors. Gross profit, as a percentage of sales, for the three months ended June 30, 2006, when compared to the three months ended June 30, 2005, was favorably impacted by 4.0% as a result of a reduction in overhead costs as a percentage of sales due to the higher sales volume to cover fixed overhead costs in the three months ended June 30, 2006. Also contributing to the aforementioned favorable variance by 3.4% was the impact of product mix and the favorable performance on the Company’s contracts that were completed or nearing completion in the three months ended June 30, 2006 as compared to the three months ended June 30, 2005. Selling, General and Administrative Expenses Selling, general and administrative expenses of $1,429,000 were higher by $282,000 for the three months ended June 30, 2006 than for the three months ended June 30, 2005. The increase was attributable to the addition of resources aimed at expanding the customer base and an increase in salaries and fringe benefits totaling $82,000, an increase of $128,000 in marketing expenses primarily associated with product promotion, marketing research, and participation in trade shows, and an increase of $47,000 in professional fees and shareholder relations expenditures.
23

Item 2. Management's Discussion and Analysis of Financial Condition and Results of Operations (Continued)
(b) Results of Operations – Three Months Ended June 30, 2006 Compared to the Three Months Ended June 30, 2005 (Continued) Product Development Costs Product development costs, including patent expense, of $60,000 were higher by $41,000 for the three months ended June 30, 2006 than for the three months ended June 30, 2005. Development programs in the three months ended June 30, 2006 were primarily aimed at improvements to the Company’s Order Fulfillment and Production & Assembly systems technologies. Development efforts during the three months ended June 30, 2006 included DISPEN-SI-MATIC® software enhancements aimed at promoting workplace efficiencies for the Company’s customers and LO-TOW® product enhancements. Interest Income Interest income of $148,000 was higher by $87,000 for the three months ended June 30, 2006 than for the three months ended June 30, 2005. The increase in interest income was attributable to the higher level of funds available for investment as a result of the cash proceeds from the sale of substantially all of the assets and liabilities of Ermanco. Other Income, Net The favorable variance of $11,000 in other income, net for the three months ended June 30, 2006 as compared to the three months ended June 30, 2005 was primarily attributable to an increase in royalty income from a license agreement related to material handling equipment sales. Income Tax Expense (Benefit) The Company recognized income tax expense of $43,000 during the three months ended June 30, 2006 compared to an income tax benefit of $69,000 during the three months ended June 30, 2005. Income tax expense for the three months ended June 30, 2006 was lower than the statutory federal and state tax rates primarily due to tax-exempt interest on certain investments. The income tax benefit for the three months ended June 30, 2005 was generally recorded at statutory federal and state tax rates.
Liquidity and Capital Resources The Company’s cash and cash equivalents and short-term investments at June 30, 2006 were $15,804,000, representing 76.2% of total assets, down from $17,397,000, or 77.0% of total assets, at December 31, 2005. The decrease was primarily due to the repurchase and retirement of common stock of $1,861,000, partially offset by cash provided by operating activities totaling $365,000. Cash provided by operating activities totaling $365,000 during the six months ended June 30, 2006 was primarily due to the following factors:
• a decrease in receivables in the amount of $393,000 primarily associated with the collection of an income tax refund.
The Company’s cash and cash equivalents and short-term investments at June 30, 2005 rose to $4,626,000 from $3,602,000 at December 31, 2004. The increase resulted primarily from cash provided by operating activities totaling $1,184,000.
24
Item 2. Management's Discussion and Analysis of Financial Condition and Results of Operations (Continued)
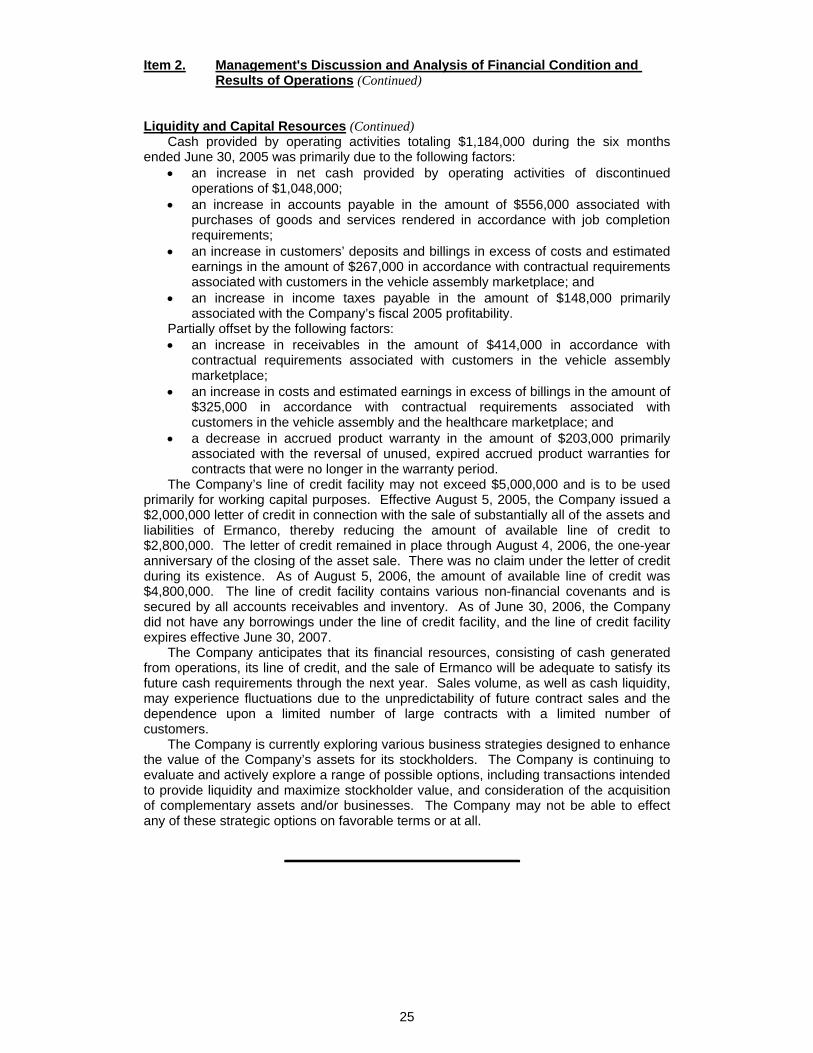
Liquidity and Capital Resources (Continued) Cash provided by operating activities totaling $1,184,000 during the six months ended June 30, 2005 was primarily due to the following factors:
• an increase in net cash provided by operating activities of discontinued operations of $1,048,000;
• an increase in accounts payable in the amount of $556,000 associated with purchases of goods and services rendered in accordance with job completion requirements;
• an increase in customers’ deposits and billings in excess of costs and estimated earnings in the amount of $267,000 in accordance with contractual requirements associated with customers in the vehicle assembly marketplace; and
• an increase in income taxes payable in the amount of $148,000 primarily associated with the Company’s fiscal 2005 profitability.
Partially offset by the following factors: • an increase in receivables in the amount of $414,000 in accordance with
contractual requirements associated with customers in the vehicle assembly marketplace;
• an increase in costs and estimated earnings in excess of billings in the amount of $325,000 in accordance with contractual requirements associated with customers in the vehicle assembly and the healthcare marketplace; and
• a decrease in accrued product warranty in the amount of $203,000 primarily associated with the reversal of unused, expired accrued product warranties for contracts that were no longer in the warranty period.
The Company’s line of credit facility may not exceed $5,000,000 and is to be used primarily for working capital purposes. Effective August 5, 2005, the Company issued a $2,000,000 letter of credit in connection with the sale of substantially all of the assets and liabilities of Ermanco, thereby reducing the amount of available line of credit to $2,800,000. The letter of credit remained in place through August 4, 2006, the one-year anniversary of the closing of the asset sale. There was no claim under the letter of credit during its existence. As of August 5, 2006, the amount of available line of credit was $4,800,000. The line of credit facility contains various non-financial covenants and is secured by all accounts receivables and inventory. As of June 30, 2006, the Company did not have any borrowings under the line of credit facility, and the line of credit facility expires effective June 30, 2007. The Company anticipates that its financial resources, consisting of cash generated from operations, its line of credit, and the sale of Ermanco will be adequate to satisfy its future cash requirements through the next year. Sales volume, as well as cash liquidity, may experience fluctuations due to the unpredictability of future contract sales and the dependence upon a limited number of large contracts with a limited number of customers. The Company is currently exploring various business strategies designed to enhance the value of the Company’s assets for its stockholders. The Company is continuing to evaluate and actively explore a range of possible options, including transactions intended to provide liquidity and maximize stockholder value, and consideration of the acquisition of complementary assets and/or businesses. The Company may not be able to effect any of these strategic options on favorable terms or at all.
25

Item 2. Management's Discussion and Analysis of Financial Condition and Results of Operations (Continued)
Contractual Obligations The Company’s leases 25,000 square feet in Easton, Pennsylvania for use as its principal office. The leasing agreement requires fixed monthly rentals of $18,781 (with annual increases of 3%). The terms of the lease also require the payment of a proportionate share of the facility’s operating expenses. The leasing agreement is secured with a $200,000 letter of credit. The lease expires on February 21, 2008. Future contractual obligations and commercial commitments at June 30, 2006 as noted above are as follows:
Payments Due by Period Total 2006 2007 2008 2009 2010 Contractual obligations: Operating leases............ $ 378,000 113,000 231,000 34,000 - -
Total ............................... $ 378,000 113,000 231,000 34,000 - -
Amount of Commitment Expiration Per Period
Total Amounts
Committed 2006 2007 2008 2009 2010 Other commercial commitments:
Letters of credit ...... $ 2,200,000 2,000,000 200,000 - - - Off-Balance Sheet Arrangements As of June 30, 2006 the Company had no off-balance sheet arrangements in the nature of guarantee contracts, retained or contingent interests in assets transferred to unconsolidated entities (or similar arrangements serving as credit, liquidity, or market risk support to unconsolidated entities for any such assets), or obligations (including contingent obligations) arising out of variable interests in unconsolidated entities providing financing, liquidity, market risk, or credit risk support to the Company, or that engage in leasing, hedging, or research and development services with the Company. Recently Issued Accounting Pronouncements In November 2004, the Financial Accounting Standards Board issued SFAS No. 151, “Inventory Costs an Amendment of ARB No. 43, Chapter 4” (“FAS 151”). FAS 151 provides for certain fixed production overhead cost to be reflected as a period cost and not capitalized as inventory. FAS 151 is effective for the beginning of 2006. The adoption of FAS 151 did not have a material impact on the Company’s financial statements. In December 2004, the Financial Accounting Standards Board issued SFAS No. 123 (revised) “Share-Based Payment” (“FAS 123R”). FAS 123R addresses all forms of share-based payment awards, including shares issued under employee stock purchase plans, stock options, restricted and nonvested stock, and stock appreciation rights. It requires companies to recognize in the statement of operations the grant-date fair value of stock options and other equity-based compensation issued to employees. The statement eliminates the intrinsic value-based method prescribed by APB Opinion No. 25, Accounting for Stock Issued to Employees, and related interpretations, that the Company used prior to January 1, 2006. The Company adopted FAS 123R on January 1, 2006.
26
Item 2. Management's Discussion and Analysis of Financial Condition and Results of Operations (Continued)
Recently Issued Accounting Pronouncements (Continued) In May 2005, the Financial Accounting Standards Board issued SFAS No. 154, “Accounting Changes and Error Corrections – A Replacement of APB Opinion No. 20 and FASB Statement No. 3” ("FAS 154"). FAS 154 requires retrospective application to prior periods’ financial statements for changes in accounting principle, unless it is impracticable to determine either the period-specific effects or the cumulative effect of the change. This statement also requires that retrospective application of a change in accounting principle be limited to the direct effects of the change. Indirect effects of a change in accounting principle, such as a change in non-discretionary profit-sharing payments resulting from an accounting change, should be recognized in the period of the accounting change. FAS 154 also requires that a change in depreciation, amortization, or depletion method for long-lived non-financial assets be accounted for as a change in accounting estimate effected by a change in accounting principle. This statement is effective for accounting changes and corrections of errors made in fiscal years beginning after December 15, 2005. The Company adopted the provisions of this statement, as applicable, on January 1, 2006, and there was no impact of the adoption. In November 2005, the Financial Accounting Standards Board issued FSP No. FAS 123(R)-3, “Transition Election Related to Accounting for the Tax Effects of Share-Based Payment Awards.” This FSP provides an elective alternative transition method for calculating the pool of excess tax benefits available to absorb tax deficiencies recognized subsequent to the adoption of SFAS No. 123R. Companies may take up to one year from the effective date of the FSP to evaluate the available transition alternatives and make a one-time election as to which method to adopt. The Company is currently in the process of evaluating the alternative methods. In June 2006, the Financial Accounting Standards Board issued FIN 48, Accounting for Uncertainty in Income Taxes—an interpretation of FASB Statement No. 109, Accounting for Income Taxes, which clarifies the accounting for uncertainty in income taxes. FIN 48 prescribes a recognition threshold and measurement attribute for the financial statement recognition and measurement of a tax position taken or expected to be taken in a tax return. The Interpretation requires that the Company recognize in the financial statements, the impact of a tax position, if that position is more likely than not of being sustained on audit, based on the technical merits of the position. FIN 48 also provides guidance on derecognition, classification, interest and penalties, accounting in interim periods and disclosure. The provisions of FIN 48 are effective beginning January 1, 2007 with the cumulative effect of the change in accounting principle recorded as an adjustment to opening retained earnings. The Company is currently evaluating the impact of adopting FIN 48 on the financial statements. Cautionary Statement Certain statements contained herein are not based on historical fact and are "forward-looking statements" within the meaning of the Private Securities Litigation Reform Act of 1995 or by the Securities and Exchange Commission rules, regulations, and releases. The Company intends that such forward-looking statements be subject to the safe harbors created thereby. Among other things, they regard the Company's earnings, liquidity, financial condition, review of strategic alternatives, and other matters. Words or phrases denoting the anticipated results of future events, such as "anticipate," “believe," "estimate," "expect," "may," "will," "will likely," "are expected to," "will continue," "should," "project," and similar expressions that denote uncertainty, are intended to identify such forward-looking statements. The Company's actual results, performance, or achievements could differ materially from the results expressed in, or implied by, such "forward-looking statements": (1) as a result of risks and uncertainties identified in connection with those forward-looking statements, including those factors identified herein, and in the Company's other publicly filed reports; (2) as a result of factors over which the Company has no control, including the strength of domestic and foreign economies, sales growth, competition, and certain costs increases; or (3) if the factors on which the Company's conclusions are based do not conform to the Company's expectations.
27

Item 3. Quantitative and Qualitative Disclosures About Market Risk The Company does not believe that its exposures to interest rate risk or foreign currency exchange risk, risks from commodity prices, equity prices and other market changes that affect market risk sensitive instruments are material to its results of operations. Item 4. Controls and Procedures (a) Evaluation of Disclosure Controls and Procedures An evaluation was performed under the supervision and with the participation of the
Company's management, including its Chief Executive Officer, or CEO, and Chief Financial Officer, or CFO, of the effectiveness of the Company’s disclosure controls and procedures, as such term is defined under Rule 13a-15(e) promulgated under the Securities Exchange Act of 1934, as amended (the “Exchange Act”) as of June 30, 2006. Based on that evaluation, the Company's management, including the CEO and CFO, concluded that the Company’s disclosure controls and procedures are effective to ensure that information required to be disclosed by the Company in reports that it files or submits under the Exchange Act, is accumulated and communicated to the Company’s management, including the Company’s CEO and CFO, to allow timely decisions regarding required disclosure, and is recorded, processed, summarized and reported as specified in Securities and Exchange Commission rules and forms.
(b) Change in Internal Control Over Financial Reporting There were no changes in the Company’s internal control over financial reporting
identified in connection with the evaluation of such controls that occurred during the Company’s most recent fiscal quarter that has materially affected, or is reasonably likely to materially affect the Company’s internal control over financial reporting.
28

PART II — OTHER INFORMATION Item 1. Legal Proceedings The Company is involved in various claims and legal actions arising in the ordinary course of business. In the opinion of management, the ultimate disposition of these matters will not have a material adverse effect on the Company's consolidated financial position, results of operations, or liquidity. Item 1A. Risk Factors Item 1A, “Risk Factors,” of our 2005 Form 10-K includes a detailed discussion of our risk factors. Item 2. Unregistered Sales of Equity Securities and Use of Proceeds The following table represents the periodic repurchases of equity securities made by the Company during the three months ended June 30, 2006:
Fiscal Period
Total Number
of Shares Repurchased
Average Price Paid Per Share (Including Brokerage
Commissions)
Total Numberof Shares
Repurchasedas Part of a
Publicly Announced
Program
Approximate Dollar Value
of Shares Purchased Under the Program
Approximate Dollar Value
of Shares That May YetBe Purchased
Under the Program
4/1/06 – 4/30/06 - $ - - $ - $1,593,486
5/1/06 – 5/31/06 25,000 $ 9.56 25,000 $ 239,100 $1,354,386
6/1/06 – 6/30/06 184,519 $ 8.79 184,519 $1,622,370 $1,732,016
209,519 $ 8.88 209,519 $1,861,470
On August 12, 2004, the Company’s Board of Directors approved a program to repurchase up to $1,000,000 of its outstanding common stock. The Company’s Board of Directors amended its existing stock repurchase program on several occasions during 2005 and in 2006 by increasing the amount it has authorized management to repurchase from up to $1,000,000 of the Company’s common stock to up to $12,000,000. There were no repurchases during the three months ended March 31, 2006. During the three and six months ended June 30, 2006, the Company repurchased 209,519 shares of common stock at a weighted average cost, including brokerage commissions, of $8.88 per share. Cash expenditures for the stock repurchases during the three and six months ended June 30, 2006 were $1,861,470. Through June 30, 2006, the Company repurchased 1,068,319 shares of common stock at a weighted average cost, including brokerage commissions, of $9.61 per share. Cash expenditures for the stock repurchases since the inception of the program were $10,267,984. As of June 30, 2006, $1,732,016 remained available for repurchases under the stock repurchase program. Based on market conditions and other factors, additional repurchases may be made from time to time, in compliance with SEC regulations, in the open market or through privately negotiated transactions at the discretion of the Company. There is no expiration date with regards to the stock repurchase program. The purchase price for the shares of the Company’s common stock repurchased was reflected as a reduction to stockholders’ equity. The Company allocates the purchase price of the repurchased shares as a reduction to common stock for the par value of the shares repurchased, with the excess of the purchase price over par value being allocated between additional paid-in capital and retained earnings. All shares of common stock that were repurchased by the Company since the inception of the program were subsequently retired.
29

In July 2006, the Company’s Board of Directors amended its existing stock repurchase program by increasing the amount it has authorized management to repurchase from up to $12,000,000 of the Company’s common stock to up to $14,000,000, of which approximately $2,515,619 remains available for repurchases under the stock repurchase program. Item 3. Defaults Upon Senior Securities Not applicable. Item 4. Submission of Matters to a Vote of Security Holders Not applicable. Item 5. Other Information Not applicable. Item 6. Exhibits 10.36 Loan Agreement (Line of Credit) entered into June 20, 2006 by
and between Paragon Technologies, Inc. and Wachovia Bank, National Association (filed herewith).
10.37 Promissory Note related to the Line of Credit entered into June 20,
2006 by and between Paragon Technologies, Inc. and Wachovia Bank, National Association (filed herewith).
10.38 Security Agreement related to the Line of Credit entered into June
20, 2006 by and between Paragon Technologies, Inc. and Wachovia Bank, National Association (filed herewith).
31.1 Certification by Chief Executive Officer pursuant to Rule 13a-14(a)
and 15d-14(a), as adopted pursuant to Section 302 of the Sarbanes-Oxley Act of 2002 signed by Joel L. Hoffner, President and CEO (filed herewith).
31.2 Certification by Chief Financial Officer pursuant to Rule 13a-14(a)
and 15d-14(a), as adopted pursuant to Section 302 of the Sarbanes-Oxley Act of 2002 signed by Ronald J. Semanick, Chief Financial Officer and Vice President - Finance and Treasurer (filed herewith).
32.1 Certification pursuant to 18 U.S.C. Section 1350, as adopted
pursuant to Section 906 of the Sarbanes-Oxley Act of 2002 signed by Joel L. Hoffner, President and CEO (filed herewith).
32.2 Certification pursuant to 18 U.S.C. Section 1350, as adopted
pursuant to Section 906 of the Sarbanes-Oxley Act of 2002 signed by Ronald J. Semanick, Chief Financial Officer and Vice President - Finance and Treasurer (filed herewith).
30

SIGNATURES Pursuant to the requirements of the Securities Exchange Act of 1934, the registrant has duly caused this report to be signed on its behalf by the undersigned thereunto duly authorized. PARAGON TECHNOLOGIES, INC. /s/ Joel L. Hoffner Joel L. Hoffner President & CEO /s/ Ronald J. Semanick Ronald J. Semanick Chief Financial Officer Dated: August 10, 2006
31

EXHIBIT INDEX Exhibits
10.36 Loan Agreement (Line of Credit) entered into June 20, 2006 by and between Paragon Technologies, Inc. and Wachovia Bank, National Association (filed herewith).
10.37 Promissory Note related to the Line of Credit entered into June 20, 2006
by and between Paragon Technologies, Inc. and Wachovia Bank, National Association (filed herewith).
10.38 Security Agreement related to the Line of Credit entered into June 20,
2006 by and between Paragon Technologies, Inc. and Wachovia Bank, National Association (filed herewith).
31.1 Certification by Chief Executive Officer pursuant to Rule 13a-14(a) and
15d-14(a), as adopted pursuant to Section 302 of the Sarbanes-Oxley Act of 2002 signed by Joel L. Hoffner, President and CEO (filed herewith).
31.2 Certification by Chief Financial Officer pursuant to Rule 13a-14(a) and
15d-14(a), as adopted pursuant to Section 302 of the Sarbanes-Oxley Act of 2002 signed by Ronald J. Semanick, Chief Financial Officer and Vice President - Finance and Treasurer (filed herewith).
32.1 Certification pursuant to 18 U.S.C. Section 1350, as adopted pursuant
to Section 906 of the Sarbanes-Oxley Act of 2002 signed by Joel L. Hoffner, President and CEO (filed herewith).
32.2 Certification pursuant to 18 U.S.C. Section 1350, as adopted pursuant
to Section 906 of the Sarbanes-Oxley Act of 2002 signed by Ronald J. Semanick, Chief Financial Officer and Vice President - Finance and Treasurer (filed herewith).
32

Exhibit 31.1
SECTION 302 CERTIFICATION I, Joel L. Hoffner, certify that:
1. I have reviewed this quarterly report on Form 10-Q of Paragon Technologies, Inc.;
2. Based on my knowledge, this report does not contain any untrue statement of a material fact or omit to state a material fact necessary to make the statements made, in light of the circumstances under which such statements were made, not misleading with respect to the period covered by this report;
3. Based on my knowledge, the financial statements, and other financial information included in this report, fairly present in all material respects the financial condition, results of operations and cash flows of the registrant as of, and for, the periods presented in this report;
4. The registrant's other certifying officer and I are responsible for establishing and maintaining disclosure controls and procedures (as defined in Exchange Act Rules 13a-15(e) and 15d-15(e)) for the registrant and have:
a) Designed such disclosure controls and procedures, or caused such disclosure controls and procedures to be designed under our supervision, to ensure that material information relating to the registrant, including its consolidated subsidiaries, is made known to us by others within those entities, particularly during the period in which this report is being prepared;
b) Designed such internal control over financial reporting, or caused such internal control over financial reporting to be designed under our supervision, to provide reasonable assurance regarding the reliability of financial reporting and the preparation of financial statements for external purposes in accordance with generally accepted accounting principles;
c) Evaluated the effectiveness of the registrant's disclosure controls and procedures and presented in this report our conclusions about the effectiveness of the disclosure controls and procedures, as of the end of the period covered by this report based on such evaluation; and
d) Disclosed in this report any change in the registrant's internal control over financial reporting that occurred during the registrant's most recent fiscal quarter that has materially affected, or is reasonably likely to materially affect, the registrant's internal control over financial reporting; and
5. The registrant's other certifying officer and I have disclosed, based on our most recent evaluation of internal control over financial reporting, to the registrant's auditors and the audit committee of the registrant's board of directors (or persons performing the equivalent functions):
a) All significant deficiencies and material weaknesses in the design or operation of internal control over financial reporting which are reasonably likely to adversely affect the registrant's ability to record, process, summarize and report financial information; and
b) Any fraud, whether or not material, that involves management or other employees who have a significant role in the registrant's internal controls over financial reporting.
Date: August 10, 2006 /s/ Joel L. Hoffner Joel L. Hoffner President and CEO
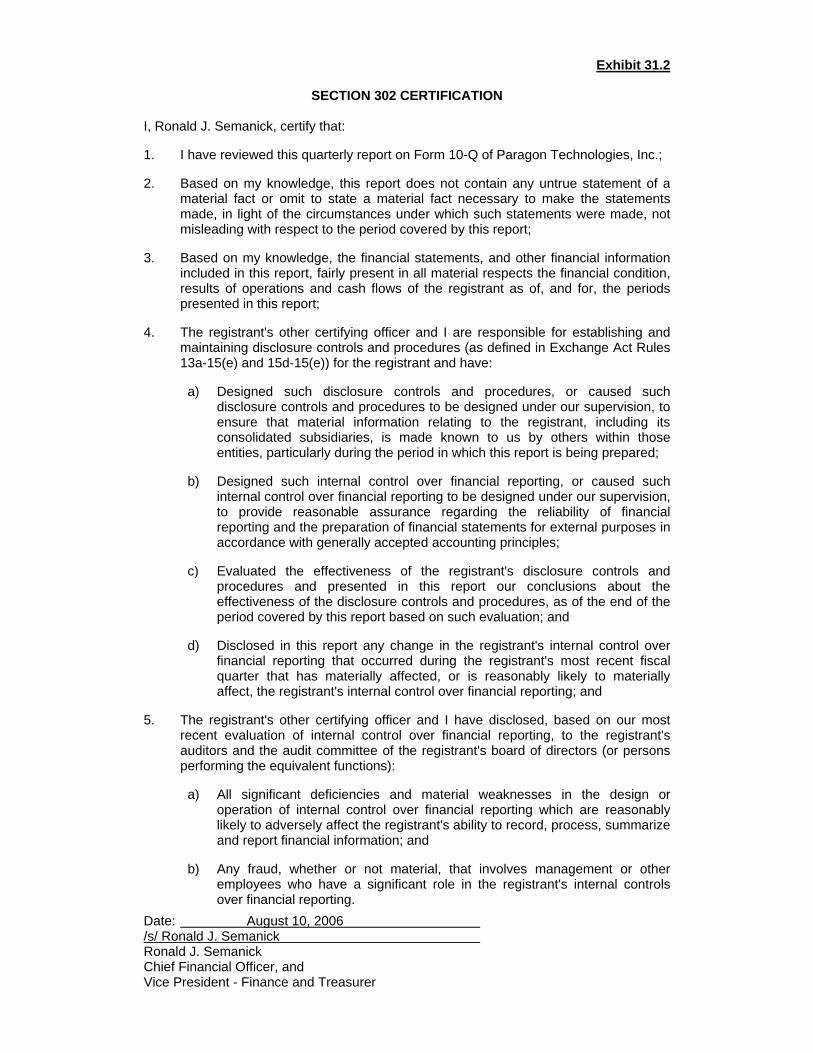
Exhibit 31.2
SECTION 302 CERTIFICATION I, Ronald J. Semanick, certify that:
1. I have reviewed this quarterly report on Form 10-Q of Paragon Technologies, Inc.;
2. Based on my knowledge, this report does not contain any untrue statement of a material fact or omit to state a material fact necessary to make the statements made, in light of the circumstances under which such statements were made, not misleading with respect to the period covered by this report;
3. Based on my knowledge, the financial statements, and other financial information included in this report, fairly present in all material respects the financial condition, results of operations and cash flows of the registrant as of, and for, the periods presented in this report;
4. The registrant's other certifying officer and I are responsible for establishing and maintaining disclosure controls and procedures (as defined in Exchange Act Rules 13a-15(e) and 15d-15(e)) for the registrant and have:
a) Designed such disclosure controls and procedures, or caused such disclosure controls and procedures to be designed under our supervision, to ensure that material information relating to the registrant, including its consolidated subsidiaries, is made known to us by others within those entities, particularly during the period in which this report is being prepared;
b) Designed such internal control over financial reporting, or caused such internal control over financial reporting to be designed under our supervision, to provide reasonable assurance regarding the reliability of financial reporting and the preparation of financial statements for external purposes in accordance with generally accepted accounting principles;
c) Evaluated the effectiveness of the registrant's disclosure controls and procedures and presented in this report our conclusions about the effectiveness of the disclosure controls and procedures, as of the end of the period covered by this report based on such evaluation; and
d) Disclosed in this report any change in the registrant's internal control over financial reporting that occurred during the registrant's most recent fiscal quarter that has materially affected, or is reasonably likely to materially affect, the registrant's internal control over financial reporting; and
5. The registrant's other certifying officer and I have disclosed, based on our most recent evaluation of internal control over financial reporting, to the registrant's auditors and the audit committee of the registrant's board of directors (or persons performing the equivalent functions):
a) All significant deficiencies and material weaknesses in the design or operation of internal control over financial reporting which are reasonably likely to adversely affect the registrant's ability to record, process, summarize and report financial information; and
b) Any fraud, whether or not material, that involves management or other employees who have a significant role in the registrant's internal controls over financial reporting.
Date: August 10, 2006 /s/ Ronald J. Semanick Ronald J. Semanick Chief Financial Officer, and Vice President - Finance and Treasurer

Exhibit 32.1
CERTIFICATION OF PRESIDENT AND CEO PURSUANT TO 18 U.S.C. SECTION 1350,
AS ADOPTED PURSUANT TO SECTION 906 OF THE SARBANES-OXLEY ACT OF 2002
In connection with the Quarterly Report of Paragon Technologies, Inc. (the “Company”) on Form 10-Q for the period ended June 30, 2006 as filed with the Securities and Exchange Commission on the date hereof (the “Report”), I, Joel L. Hoffner, President and CEO of the Company, certify, pursuant to 18 U.S.C. § 1350, as adopted pursuant to § 906 of the Sarbanes-Oxley Act of 2002, that: (1) The Report fully complies with the requirements of Section 13(a) or 15(d) of the Securities Exchange Act of 1934, as amended; and (2) The information contained in the Report fairly presents, in all material respects, the financial condition and result of operations of the Company. /s/ Joel L. Hoffner Joel L. Hoffner President and Chief Executive Officer August 10, 2006
Exhibit 32.2
CERTIFICATION OF CHIEF FINANCIAL OFFICER PURSUANT TO 18 U.S.C. SECTION 1350,
AS ADOPTED PURSUANT TO SECTION 906 OF THE SARBANES-OXLEY ACT OF 2002
In connection with the Quarterly Report of Paragon Technologies, Inc. (the “Company”) on Form 10-Q for the period ended June 30, 2006 as filed with the Securities and Exchange Commission on the date hereof (the “Report”), I, Ronald J. Semanick, Chief Financial Officer of the Company, certify, pursuant to 18 U.S.C. § 1350, as adopted pursuant to § 906 of the Sarbanes-Oxley Act of 2002, that: (1) The Report fully complies with the requirements of Section 13(a) or 15(d) of the Securities Exchange Act of 1934, as amended; and (2) The information contained in the Report fairly presents, in all material respects, the financial condition and result of operations of the Company. /s/ Ronald J. Semanick Ronald J. Semanick Chief Financial Officer and Vice President - Finance and Treasurer August 10, 2006