paradise in peril: studying & protecting reefs, sharks ... report expedition dates: 18 march –...
TRANSCRIPT

EXPEDITION REPORTExpedition dates: 18 March – 27 April 2012
Report published: January 2013
Paradise in peril: studying &protecting reefs, sharks, dolphins
and turtles of the Pulau Tioman
Marine Park, MalaysiaBESTVOLUNTEERINGORGANISATION
UK
BEST FORGREEN-MINDED
TRAVELLERSUK
TOPRESPONSIBLE
HOLIDAYUK
BEST WILDLIFEVOLUNTEERING
HOLIDAYUK
BEST INSUSTAINABLE
TRAVELUSA
TOP HOLIDAYFOR NATURE
Germany
ENVIRONMENTAWARDGermany

1
© Biosphere Expeditions, an international not-for-profit conservation organisation registered in England, Germany, France, Australia and the USAOfficially accredited member of the United Nations Environment Programme's Governing Council & Global Ministerial Environment ForumOfficially accredited member of the International Union for Conservation
EXPEDITION REPORT
Paradise in peril: studying & protecting reefs, sharks,dolphins and turtles of the Pulau Tioman Marine Park,
Malaysia.
Expedition dates:18 March – 27 April 2012
Report published:January 2013
Authors:Katie Yewdall
Project Coordinator
Matthias Hammer and Adam Stickler (editors)Biosphere Expeditions

2
© Biosphere Expeditions, an international not-for-profit conservation organisation registered in England, Germany, France, Australia and the USAOfficially accredited member of the United Nations Environment Programme's Governing Council & Global Ministerial Environment ForumOfficially accredited member of the International Union for Conservation
Abstract
Tioman and surrounding islands are a popular tourist destination with visitors being attracted bythe abundant marine life. The region, however, is under threat from a number of different impacts,not unlike other regions in the Indo-Pacific Ocean.
Reef health assessments, using the Reef Check methodology, were carried out by a group ofvolunteers and scientists in March and April 2012. Health was found to be generally fair to good,but there are definite threats to this health status. On-land development, particularly on themainland, poses the highest risk to the reefs in the South China Sea, because of resultingsedimentation. Widespread illegal fishing, despite clear but unenforced fishing bans in the MarinePark, is also a concern, causing overfishing. The use of fish traps is another concern, causinglocalised, devastating damage to the reef. Irresponsible diving and snorkelling activity is also anissue, albeit a small one at current levels, but boat anchor breakage is a higher priority. Crown-of-thorns starfish are undoubtedly causing a decline in reef health. However, ambiguity exists on howto manage these predators. Finally, warm water coral bleaching is responsible for a large die-off ofcorals in the last decade or more.
On the whole, the islands have a very good chance of recovery and increase in health, but only ifmarine park management and other government authorities prioritise the needs of these financiallyessential reefs. Fishing needs to be better regulated as does on-land development, both on theisland and the mainland. Education of locals and tourists is also key to protecting this unique andbeautiful group of islands and their reefs.
Abstrak
Tioman dan pulau-pulau di sekitarnya adalah destinasi pelancong yang popular dengan parapengunjung tertarik dengan kehidupan marin yang banyak. Rantau ini, bagaimanapun, adalah dibawah pelbagai ancaman, serupa rantau lain di Lautan Indo-Pasifik.
Penilaian kesihatan terumbu, menggunakan kaedah Reef Check, telah dijalankan olehsekumpulan sukarelawan dan saintis pada bulan Mac dan April 2012. Kesihatan terumbu secaraamnya berada dalam keadaan sederhana ke baik, tetapi terdapat ancaman yang jelas terhadapstatus kesihatan ini. Pembangunan, terutamanya di tanah besar, merupakan risiko tertinggiterhadap terumbu di Laut China Selatan, disebabkan oleh pemendapan. Penangkapan ikan secaraberleluasa di Tioman dan undang-undang yang tidak dikuatkuasakan menyebabkan penangkapanikan berlebihan. Penggunaan bubu merupakan satu kebimbangan, menyebabkan kerosakansetempat yang teruk kepada terumbu. Aktiviti menyelam dan snorkeling yang tidakbertanggungjawab merupakan satu isu juga, walaupun adalah satu isu yang kecil pada masa kini,tetapi kerosakan yang disebabkan oleh sauh bot adalah lebih besar. Tapak sulaiman mahkotaberduri juga menyebabkan kemerosotan kesihatan terumbu. Walau bagaimanapun, wujudnyakekaburan tentang bagaimana untuk menguruskan pemangsa ini. Akhirnya, kelunturan karangdisebabkan oleh air suam bertanggungjawab terhadap kematian karang yang banyak dalam satudekad yang lalu atau lebih.
Secara keseluruhan, Tioman mempunyai peluang yang sangat baik dalam pemulihan danpeningkatan kesihatan terumbu, tetapi hanya jika jabatan taman laut dan pihak berkuasa kerajaanyang lain mengutamakan keperluan dan kepentingan terumbu ini. Aktiviti memancing danpembangunan perlu dikawal dengan lebih baik, di pulau dan di tanah besar. Pendidikan kepadapenduduk tempatan dan pelancong juga penting untuk melindungi keunikan dan keindahankumpulan pulau-pulau ini dan terumbunya.

3
© Biosphere Expeditions, an international not-for-profit conservation organisation registered in England, Germany, France, Australia and the USAOfficially accredited member of the United Nations Environment Programme's Governing Council & Global Ministerial Environment ForumOfficially accredited member of the International Union for Conservation
Contents
Abstract 2
Contents 3
1. Expedition Review 4
1.1. Background 4
1.2. Research area 5
1.3. Dates 5
1.4. Local conditions & support 6
1.5. Local scientist 7
1.6. Expedition leader 7
1.7. Expedition team 7
1.8. Partners 8
1.9. Expedition budget 8
1.10. Acknowledgements 9
1.11. Further Information & Enquiries 9
2. Reef Check Survey 10
2.1. Introduction 10
2.2. Methods 15
2.3. Results 20
2.4. Discussion & conclusions 36
2.5. Summary & recommendations 41
2.6. Literature cited 44
Appendix I: Expedition diary & reports 46

4
© Biosphere Expeditions, an international not-for-profit conservation organisation registered in England, Germany, France, Australia and the USAOfficially accredited member of the United Nations Environment Programme's Governing Council & Global Ministerial Environment ForumOfficially accredited member of the International Union for Conservation
1. Expedition Review
M. Hammer & A. Stickler (editors)Biosphere Expeditions
1.1. Background
Biosphere Expeditions runs wildlife conservation research expeditions to all corners of theEarth. Our projects are not tours, photographic safaris or excursions, but genuine researchexpeditions placing ordinary people with no research experience alongside scientists whoare at the forefront of conservation work. Our expeditions are open to all and there are nospecial skills (biological or otherwise) required to join. Our expedition team members arepeople from all walks of life, of all ages, looking for an adventure with a conscience and asense of purpose. More information about Biosphere Expeditions and its researchexpeditions can be found at www.biosphere-expeditions.org.
This report deals with an expedition to Pulau Tioman Marine Park, Malaysia peninsula thatran from 18 March to 27 April 2012. Its aims included; (1) monitoring the health of thePulau Tioman Marine Park’s reefs, its fish and megafauna communities (turtles, sharks,dolphins) so that informed management, education and conservation decisions can bemade by government and NGOs, and (2) contributing to the conservation of Malaysia’svaluable ecological resources. Data collection followed an internationally recognised coralreef monitoring programme, called Reef Check and will be used to make informedmanagement and conservation decisions within the area. The expedition included trainingparticipants as a Reef Check EcoDiver.
Pulau Tioman is located 40 km off the east coast of the Malaysian peninsular. The reefs ofPulau Tioman Marine Park are some of the healthiest and most diverse around thepeninsula and lie just inside the ‘coral triangle’, an area that has been identified as havingthe highest diversity of coral species anywhere in the world. The reefs in the coral trianglesupport over 600 genera of reef-building corals, over 3000 species of fish and contain 75%of all coral species known to science (The Nature Conservancy 2008). The coral trianglewas identified as a priority area for marine conservation and, during the 2007 UnitedNations Climate Change conference in Bali, a pledge to protect this marine environmentwas drawn up between the countries of Malaysia, Indonesia, the Philippines and PapuaNew Guinea. Pulau Tioman was gazetted as a nature reserve and Marine Park in 1998 toprotect these valuable resources. A Marine Parks division of the government is present onthe island.
However, the island’s growing tourist trade, crown-of-thorns population booms anddevelopments on land are threatening the reefs’ health and so data on the currentbiological status of the reefs and of population levels of key indicator species are crucialfor park management and educational efforts. Tourism development is a priority for thegovernment, but sustainable tourism is being overlooked in favour of cheaper and moredamaging mass tourism. If Malaysia’s government and local populations can see smallscale, responsible tourism development working for them, then the country’s rich, naturalresources could be protected more effectively.

5
© Biosphere Expeditions, an international not-for-profit conservation organisation registered in England, Germany, France, Australia and the USAOfficially accredited member of the United Nations Environment Programme's Governing Council & Global Ministerial Environment ForumOfficially accredited member of the International Union for Conservation
1.2. Research area
Malaysia is a federal constitutional monarchy in Southeast Asia. It consists of thirteenstates and three federal territories and has a total landmass of 329,847 square kilometres.The country is separated by the South China Sea into two regions, Peninsular Malaysiaand Malaysian Borneo (also known as West and East Malaysia respectively). The capitalcity is Kuala Lumpur, while Putrajaya is the seat of the federal government. The populationof Malaysia is around 28 million.
Figure 1.2a. Flag and location of Malaysia andstudy site.
An overview of Biosphere Expeditions’ researchsites, assembly points, base camp and office
locations is at Google Maps.
Malaysia is a megadiverse country, with a high number of species and high levels ofendemism. Two-thirds of Malaysia is forested, with a large amount of lowland forestpresent below an altitude of 760 metres. East Malaysia, like most of Borneo, wastraditionally covered with Borneo lowland rain forests although much has been clearedcausing wildlife to retreat into the upland rain forests inland. Besides rain forests, there areover 1425 square kilometres of mangroves in Malaysia, as well as numerous coral reefs.
The expedition started and ended at the Swiss Cottage chalet resort in Tekek village onPulau Tioman. In each expedition group, there was a land-based five day training sessionfollowed by a seven day yacht-based phase, when the research vessel yachtcircumnavigated the main island in the Marine Park, visiting most of the other eight islandsand enabling the expedition to reach seldom-visited dive sites and conduct surveys athard-to-reach locations.
1.3. Dates
The project ran over a period of six weeks, composed of a team of international researchassistants, scientists and an expedition leader. Expedition dates were:
18 – 30 March | 1 – 13 April | 15 - 27 April 2012.
Dates were chosen when survey and weather conditions are most comfortable.

6
© Biosphere Expeditions, an international not-for-profit conservation organisation registered in England, Germany, France, Australia and the USAOfficially accredited member of the United Nations Environment Programme's Governing Council & Global Ministerial Environment ForumOfficially accredited member of the International Union for Conservation
1.4. Local conditions & support
Expedition base
The first five days of each expedition group were based at the Swiss Cottage beach chaletresort on Tioman Island. Expedition participants were divided into pairs and shared twin-bedded rooms for the first six nights.
The next seven days of each group were based on ‘Araliya’, a Colombia 45 ft sloop rigsailing yacht crewed by a yacht captain, divemaster/field scientist and the expeditionleader. The yacht provided the freedom of being able to reach remote parts of the studysite, but not the luxury of a hotel or resort. There were two cabins available, one doubleand one triple and two single berths, mattresses and hammocks.
Weather & water temperature
The climate is tropical and maritime. The average day temperature during the expeditionmonths were 32-40°C. Water temperature during the expedition was 28-31°C.
Field communications
On land, mobile phone reception and Wi-Fi internet connections were. The yacht wasequipped with radio and telephone communication systems. Mobile phones worked insome parts of the study site, but by no means all. The expedition leader posted anexpedition diary to www.biosphere-expeditions.org/diary for friends and family to access.Excerpts of the diary with multimedia content such as pictures and video clips alsoappeared on the Biosphere Expeditions’ social media sites such as Facebook, Google+and the Wordpress blog.
Transport, vehicles & research boats
Team members made their own way to the Tioman island assembly point. From thereonwards and back to the assembly point all transport and vehicles were provided for theexpedition team, for expedition support and emergency evacuations.
Medical support and insurance
The expedition leader and the expedition scientist were trained first aiders, and theexpedition carried a medical kit. The standard of medical care in Malaysia is good with aclinic in Tekek village and Juara village. There are also recompression chambers inKuantan and Singapore, as well as a large hospital in Mersing, just a couple of hours awayby ferry. Safety and emergency procedures were in place. There were no serious medicalincidences during the expedition. There was one instance of ear infection, which wastreated at Tekek clinic and prevented a participant from diving for a few days.
Diving
The minimum requirement to take part in this expedition was a PADI Open Water orequivalent qualification. Team members who had not dived for twelve months prior tojoining the expedition were required to complete a PADI Scuba Review before joining theexpedition. Standard PADI diving and safety protocols were followed.

7
© Biosphere Expeditions, an international not-for-profit conservation organisation registered in England, Germany, France, Australia and the USAOfficially accredited member of the United Nations Environment Programme's Governing Council & Global Ministerial Environment ForumOfficially accredited member of the International Union for Conservation
Dive groups were divided into different teams, each working on specific areas of surveywork. Divers were allocated to teams based on a mixture of personal preference, divingskills and knowledge of the species.
1.5. Expedition scientist
Katie Yewdall was born in the UK, but has spent more than half her life in Asia. She has adegree in Zoology with Marine Biology from Newcastle University and a Masters Degree inEnvironmental Monitoring from King’s College, London. Katie has worked in conservation,research and the environment since leaving university in many areas of the world, recentlyfocusing on research and conservation of coral reefs in Asia. She works closely with anumber of national and international universities as well as the local governmentalauthorities to improve management of the Pulau Tioman Marine Park, as well asconducting awareness-raising projects in the local villages. Katie is also PADI Divemasterand a Reef Check trainer with over 1500 dives, the majority of them being research dives.
1.6. Expedition leader
Paul o'Dowd was born in Melbourne, Australia. From the beginning, his primary interestshave been natural history and adventure. As a teenager he learned to dive and at 19 yearsold left Victoria to move to Cairns to work on the Great Barrier Reef in the dive industry.Shortly thereafter he was offered a job managing a dive facility in Papua New Guinea. InPNG Paul became involved in expeditionary and documentary film work. Paul has workedfor the BBC’s Natural History Unit and various other companies on documentary projectsas well as with assorted tourism-based expeditions to places such as the Sepik Basin andthe Kokoda Track. Paul also delivers a lecture programme in rainforest ecology,conservation and sustainability for a study abroad programme for American universitystudents. A broad base of scientific literacy and a genuine interest in communication hasled to a career in introducing diverse audiences to the natural world. Diving, rock climbingand just about anything that provides a good opportunity to get into nature and help othersto do the same is Paul’s idea of time well spent.
1.7. Expedition team
The expedition team was recruited by Biosphere Expeditions and consisted of a mixture ofall ages, nationalities and backgrounds. They were (with country of residence):
18 – 30 March 2012: Virginie Burck (La Reunion, France), Michael Enders (Germany), HoChing Kam (Hong Kong, China), Maarten Ridder (The Netherlands), Frank Volz(Germany). Also Kathy Gill (UK), Biosphere Expeditions’ strategy director for part of thegroup.
1 – 3 April 2012: Gavin Haines (UK), Edzard Hoefig (Germany), Julia Hoefig (Germany),Rebecca Lock (UK).
15 – 27 April 2012: Christine Champneuf (France), Karole Dwyer (UK), Holly Dwyer (UK),Julian Thaler (Switzerland), Georgina Treherne (The Netherlands).
The skipper throughout the expedition was Hyton Hines, a qualified yachtmaster fromSouth Africa, with much experience of ocean crossings and skippering charters.

8
© Biosphere Expeditions, an international not-for-profit conservation organisation registered in England, Germany, France, Australia and the USAOfficially accredited member of the United Nations Environment Programme's Governing Council & Global Ministerial Environment ForumOfficially accredited member of the International Union for Conservation
1.8. Partners
On this project Biosphere Expeditions is working with Reef Check, the Department ofMarine Parks of Malaysia, local dive centres, businesses & resorts, the local community,the University of Kebansaan Malaysia, the National University of Singapore, Hong KongUniversity, as well as sharing data with the Global Coral Reef Monitoring Network(GCRMN).
Logistical partners were Tioman Dive Centre, a well-established SCUBA diving centrebased on Tioman Island and managed by Rosie Cotton. Tioman Dive Centre staff were onhand to offer advice and assistance in safety, diving and other local logistical issues.
1.9. Expedition budget
Each team member paid towards expedition costs a contribution of £1390 per person perslot. The contribution covered accommodation and meals, supervision and induction,special non-personal diving and other equipment and air, and all transport from and to theteam assembly point. It did not cover excess luggage charges, travel insurance, personalexpenses such as telephone bills, souvenirs etc., as well as visa and other travelexpenses to and from the assembly point (e.g. international flights). Details on how thiscontribution was spent are given below.
Income £
Expedition contributions 17,065
Expenditure
Research vessel & accommodationincludes all board & lodging on land & sea, ship’s crew, fuel & oils, other services
7,579
Equipment and hardwareincludes research materials & gear or hired purchased in UK & Malaysia
1,282
StaffIncludes local and international salaries, travel and expenses
8,186
Administrationincludes registration fees & sundries
74
Team recruitment Malaysiaas estimated % of PR costs for Biosphere Expeditions
6,400
Income – Expenditure - 6,456
Total percentage spent directly on project 138%*
*This means that in 2012, the expedition ran at a loss and was supported over and above theincome from the expedition contributions and grants by Biosphere Expeditions.

9
© Biosphere Expeditions, an international not-for-profit conservation organisation registered in England, Germany, France, Australia and the USAOfficially accredited member of the United Nations Environment Programme's Governing Council & Global Ministerial Environment ForumOfficially accredited member of the International Union for Conservation
1.10. Acknowledgements
This study was conducted by Biosphere Expeditions, which runs wildlife conservationexpeditions all over the globe. Without our expedition team members (who are listedabove) who provided an expedition contribution and gave up their spare time to work asresearch assistants, none of this research would have been possible. Thank you also toStella Abbas Rowland of Swiss Cottage Chalets who provided accommodation and mealsfor our volunteers and staff. The support team and staff (also mentioned above) werecentral to making it all work on the ground. Thank you to all of you, and the ones we havenot managed to mention by name (you know who you are) for making it all come true.Biosphere Expeditions would also like to thank members of the Friends of BiosphereExpeditions and donors and Swarovski Optik for their sponsorship support.
1.11. Further information & enquiries
More background information on Biosphere Expeditions in general and on this expeditionin particular including pictures, diary excerpts and a copy of this report can be found on theBiosphere Expeditions website www.biosphere-expeditions.org.
Enquires should be addressed to Biosphere Expeditions via www.biosphere-expeditions.org.

10
© Biosphere Expeditions, an international not-for-profit conservation organisation registered in England, Germany, France, Australia and the USAOfficially accredited member of the United Nations Environment Programme's Governing Council & Global Ministerial Environment ForumOfficially accredited member of the International Union for Conservation
2. Reef Check Survey
2.1. Introduction
The importance of coral reefs
Coral reefs are well known to be valuable both in terms of their ecological role and theirfinancial one. They are the oldest natural community on earth and support up to 90% ofthe marine organisms currently existing (Bryant et al. 1998). Hard corals provide theimportant structure on and around which the many other reef invertebrates, fish, reptilesand mammals rely. Hundreds of thousands of people living along coastlines also dependon reefs for their survival. The marine environment provides them with ready protein, andfor some communities, it is the only protein they have access to. Coral reefs also providebillions of dollars of revenue from the fishing and extraction industry, as well as the tourismindustry (Hatziolos et al. 1998). Beach, scuba diving, snorkelling, kayaking and sailingtourism would not exist in their current forms without these vital ecosystems, andpotentially, neither would much of the rest of the life in the oceans Bryant et al. 1998). Inaddition, reefs provide essential protection to 20% of the world’s coastline, without which,beach and land erosion would be extensive (Hatziolos et al. 1998). Finally, coral reefsprovide huge potential for medical and cosmetic applications (Bryant et al. 1998).
Status of coral Reefs in South East Asia
Coral Reefs in South East Asia are estimated to cover around 100,000 km2, which is 34%of the oceans’ coral reefs. These extensive reefs have 600-800 species of scleractiniacorals, the highest coral diversity in the world (Amri et al. 2008, Wilkinson, 2008). The areaalso has up to 1000 species of marine fish (Allen & Werner 2002). However, overfishing,destructive fishing, pollution and sedimentation mean that close to 90% of the area’s reefsare at risk of severe degradation (Burke et al. 2002, Amri et al. 2008). Their loss wouldhave a serious socio-economic impact as communities in the region rely so much uponthem for food security, fishing and tourism revenue and costal protection. Loss of revenuemay run into millions of dollars.
Malaysia has around 69 coral genera. The reefs around the study site, Tioman Island,have 221 species of hard coral from 14 families (Amri et al., 2008). Published studiesindicate fish diversity to be high also at 326 species from 55 families, although research byBlue Ventures Conservation (unpublished), indicates there may be up to 60 species more.In addition, Tioman Island has the highest hard coral cover of the islands along the eastcoast of the peninsular with Reef Check Malaysia finding 56.3% hard coral cover inTioman versus 50.2% in Perhentian 38.3% in Redang and 26.4% Aur in 2008 (Reef Check2008).
Although Malaysia is not quite as economically poor or as biologically rich as other nationsin the Coral Triangle, its reefs are still very valuable to its people, with a potential value ofUS$ 12.7 billion per annum (Wilkinson 2004 & 2008) They are also under just as muchpressure as other reefs in the region; threatened by an increasing population and otherglobal coral reefs impacts, such as coral bleaching, climate change and oceanacidification. In fact, Burke et al. (2002) estimate that, along with Indonesia, 85% ofMalaysia’s reefs are under threat, the main threat in peninsular Malaysia beingdevelopment on land.

11
© Biosphere Expeditions, an international not-for-profit conservation organisation registered in England, Germany, France, Australia and the USAOfficially accredited member of the United Nations Environment Programme's Governing Council & Global Ministerial Environment ForumOfficially accredited member of the International Union for Conservation
The study site itself, Tioman Island, is a marine park and various rules are in place toprotect its reefs. However, the regulations are poorly implemented. Threats to the reefsinclude overfishing, use of destructive fishing methods, plagues of Crown-of-Thornstarfish, warm water bleaching, irresponsible diving and snorkelling practices andsedimentation from various land development projects. Considering this lack ofenforcement, threats to the reef, plus plans in place to develop the island further, meansthat the area deserves closer inspection and higher levels of protection to ensure it retainsits title of healthiest reef in the area.
Figure 2.1a. Location of the Tioman group of islands. Image taken from Google Earth.
The Tioman group of islands and threats to its reefs
The main island of Tioman is the most developed with a small airport, 5 km of paved road,a large school development, one large resort and a number of smaller chalet operatorsand diving schools. Most of the development is focused on the north-west coastline. Theeast and south coast of the island, as well as surrounding islands such as PulauPermangil, are less developed and, therefore, the communities rely more heavily onfishing. Many islands, such as Tulai, Seri Buat, Jahat and Sepoi have no inhabitants at all.
The main impacts acting upon reefs in this region appear to be: Tourism and coastaldevelopment leading to pollution and sedimentation, illegal fishing activities anddestructive fishing practices, Crown-of-Thorn starfish populations explosions and warmwater bleaching.

12
© Biosphere Expeditions, an international not-for-profit conservation organisation registered in England, Germany, France, Australia and the USAOfficially accredited member of the United Nations Environment Programme's Governing Council & Global Ministerial Environment ForumOfficially accredited member of the International Union for Conservation
Tourism and coastal development
Locals recall how Times Magazine once voted Tioman Island into the top ten mostbeautiful islands in the world. This accolade was apparently bestowed in the 1970s andmany, in part, explains the stream of tourists coming to visit the island. Tourist numbershave been fairly stable over the last 10 years, ranging from a high of 249,025 in 2004 to alow of 172,787 in 2003 with the most recently available figure of 194,392 in 2009 (TiomanDevelopment Agency Data). Tourists come to enjoy the beach, to go swimming, kayaking,snorkelling and/or diving. Although there are no data to support this, it is safe to say thatthe island’s current economy is based heavily on marine tourism revenue and that a lossof the clear waters and aesthetically pleasing marine environment would result in the lossof this revenue.
Tourism itself can sometimes bring about the degradation of the natural systems thatunderpin it. Irresponsible tourist activities such as collecting marine souvenirs, breakingfragile corals, touching and harassing marine life, feeding marine creatures, oil and fuelspills from boats and littering, if done on a large enough scale, all contribute to theproblem.
Development on the island is slow compared to islands in a number of other nations on thecontinent, such as Thailand, but what development there is seems to be carried outwithout much consideration of its environmental impact. For example, a new marina wasbuilt, crushing a fringing reef system, just a few years ago. Many villages have anoversized concrete jetty. The new ferry terminal building, right on the edge of the coastalzone, has just been completed, as well as an extensive school complex. A beachregeneration program and waterfront promenade has also been completed in the last fewyears, all for an island of just 37 km long and a community of just 3300 people. There areplans for a new and bigger airport; plans that suggested a 2 km runway built out into theocean, development of a more extensive road system and a new land reclamation project30 km away on the mainland peninsula.
On land development and deforestation cause soil and minerals to leach from the landsurface, run into rives and finally the ocean. Scleractininia corals suffer when exposed tohigh levels of sedimentation as a layer of silt prevents both light from permeating throughto the polyps, as well as preventing tentacles from filtering food from the water column.
In addition, further development and an increase in tourists will lead to an increase insewage and solid waste, which, if not properly managed, will further degrade and harm theenvironment.
Fishing and destructive fishing practices
Fishing used to provide the main source of income and subsistence for villagers on theislands, before tourism became established. No data exist to quantify fishing. However,visitors and divers regularly report rod and line fishing from small boats and jetties aroundthe island. Many local people still own fishing boats and fishing gear such as gill nets,seine nets and fish traps and fishermen are regularly seen fishing with these within themarine park area. They mainly target reef fish, pelagic fish and squid. The most popularform of fishing within the shallower marine park area, and potentially the most physicallydestructive in this case, are the fish traps. Large cages around 3 m long by 1.5 m wide aredropped from boats onto reef habitats and left for a few days.

13
© Biosphere Expeditions, an international not-for-profit conservation organisation registered in England, Germany, France, Australia and the USAOfficially accredited member of the United Nations Environment Programme's Governing Council & Global Ministerial Environment ForumOfficially accredited member of the International Union for Conservation
Fishermen return and tow a small weighted anchor along the sea-bed in the vicinity of thedrop site until it hooks onto the cage. The cage is then pulled up onto the boat. Themethod at least prevents juvenile fish from being caught, but the physical damage causedto the bottom composition is extensive and lasting.
This fishing activity is despite a ban on all forms of fishing as per the Department of MarineParks of Malaysia rules. Many individuals around Tioman and surrounding islandsconsider themselves fishermen, especially outside of the north-west coastal villages of themain island. It is not known how much of an effect this illegal fishing has on the health ofthe reefs or how much of a ‘hang-over’ effect the previously more intensive fishing activityhas left. With ‘fishing villages’ being small, populations of just 100 – 300 people (TiomanDevelopment Agency data), potentially fishing levels are low enough to not have asubstantial effect on the health of the reefs, but there are no data to support thisconjecture.
Crown-of-thorn starfish (COTS)
COTs are known to be highly destructive (Saloman et al. 2011, Richmond and Wolanski,2011) and tend to appear suddenly in very large numbers, or outbreaks. COT populationscan reach levels where their numbers overwhelm entire coral reefs. Outbreaks are thoughtto occur due to a lack of predators (Uthike et al. 2009) including Charonia tritonis, the tritonshell, which is highly valuable curio item and has become almost extinct due to collectionfor sale. and/or an increase of nutrients in the water to feed their planktonic young(Birkland 1982). Nutrients in the water are usually caused by sewage or fertiliser run-offfrom human developments. Both these effects are caused by anthropogenic impacts.However, another school of thought is that COT plagues are natural and are simplyfollowing cyclical predator/prey dynamics (Vine 1971, Morgan et al. 1986). As the prey,Acropora sp. coral, increases in abundance, a bounty of food allows the COT predators togrow and reproduce rapidly. In time, prey species will decline due to heavy predation. Alack of food for predators will lead to a COTS population crash and prey species can onceagain flourish. It is thought that this natural cycle, as COTs mainly target Acropora,controls the growth of fast-growing corals, allowing slower species to colonise. Therefore,Vine (1971) and Morgan et al. (1986).argue, outbreaks actually increase diversity in thelong run.
A lack of definitive research in this area means that managers are uncertain of how toreact when COTs move in. The natural predator/prey cycle could take many decades toplay out, with local reefs going through a long period of unattractive bad health that leavesthe island’s tourism operators without a product to sell. Tioman’s park managers, as wellas a number of dive centres, attempt to control COTs numbers by removing or poisoningindividuals, following best practice advise from a number of experts. However, not enoughis known about whether this could be damaging the diversity in the long term.
Warm water bleaching
Bleaching can occur when scleractinina corals come under thermal stress (Brown et al.1997). Zoozanthellae inside the coral polyps are ejected when water temperatures varyjust one or two degrees outside of the natural range for the area. Without zoxanthallae,corals lose 80% of their energy source as they consume amino acids produced viaphotosynthesis by these algae (Brown et al. 1997, Gates et al. 1992).

14
© Biosphere Expeditions, an international not-for-profit conservation organisation registered in England, Germany, France, Australia and the USAOfficially accredited member of the United Nations Environment Programme's Governing Council & Global Ministerial Environment ForumOfficially accredited member of the International Union for Conservation
Bleaching has been seen on a large scale a number of times with mass events beingrecorded in South East Asia in 1998 and again in 2010. It is thought that cycles of waterwarming is naturally occurring, along with the El Nino weather phenomenon and oncetemperatures reduce, corals are able to recover. However, it can lead to massive hardcoral loss that, coupled with other impacts, can be irreparable.
Figure 2.1b. Bleaching on a Tioman Island reef, May 2010.

15
© Biosphere Expeditions, an international not-for-profit conservation organisation registered in England, Germany, France, Australia and the USAOfficially accredited member of the United Nations Environment Programme's Governing Council & Global Ministerial Environment ForumOfficially accredited member of the International Union for Conservation
Reef Check survey
Reef Check’s survey method uses simple techniques to collect scientifically robust data.This methodology is specially designed for recreational divers that might not have scientificbackground, so training has to be precise, rapid and understandable in order to guaranteethat organism identification is accurate (Hodgson et al. 2006).
To understand the health of a coral reef, Reef Check bases its data collection on “indicatororganisms” that are defined as organisms that reflect the conditions of the ecosystem.These indicators can be individual species or even a family. The important thing is thateach of these indicators has an economic or ecological value, is sensitive to anthropogenicimpacts and easy to identify. A Reef Check team collects four types of data (Hodgson etal. 2006): Site description referring to environment, socio-economic and human impactconditions; fish indicator species count; invertebrate indicator species count; recordingdifferent substrate types (including live and dead coral).
Site description data are collected prior and after the dive and all other data are collectedalong a 100 metre transect, at two depth contours, between 2 to 5 metres and between 6and 12 metres (Hodgson et al. 2006).
Aims of this research
Various researchers and organisations, including Reef Check Malaysia, have carried outstudies in the area, but studies have mainly been limited to sites within easy access of thedive centers fringing the north west coast of the island. In addition, a few (except ReefCheck Malaysia) have included ecosystem-wide, long-term, repeated surveys, which allowchanges over time to be assessed.
The research objectives of this project are to: (1) monitor the health of the reefs, (2)assess impacts that may be damaging their health, (3) set up baseline surveys that can becontinued regularly and well into the future and (4) add to work already done and to extendstudies to sites that have not yet been studied. The aims of these objectives are to (1) gaina fuller understanding of the Tioman group of islands’ reefs, (2) feed this information backto park management and (3) disseminate ecological information to the scientificcommunity.
2.2. Methods
Reef Check methodology
The Reef Check coral reef survey method is a standardised, simple methodology thatallows data to be collected by volunteers with no previous experience of ecological study.By allowing anyone to be trained to collect the data, Reef Check increases the amount ofdata that are collected. The standardised nature of the method allows large amounts ofdata to be compared across the globe, leading to a fuller, more rounded understanding ofwhat is occurring across the planet’s oceans. Reef Check surveys serve as an earlywarning mechanism and a baseline data set that can be built upon by more specialisedscientists. They also encourage an increased awareness in the general public of theissues facing the marine environment, with the hope that more people will become activelyinvolved in the protection of it.

16
© Biosphere Expeditions, an international not-for-profit conservation organisation registered in England, Germany, France, Australia and the USAOfficially accredited member of the United Nations Environment Programme's Governing Council & Global Ministerial Environment ForumOfficially accredited member of the International Union for Conservation
All data were collected by team members that passed through an intensive Reef Checktraining and testing procedure. A project scientist and an expedition leader coordinatedteam members on the expedition. The primary responsibilities of both were to train 13team members in Reef Check methodology and also to coordinate and supervise thesubsequent surveys and data collection.
Site selection and transect placement
The Reef Check survey protocol utilises two transects at depths between 2 - 5 metres(shallow dive) and 6 - 12 metres (medium dive), chosen for practical reasons of diveduration and safety. Along each depth interval, shallow and medium, four 20 metre longline transects are surveyed with a 5 metre space interval between transects. The distancebetween the start of the first transect and end of the last transect is, therefore, 95 metres.
An ideal Reef Check team includes six members (three buddy pairs, each pair responsiblefor fish, invertebrate and substrate data collection respectively) plus support crew, eachwith different specialties and experience.
The Reef Check methodology is adapted by region and the area used for this expeditionwas the Indo-Pacific region. Full details of the methodology and regular updates can befound on the Reef Check website www.reefcheck.org.
Sites chosen were roughly evenly distributed around the islands and included sites withvarying proximity to settlements and river mouths. By choosing sites distributed aroundthis group of islands, the localised, varying effects of impacts could be assessed, as wellas getting a more rounded picture of what is happening in the region as a whole. Onlycoral-dominated communities were chosen and focus was on sites with fairly flat, evenreef surfaces, which are best suited to this type of survey method. Table 2.2a lists the sitessurveyed and the geographical location group of the site. Figure 2.2a shows a map of allthe sites chosen.
21 sites were surveyed on this expedition, some with one, some with two survey transects,resulting In a total of 35 100 m transects, each made up of four surveys. Group 1 surveyed7 sites, with 14 transects, Group 2 surveyed 7 sites with 12 transects, Group 3 surveyed 4sites with 6 transects and Group 4 surveyed 3 sites with 3 transects.
Many of these sites were pilot surveys and the suitability of the sites for future surveys wasalso assessed. For this reason, the method of placing transects randomly withinhomogeneous areas was chosen. An element of known bias was introduced to ensureareas chosen were representative of coral reef habitat as a whole, not a sandy, rubble orsea grass habitat.
One 100 m tape was used as the transect reference. The first buddy team to enter thewater attached the beginning of the tape to a randomly chosen non-living substrate. Thetape was laid along the surface of the reef, ensuring the depth remained constant. Four 20m surveys were carried out along the tape with a gap of 5 m between each one to yieldfour independent samples.

17
© Biosphere Expeditions, an international not-for-profit conservation organisation registered in England, Germany, France, Australia and the USAOfficially accredited member of the United Nations Environment Programme's Governing Council & Global Ministerial Environment ForumOfficially accredited member of the International Union for Conservation
Table 2.2a. Sites surveyed by the expedition, depths of transects and location grouping.
Site surveyed Depth of surveys Group
Batu Malang 5m and 9m 2
Bugis Bay 4m and 7m 1
Bumphead Bay (our name), Permangil Island 4m and 11m 3
Chebeh Island 5m and 10m 2
Jahat Island 5m and 11m 1
Juara Bay South, Tioman Island 5m and 8m 1
Juara rocks, Tioman Island 4m and 5m 1
Labas Rocks 8m and 9m 2
Lobster Bay (our name), Permangil Island 4m 3
Old Man of the Sea (our name) Permangill Island 4m and 11m 3
Pirate Reef, Tioman Island 11m 2
Renggis Island, north 5m and 9m 2
Rock ‘n’ Roll bay (our name), bay south of Telok Dalam, east side ofTioman
4m and 7m 1
Sepoi Island 4m and 8m 2
Seri Buat east island, Mangrove Inlet, 4m 4
Seri Buat east island, Outer reef, 5m 4
Seri Buat, east island, Between Islands 5m 4
Slasher Beach (our name), Permangil Island 7m 3
South of Lanting lighthouse, Tioman Island 4m and 7m 1
Telok Dalam, Tioman Island 5m and 9m 1
Tumuk, Tioman Island 7m 2

18
© Biosphere Expeditions, an international not-for-profit conservation organisation registered in England, Germany, France, Australia and the USAOfficially accredited member of the United Nations Environment Programme's Governing Council & Global Ministerial Environment ForumOfficially accredited member of the International Union for Conservation
Figure 2.2a. Sites surveyed around Tioman and surrounding islands. Group 1 sites are marked in pink, group 2 sites areyellow, group 3 sites are green and group 4 sites are red. Image taken from Google Earth. Inset images not to scale.
Site description
A description of the site was written according to observations made during and after thesurvey and from previous knowledge of the site. The description included how sheltered orexposed the site was and the levels of various impacts acting upon it. The impacts weregiven a ranking from ‘None’ to ‘High’. In addition estimates of the distance to the nearestsettlement and nearest river were made and a GPS point was taken.
After data collection, it was noted that sites in the same geographical location had similarimpacts acting upon them (as recorded by the site description data). Sites were groupedaccording to these geographical proximities and impact similarities for a number ofanalyses. Grouping sites together increases the repetition of sampling within that location,which makes the data more meaningful and robust. It also allows for the effects of thevarious impacts to be assessed.

19
© Biosphere Expeditions, an international not-for-profit conservation organisation registered in England, Germany, France, Australia and the USAOfficially accredited member of the United Nations Environment Programme's Governing Council & Global Ministerial Environment ForumOfficially accredited member of the International Union for Conservation
Fish belt transect
Four segments of 5 meters height, 5 m width by 20 m length (centred on the transect line)were sampled for fish that are typically targeted by fishermen or aquarium collectors andthat are sensitive to impacts. In the Indo-Pacific these species and families are anygrouper (Serranidae) over 30 cm, sweetlips (Haemulidae), snappers (Lutjanidae),parrotfish (Scaridae) over 20 cm, butterflyfish (Chaetodontidae) and moray eel(Muraenidae). Quantitative counts were made of each species/family. Three more speciesare counted in the Indo-Pacific Reef Check, but were not taken as species to look for sincethey do not exist in the area: the Barramundi cod (Cromileptes altivelis), the humpheadwrasse (Cheilinus undulates) and the bumphead parrotfish (Bolbometopon muricatum).
The same four 5 m wide by 20 m long transects (centred on the transect line) were alsosampled for invertebrate taxa typically targeted as food species or collected as curios. Thetaxa counted were: banded coral shrimp (Stenopus hispidus), long-spined black seaurchins (Diadema spp.), pencil urchin (Eucidaris spp.), collector urchin (Tripneustes spp.),three edible sea cucumbers species (Thelenota ananas, Stichopus chloronotus, Holothuriaedulis), lobster (all edible species) and triton shell (Charonia tritonis). Quantitative countswere made of each species/family.
During the invertebrate survey, anthropogenic impacts were also assessed. Theseincluded coral damage by anchors, dynamite, or ‘other’ factors, and for trash. Trash isdivided by type, i.e. fishing nets or simply ‘other’. Divers valued the damage caused byeach factor using a 0 to 3 scale (0 = none, 1 = low, 2 = medium, 3 = high).
The percentage cover of bleaching and coral disease in the coral reef (colony andpopulation) was also measured along each 20 m transect.
Substrate line transect
Four 20 m long transects were point sampled at 0.5 m intervals to determine thesubstratum types on the reef. The categories recorded at 50 cm intervals were accordingto Reef Check definitions: hard coral (HC), soft coral (SC), recently killed coral (RKC),nutrient indicator algae (NIA), sponge (SP), rock (RC), rubble (RB), sand (SD), silt (SI) andother (OT).
Impact Assessment
Also within the same 5 m by 20 m belt transect used for invertebrate sampling, an impactassessment was done. A number of impacts were identified and a rating for each impactwas given. The ratings ranged from 0 (none) to 3 (high). Impacts were: coral damage -boat/anchor; coral damage – dynamite; coral damage – other (inclusive of predation);trash – fish nets; trash – general.
Bleaching and incidence of disease was also recorded, but a percentage for the wholetransect was given for these categories: bleaching of population (% affected by bleaching);bleaching of colonies (average % of each colony that is bleached); white band disease (%of population affected by disease); black band disease (% of population affected bydisease).
20
© Biosphere Expeditions, an international not-for-profit conservation organisation registered in England, Germany, France, Australia and the USAOfficially accredited member of the United Nations Environment Programme's Governing Council & Global Ministerial Environment ForumOfficially accredited member of the International Union for Conservation
Data analysis
All data were entered on underwater slates and subsequently transferred onto Reef CheckExcel sheets. Belt transect data were used to calculate the mean abundance of each fishand invertebrate taxa. The substrate line transect data were converted to meanpercentage cover of each substratum category. Anthropogenic data were represented bymean abundance of each impact.
The data was averaged across the whole area to give an idea of the status of the reefsacross the region. It was then grouped according to location and again a mean for thatgroup was calculated. The non-parametric Kruskal-Wallis test was used to determine thesignificance of differences between the location groups. This allowed the data to reveal ifthe different impacts acting upon that location were causing an effect.
Note on statistical conventions: the results of statistical tests are given by showing the ‘p’(probability) value of the test. Results that are significant at the p <.05 level are commonlyconsidered statistically significant and p <.005 or p <.001 levels are often called "highly"significant
2.3. Results
Fish community (regional)
The fish most often encountered on the fish surveys were butterflyfish and parrotfish, withsnappers and groupers being the other notable sighting. Few sweetlips, barramundi cod,bumphead parrotfish and moray eels, and no humphead wrasse were seen. Figure 2.3ashows the average counts per 20 m sample area.
Figure 2.3a. Mean abundance of fish indicator species found per 20 m belt transect transect across all sites in theTioman group of Islands.

21
© Biosphere Expeditions, an international not-for-profit conservation organisation registered in England, Germany, France, Australia and the USAOfficially accredited member of the United Nations Environment Programme's Governing Council & Global Ministerial Environment ForumOfficially accredited member of the International Union for Conservation
The number of groupers counted in each size class across the entire region was shown tobe significantly varied (p < 0.01). Figure 2.3b shows significantly more smaller groupersthan larger ones, on average, counted per 20 m fish belt.
Figure 2.3b. Mean abundance of groupers per 20 m belt transect in each size category across the Tioman island area.
Comparing geographic locations
Figure 2.3c shows the average abundances of indicator fish broken down bygeographically located groups of sample sites. The abundance of individuals were notfound to be significantly different for butterflyfish (p = 0.83), sweetlips (p = 0.12), snappers(p = 0.54), barramundi cod (p = 0.18), bumphead parrotfish (p = 0.18) or moray eels (p =0.81) when comparing data across the four locations. However, grouper abundance wasstatistically different across the four groups (p = 0.01), as was parrotfish abundance (p =0.03). Group 2 and 3 recorded most groupers and group 1 most parrotfish.
Figure 2.3c. Mean abundances of fish indicator species found per 20 m belt transect within each of the four geographiclocations in the Tioman group of islands.

22
© Biosphere Expeditions, an international not-for-profit conservation organisation registered in England, Germany, France, Australia and the USAOfficially accredited member of the United Nations Environment Programme's Governing Council & Global Ministerial Environment ForumOfficially accredited member of the International Union for Conservation
The abundance of groupers of size class 30-40 cm is significantly different between thefour groups (p < 0.05) with group 2 having the most groupers of this size, as shown infigure 2.3d. The abundance of groupers of other sizes between the four groups is notstatistically different (p > 0.5).
Figure 2.3d. Mean abundance of groupers in increasing 10 cm size categories per 20 m survey in each of the fourgeographic locations.
Invertebrate community (regional)
Across the region, no pencil urchins (Cidaroida sp.), collector urchins (Tripneustes sp.),triton shells (Charonia tritonis) or lobster were seen. In addition very few banded coralshrimp (Stenopus hispidus), an average of 0.04, and not many COTs starfish (Acanthasterplanci), an average of 0.34, were recorded per 20 m survey. Diadema sp. sea urchinswere the most abundance invertebrate seen with an average of 59.7 counted per 20 m belttransect and sea cucumbers (various species) coming next with an average of 4.1 (Figure2.3e).
The number of giant clams (Tridacna sp.) found was also low. These were divided intosize categories. Figure 2.3f shows the distribution of individuals counted across these sizecategories.
There is a significantly different number of giant clams in each size category (p < 0.01)with smaller clams more abundant.

23
© Biosphere Expeditions, an international not-for-profit conservation organisation registered in England, Germany, France, Australia and the USAOfficially accredited member of the United Nations Environment Programme's Governing Council & Global Ministerial Environment ForumOfficially accredited member of the International Union for Conservation
Figure 2.3e. Mean abundance of indicator invertebrates seen per 20 m belt transect across the region surveyed.
Figure 2.3f. Mean distribution of giant clams seen in 10 cm size categories across Tioman and surrounding islands.

24
© Biosphere Expeditions, an international not-for-profit conservation organisation registered in England, Germany, France, Australia and the USAOfficially accredited member of the United Nations Environment Programme's Governing Council & Global Ministerial Environment ForumOfficially accredited member of the International Union for Conservation
Comparing geographic locations
Figure 2.3g shows the distribution of invertebrates (except Diadema urchins) across thefour locations. There is no significant difference in the abundance of banded coral shrimp(p = 0.39) between the different sites and triton shells, pencil urchin, collector urchins andlobster were absent in all four of the geographic locations.
Figure 2.3g. Average abundance of indicator invertebrates counted per 20 m belt transect in each geographic location.
The difference in sea cucumber abundance between locations is almost significant (p =0.07) and the abundance of COTs was just significantly different (p = 0.05), with group 2sites having the highest number of these invertebrates.
In contrast, the Diadema abundance is highly significantly different across the geographiclocations (p < 0.01). Figure 2.3h shows group 2 sites to have many more Diadema thanany of the other sites. Group 4 has the second highest number with group 3 sites havingnone at all.

25
© Biosphere Expeditions, an international not-for-profit conservation organisation registered in England, Germany, France, Australia and the USAOfficially accredited member of the United Nations Environment Programme's Governing Council & Global Ministerial Environment ForumOfficially accredited member of the International Union for Conservation
Figure 2.3h. Average Diadema sp. urchin numbers counted per 20 m belt transect at each of the four geographiclocations.
Total giant clam abundance across the sites is significantly different (p = 0.03), but the sizeof them was varied in relevance. Groups 1 and 3 had the most giant clams and group 3had none. The abundances of giant clams sized 20-30 cm, 40-50 cm, and 50cm werefound to be not significantly different in the four locations (p = 0.16, p = 0.33, p = 0.30,respectively), but the abundance of giant clams of sizes 10-20 cm, 30-40 cm were (p =0.02, p = 0.02, respectively) was significantly different. Giant clams of 0-10 cm had almostsignificant abundance differences between the grouped sites (p = 0.06).
Within group 1, the numbers of giant clams in each size category is not significantlydifferent (p = 0.12) from each other, neither is it in group 2 (p = 0.15) or group 3 (p = 0.08).There were no giant clams found in sites in group 4.
Figure 2.3i shows the distribution of giant clam sizes over the four groups and althoughthere does seem to be a trend towards a higher abundance of smaller clams in groups 1and 3, statistics show that the size differences within each location are not significantlydifferent (group 1 – p = 0,12, group 3 – p = 0.08). Group 2 sites show a random distributionof sizes that are not significantly different (p = 0.15).
Figure 2.3i. Mean size distribution of giant clams per 20 m survey across the four different locations.

26
© Biosphere Expeditions, an international not-for-profit conservation organisation registered in England, Germany, France, Australia and the USAOfficially accredited member of the United Nations Environment Programme's Governing Council & Global Ministerial Environment ForumOfficially accredited member of the International Union for Conservation
Substrate cover (regional)
Figure 2.3j shows the substrate results for the entire Tioman region. The total hard coralcover for the Tioman area was found to be 33.3% and the soft coral cover was found to be5.7%. Total coral cover therefore is 38.9%, which puts the region into the ‘Fair’ categoryaccording to Chou et al. (1994).
Figure 2.3j. Average percentage cover of each substrate category per 20 m transect across the Tioman Island region.
Rock was the predominant substrate recorded (40.0%), which represents a large amountof unoccupied coral-suitable substrate, as well as indicating a sizable disturbance that hascaused healthy hard coral to be killed off.
Rubble cover was low at 7.4%, as was recently killed coral at 0.6%. Other livingorganisms, not otherwise categorised, represent 1.8% of the cover. Sponge was also lowat 1.8%. Silt was recorded at 2.9% and nutrient indicator algae was 2.7%.
Living substrate cover (excluding nutrient indicator algae) was found to be 42.5% and non-living substrate cover was found to be 54.7% in the area (figure 2.3k).
Figure 2.3k. Percentage of living substrate cover (excluding nutrient indicator algae) versus non-living cover in the entireTioman Island region.

27
© Biosphere Expeditions, an international not-for-profit conservation organisation registered in England, Germany, France, Australia and the USAOfficially accredited member of the United Nations Environment Programme's Governing Council & Global Ministerial Environment ForumOfficially accredited member of the International Union for Conservation
Comparing geographic locations
Hard coral is not significantly different between the geographic locations (p = 0.14).However, hard coral cover was highest in sites in group 3 (Table 2.3a). Group 2 had twosample sites that were very much outliers with coral cover at 6% and 9% (Table 2.3b).Without these two sites, the average hard coral cover for group 2 would be 46%.
Table 2.3a. Average percentage hard coral cover per 20 m in each group of sites.
Group % hard coral cover
Group 1 24.7
Group 2 39.2
Group 3 44.3
Group 4 27.3
Total region 33.3
Table 2.3b. Percentage hard coral cover per 20 m survey at survey sites in group 2.
Site name % hard coral cover
Batu Malang (D) 43
Batu Malang (S) 38
Chebeh (D) 21
Chebeh (S) 6
Labas (D) 25
Labas (S) 9
Pirate Reef 51
Renggis North (D) 84
Renggis North (S) 79
Sepoi (D) 39
Sepoi (S) 24
Tumuk 50
S = shallow site, D = deep site

28
© Biosphere Expeditions, an international not-for-profit conservation organisation registered in England, Germany, France, Australia and the USAOfficially accredited member of the United Nations Environment Programme's Governing Council & Global Ministerial Environment ForumOfficially accredited member of the International Union for Conservation
Figure 2.3l shows the percentage cover of each of the categories in each geographiclocation. Soft coral, recently killed coral, sponge, sand and other cover were also notsignificantly different between the four locations (p = 0.11, p = 0.15, p = 0.15, p = 0.28, p =0.51 respectively).
Figure 2.3l. Mean percentage cover of each substrate category per 20 m survey for each geographic location.
Rubble was close to being significantly different (p = 0.08), sites in group 4 being the mostdifferent with no rubble recorded on the surveys.
Nutrient indicator algae were found to vary highly significantly between the groups (p <0.01) with group 3 having the most, group 1 having the second most and group 4 havingnone (figure 2.3l).
Rock was variable between the sites too (p = 0.05) with group 1 having the most (50.6%)and groups 2 and 3 having the least (31.9% and 31.6% respectively).
Finally, silt was highly variable between the four locations (p < 0.01) with sites in group 4having much more silt that the others (Figure 2.3l).
Figure 2.3m shows the difference between nutrient indicator algae, living and non-livingsubstrate within each group of sites. Group 1 has significantly more non-living than livingsubstrate cover (p < 0.01), as does group 4 (p < 0.01). The difference between the twocategories is not significant for groups 2 and 3 (p = 0.4 and p = 0.08 respectively).

29
© Biosphere Expeditions, an international not-for-profit conservation organisation registered in England, Germany, France, Australia and the USAOfficially accredited member of the United Nations Environment Programme's Governing Council & Global Ministerial Environment ForumOfficially accredited member of the International Union for Conservation
Figure 2.3m. Comparison of percentage cover of nutrient Indicator algae, living substrate (excluding nutrient indicatoralgae) and non-living substrate per 20 m survey in each of the four geographic locations.
Impact (regional)
Figure 2.3n shows ‘other coral damage’ to be the main impact across the region. Thiscategory represents, COTs damage, Drupella sp. snails and other stressors that mayimpact coral health. Physical boat and anchor damage is the next most prominent impact,with trash, then fish net garbage following. Only one incidence of suspected dynamitefishing was noted on all 35 transects. However, no impacts obtain an average rating ofover 1, therefore, these impacts are all fairly low.
Figure 2.3n. Average rating of impacts measured across the Tioman islands area. Units are based on a ratings systemof 0 (no incidence) -3 (high incidence) averaged over the 35 samples.

30
© Biosphere Expeditions, an international not-for-profit conservation organisation registered in England, Germany, France, Australia and the USAOfficially accredited member of the United Nations Environment Programme's Governing Council & Global Ministerial Environment ForumOfficially accredited member of the International Union for Conservation
Bleaching was recorded at just one site during the entire survey period, leaving thepercentage of bleaching of the population within a 20 by 5 m belt transect across theregion at just 0.6%, a negligible amount. In addition, white band disease was only noted onone transect out of the 35, resulting in an average of just 0.3%, as seen in Figure 2.3o.
Figure 2.3o. Mean percentage of bleaching and disease of the hard coral population per 20 m belt transect across theregion.
Comparing geographic locations
Boat and anchor damage differed significantly between the four groups (p = 0.03) withsites in group 2 showing the most damage (figure 2.3p). Fish net trash was alsosignificantly different between the four sites with group 4 sites being the most affected (p =0.04).
Figure 2.3p. Average rating of impacts measured in each geographic location. Units are based on a ratings system of 0(no incidence) -3 (high incidence) averaged over the 35 samples.

31
© Biosphere Expeditions, an international not-for-profit conservation organisation registered in England, Germany, France, Australia and the USAOfficially accredited member of the United Nations Environment Programme's Governing Council & Global Ministerial Environment ForumOfficially accredited member of the International Union for Conservation
The incidence of other damage was close to being statistically different with sites in group2 being the most affected (p = 0.06).
Dynamite fishing and incidences of general trash were not statistically significant (p = 0.18,p = 0.20 respectively).
Bleaching was seen on just one transect at one of the sites in group 3 (Figure 2.3q). Thisone incidence was found to be not significant (p = 0.18) when compared to samples inother groups. White band disease, however, was found in each of the three samples ingroup 4, making the incidence of this disease highly significant (p < 0.001).
Figure 2.3q. Mean percentage of bleaching and disease of the hard coral population per 20 m belt transect in eachlocation.

32
© Biosphere Expeditions, an international not-for-profit conservation organisation registered in England, Germany, France, Australia and the USAOfficially accredited member of the United Nations Environment Programme's Governing Council & Global Ministerial Environment ForumOfficially accredited member of the International Union for Conservation
Description of sites – observations of potential impacts results
During data collection, a description of each site was made that included observations ofthe potential factors that may impact the reef. These were ranked from none (0), low (1),medium (3) and high (5). These rankings were averaged within the location groups andanalysed.
Regional
Figure 2.3r shows the percentage share of average ranking for factors that could affect thereef across the region. The biggest threat across the whole survey area was artisanalfishing followed by commercial fishing. Tourist diving and snorkelling, sewage pollutionand siltation were the next biggest threats to the reefs.
Figure 2.3r. Percentage share of mean rankings of impacts observed across the region. Impacts were ranked from none(0), low (1), medium (3) and high (5).
33
© Biosphere Expeditions, an international not-for-profit conservation organisation registered in England, Germany, France, Australia and the USAOfficially accredited member of the United Nations Environment Programme's Governing Council & Global Ministerial Environment ForumOfficially accredited member of the International Union for Conservation
Comparing geographic locations
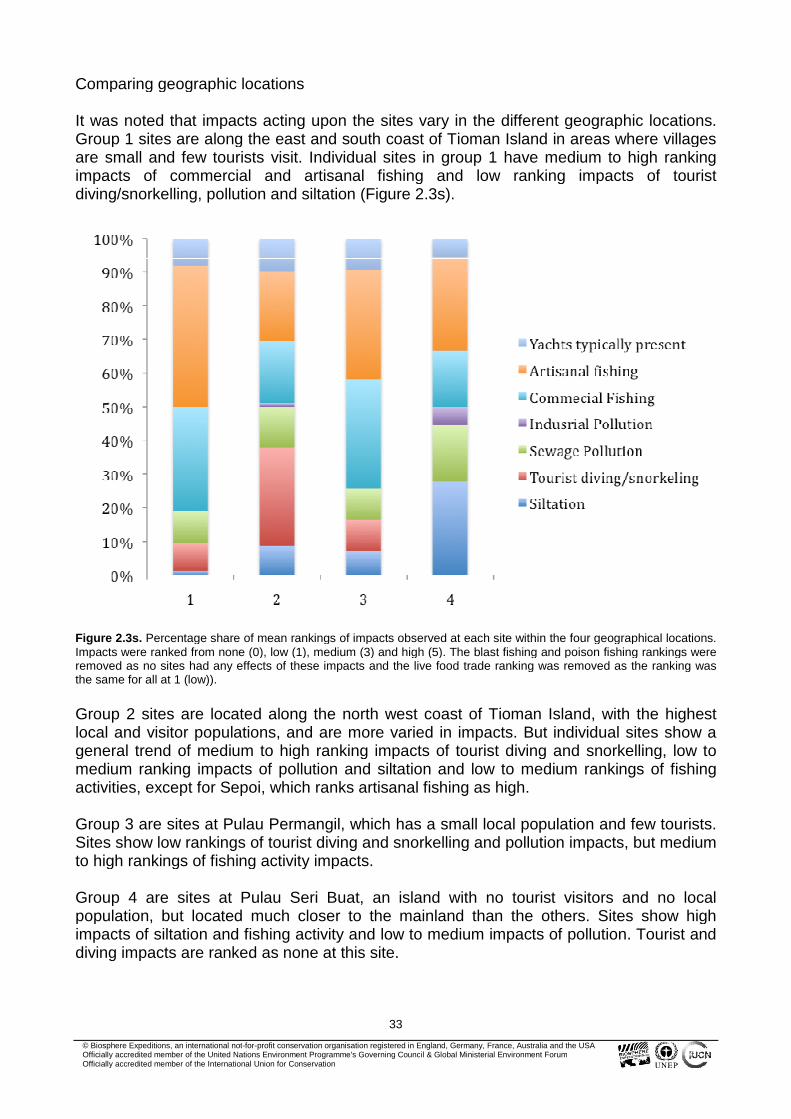
It was noted that impacts acting upon the sites vary in the different geographic locations.Group 1 sites are along the east and south coast of Tioman Island in areas where villagesare small and few tourists visit. Individual sites in group 1 have medium to high rankingimpacts of commercial and artisanal fishing and low ranking impacts of touristdiving/snorkelling, pollution and siltation (Figure 2.3s).
Figure 2.3s. Percentage share of mean rankings of impacts observed at each site within the four geographical locations.Impacts were ranked from none (0), low (1), medium (3) and high (5). The blast fishing and poison fishing rankings wereremoved as no sites had any effects of these impacts and the live food trade ranking was removed as the ranking wasthe same for all at 1 (low)).
Group 2 sites are located along the north west coast of Tioman Island, with the highestlocal and visitor populations, and are more varied in impacts. But individual sites show ageneral trend of medium to high ranking impacts of tourist diving and snorkelling, low tomedium ranking impacts of pollution and siltation and low to medium rankings of fishingactivities, except for Sepoi, which ranks artisanal fishing as high.
Group 3 are sites at Pulau Permangil, which has a small local population and few tourists.Sites show low rankings of tourist diving and snorkelling and pollution impacts, but mediumto high rankings of fishing activity impacts.
Group 4 are sites at Pulau Seri Buat, an island with no tourist visitors and no localpopulation, but located much closer to the mainland than the others. Sites show highimpacts of siltation and fishing activity and low to medium impacts of pollution. Tourist anddiving impacts are ranked as none at this site.
34
© Biosphere Expeditions, an international not-for-profit conservation organisation registered in England, Germany, France, Australia and the USAOfficially accredited member of the United Nations Environment Programme's Governing Council & Global Ministerial Environment ForumOfficially accredited member of the International Union for Conservation
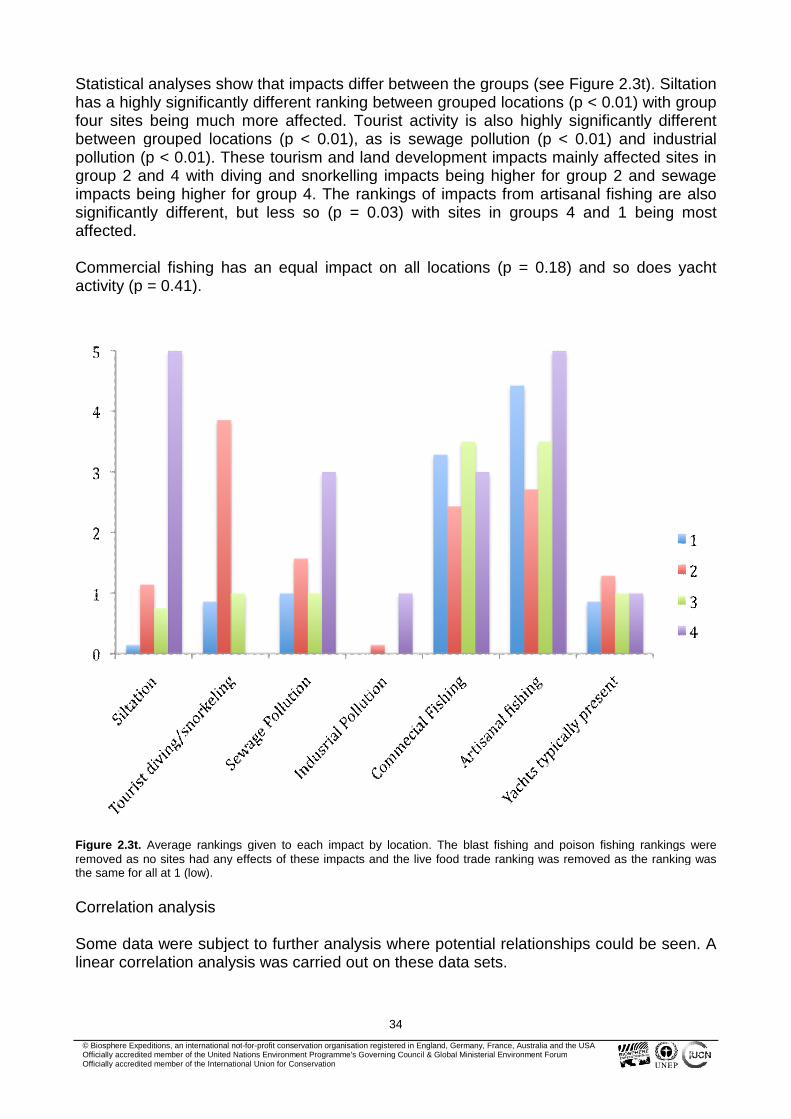
Statistical analyses show that impacts differ between the groups (see Figure 2.3t). Siltationhas a highly significantly different ranking between grouped locations (p < 0.01) with groupfour sites being much more affected. Tourist activity is also highly significantly differentbetween grouped locations (p < 0.01), as is sewage pollution (p < 0.01) and industrialpollution (p < 0.01). These tourism and land development impacts mainly affected sites ingroup 2 and 4 with diving and snorkelling impacts being higher for group 2 and sewageimpacts being higher for group 4. The rankings of impacts from artisanal fishing are alsosignificantly different, but less so (p = 0.03) with sites in groups 4 and 1 being mostaffected.
Commercial fishing has an equal impact on all locations (p = 0.18) and so does yachtactivity (p = 0.41).
Figure 2.3t. Average rankings given to each impact by location. The blast fishing and poison fishing rankings wereremoved as no sites had any effects of these impacts and the live food trade ranking was removed as the ranking wasthe same for all at 1 (low).
Correlation analysis
Some data were subject to further analysis where potential relationships could be seen. Alinear correlation analysis was carried out on these data sets.

35
© Biosphere Expeditions, an international not-for-profit conservation organisation registered in England, Germany, France, Australia and the USAOfficially accredited member of the United Nations Environment Programme's Governing Council & Global Ministerial Environment ForumOfficially accredited member of the International Union for Conservation
Grazing activity versus algal growth
During analysis, it was noted that Diadema abundance, parrotfish abundance and nutrientindicator algae presence was significantly varied between the different location. Diademasea urchins and parrotfish are herbivores and their presence can help to keep algal growthunder control. A linear regression analysis was run on these sets of data to determine arelationship between data points.
First, one site at Chebeh (group 2) was a clear outlier and so was removed from thisanalysis. A significant negative correlation (p = 0.03) was found between the two, showingless algae as Diadema urchins numbers increase. However, no correlation was foundbetween parrotfish abundance and nutrient indicator algae (p > 0.5).
Fishing activity versus food fish abundance
Intensive fishing activity can lead to overfishing, that is, the removal of target fish fasterthan the fish can replenish their own stocks through reproduction. Overfishing can beassessed by looking at the abundance of larger, higher trophic level fish, such assnappers, groupers and sweetlips. The abundance of these fish was combined for eachtransect, and barramundi cod were included as this is a popular food fish in this area tomake up the ‘food fish’ count and this count was compared to the rating for the impact ofartisanal fishing for that site. There was no correlation found between the rating of theimpact and the abundance of food fish (p > 0.5). In addition, there was no significantcorrelation found when the rating of artisanal fishing was compared to abundance ofgroupers only (p = 0.3).
Fishing activity versus rock
Rock is a measurement of the substrate cover that was found to be significantly differentbetween the sites. Artisanal fishing was also significantly different between the sites. So alinear regression analysis was run to see if these two variables are related. A significantcorrelation was found between the two (p = 0.01), where rock cover increased as fishingactivity increased. No significant relationship was found between fishing activity and rubblecover (p = 0.9)
Tourist activity versus hard coral cover and food fish abundance
Tourism and development activities (diving intensity, sewage and siltation) rankings wereanalysed against hard coral cover and food fish abundance. No significant correlationswere found.
COTs and recently killed coral
The incidence of recently killed coral on each survey is recorded, however, the cause ofthe death of the coral is not and it is not always obvious. COTs are known to be voraciouspredators of coral and so the abundance of COTs was compared with the incidence ofrecently killed coral (RKC). A significant correlation between the number of COTs seenand the occurrence of RKC (p < 0.001) was found.

36
© Biosphere Expeditions, an international not-for-profit conservation organisation registered in England, Germany, France, Australia and the USAOfficially accredited member of the United Nations Environment Programme's Governing Council & Global Ministerial Environment ForumOfficially accredited member of the International Union for Conservation
2.4. Discussion and conclusions
Fish community
A lack of food fish such as groupers, sweetlips and barramundi cod indicates anoverfishing of these fish families. Few bumphead parrotfish and humphead wrasse alsoindicate intensive harvesting of these species. The low number of species that arepredatory, such as snapper, groupers, sweetlips and moray eels is concerning as thisindicates that reefs are not balanced, healthy and diverse enough to support the top levelsof the reef food chain.
As the area is a marine park, it could be assumed that the lack of these indicator fish is ahangover from intensive fishing that occurred before the marine park was established andthat numbers will increase given time. However, fourteen years have now passed sincethe marine park was established and numbers are still low. This coupled with the regularobservations of fishing activity as well as the fishing impact ratings given to sites surveyedsuggests that fishing is still occurring at a level, although probably lower than before, thatis preventing the reefs from recovering. There is also the possibility that other impacts areadding to the slow recovery of the reefs.
It is worth noting that commercial fishing was seen to be occurring across the whole regionand no variation of intensity was noticed at the four locations. Commercial fishing is likelyto be the cause of the overfishing here and any effects would also be seen across thewhole region. Commercial fishing in this case was understood to be fishing with the intentto sell the catch. Having said this, the ‘commercial’ fishing boats seen were relatively smallcompared to industrial fleets that may be seen in other parts of the world.
Artisanal fishing intensity varies across the sites with sites in location 4 and 1 being worstaffected. Fish net trash was also seen to vary between the locations with group 4 againbeing the most affected. However, surprisingly, no correlation was found between artisanalfishing and abundance of food fish. This could be because artisanal fishing is at a level lowenough to have no effects on the abundance of food fish stock.
However, the results also indicate that grouper numbers are low and vary across thelocations and, more specifically, that sites in groups 4 and 1 have significantly fewergroupers, a fish most often caught by the artisan fishing method of rod and line. Inaddition, the much higher number of smaller groupers compared to larger ones is anotherindication of overfishing. A region with no or little fishing would have a more equal numberof adults and juveniles.
It is worth bearing in mind that the measurement of all the impacts is a simpleobservational rating and not a quantifiable measurement. In addition, the difficulty ofdefining artisanal versus commercial fishing has probably led to inaccuracies.
Other fish data tells us that locations 2 and 3 have the most butterflyfish, which indicates amore diverse reef. Zones 2 and 3 also have the most groupers, indicating slightly healthierreefs. As group 2 sites experience the most diving and snorkelling pressure, these resultswould suggest that tourism levels are low enough not to be having a detrimental effect onthe reefs. In addition, no correlation was found between tourist activity and food fishabundance.
37
© Biosphere Expeditions, an international not-for-profit conservation organisation registered in England, Germany, France, Australia and the USAOfficially accredited member of the United Nations Environment Programme's Governing Council & Global Ministerial Environment ForumOfficially accredited member of the International Union for Conservation
Parrotfish numbers vary across the locations, with location 1 having the most and 4 havingthe least. But there does not seem to be any trend in regards to impacts or nutrientindicator algae level. It would be expected that where there is more algae, or impacts thatwould cause the growth of algae, there would be more parrotfish to feed on it.Alternatively, more parrotfish mean more grazing of algae leading to fewer algae in thoseareas, which could be the reason for the contrasting results.
After looking at the data from a number of aspects, it can be said that the current, not past,level of fishing activity is having a detrimental effect on the recovery of fish numbers theentire region with zones 1 and 4 being a little more affected.
Invertebrate community
Lobsters are present in the area, but none were seen during any of the surveys. The factthat the environment does support them, but that their numbers are low reveals a heavyfishing pressure on these animals. In addition, triton shells were absent proving that theyhave been fished out in this part of the ocean (as well as much of the rest of the world). Alack of pencil urchins, collector urchin and banded coral shrimp is also noted and may beattributed to fishing pressure, but no sightings of this kind of collection have been reported.
The abundance of giant clams was found to be significantly different across the locationsbut the size was not. If fishing for these animals was occurring, it is likely that there wouldbe a great number more smaller ones than larger. Possibly, this result is unrelated toanthropogenic impacts and more related to environmental conditions.
Sea cucumber numbers were normal, suggesting that they are not targets for collectors.
COTs numbers are variable with some site having vey high numbers per survey. Forexample Renggis and Chebeh (both group 2) both had just under an average of 3 per 20m belt transect. The four sites have slightly different abundances, with group 2 and 3having the most. The effects of their presence is discussed below in regards to the impactssurvey, but it should be noted that there does not seem to be an impact that is linked to theCOT numbers. This is also true for global presence of COTs. Scientists cannot agree onwhat causes COT population explosions and the long-term effects of them. Argumentsrange from booms being a natural occurrence that is needed to maintain coral diversity, tobeing the anthropogenic effects of predator removal and pollution.
Underwater impacts
Impacts are generally low across the region. However, other coral damage (representingdamage caused by impacts such as predation by COTs and Drupella sp. snails) was thebiggest impact noted. This impact was most obvious at sites in group 2, with some effectsnoticed in group 3. In addition, recently killed coral (RKC) was very low across the region,with just under 1% on average. However, where it is found, there is a highly significantrelationship with COTs. It is safe to say that predation by COTs seems to be the biggestcause of recent death of the corals.

38
© Biosphere Expeditions, an international not-for-profit conservation organisation registered in England, Germany, France, Australia and the USAOfficially accredited member of the United Nations Environment Programme's Governing Council & Global Ministerial Environment ForumOfficially accredited member of the International Union for Conservation
Other damage of significance was boat and anchor damage, which was noted most ingroups 2 and 3. Groups 2 and 3 are sites with the most diving and snorkelling and areclosest to the biggest populations. It is unsurprising, therefore, that this result has beenfound, but could be attributed to local fishing boats as well as tourist boats.
There was little bleaching. However, there was a significant amount of white band diseasenoted only at sites in group 4. As siltation was also significantly high at these sites andthey are the closest to mainland industrial pollution, it can be assumed that these are thecauses of the disease. This disease puts extra pressure on coral that is already strugglingwith siltation and further reduces the area’s chance for recovery.
Substrate cover
Hard coral
At 33.2% across the whole region, although just above average global hard coral cover,the hard coral cover does not represent a healthy reef system. The range of hard coralcover is wide (from 5% to 84%), so there are clearly areas of very healthy reef close toareas that have been badly damaged. The overall percentage in this case is not a goodrepresentation of the area as a whole, but it does raise serious concerns for the region’scoral health and stresses the importance of identifying and removing threats and impacts.
Reef Check Malaysia found the Tioman group of islands to have 56.3% hard coral cover in2008 and 44% in 2011. Recent results would therefore seem to suggest a seriousdecrease in hard coral cover in the area. However, the lower percentage is more likely tobe due to using different sample sites from those used by Reef Check Malaysia.
Comparing geographic locations does not yield a conclusive indication of what may becausing the low hard coral cover, as the results within the locations are as varied as theresults between locations. Group 3 sites have marginally higher cover with no sites withinthat location dropping below 24% cover. Group 2 sites have the next best hard coral cover.These two sites are the areas that have the highest diving and snorkelling pressure,suggesting tourist activity is not having the most detrimental effect on the cover.
Sewage pollution and siltation caused by on-land development are other impacts that canaffect hard coral cover. However, neither of these impacts show significant correspondingpatterns with hard coral cover when comparing all four locations, but interference in thedata may be caused by the difference in reef habitats. Location 1 tends to be moreexposed with rocky reefs where hard coral cover would be expected to be low naturally.When comparing sites in group 2, 3 and 4, mainly sheltered, coral dominated habitats, agentle pattern emerges. Hard coral cover is higher in group 3 sites than group 2 and 4where siltation, sewage and diving activity is lower. This suggests that on-landdevelopment may have an impact on the hard coral cover. Results from group 4 sitessupport this argument particularly well as the low coral cover there is very likely to be dueto the very silty conditions caused by deforestation and development on the mainland.
The inverse is true when it comes to comparing hard coral cover with the impacts offishing. Sites where fishing has a higher impact, such as those in groups 1 and 4, dodisplays lower hard coral cover.

39
© Biosphere Expeditions, an international not-for-profit conservation organisation registered in England, Germany, France, Australia and the USAOfficially accredited member of the United Nations Environment Programme's Governing Council & Global Ministerial Environment ForumOfficially accredited member of the International Union for Conservation
In summary, hard coral cover is ominously low. A lack of significant difference between thelocations infers that all impacts are having a roughly equal effect on the hard coral cover,with siltation, fishing and pollution seeming to be slightly more damaging.
Rock
The category ‘rock’ includes bare, exposed rock as well as still standing coral that hasbeen dead for more than a year. The presence of bare rock is often due to the exposednature of a location as coral is unable to grow in poorly sheltered areas. Coral that hasbeen dead for more than a year indicates the potential for coral recruitment. However, longdead coral is also indicative of a chronic or acute disturbance. This disturbance could be amass bleaching event, a COTs outbreak, heavy siltation or even overfishing and theremoval of herbivorous fish. Note that still standing dead coral was categorised as rock,whereas broken dead coral was categorised as rubble, which indicates slightly differentdisturbances as discussed below.
During the surveys, much of the ‘rock’ recorded was actual bare, exposed rock present inthe more exposed sites around the island. Much of the rest of the ‘rock‘ recorded,however, was long dead coral. Moreover, it was long dead Acropora sp. coral.
The close relationship between rock cover and ratings of artisanal fishing activity couldindicate that fishing activity is the cause of the dominance of rock as a substrate. If the‘rock’ recorded was long dead coral, overfishing, and more specifically, fishing down thefood chain, could cause coral die-off of this kind. Rapid removal of top predators meansthat few of these fish are left to catch, forcing fishers to move on to catching herbivorousfish such as parrotfish, surgeonfish and rabbitfish for subsistence purposes. Overfishing ofthese species could allow algae to grow unchecked and take over a coral-dominatedcommunity, causing a phase shift to an algal-dominated one.
This situation is usually found in areas with a very high fishing pressure, where locals needthe fish protein to survive. The small population on these islands coupled with the relativeprosperity of the people does not, therefore, support this argument. More understanding ofthe area’s fishing habits are needed before it can be known if fishing intensity is highenough to cause overfishing.
If the ‘rock’ recorded was bare, exposed rock, the correlating relationship is more likely tobe connected with the fact that more fishing occurs on the more exposed areas of theislands, such as location 1, mainly due to the lack of tourism revenue in those areas. Thelack of tourism is likely linked to the reduced coral cover that is due to the exposed natureof the sites.
As mentioned, much of the long dead coral was Acropora sp. Acropora is known to beparticularly vulnerable to bleaching and is also a favourite food for COTs. Knowing thatthere were mass bleaching events in the Indo-Pacific region in 1998 and 2010 andknowing that COTs are prolific in the area, it is more likely that large areas of dead coral inthe region here are due to one or both of these disturbances.
The dominance of rock over rubble or nutrient indicator algae is encouraging as rockrepresents a surface that new coral can grow upon. This suggests that once impacts areremoved, the site has a very good chance of natural recovery.

40
© Biosphere Expeditions, an international not-for-profit conservation organisation registered in England, Germany, France, Australia and the USAOfficially accredited member of the United Nations Environment Programme's Governing Council & Global Ministerial Environment ForumOfficially accredited member of the International Union for Conservation
Rubble
Rubble is categorised as loose coral and other materials such as shells, etc. Rubble isusually indicative of a physical disturbance such as an unusually large storm, physicallydamaging fishing activities such as the dropping and retrieval of fish traps and droppingand retrieval of anchors and chains.
Rubble cover is reasonably low across the area at just over 7%. However, some individualsites showed up to 37% rubble along an average 20 m transect. These sites were in areaswhere fish traps are regularly seen to be used and some had discarded fish traps still insitu. Although no correlation between artisanal fishing or fishing trash and rubble wasfound, it is highly likely that fish traps and the dropping of anchors were responsible for thisdamage. One reason for the lack of correlation could be that neither of these impacts aremeasured quantitatively. Another reason could be that discarded nets and discarded trapswere counted together. Where nets were found, often the net had become assimilated intothe reef and not caused rubble, whereas the traps were surrounded by badly broken upreef. It is likely that if fishing activity was monitored more closely, a direct linearrelationship would be found.
Nutrient indicator algae
Nutrient indicator algae (NIA) were fairly low across the region, however, significantly morewere found in group 3 and group 1 sites. High NIA levels usually indicate nutrient pollution.However, both locations 3 and 1 have low population densities and are farthest frommainland pollution. Low Diadema urchin numbers correlates with sites with high NIA,which provides the explanation for this pattern. This begs the question why Diademanumbers vary so much between locations. Many more Diadema were found at sites ingroup 2, close to the highest island population and most tourist activity. It could be thatnutrient levels are actually higher at locations in group 2, but Diadema urchin numbers aredisguising this fact by grazing most of the algae. This does not, however, answer thequestion as to why Diadema urchins have not migrated to the other areas where there areclearly enough algae to support their numbers. In addition, herbivorous fish numbers arenot elevated in the areas of higher NIA. The lack of herbivores in these sites is concerningas grazing would prevent algae from taking over these areas, should they become moredamaged in the future.
Siltation
Siltation is fairly low on average at just under 3%. However, it is very high at all sites ingroup 4. These sites are on Pulau Seri Buat, an island just 14 km from the mainland,versus Pulau Tioman’s 40 km (at the closest point). Deforestation and land developmenton the mainland has caused significant river run-off. The resulting siltation has coated thepreviously coral-dominated reefs fringing the island and hard coral cover is at an averageof 27%. Unlike sites in location 1, these reefs are not exposed and would be expected tohave a healthy coral cover. Also unlike the other locations, recovery of silt-dominated sitessuch as this is highly unlikely, even if the cause of the siltation was removed. Developmentplans currently underway on the mainland make recovery of this vulnerable islandextremely unlikely and pose a threat to other islands further away, such as Tioman andPermanggil.

41
© Biosphere Expeditions, an international not-for-profit conservation organisation registered in England, Germany, France, Australia and the USAOfficially accredited member of the United Nations Environment Programme's Governing Council & Global Ministerial Environment ForumOfficially accredited member of the International Union for Conservation
Living substrate versus non-living substrate
There is significantly less living substrate at sites in group 1 and group 4, whereas livingand non-living substrate percentage cover is similar in sites in groups 2 and 3. Thissignificant difference supports arguments already made for damaging effects of siltationand fishing, but is also subject to artefacts of including the bare rock unsuitable for coralgrowth.
2.5. Summary and recommendations
To summarise, it is important to look back to the aims of this study. The study has certainlyallowed a fuller, wider understanding of the reefs in the area, especially by investigatingsites that had not been studied before, such as those in groups 1, 3 and 4. It is hoped thatby highlighting impacts on the reef and making suggestions for its protection, parkauthorities will update management methods in line with suggestions made below. Inaddition it is hoped that the scientific community gains more ecological knowledge of thearea’s reefs through this study.
Reef health
The reefs around the Tioman groups of islands are in fair health overall, but alos rangedramatically in health, suggesting that there are impacts acting locally upon them. Resultsdo shed some light on which impacts are most damaging, that is, reefs in group 3 seem tobe the healthiest with good coral cover, little NIA, few COTs and more groupers. Thesereefs also have the least land development and fishing impacts. However, results are lessconclusive than hoped. This is due the complexity of ecological processes interacting withanthropogenic impacts along with the fact that sites are affected by a variation ofcombinations of impacts, making it difficult to demonstrate individual cause and effects.
Impacts damaging reef health and suggestions for management
Tourism and coastal development
Coastal development is certainly a threat to the health of the reefs in Tioman andsurrounding islands and the effects of planned developments could be devastating.Building out into the oceans will physically crush more of the remaining reefs andsedimentation will be caused by erosion of artificial beaches, clearing of land for spaceand dredging of mudflats for reclamation material.
As seen by the results of surveys at Seri Buat, siltation is the biggest threat. In addition,siltation has also been linked to white band disease, causing even more devastation to thecoral populations. If poorly planned development continues to generate effects such asthese, all islands close to the mainland are at risk of becoming choked by silt. It is notknown if Pulau Tioman, Permangil, Aur and other islands further away will escape thisdamage. Planners must stop ignoring the needs of these reefs and consider the effectsdevelopments will have on the marine systems that underpin a large majority of the area’seconomy. Professional environmental impact studies should be required before anydevelopment commences and their findings should be adhered to strictly, even if it meansthat a development does not go ahead.

42
© Biosphere Expeditions, an international not-for-profit conservation organisation registered in England, Germany, France, Australia and the USAOfficially accredited member of the United Nations Environment Programme's Governing Council & Global Ministerial Environment ForumOfficially accredited member of the International Union for Conservation
Diving and snorkelling activity, as well as sewage pollution originating from the islandsmay be having an effect on reef health. At current levels, they are not a major concern, buteffects will increase if levels increase. Tourism expansion on the islands must be doneresponsibly if local communities are to continue to derive revenue from the marineenvironment. Local communities and park managers have a part to play in ensuring thattheir tourists behave in an environmentally responsible manner.
Also, anchor damage was significantly higher in areas with more boat activity and touristand/or local boats are causing this damage. Park management needs to address thisissue by introducing a regular mooring buoy maintenance programme, as well aseducating boat drivers about the damage caused.
Illegal fishing activities and destructive fishing practices
Not enough information is available for the levels of fishing that continue on and aroundTioman island. It is suspected that levels are much higher than realised. Commercialfishing boats are regularly seen fishing in the marine park area and many tourist fishingboats were also seen during the expedition.
Effects of overfishing are very much present, as evidenced for example by the lack oflarger fish, and Marine Park protection should be having a much more positive effect thanit currently is, considering the length of time since the island was gazetted. In addition, fishtraps are causing great physical damage to the bottom environment. The destabilisation ofsubstrate is not only damaging corals, but also prevents recovery and recruitment.Managers must enforce current fishing regulations, which are widely and obviously floutedthroughout the Marine Park at all time. Alternatively, a system that ensures once and for allthat only local or artisanal fishers are extracting from the Marine Park area and that theyare doing so in a non-physically destructive way, must be developed.
In addition, more effort needs to be invested in educating local people about responsiblepractices in regards to fishing and the introduction of incentives to prevent activities suchas shark fining should be considered.
Crown-of-thorn starfish
The effects of COTs predation are also felt by the areas’ reefs and COTs appear to be oneof the main reason for recent coral death. This was demonstrated by the close relationshipwith recently killed coral (RKC). COTs have probably been having an effect for a numberof years too, due to the that much of the long-dead coral (categorised as ‘Rock”) can likelybe attributed to COTs predation too. Even with the cause of COT population expansionand the long-term effects of their predation unknown, die-off of corals due to COTs is anissue that needs consideration and assessment. Further research and observation isneeded, not just in Tioman, but also around the world, before a definitive answer can begiven to the question of how to respond to these plagues of starfish.

43
© Biosphere Expeditions, an international not-for-profit conservation organisation registered in England, Germany, France, Australia and the USAOfficially accredited member of the United Nations Environment Programme's Governing Council & Global Ministerial Environment ForumOfficially accredited member of the International Union for Conservation
Warm water bleaching
The reefs around Tioman were heavily affected by the mass bleaching event of 2010 withsome sites showing bleaching of 90% of the coral population (own research, unpublished).Anecdotal evidence from long-residing divers also indicates a massive loss in 1998.
The effects of these bleaching events were observed at many of the sites surveyed and ithas been discussed that much of the ‘rock’ recorded was actually long-dead coral that waskilled by bleaching. However, very little current bleaching was observed. There is little thatmanagement authorities can do to prevent bleaching events, but limiting damage by otherimpacts will greatly increase the areas’ ability to recover afterwards.
Potential for recovery
If fishing activity, tourist activity, land development and COTs impacts are reduced, muchof the area has a very good chance of recovery. Low levels of rubble and nutrient indicatoralgae and a high dominance of rock mean that there is a very encouraging chance of coralrecruitment and growth. Indeed, even in areas where COTs and bleaching are suspectedof causing a decline in health, the substrate is stable and the presence of herbivorous fishand invertebrates promise an even more diverse settlement of coral species.
However, there are some sites that are a cause for concern. Areas where grazer urchinsand fish are low, such as Pulau Permangil, have less of a potential for recovery and aremore vulnerable to disturbances. Also, silt that chokes the reefs of Seri Buat and otherislands is not easily shifted and as such represent a serious, long-term threat.
Future surveys
It is recommended in the future to either focus on fewer sites and collect more randomlyplaced transects within those sites or to place permanent transects in situ and continuewith many sites. The advantages of larger numbers of random transects are that thisdecreases the bias and gives a good representation of the area as a whole, but anychanges over time may be due to different areas of the reef being surveyed and not actualchanges in health. An advantage of permanent transects is that changes over time aremore accurately represented. However, there is the danger of the change being too localand not representative of the area as a whole.
It is recommended that Juara Rocks as well as Jahat are dropped as survey sites as theenvironment at these two sites is not well suited to the transect survey method as (veryrocky with very uneven reef surfaces).
Gaps in the data include a lack of understanding of the fishing habits in the area and a lackof data documenting the impacts of the bleaching events. Filling these data gaps isdesirable. However, this could be difficult because of time and resource constraints.

44
© Biosphere Expeditions, an international not-for-profit conservation organisation registered in England, Germany, France, Australia and the USAOfficially accredited member of the United Nations Environment Programme's Governing Council & Global Ministerial Environment ForumOfficially accredited member of the International Union for Conservation
2.6. Literature cited
Allen, G., T. Werner (2002) Coral Reef Fish Assessment in the ‘Coral Triangle’ ofSoutheastern Asia, Environmental Biology of Fishes, Volume 65, Number 2.
Bryant, D., L. Burke, J. Mcmanus, M. Spalding (1998) Reefs at Risk - A Map-BasedIndicator of Threats to the World’s Coral Reefs. World Resources Institute (WRI),International Center for Living Aquatic Resources Management (ICLARM), WorldConservation Monitoring Centre (WCMC), United Nations Environment Programme(UNEP).
Birkland, C. (1982) Terrestrial runoff as a cause of outbreaks of Acanthaster planci(Echinodermata: Asteroidea). Marine Biology. Volume 69, Number 2 (1982), 175-185
Brown, B. E. (1997) Coral bleaching: causes and consequences. Coral Reefs. Volume 16,Number 5 (1997), S129-S138,
Burke, L., E. Selig, M. Spalding (2002) Reefs at Risk in Southeast Asia, World ResourcesInstitute, Pages: 76
Chou, L.M., C.R. Wilkinson, W.R.Y. Licuanan, P.M. Aliño, A.C. Cheshire, M.G.K. Loo, S.Tangjaitrong, A.R.Ridzwan and K. Soekarno (1994) Status of coral reefs in the ASEANregion. p. 1-10. In : Wilkinson, C.R., S. Sudara and L.M. Chou (eds.) Proceedings ThirdASEAN-Australia Symposium on Living Coastal Resources. Vol. 1: Status Review.Chulalongkorn University, Bangkok, Thailand.
Earth Snapshot. Taken from: http://www.eosnap.com/rivers/sediments-from-batang-lupar-river-malaysia/.
Gates, R.D., G. Baghdasarian, L. Muscatine (1992) Temperature Stress Causes Host CellDetachment in Symbiotic Cnidarians: Implications for Coral Bleaching. The BiologicalBulletin, Vol 182, Issue 3: 324-332.
Hatziolos, M.E., A. Hooten, M. Fodor (1998) Coral Reefs: Challenges and Opportunities forSustainable Management. Proceedings of an associated event of the fith annual WorldBank Conference on Environmentally and Socially Sustainable Development. World Bank,International Center for Living Aquatic Resources Management.
Hodgson, G., J. Hill, W. Kiene, L. Maun, J. Mihaly, J. Liebeler, C. Shuman, R. Torres(2006) Reef Check Instruction Manual: A guide to Reef Check Coral Reef Monitoring, pp.86. California, USA: Reef Check Foundation.
Moran, P.J., R.E. Reichelt, R.H. Bradbury, (1986) An assessment of the geologicalevidence for previous Acanthaster outbreaks. Coral Reefs, Volume 4, Number 4 (1986),235-238
The Nature Conservancy (2008). Coral Triangle Facts, Figures, and Calculations: Part II:Patterns of Biodiversity and Endemism, December 16, 2008.

45
© Biosphere Expeditions, an international not-for-profit conservation organisation registered in England, Germany, France, Australia and the USAOfficially accredited member of the United Nations Environment Programme's Governing Council & Global Ministerial Environment ForumOfficially accredited member of the International Union for Conservation
Reef Check Malaysia (2008) Coral Reef Monitoring report. Sourced at:http://www.reefcheck.org.my/assets/report/Survey-Report-2008.pdf
Reef Check Malaysia (2011) Annual Survey report. Sourced at:http://www.reefcheck.org.my/assets/report/2011_Annual_Survey_Report.pdf
Richmond, R.H., E. Wolanski, (2011) Coral Reefs: An Ecosystem in Transition. CoralResearch: Past Efforts and Future Horizons, Part 1, 3-10.
Salomon, A. K., S. K. Gaichas, O. P. Jensen, V N. Agostini, N.A. Sloan, J. Rice, T. R.McClanahan, M. H. Ruckelshaus, P. S. Levin, N. K. Dulvy, E. A. Babcock (2011) Bridgingthe Divide Between Fisheries and Marine Conservation Science. Bulletin of MarineScience, Volume 87, Number 2.
Uthicke, S., B. Schaffelke, M. Byrne, (2009) A boom–bust phylum? Ecological andevolutionary consequences of density variations in echinoderms. Ecological Monographs79:3–24.
Vine, P. J., (1971) Crown of Thorns (Ancanthaster planci) Plagues: The Natural CausesTheory. Atoll Research Bullitin No. 166.
Wilkinson, C., (2004) Status of Coral Reefs of the World: 2004. Global Coral ReefMonitoring Network and Reef and Rainforest Research Center, Townsville, Australia. 296pp.
Wilkinson, C. (2008) Status of Coral Reefs of the World: 2008. Global Coral ReefMonitoring Network and Reef and Rainforest Research Center, Townsville, Australia.296pp.

46
© Biosphere Expeditions, an international not-for-profit conservation organisation registered in England, Germany, France, Australia and the USAOfficially accredited member of the United Nations Environment Programme's Governing Council & Global Ministerial Environment ForumOfficially accredited member of the International Union for Conservation
Appendix I: Expedition diary and reports
A multimedia expedition diary is available onhttp://biosphereexpeditions.wordpress.com/category/expedition-blogs/malaysia-2012/.
All expedition reports, including this and previous expedition reports,are available on www.biosphere-expeditions.org/reports.