paper: fitness and conditioning maturity and intermittent ...throughout the world as a standard test...
TRANSCRIPT

Intermittent endurance development in pubescent soccer players
Football Science Vol.11, 39-47, 2014http://www.jssf.net/home.html
39
1. Introduction
The biological maturation of pubescent soccer players is known to markedly affect not only their physical fitness levels, but also soccer skills (Malina et al., 2004, 2005, 2007; Figueiredo et al., 2011; Philippaerts et al., 2006). Philippaerts et al. (2006) investigated the relationships between physical fitness, motor ability tests, and age at peak height velocity (PHV), and demonstrated that the yearly development of pubescent soccer players for the speed of limb movement, trunk strength, upper body muscular endurance, explosive strength, running speed, agility, cardiorespiratory endurance, and
anaerobic capacity was maximum at the PHV age. They also reported that the development of upper body muscular endurance, explosive strength, and anaerobic capacity continued to be elevated for 1 to 2 years after the PHV age. However, individual variations in PHV age have been reported to be as high as 5 years, even in boys at the same age. In our previous study (Chuman et al., 2009), this wide variation in the maturity status was found to greatly affect fitness performance in junior soccer players.
Soccer is a physically demanding sport requiring the ability to repeatedly perform high-intensity exercise with short rest intervals (intermittent endurance) (Bangsbo, 1994). Bangsbo developed
Maturity and Intermittent Endurance in Male Soccer Players during the Adolescent Growth Spurt: A Longitudinal Study
Kentaro Chuman*, Yoshihiro Hoshikawa**, Tomomi Iida**
and Takahiko Nishijima***
*YAMAHA FOOTBALL CLUB CO., LTD.**Sports Photonics Laboratory, HAMAMATSU PHOTONICS K.K.
***Institute of Health and Sport Science, University of Tsukuba 2500 Shingai, Iwata-shi, Shizuoka 438-0025 Japan
[email protected][Received October 10, 2012; Accepted January 21, 2014]
The purpose of the study was to investigate differences in intermittent endurance between early and late maturing junior soccer players using longitudinal data during the adolescent growth spurt. Twenty-nine pubescent male soccer players aged 12.9 ± 0.2 years at the first measurement were classified into three groups (Late, Average, and Early groups) according to their maturity status, which was determined by their relative peak height velocity age. The Yo-Yo intermittent recovery level 2 (Yo-Yo IR2; intermittent endurance), vertical jump, and five-step jump tests (leg muscle power) as well as measurements of V
4
O2max (aerobic fitness) and thigh muscle volume were performed on six occasions at half-year intervals. A two-way repeated ANOVA revealed a significant interaction between the maturity status and Yo-Yo IR2 results. The Yo-Yo IR2 results correlated significantly with those obtained from the vertical jump and five-step jump tests from 12.9 to 14.3 years of age (r = 0.40-0.76) as well as with those for V
4
O2max from 14.8 to 15.4 years of age (r = 0.50-0.58). The difference in the Yo-Yo IR2 between Early and Late groups was the largest at 13.4 years which was in the middle of the adolescent growth spurt. However, this large difference was observed temporally and disappeared after the spurt period. These results revealed the later development of leg muscle power in late maturing players and a change in the determinants of intermittent endurance during adolescence. Intermittent endurance is limited mainly by leg muscle power that develops simultaneously with maturation during the spurt period. After the spurt period, however, aerobic fitness which is not as strongly related to the stage of maturity comes to contribute to intermittent endurance.
Keywords: Yo-Yo intermittent recovery test, Leg muscle power, Aerobic fitness, Peak height velocity, Longitudinal study
Paper: Fitness and Conditioning
[Football Science Vol.11, 39-47, 2014]

Football Science Vol.11, 39-47, 2014
Chuman K., et al.
http://www.jssf.net/home.html40
a fitness test to evaluate intermittent endurance in soccer players and called it the Yo-Yo intermittent recovery level 2 test (Yo-Yo IR2). The ability of Yo-Yo IR2 to predict the distance a player covers by high-intensity running during a professional soccer game was previously confirmed (Krunstrup et al., 2006; Rampinini et al., 2010; Randers et al., 2009) and is now applied to adult soccer players throughout the world as a standard test of intermittent endurance. However, Yo-Yo IR2 has recently been used to evaluate junior soccer players. The Japan Football Association also conducted Yo-Yo IR2 on elite junior soccer players at junior and senior high schools in Japan (JFA physical fitness project, 2005). However, less information is available on Yo-Yo IR2 in junior players. We previously reported that early-maturing players performed Yo-Yo IR2 better than late-maturing players by more than 50 % even though they were at a similar chronological age of 12-13 years (Chuman et al., 2009, 2011b). Therefore, the maturity status of individuals must be considered when the intermittent endurance of soccer players is evaluated at puberty.
The determinants of intermittent endurance may also differ between soccer players during and after the adolescent growth spurt. Previous studies reported that Yo-Yo IR2 results correlated with maximal oxygen consumption (V
4
O2max), expressed as a value relative to body mass, in adult soccer players or players aged about 16-17 years who had almost reached their final adult height (Bangsbo et al., 2008; Chuman et al., 2011a; Krunstrup et al., 2006; Rampinini et al., 2010). However, we did not find a correlation between the Yo-Yo IR2 results and V
4
O2max in pubescent players aged 12-13 years; the Yo-Yo IR2 results correlated with the development of leg muscle power in this age group (Chuman et al., 2009). These findings indicated that the determinant of Yo-Yo IR2 performance may change throughout the adolescent period from leg muscle anaerobic power to aerobic power (V
4
O2max). Moreover, if V
4
O2max in terms of a relative value to body mass is considered to be approximately equal in early and late-maturing soccer players aged 12-13 years (Chuman et al., 2009), late-maturing players may catch up with early-maturing players in Yo-Yo IR2 before or by approximately 16-17 years of age, by which time the adolescent growth spurt has finished. Although longitudinal follow-ups that span the entire period of the adolescent spurt are needed to confirm this hypothesis, developmental changes in
Yo-Yo IR2 results between early and late-maturing players have not yet been confirmed under the context of longitudinal data.
Therefore , developmenta l changes in the intermittent endurance of early and late maturing soccer players were investigated in the present study based on longitudinal data for 2.5 years during the adolescent growth spurt. We also measured corresponding changes in leg muscle size and function as well as aerobic fitness to assess their contributions to the development of intermittent endurance in junior soccer players.
2. Methods
SubjectsSubjects consisted of 29 pubescent male soccer
players (age: 12.9 ± 0.2) belonging to the U-13 team (1st year junior high school students) of a club that participates in Division 1 of the Japan Professional Football League (J1-League). Fourteen subjects were born in 1994 and fifteen were born in 1995. All subjects were selected by the same club coaches: therefore, their competitive level as a soccer player was approximately equal. Subjects participated in this study after obtaining parental consent, and this study was carried out as a part of team training under the management of club coaches and staffs. Laboratory and field tests were both conducted six times at six-month intervals from the age of 12.9 to 15.4 years on average. The first measurements were performed in April immediately after subjects joined the U-13 team. All field tests were conducted on artificial lawn pitch during training between 7:00PM and 8:30PM. Rainy and windy days were avoided to prevent any influence on these measurements. Temperatures during the measurement periods were between 14.6 degrees C and 18.1 degrees C. We obtained approval for this study from the Ethics Committee of the University of Tsukuba.
Measurement times (Number of measurements: Subjects born in 1994/ Subjects born in 1995)1st time: April 19 – April 24, 2007/ April 22 – April
26, 20082nd time: October 19 – October 23, 2007/ October 21
– November 1, 20083rd time: March 27 – April 8, 2008/ March 26 – April
7, 2009
Intermittent endurance development in pubescent soccer players
Football Science Vol.11, 39-47, 2014http://www.jssf.net/home.html
41
4th time: October 17 – October 23, 2008/ October 3 – October 16, 2009
5th time: March 26 – April 7, 2009/ April 3 – April 6, 2010
6th time: October 16 – October 23, 2009/ October 24 – October 31, 2010
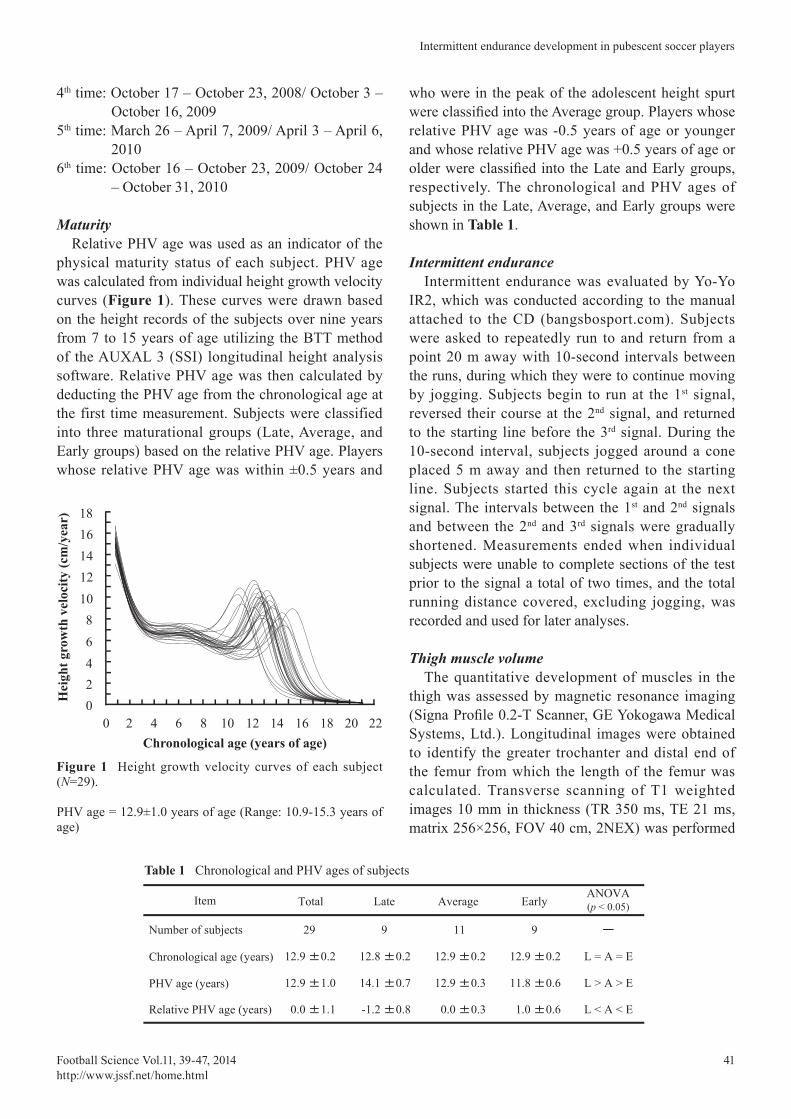
MaturityRelative PHV age was used as an indicator of the
physical maturity status of each subject. PHV age was calculated from individual height growth velocity curves (Figure 1). These curves were drawn based on the height records of the subjects over nine years from 7 to 15 years of age utilizing the BTT method of the AUXAL 3 (SSI) longitudinal height analysis software. Relative PHV age was then calculated by deducting the PHV age from the chronological age at the first time measurement. Subjects were classified into three maturational groups (Late, Average, and Early groups) based on the relative PHV age. Players whose relative PHV age was within ±0.5 years and
who were in the peak of the adolescent height spurt were classified into the Average group. Players whose relative PHV age was -0.5 years of age or younger and whose relative PHV age was +0.5 years of age or older were classified into the Late and Early groups, respectively. The chronological and PHV ages of subjects in the Late, Average, and Early groups were shown in Table 1.
Intermittent enduranceIntermittent endurance was evaluated by Yo-Yo
IR2, which was conducted according to the manual attached to the CD (bangsbosport.com). Subjects were asked to repeatedly run to and return from a point 20 m away with 10-second intervals between the runs, during which they were to continue moving by jogging. Subjects begin to run at the 1st signal, reversed their course at the 2nd signal, and returned to the starting line before the 3rd signal. During the 10-second interval, subjects jogged around a cone placed 5 m away and then returned to the starting line. Subjects started this cycle again at the next signal. The intervals between the 1st and 2nd signals and between the 2nd and 3rd signals were gradually shortened. Measurements ended when individual subjects were unable to complete sections of the test prior to the signal a total of two times, and the total running distance covered, excluding jogging, was recorded and used for later analyses.
Thigh muscle volumeThe quantitative development of muscles in the
thigh was assessed by magnetic resonance imaging (Signa Profile 0.2-T Scanner, GE Yokogawa Medical Systems, Ltd.). Longitudinal images were obtained to identify the greater trochanter and distal end of the femur from which the length of the femur was calculated. Transverse scanning of T1 weighted images 10 mm in thickness (TR 350 ms, TE 21 ms, matrix 256×256, FOV 40 cm, 2NEX) was performed
Number of subjects 29 9 11 9
12.9 ±0.2 12.8 ±0.2 12.9 ±0.2 12.9 ±0.2
Item Total Late Average Early
Chronological age (years)
12.9 ±1.0 14.1 ±0.7 12.9 ±0.3 11.8 ±0.6
0.0 ±1.1 -1.2 ±0.8 0.0 ±0.3 1.0 ±0.6
PHV age (years)
Relative PHV age (years)
ー
L = A = E
ANOVA(p < 0.05)
L > A > E
L < A < E
0 2 4 6 8 10 12 14 16 18 20 22Chronological age (years of age)
Hei
ght g
row
th v
eloc
ity (c
m/y
ear) 18
1614
1086420
12
Figure 1 Height growth velocity curves of each subject (N=29).
PHV age = 12.9±1.0 years of age (Range: 10.9-15.3 years of age)
Table 1 Chronological and PHV ages of subjects

Football Science Vol.11, 39-47, 2014
Chuman K., et al.
http://www.jssf.net/home.html42
at 30 %, 50 %, and 70 % of the femur length. The areas of muscle, fat, and the femur were classified visually on the transversal images using a computer mouse. Muscle cross-sectional areas of the above three sections were determined by multiplying the number of pixels in the muscle portion by the area per pixel (1 pixel = 1.56 mm2). The value obtained by multiplying the average muscle cross-sectional areas of the three sections by the femur length was used as an estimation of thigh muscle volume.
Leg muscle powerLeg muscle power was evaluated using the vertical
jump and five-step jump tests. In the vertical jump test, video images (30 frames per second) of the jumping movement of individual subjects with a height calibration bar were recorded from the side. The tops of the heads of subjects were then detected on time-serial images from the difference in brightness by dedicated computer software. The height of the jump was calculated from the top-head position between the subject standing and reaching the highest point during jumping. In the five-step jump test, subjects started with both feet in the same position, jumped five steps with their left and right foot alternately, and landed on both feet at the end. The shortest distance between the toe at the starting point and heel at the landing point was measured and used as the score for the five-step jump test.
Aerobic fitnessAerobic fitness was evaluated by a graded
exercise test to exhaustion on a treadmill (SUPER TREADMILL ELG-2, WOODWAY). Subjects were asked to repeat 3-minute submaximal running with 1-minute breaks up to 4 to 6 times as the graded exercise. The submaximal running speeds were set to 180, 200, 220, 240, 260, and 280 m/min. Heart rate, oxygen uptake, and blood lactate were taken at each running speed during the test. Meta Max (Cortex Biophysik GmbH) was used to measure oxygen uptake and Lactate Pro (Arkray, Inc) was used to measure blood lactate levels. Blood samples were obtained from the fingers of the subjects within 20 seconds of submaximal running at each speed. More than two blood samples were collected and the mean value was used as the blood lactate value at each speed. When the blood lactate level under the submaximal speed exceeded 5 mmol/L, subjects were asked to end submaximal running. After a two-
minute interval, the running speed for V4
O2max was set to 280 m/min (if submaximal running ended at 240 m/min, this was performed at 260 m/min), and the inclination was increased by 1 % every minute until volitional exhaustion after 3 minutes of maximal running. V
4
O2max was determined by the highest average value of oxygen uptake for 1 minute during maximal running. While V
4
O2max was shown as both an absolute value (L/min) and value relative to body mass (mL/kg/min), we focused on the relative value (mL/kg/min) because the absolute value (L/min) in the pubescent phase is known to strongly depend on physical development (Krahenbuhl et al., 1985).
Statistical analysisDescriptive data were presented as mean values
± standard deviations. A two-way ANOVA with repeated measures (3 levels of maturation × 6 levels of age: 6 measurement times) was used to compare between the three maturational groups. In addition, a one-way ANOVA was applied at each measurement time, and when a significant difference was observed between the groups, multiple comparisons were carried out as a post-hoc test. Pearson’s correlation coefficient was used to examine correlations between the measurement items. SPSS 12.0J was used for all statistical analyses, and the level of significance was set as p < 0.05.
3. Results
Table 1 shows the age of subjects. A one-way ANOVA showed no significant difference in chronological age (F (2, 26) = 0.2, p > 0.05). However, significant differences were observed in PHV age (F (2, 26) = 40.7, p < 0.05) and relative PHV age (F (2, 26) = 34.8, p < 0.05) between the groups. Multiple comparisons conducted as a post-hoc test revealed that PHV age was significantly higher in the Late group than in the Average and Early groups, and significantly higher in the Average group than in the Early group. Relative PHV age was significantly higher in the Early group than in the Average and Late groups, and was significantly higher in the Average group than in the Late group.
Table 2 shows the descriptive statistics of subjects. Regarding Yo-Yo IR2 results, a significant interaction was observed for the maturational group × chronological age (F (10, 130) = 2.9, p < 0.05) (Figure 2). A one-way ANOVA revealed significant

Intermittent endurance development in pubescent soccer players
Football Science Vol.11, 39-47, 2014http://www.jssf.net/home.html
43
differences in the Yo-Yo IR2 results in ages from 12.9 to 13.8. Post-hoc tests showed that the Yo-Yo IR2 results in the Early group were significantly higher than those in the Late group at 12.9 and 13.8 years of age, and were significantly higher than those in the Average and Late groups at 13.4 years of age. At 13.4 years of age, the Yo-Yo IR2 results in the Average group were significantly higher than those in the Late group. The effect sizes between the Early and Late groups were calculated as 1.48, 4.05, 1.29, 0.77, 0.28, and 0.00 at 12.9, 13.4, 13.8, 14.3, 14.8, and 15.4 years of age, respectively.
Thigh muscle volume showed a significant interaction for the maturational group × chronological
age (F (10, 130) = 2.3, p < 0.05). A one-way ANOVA revealed a significant difference in thigh muscle volume in all ages (p < 0.05). Post-hoc tests showed that thigh muscle volume at all ages in the Early group was significantly higher than those in the Late and Average groups (p < 0.05).
The vertical jump test showed a significant interaction for the maturation group × chronological age (F (10, 130) = 3.5, p < 0.05). A one-way ANOVA revealed a significant difference in the vertical jump test in ages from 12.9 to 14.3 (p < 0.05). Post-hoc tests showed that the vertical jump test in the Early group was significantly higher than that in the Late group at 13.8 years of age, and was significantly
VO2max (L/min)・
Height (cm) ±Late 151.0 7.0 154.4±7.4 157.8±7.5 161.6 ±7.4 164.7 ±7.9 167.8±7.3
Average 157.1 ±6.2 161.6±5.9* 164.6±5.7 167.6 ±5.4 169.2 ±5.4 170.9±5.3
Early 165.0 ±5.8** 167.7±5.8* 169.7±5.5* 171.3 ±5.9* 171.8 ±5.7 172.7±5.9
Body mass (kg) ±Late 40.2 5.6 43.2±6.4 44.5±5.9 47.9 ±7.1 50.7 ±6.7 54.4±7.5
Average 44.6 ±4.2 48.6±5.3 51.1±5.4 54.0 ±5.7 56.5 ±5.5 58.4±6.1
Early 54.6 ±9.4** 58.4±9.0** 60.4±8.9** 63.5 ±8.5** 63.7 ±9.0* 65.5±9.5*
Thigh muscle volume (L) ±Late 2.96 0.47 3.36±0.57 3.68±0.68 4.09 ±0.81 4.50 ±0.86 4.88±0.83
Average 3.54 ±0.53 4.05±0.53 4.39±0.60 4.78 ±0.52 5.16 ±0.54 5.39±0.57
Early 4.56 ±0.81** 5.14±0.79** 5.44±0.84** 5.88 ±0.80** 6.07 ±0.90** 6.31± 0.89**
MaturitystatusItem
Chronological age (years of age)
Vertical jump test (cm) ±Late 40.8 5.1 42.4 ±4.6 42.6 ±4.4 46.0 ±6.1 47.3 ±5.8 49.7±6.6
Average 41.6 ±3.7 43.7±3.3 45.2±2.5 47.0 ±2.7 48.3 ±2.2 52.4±3.2
Early 46.8 ±4.2** 50.5±2.6** 48.6±4.7* 53.1 ±5.6** 50.4 ±4.5 53.7±3.9
Five-jump test (m) ±Late 9.58 0.66 9.61±0.65 9.94±0.62 10.43 ±0.85 10.99 ±0.93 11.37±0.89
Average 9.94 ±0.61 10.12±0.58 10.62±0.54* 11.21 ±0.79 11.54 ±0.67 11.70±0.52
Early 10.68 ±0.46** 11.13±0.36** 11.30±0.39** 11.44 ±0.65* 11.83 ±0.69 11.94±0.75
VO2max (mL/kg/min) ±Late 63.6 7.6 69.3±6.7 69.1±8.5 70.7 ±8.0 69.2 ±8.1 70.3±6.2
Average 67.4 ±5.5 70.6±3.8 69.7±3.9 72.1 ±5.5 70.8 ±5.0 73.5±5.4
Early 65.7 ±4.5 70.2±3.0 64.0±3.5 68.4 ±4.9 67.4 ±4.0 70.3±4.9
・
*; significantly higher than the Late group (p < 0.05)**; significantly higher than the Late and Average groups (p < 0.05)
Yo-Yo IR2 test (m) ±Late 289 52 369 ±66 556 ±129 618 ±146 764 ±208 804 ±179
Average 345 ±57 480 ±64* 611 ±62 698 ±105 771 ±154 822 ±160
Early 387 ±77* 618 ±57** 689 ±69* 716 ±107 809 ±93 804 ±86
9
11
9
9
11
9
9
11
9
9
11
9
9
11
9
9
11
9
9
11
9
±12.9 0.2 13.4±2.0 13.8±0.2 14.3 ±0.2 14.8 ±0.2 15.4±0.2N
(29)
±Late 2.54 0.31 2.97 ± 0.28 3.06 ±0.46 3.38 ±0.45 3.49 ±0.44 3.82±0.50
Average 3.00 ±0.30* 3.44 ±0.34* 3.57 ±0.36 3.88 ±0.33 3.99 ±0.35 4.27±0.25
Early 3.56 ±0.48** 4.08 ±0.53** 3.86 ±0.59* 4.34 ±0.63* 4.29 ±0.62* 4.60±0.63*
9
11
9
Table 2 Descriptive statistics for the three groups

Football Science Vol.11, 39-47, 2014
Chuman K., et al.
http://www.jssf.net/home.html44
higher than that in the Average and Late groups at 12.9, 13.4, and 14.3 years of age (p < 0.05).
The five-step jump test showed a significant interaction for the maturational group × chronological age (F (10, 130) = 3.4, p < 0.05). A one-way ANOVA revealed a significant difference in ages from 12.9 to 14.3 (p < 0.05). Post-hoc tests showed that the five-step jump test in the Early group was significantly higher than that in the Late group at 14.3 years of age, and was significantly higher than that in the Late and Average groups at ages from 12.9 to 13.8 (p < 0.05). Furthermore, the five-step jump test in the Average group at 13.8 years of age was significantly higher than that in the Late group (p < 0.05).
V4
O2max showed no significant interaction for the maturational group × chronological age (F (10, 130) = 2.0, p > 0.05), and no significant differences were observed in V
4
O2max between the groups at any age (p > 0.05).
Figure 3 shows age-related changes in the correlation coefficient of Yo-Yo IR2 results with thigh muscle volume, leg muscle power, and V
4
O2max in pooled data for all subjects. The Yo-Yo IR2 results correlated significantly with thigh muscle volume from 12.9 to 13.8 years of age (r = 0.45-0.62); however, no correlation was found from 14.3 to 15.4 years of age. The Yo-Yo IR2 results correlated significantly with those obtained from the vertical
jump and five-step jump tests from 12.9 to 14.3 years of age (r = 0.40-0.76); however, no correlation was noted at the ages of 14.8 and 15.4. In contrast, the Yo-Yo IR2 results did not correlate with V
4
O2max from 12.9 to 14.3 years of age, whereas a significant correlation was observed from 14.8 to 15.4 years of age (r = 0.50-0.58).
4. Discussion
This study was performed to examine differences in intermittent endurance between early and late maturing soccer players during the adolescent growth spurt considering associated factors using longitudinal data. When all subjects were included, the Yo-Yo IR2 results increased with age from 12.9 to 15.4 years (Figure 2). The JFA physical fitness project (2005) also demonstrated that the higher the chronological age, the better the Yo-Yo IR2 results in Japanese youth soccer players less than 18 years. We previously reported using cross-sectional data on junior soccer players aged from 13 to 18 years that the Yo-Yo IR2 results correlated with both the Wingate test score (W/kg), which is an index of anaerobic ability, and V
4
O2max (mL/kg/min), an index of aerobic ability (Chuman et al., 2013). However, when the analysis was performed exclude the influence of chronological age, the Yo-Yo IR2 results only
Figure 2 Yo-Yo IR2 results in the three maturity groups.
The interaction was significant. F (10, 130) = 2.9 (p < 0.05)*; significantly higher than the Late group (p < 0.05)**; significantly higher than the Late and Average groups (p < 0.05)
Figure 3 Changes in correlation coefficients of the variables with Yo-Yo IR2 results
●, ◆, ▲,■ (p < 0.05)○, ◇, △,□ (N.S.)
200
400
600
800
1000
*
***
*
12.9 13.4 13.8 14.3 14.8 15.4Chronological age (actual years of age)
Yo-Y
oIR
2 te
st r
esul
ts (m
)
Early groupAverage groupLate group
0.00
0.20
0.40
0.60
0.80 Thigh muscle volumeVertical jump testFive-jump testVO2max
Cor
rela
tion
coef
ficie
ntw
ith Y
o-Yo
IR2
test
res
ults
・
12.9 13.4 13.8 14.3 14.8 15.4Chronological age (actual years of age)
-0.20

Intermittent endurance development in pubescent soccer players
Football Science Vol.11, 39-47, 2014http://www.jssf.net/home.html
45
correlated with V4
O2max (mL/kg/min). These findings indicated that improvements in the Yo-Yo IR2 results with advancing age in junior soccer players can be largely attributed to the corresponding development of anaerobic ability with maturation, and also that the Yo-Yo IR2 results should be higher in players with higher aerobic ability when their maturity status is considered.
Therefore, subjects at the same age of 12-13 years in the present study were classified into three maturational levels’ Late, Average, and Early groups, in order to compare their Yo-Yo IR2 results. The results obtained from the longitudinal data confirmed significant differences in the increase in Yo-Yo IR2 results between the Late and Early groups (Figure 2). Based on the effect sizes calculated between the two groups, differences were evaluated as large from 12.9 to 14.3 years, moderate at 14.8 years, and absent at 15.4 years of age based on the standards by Demura & Yamaji (2011). The effect size at 13.4 years was twice that at 12.9 years, and was more than three times that at 13.8 years of age; thus, the effect size at 13.4 years was markedly larger than that at 12.9 and 13.8 years, which highlighted a large difference at 13.4 years in the Early and Late groups. In contrast, this difference decreased after 13.8 years and disappeared by 15.4 years of age. We previously reported that the maximum rate of growth in Yo-Yo IR2 results for pubescent soccer players occurred immediately after PHV age (Chuman et al., 2011b). In addition, individual variations of 4-5 years in the PHV age have been reported (Figure 1). Therefore, the junior soccer players in this study may have had different spurt timings for Yo-Yo IR2 performance between the Early and Late groups, which may have led to the results described above.
The Yo-Yo IR2 results were correlated with thigh muscle volume from 12.9 to 13.8 years, and with the vertical and five-step jump tests results from 12.9 to 14.3 years of age (Figure 3). We previously demonstrated that the Yo-Yo IR2 results for soccer players aged 12-13 years were influenced by leg muscle power (Chuman et al., 2009). Muscle power is calculated by multiplying muscle strength by contraction speed. Muscle strength has a proportionate relationship to muscle cross-sectional area, and muscle contraction speed has a proportionate relationship to muscle length, which implies that thigh muscle volume calculated by multiplying muscle cross-sectional area by the
femur length (muscle length) reflects leg muscle power. Thigh muscle volume and the vertical jump and five-step jump tests are all associated with leg muscle power. However, a significant correlation of thigh muscle volume with the Yo-Yo IR2 results was found until 13.8 years whereas those of vertical jump and five-step jump tests were until 14.3 years. We currently cannot explain this, but speculated that the vertical jump and five-step jump tests are multi-joint movements, similar to Yo-Yo IR2, that need not only the quantitative development of muscle, but also the neural control of movement related to the recruitment of motor units and firing rates.
The Yo-Yo IR2 results correlated with V4
O2max relative to body mass (mL/kg/min) at the older ages of 14.8 and 15.4 years (Figure 3). Previous studies reported that the Yo-Yo IR2 results for adult or post-puberty soccer players aged 16-17 years reflected V4
O2max (Bangsbo et al., 2008; Chuman et al., 2011a; Krustrup et al., 2006). On the other hand, we did not find a correlation between Yo-Yo IR2 results and V4
O2max in players aged 12-13 years old in a previous study (Chuman et al., 2009), which is consistent with the results of the present study. Taken together, these findings indicate that performance of Yo-Yo IR2 may have been markedly affected by the development in leg muscle power at and before 14.3 years of age, and aerobic fitness at and after 14.8 years of age. The differences among the groups observed in this study may result from this age-related change of a factor that determines performance of the Yo-Yo IR2.
The Yo-Yo IR2 results correlated with the vertical jump and five-step jump tests between 12.9 and 14.3 years, and the results of both jump tests were significantly higher in the Early group than in the Late group. Philippaerts et al. (2006) reported that growth spurts become evident in both jump tests from six months before the PHV age, peaked at the PHV age, and continued for 1 to 2 years after the PHV age. However, as was observed in the present study (Figure 1), a wide range of variations, as high as 5 years, existed in the timing of PHV or physical maturation even in the same age group during puberty. Therefore, the maximum growth rate in leg muscle power occurs earlier in early-maturing players than in late-maturing players, and early-maturing players acquire greater leg muscle power in the earlier stage of the adolescent growth spurt (Lefevre et al., 1990). Therefore, the Yo-Yo IR2 results for early-maturing players at 14.3 years of age or younger may

Football Science Vol.11, 39-47, 2014
Chuman K., et al.
http://www.jssf.net/home.html46
have been better simply because these players had developed greater leg muscle power.
In contrast, when Yo-Yo IR2 results correlated with V4
O2max relative to body mass between 14.8 and 15.4 years of age, no significant differences were observed in V
4
O2max between the Early and Late groups. We previously reported that V
4
O2max in pubescent soccer players aged 12 to 13 years reached almost the same level as post-pubescent and professional soccer players. This finding suggested that V
4
O2max in soccer players may have been influenced to a lesser extent by physical maturation (Chuman et al., 2011a). Vanden Eynde et al. (1988) also showed that V
4
O2max in terms of a relative value to body mass was not significantly different for three years before and after the PHV age, suggesting that V
4
O2max (aerobic fitness), unlike other physical fitness components, was not affected by physical maturation. This also indicates that the Yo-Yo IR2 results for late-maturing players catch up with those for early-maturing players after 14.8 years of age because late-maturing players can acquire the same level of V
4
O2max as early-maturing players independent of the stage of maturity.
In conclusion, intermittent endurance developed earlier in early-maturing players than in late-maturing players during the adolescent growth spurt, and resulted in the temporary expansion of differences in intermittent endurance between early and late-maturing players. However, intermittent endurance developed later in late-maturing players than in early-maturing players, and this difference decreased gradually until it finally disappeared at approximately 15 years of age. This phenomenon has been associated with differences in the concomitant development of leg muscle power with physical maturation and is the most likely reason for the differences observed between early and late maturing players. Therefore, although a temporal advantage in Yo-Yo IR2 results may appear in early-maturing players during the early phase of the adolescent height spurt, soccer players must acquire high aerobic fitness to attain a higher level of intermittent endurance regardless of individual differences in the stage of maturity.
ReferencesBangsbo, J. (1994). The physiology of soccer with special
reference to intense intermittent exercise. Acta Physiologica Scandinavica, 151, Suppl. 619: 1-156.
Bangsbo, J., Iaia, F.M. & Krustrup, P. (2008). The Yo-Yo intermittent recovery test: a useful tool for evaluation of physical performance in intermittent sports. Sports Medicine,
38(1): 37-51.Chuman, K., Hoshikawa, Y. & Iida, T. (2009). Yo-Yo intermittent
recovery level 2 test in pubescent soccer players with relation to maturity category. Football Science, 6: 1-6.
Chuman, K., Hoshikawa, Y., Iida, T. & Nishijima, T. (2011a). Relationships between Yo-Yo intermittent recovery tests and development of aerobic and anaerobic fitness in U-13 and U-17 soccer players. International Journal of Sport and Health Science, 9: 91-97.
Chuman, K., Hoshikawa, Y., Iida, T. & Nishijima, T. (2011b). Yo-Yo intermittent recovery level 2 test performance and leg muscle growth in a 6 month period among pubescent soccer players at different stages of maturity. International Journal of Sport and Health Science, 9: 105-112.
Chuman, K., Ikoma, T., Hoshikawa, Y., Iida, T. & Nishijima, T. (2013). Yo-Yo intermittent recovery level 2 test in young soccer players from U-13 to U-18. In H. Nunome, B. Drust & B. Dawson (eds), Science and Football VII (pp.101-106). New York: Routledge.
Demura, S. & Yamaji, S. (2011). Simple statistics for health and sport science (pp.150-151). Tokyo: Kyorin-shoin. (in Japanese)
Figueiredo, A.J., Coelho e Silva, M.J. & Malina, R.M. (2011). Predictors of functional capacity and skill in youth soccer players. Scandinavian Journal of Medicine & Science in Sports, 21(3): 446-454.
JFA physical fitness project (2005). Evaluation of physical p e r f o r m a n c e 2 0 0 6 . To k y o: JA PA N F O O T BA L L ASSOCIATION. (in Japanese)
Krahenbuhl, G.S., Skinner, J.S. & Kohr t, W.M. (1985). Developmental aspects of maximal aerobic power in children. Exercise and Sport Sciences Reviews, 13: 503-538.
Krustrup, P., Mohr, M., Nybo, L., Jensen, M.J., Nielsen, J.J. & Bangsbo, J. (2006). The Yo-Yo IR2 test: physiological response, reliability, and application to elite soccer. Medicine & Science in Sports & Exercise, 38(9): 1666-1673.
Lefevre, J., Beunen, G., Steens, G., Claessens, A. & Renson, R. (1990). Motor performance during adolescence and age thirty as related to age at peak height velocity. Annals of Human Biology, 17(5): 423-435.
Malina, R.M., Cumming, S.P., Kontos, A.P., Eisenmann, J.C., Ribeiro, B. & Aroso, J. (2005). Maturity-associated variation in sport-specific skills of youth soccer players aged 13-15 years. Journal of Sport Sciences, 23(5): 515-522.
Malina, R.M., Eisenmann, J.C., Cumming, S.P., Ribeiro, B. & Aroso, J. (2004). Maturity-associated variation in the growth and functional capacities of youth football (soccer) players 13-15 years. European Journal of Applied Physiology, 91(5-6): 555-562.
Malina, R.M., Ribeiro, B., Aroso, J. & Cumming, S.P. (2007). Characteristics of youth soccer players aged 13-15 years classified by skill level. British Journal of Sports Medicine, 41(5): 290-295.
Philippaerts, R.M., Vaeyens, R., Janssens, M., Renterghem, B.V., Matthys, D., Craen, R., Bourgois, J., Vrijens, J., Beunen, G. & Malina, R.M. (2006). The relationship between peak height velocity and physical performance in youth soccer players. Journal of Sport Sciences, 24(3): 221-230.
Rampinini, E., Sassi, A., Azzalin, A., Castagna, C., Menaspà, P., Carlomagno, D. & Impellizzeri, F.M. (2010). Physiological determinants of Yo-Yo intermittent recovery tests in male soccer players. European Journal of Applied Physiology, 108(2): 401-409.

Intermittent endurance development in pubescent soccer players
Football Science Vol.11, 39-47, 2014http://www.jssf.net/home.html
47
Randers, M.B., Jensen, J.M., Bangsbo, J. & Krustrup, P. (2009). Match performance and Yo-Yo IR2 test performance of players from successful and unsuccessful professional soccer teams. In T. Reilly & F. Korkusuz (eds), Science and Football VI (pp.345-349). New York: Routledge.
Vanden Eynde, B., Vienne, D., Vuylsteke-Wauters, M. & Van Gerven, D. (1988). Aerobic power and pubertal peak height velocity in Belgian boys. European Journal of Applied Physiology, 57: 430-434.
Name: Kentaro Chuman
Affiliation: YAMAHA FOOTBALL CLUB CO., LTD.
Address:2500 Shingai, Iwata-shi, Shizuoka 438-0025 Japan
Brief Biographical History:2003-2005 Master’s Program in Health and Physical Education, University of Tsukuba2009-2012 Doctoral Program in Physical Education, Health and Sport Sciences, University of Tsukuba2004-2010 Physical coach, Jubilo Iwata Youth Academy2011- Scout & Physical adviser, Jubilo Iwata
Main Works:• Chuman, K., Takahashi, S. & Nishijima, T. (2004) Dynamic
characteristics of muscle in preadolescent boys. Human Performance Measurement 1: 30-35.
• Chuman, K., Takahashi, S., Nakano, T. & Nishijima, T. (2005) Dynamic causal structure analysis of condition f luctuation factors in a soccer player. Football Science 2: 1-7.
• Chuman, K., Hoshikawa, Y. & Iida, T. (2009) Yo-Yo intermittent recovery level 2 test in pubescent soccer players with relation to maturity category. Football Science 6: 1-6.
• Chuman, K., Hoshikawa, Y., Iida, T. & Nishijima, T. (2011) Relationships between Yo-Yo intermittent recovery tests and development of aerobic and anaerobic fitness in U-13 and U-17 soccer players. International Journal of Sport and Health Science 9: 91-97.
• Chuman, K., Hoshikawa, Y., Iida, T. & Nishijima, T. (2011) Yo-Yo intermittent recovery level 2 test performance and leg muscle growth in a six-month period among pubescent soccer players at different stages of maturity. International Journal of Sport and Health Science 9: 105-112.
• Chuman, K., Hoshikawa, Y., Iida, T. & Nishijima, T. (2013) Relationship between sprint ability and maturity in elite and sub-elite pubescent male soccer players. Football Science 10: 10-17.
• Chuman K., Ikoma T., Hoshikawa Y., Iida T., Nishijima T. (2013) Yo-Yo intermittent recovery level 2 test in young soccer players from U-13 to U-18. Science and Football VII: 101-106.
• Chuman, K., Hoshikawa, Y., Iida, T. & Nishijima, T. (2013) Quasi-simplex structure among physical ability factors with relation to sprint speed in pubescent male soccer players. Football Science 10: 57-64.
Membership in Learned Societies:• Japanese Society of Science and Football