paper c.m. 1990/ c: 15 sess. p s-60176 norrköping, sweden doccuments/1990/c/1990_c15.pdf ·...
TRANSCRIPT

1I,. ,
h..
ICES 1990 -PAPER C.M. 1990 / C:15 Sess. P
•
Remotely sensed water mass distributions and large scale seasurface circulations in the Skagerrak.
by
Bertil HäkanssonSwedish Meteoroligical and Hydrological InstituteS-601 76 Norrköping, Sweden
ABSTRACf
The sea sutface temperature remotely sensed from the weather satellites in the NOAA-series is
used to identif~ water masses in the Skagerrak area. Data from May 17 and 18, 1989 are
compared with almost simultaneous in situ data of hydrography, showing good correspondance
between sea surface salinity and temperature distributions. The case demonstrates that the sea
sutface temperature can be used as a tracer for the water masses in the area, determined
otherwise wi~ only in situ salinity or a combination of in situ salinity and temperature:' The
remotely sensed sea sutface temperature have a geometrie and radiometrie resolution of 1 km
and 0.12 K, respectively. The satellite data shows the synoptie view of the upper layer of the
oeean to a much beuer extent than any ship data, allowing detailed analysis of even relatively
small seale events such as eddies in the Skagerrak. Coneeeutive images with about 12 hours
interval are used to calculate sea sutfaee drift velocities with a method tested by Svejkovsky
(1988).
Validated sea sutface temperatures from May 17, 1989 indicates that an anticyclonie eddie takes
place in the NO Skagerrak. This may be caused by the large seaIe eyclonie circulation in the
main part of the Skagerrak interaeting with the boundaries of the ~ea. This circulation is
probably driven by westerly and southwesterly winds. In this case the Baltie current is blocked
at the Swedish coast, forcing the current to move in a northwesterly direction. This circulation
has not been observed ealier with traditional methods of current measurements.
0"" ...

._-- -----------_._-----_._-----
•
•
Remotely sensed rind in silu observations of water mass distribution ariddynamics in the Skagerrak.
1. IritroduCtion
SkageITak is a traIlsitiona1 area betWeen the Baltle imd the North Sea. it reeeives in the stiiface
layer low salinity water froIll the Kattegat arid the Baltie Sea with the Raltie ctirrent arid high
salinity water from the North Sea with the Jutland and Dooley curreri~s. In the lower layer high
salinity water is also entering along the southem boundary with inflows from the North
Atlaritie. These eurrents inake up the large seale eyclonie circuhitiori often found in theSkagerrak (Svansson, 1975). The Dooley eurrent is less known and is only occassionally
diseussed in the litterature. The Jutland and the Baltie eurrent are variable in magnitude, theformer appears to be winddriven and the latter density driven.
• Outflows iri the sunace iayer geriei-aIiy takes phice along the NOrWegian coast with the
Norwegiari Coastal Ctirrent (Saetie and Mork, 1980) , which occasionally can be blocked by
westerly wind events (Mork. 1981). There is also an outnow iri the lower layer along the
Norwegian eoast. Detiiled current measurements along the triinsect between Norway arid
Derimark investigated by Rodhe (1987). imllcate that the eyclonie gyre is most pronoUnced irithe lower layer with maximum mean flows along the bonom. lrithe'sllrface layer the cYclonie .
circuiation of the mean flow is weak with the largest variability in eurrent strenghi arid direetion
found alorig the rigid boundaries of Skagerrak.
The surfaee curreriis entering the Skagerrak originates in areas where the anthropogenie
influence is considernble. The transport of this material to the SkageITak may be of irnponance, ,
.to the eeosystem in the area. where exceptional blooms ofphytoplankton arid oxygen defieit
bottom layers in some 'coastal sites has 1?6en observed iri receni years. It is also put forward thai
the geographie variation of the stratification contribute to the patchiness in phytoplankton
distributiori (Richardsson. 1989). Hence. an increased understaridirig of the hyetrographie
processes in SkageiTäk. and especially in the surfaee layer is necessary. \Vith this in rrimd the
airri of the preserit investigation is to g~ve a qualitative deseription of a near synoptic event ofcircuiation arid hydrography in the upper part of the Skageri-ak:. Deiailed horizontal distributionsof the wäter masses arid drift velocities Me detennined by rerrioteiy sensed images of the seasurfaee ternpecirii!e arid surve)ririg sWp measriremerits of the hydrographY. The results fromthese different rrieasUrement techruques are qu3.litativeiy integratoo iri order to increase the
accuraey of the interPretation. For exarnple. in the northeastem part of the Skagerrak an
anrlcycioriic eddie was fOUnd, whieh had a pronoimced irifluence on the coastal waterdistribution arid on the patbway of the Baltic current. Details which eouid riot be obtained from
. the ship transect meäsmeinents alone.
1
,,':

•
----------------------------
•
2
Remote sensirig have previously been used in some studies of water masses and withphytopiankton ciistributions. Pingree et. al. (1982) used infra-red satellite images imdhyclrography durlng a late summer situation (August 1981) to interpretate tbe planktonpatchiness. They fourid ~ relatively colder sUrface regiori in the middle of the Skagerrak,reflecrlng the area where the pycnocline was shaiIow. The relatively colder water was
circumferencoo byw~er water in which tbe currents were in geostrophic balance, muting the
doming of the pycnocline fourid in the cold spot. This rloIning was f6und to favour a rlch~, '- ,
biomass Withiri the pYcnocline. Remotely sensed sea sunace temperature as a trilcer for watermasses in th6 area was also used during the Chrysochromulina Polylepis blooin iri 1988. The
idea was that the bloom was advected with the wann and low salinity surface water of the Baiticcurient from the Kattegatt along the Swedish and Norwegian coasts into the North Sea. ntis
drift observoo from satellite images corresponded with in situ measureinenis of chlorophyllconient (Johannessen et. al., 1989). These stuclles indicate that it is possible to use remoiely
serised sea surfac6 temperatiire as a tracer of surface water masses, which ein indirectly berelated to phytoplankton distribution when iri situ measuiments are avaiiable.
Water masses may also b6 irac:oo, using the optical conditions in the sunace layer obserired
with satellite images. Totill suspended matter ai1d chlorophyll content are retrievable arid well
understOOd in oeean water ( More! case one water), whereas in cOaStal seas the interpretation ofsatellite images for quantitative evahiation of these prirameters are less kriown. Here
nonbiological pamcles contribute to the total amount of suspended matter, which may create
ambiguities in the image analysis of chlorophyll content. Also the amo.:mt of yellow substancesis knOwrl to b6 high in the Skagerrak and especially in the low saiiriity parts of the watermasses. How this contlibute to the optical conditions and influencies the analysis tecimiques inremote sensing is not yet clear. There~ nevertheless studies made iri the area by Aarup et al(i987, 1989) using CZCS images. They.conclude thai so far it is possible to obtain semlquantitative assessrrientS oe chlorophyll which is a valuable indicilior of dynarn1c processesfrom time senes of images. For more accurate estimates of optical proPerties there is an urgentneed for a whoie senes of bio-oprlcal measurements to establish a comprehensive set of
; ,. .. - ,. ""
calibration data. A dewcatoo airbOrne experiment for this purpose was conducted by Norwegianinstitutions dUiing the spring i989 in Skageri-ak (pettersson, 1989 and 1990). ether studies inthe field and coverlrig the SbgeiTalc area are reported by Sörensen et al (1989) ancl iiäkänssori(1989). These mainly focus on coastal areas afirl the Glomma river ouiflow. Herice, there is aneed for furtber investigatlons with satellite arid simultaneoüs in situ dara ofoprlcai properrles to
obtain calibrarlon data iri offshore mas. From the pOint of View ofoceanogrnphy, however, th6mentloned siuclles iridiciues that the iritegratlon of ship and satellite ciatii weIl benetits arid make
progress to th6 unclerstandirig of tbe physical arid biological oceanography in the Sk:lgerrak,

·e
•
although tbe chlorophyll content is not yet accUrately retreivabie.
in the foiiowing Sectlon of this paper"tbe results from the validation of the reirieverl sea surface
iemperattire is presented. The interpretation of remotely sensed arid in situ gathered
measurements is discussed in Section 3, whereas the condusions are suiriinarlzed in the final
Seetion.
2. Calibration of sea surface temperritures from AVHRR sensor
The methodology of retrieving sea sulface temperiltUre from sateIDteborne sensors in thethermal dectromagnetic band orten make use of multlspectril.1 techniques to eliminate the
contributions öf atmospheric water vapour (Robinson et.alI984). This so called split window
technique is used in the present study on three images which are compared with in sini
measurements of bulk sea surface temperatures in the Skagerrak. The expression userl forretrleVing this teniperature has the following form:
3
"
MCSST = T4 + 2.5 (T4 - T5) - 0.96 (2.1)
The second term which represent the difference between the brlghtriess temperaiure in the
AVHRR channel four and five are smoothed using a3*3 median rilter to supress the noi~e
generated by lhe algebraic calculatiori (Barton, 1989). In this way surface temperature
strucrures are tnaktaineci in the MCSST ('MUlti Chaririel Se~ Surface TemperatiIre) image.
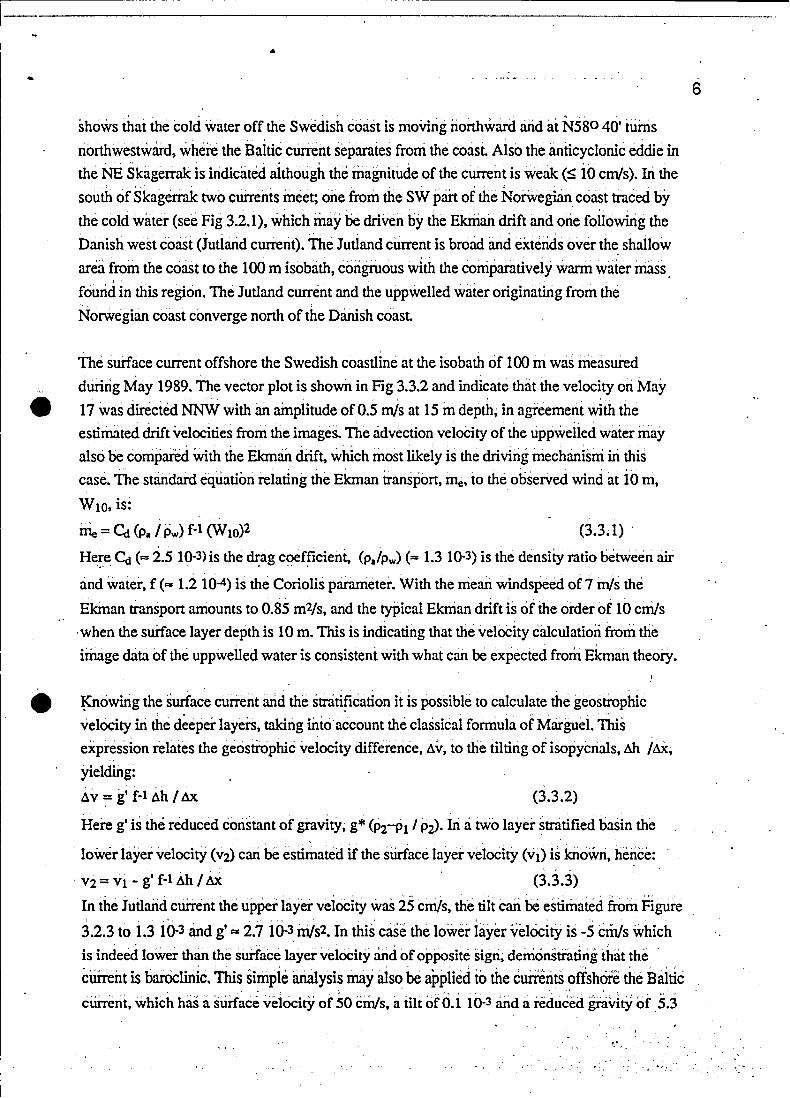
The ship trarisects are schemaiically shown in Figure 2.1, the east-west transect en20mpass 12
hydrographie stations which were ~ove~ed within 18 hours on May 17, whereas the main pari
of the non-south transect was covered within 10 hOufs on May 18, 1989 (the three stations
dosest to the Deninark coast was sampled during May 19). DUring these surveys three AVHRR
(Advariced Very High Resolution Radiometer) images have been used for calibriition of the
algorithrl1 ofMCSST. In the beginning ofthe east-west transect an image from May 17,0226
GMT was obtained, whereas the other was from May 17, 1221 GMT when the major part of
the trimsect was endecl. in order to comparc' image and in situ data as similltaneous as possible
the values of MCSST were selected froni both images from M~y 17 and the image data fromMay 18 were seleded to be as dose as possible With lhe iri' sÜu data. The result from thecomparison is preserited iri Figure 2.2 from' which the correlation coefflcient was foimd to be
0.91, iridicating the validity of lh6 MCSST. .
The tempocil variation of bulk sea surface iemperilture at tbe cmistal station of Väderöarna have. '..' " . ' ,"., ~ -': ';, " . .been used for companson With the Satdlite data. The cOaStal station meastirem~nts of the ri.iriemperariire and the water terriperatuie at 5meters depth rife shöwn in Figure 2.3, indicatlng ä
~ _ , .,. _ , • . , 1
dose relatioriship bdween cUr arid water temperatures. Both variables demor1stnites a dailyI
. ' ' . ·.~·~·~",.f .' - .

•
< ••
•..
4
hearirig and coolirig cycle arid an almost linear increase iri tempernnrre on the time sc3J.e of a
week. The diily variation durlng May 17 was 1.3 K and the mean iriciease was aootit 0.7 Kbetween May i7 arid i8. The corresponding v3J.ues obtained from the horizolliaÜy averaged
MCSST coveririg an area of 87*87 km2 in the central Skagerralc were 0.2 and 0.5 K(thlstemperature difference was calculated using the night images from Maj 17 and 18,1989). ThecmlstiiI site is apparently more influenced by the daily variation of the air temperature thän theopen sea off the coast. The trend in the increase of the mean daily sea.sulface terriperature is,however, of the same magnitude.
3~ Resuits and discussion3.1 Hydrography a1uJ wind
The wind speed arid direction the period before 17 and 18 May, i989 (corresponding (6 theiulian days 137 and 138) was characierized hy SW winds with daily mean speeds of 6 to 9 iri/saccording to observations at the coasiaI sites Mäseskär and Koiier (see Figure 2.1). Thissituation was persistent during four days before th6 studied event During westerly winds
uppweUing along the Norwegian coast inay talce place and will be weU cleveloped on the tiine. .sc3J.e of a week. The hydrographic survey along the seetion across the Skagerrak indeed
indicate that uppwelling is occurring. The salinity distribution pres~nted iri. Figure 3.1.1 showatilting from ten metres depth to the sUlface and is clearly shown in the horizontal temperature
distribution of Figure 3.2.1.
In generiU the pycriocline, which iri Figure i 1.2 and 3.1.3 is iridicated by the halocllrie, isfound between 10 and 20 mettes clepth, ~hereas the halocline becomes thicker arid tilted alongthe cOaStai bouridaries iridicatirig goostrophic currents. Alollg the Danish coast the stllface
ctirrent <JtitIaricl current) moves easiVIard arid along the Swedish coast the naitic ciirieni isO
fouod abOve ten metres depth exteoding about 10 km offshore. The tippwelling aloog the
Norwegiari coast appears to block any suiface outflow along the coast Beneath the rimin
halocline, however, the isohaline tilting iridicates a cyclonic circulation in the whole Skagerrak.
32 Sea surjace iemperaiure and salimty,The~~,~blliion of the, ~ea ~u;race temperature shown in Fig. 3.2.1 is obtained by averngillg theMCSST unages from May 17~ This unage represent the meari. tempernnire 'distribution aridshould be comparnble with the less synoprlc shit> data. The map of sllifacc' saÜnity<5 metersd.epth) showri. in Fig. 3~2.2 is obtained from the ship data. The distribution of these tW6
I " ,,", "",;,' "', " ';'. '.' .." ! ..' >
variables shows sirmlar featUres, regarding the location of tWo frontal zones. One is the front of
tbe Baitic cirrrerii offshore the S~edish coast iri. wWch the magnitUde of the horizontal salinityarid temPerature gradieniS (S-l * fj.s/tix.) and (T-1 * fj.T/tu ) are approxim~lteIy ...12.8*10-3arid -
i2.S*lO-3 iari-i, respectively. The second is the front betweeri the inii~r änd'otiter Skagerciic
... . ..' ; ~ ..~. .'

....
sllIface water alorig the transect from Aiericiai to Hirtshals. In this frontthe saIinity gradient is
weaker on the Danish side of the trarisect than on the Norwegian. 1n6 iargest griidieoisofs:ilinitY arid temperature fouod in this region are +13.8*10-3 arid -4.8*10-3 kIll-I, respecrlveIy. The
appearance of this front iridicates that the inner Skagerrak sllIface water is blocked and cannot
leave the rirea along the Norwegian coast.
The scarcity of ship data in other areas of Skagerrak limits the analys~s to this basinwide scale,
whereas more detailed information about the distribution of surface water masses may beobtained from the remotely sensed temperature data shown in Fig 3.2.1 and 3.2.3. Note
especially that the Baltic current (temperature ~1O.5 oe) does oot extend along the Swedish
coast north of N580 40' as the surface salinity distribution appeaci to indicate, but is forcedoffshore. The river Glomma plym is exiencllng from the eastern to the western side (image iromMay 1'7, GMT 1221, 1989) of tbe mouth of the Oslofjord from where it makes a sharp },erid to
southeast. These two features indicate that an anticyclonic eddie is formed in the NO Skagerrak,
forcing the Baltic current offshore ancl the river plym to southeast FUrthermore a cold iunge of
surface water appears to circumvent awater mass chamcterized by higher teinperature arid
salinity <T ~ 10.5 oe and 28 ~ S~ 29 PSU) than the surrounding water mas~es in the iriner
part of Skagefrak. Close to the NOrWegiari coast in tbe NO SkagerTak this "cold;' water mass
separates in two brariches· one to the east probably forming the ariticyclonie eddie and one tothe southwest. Along the shallow areas ( ~ 50 m) offshore the Danish eoast a warm water mass .is located. This temperature distribution is fourid in the tlu-ee images from May 17 and 18,indieating a persistent hydrographie stnicture to which a tentative sllIface circulation has beeri
discussed. In the foUowing section this eirculatiori wiri be quatiiatively verifiecl to some extent .
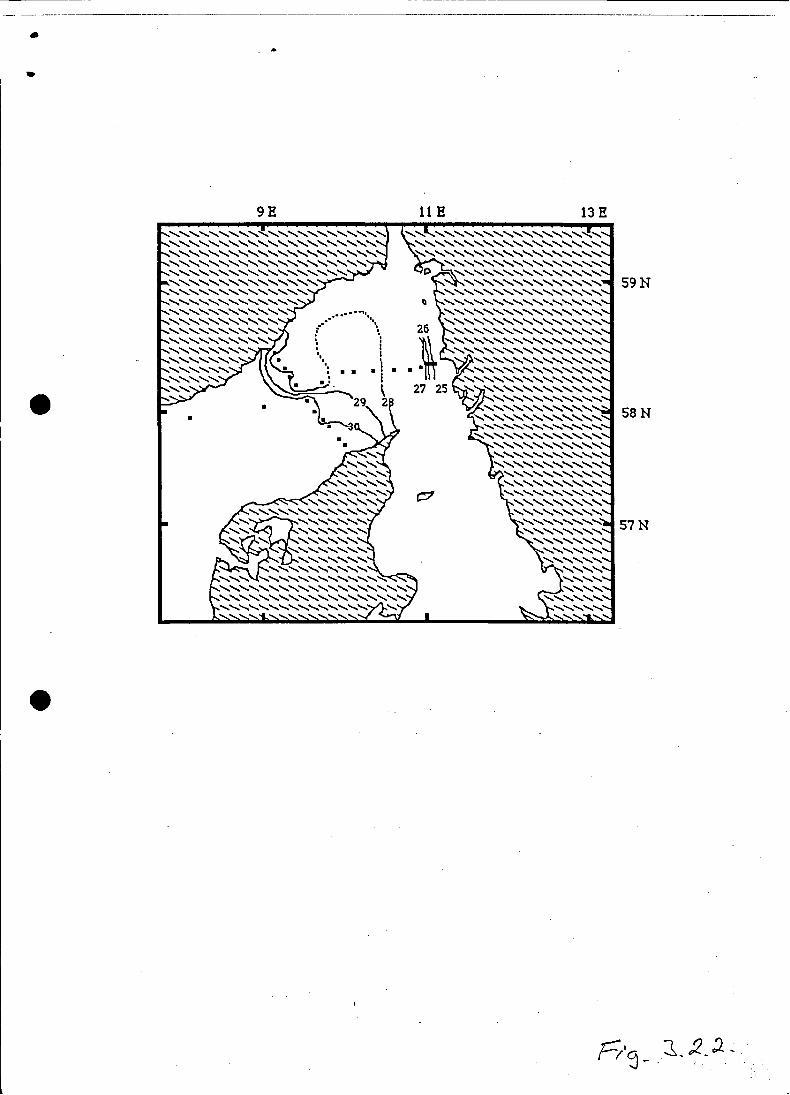
33 LtiTge seale sea sUr/ace cireulationTo study frontS, water masses and velocities it is not riecessary to calibrnte the images to
absolute temperatures. Instead, the single channel brightness temperature with the relative
accuracy of the 0.12 K (NOAA-AVHRR) is used. The velocity estitriates are made by
idenrlfying arid foUoWirig temperature patterns in images with at least 6 hOUfS interVäl
(Svejkovsky, 1988). He found an accuracy of 0.06 inJs at veiocities lower than 0.4 iriJs,comparing surface drOgue data and estimated flow velocity from sateUite images with 12 to 24hours interval. This technique is bas&! on a manual identification of featUres arid may thus be
subjecrlvely influenced by the interpretator to some degree. Iri th6 present work the e~tiiruited
veiocities should be recognized as an iridication of a probable circulatiori.The estimated sllIface
flow velocitles from May 17 are shown in Fig 3.3.1. These are not evenly cllstrlbuted since it is
not possible to ruid features in all area.s withiIl the images.
Nevertbeiess. the circulaclon is in agreemerit \\'ith the water mass distribution in general. ItI
..
5
....
shows thai the cold water off the Swedish coast is moVing nolthwarci arid ai N580 40' turns
northwestward, where the Baitic current separates from the coast Also the anticyc10nic eddie in
the NE Skagerrak is indicatCd aithough the magnitude ofthe current is weak (S 10 cIn!s). Iri the
south of Skagerrak twO cuirents meet; one from the SW part of the Norwegian coast tiaced by
the cold water (see Fig 3.2.1), which may be driven by the Ekrriari drift arid one followirig the
Danish west cmist (Jutland current). The Jutland cirrrent is bro3rl and exteods over th~ shallow
areä from the coast to the 100 m isobath, congruous with the comparatively warm water InaSSfouod in this region. The Jutland current and the uppwelled water originating from the
Norwegian coast converge north of the Damsh coast
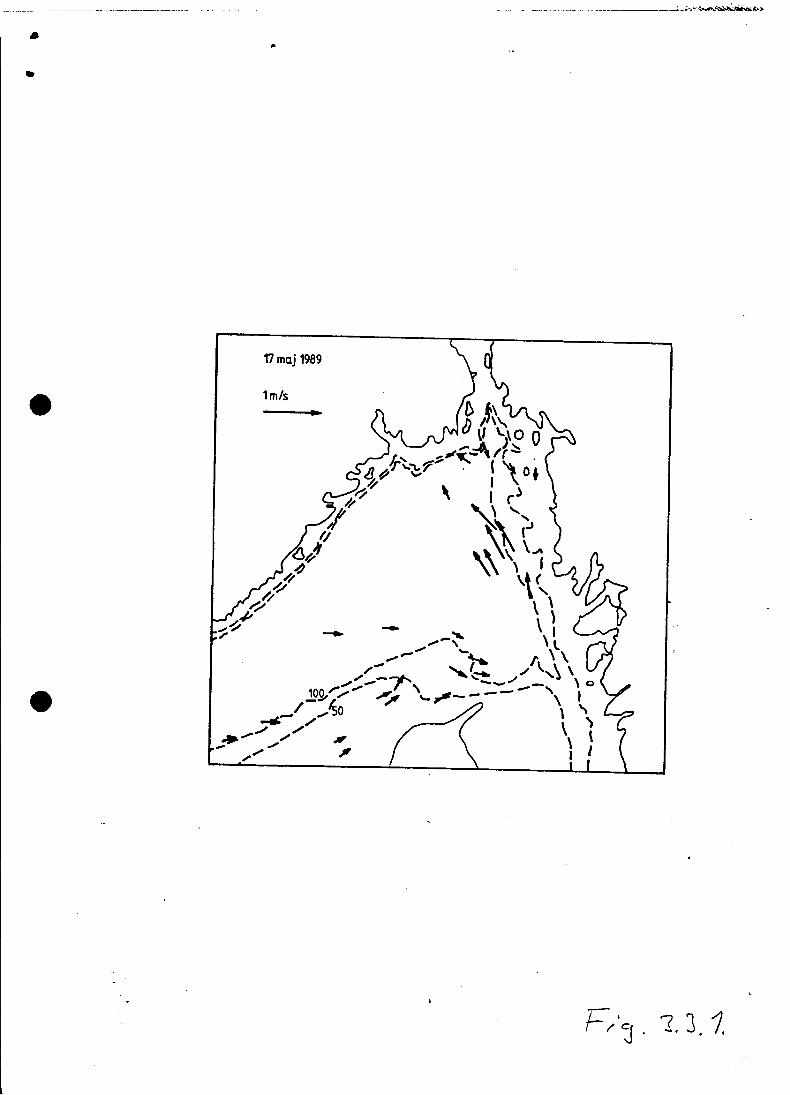
Th6 surface current offshore the Swedish coastline at the isobath of 100 m was measured
duririg May 1989. The vector plot is shown in Fig 3.3.2 and indicate that the velocity on May
• 17 was ciirected NNW with an amplitude of 0.5 rn/s at 15 tri depth, in agreement with theestirnated cirirt velocities from the images. The advection velocity of the uppwelIed water may
also be compared with the Ekman drirt, wWch most likely is the driving mechariism in this
case. The stancIard equation relating the Ekman transport, 11le. to the obserVoo wind at 10 m,
WlO, is:
iTIe = Ci (Pa i Pw) f-t (W1O)2 (3.3.1) ,
H~~e Ctt (". 2.5 10-3) is the dI:ag ce>efficien~ (Pa/pw) (". 1.3 10-3) is the density ratio betWeen air
and water, f (". 1.2 10-4) is the Coriolis pararrieter. With the mean windspeCd of 7 in/s the
Eicirian transport amounts to 0.85 m2/s, and the typical Ekrrian drift is of the order of 10 crit/s
'when the sufface layer depth is 10m. This is indicating that the velocity calculatlori from the
image cIata ofthe uppwelled water is consistent with what can be expected from EkriJ.an theory.
6
• ~owirig the surface cuirent and the striiti!ication it is possible to calculate the geostrophic
velocity iri the d~eper layers, takirig mto'account th6 c1assical fonnula of Marguel. This
expression relates the geostrophic veiocity difference, AV, to the tilting of isopycrials, Ah lAx.yielding:
AV:= g; f-t Lih I~ (3.3.2)
Heie g' is the reduced coristant of gravitY. g* (P2-PI' P:z). Iri a two layer stnitified basin the
. lower layer velocity (V2) can be estimatCd ir the sUrface layer velocity (vI> is kIlown, hence:
. V2 = VI - g' f-t ~h I Ai (3.3.3)
In the jutland current the upper layer veioeity waS 25 crn/s, the tilt cari be esrlrriated froIll Figure
3.2.3 to 1.3 10-3 arid g'". 2.7 iO-3.riils2• In thi~ case th6 lower iayer vetocit}T is -:5 ciO/s which
is irideed lower than the surface layer velocity and of opposite sign, demonstratirig tbät the .
cwrent is baroclinic. This simple analysis rnay also be appüed t6 the currentS offshore the Balticemerit, which hai a suifac~ velocitY of 50 errvs, a tilt ofO.1 10-3 and a rectuc'ea gdvitY of .5.3

..
i0·3 rn/S2. Hence, the lower layer velocity is 45 crn/s, indicating that the ciurent is aJrilost
barotropic.
4. ConclusionsThis investigation covers a near synoptic situation of the Skagerrak surface water mainly driven
by winds from SW. This is a typical wind direction occuring in the area and, hence, the given
synoptic case may be of some importance for the understanding of the general surface water
circulation. It is believed that the following scenario conc1udes the results. The southwesterly
wind is driving the upwelled water along the the Norwegian coast by the Ekman transport
offshore, blocking the surface water in the inner part of Skagerrak. The Jutland and the Baltic
current add surface water to the inner Skagerrak. A complex convergens of these currents and
. the cold surface water from the uppwelling area is taking place in the southeastern part of
Skagerrak. Strong northward currents are found offshore the Swedish coast, which splits in
two parts when reaching the Norwegian coast. One part turns east, supponing the anticyc10nic
gyre in the NE Skagerrak which is forcing the river Glomma plym to move southeastward and
the Baltic current to move nonhwestward and thereby separating from the coast. The second
part presumably turns southwest and thereby circUriuerences the warm and slightly more saline
inner Skagerrak surface water.
The blocking of surface water in the Skagerrak during westerly winds has been noted earlier,
but the antieyclonie gyre in the NE corner and the separation of the Baltic current are features
not previously investigated in detail. For example it is not known under what meteorological
and oceanographic conditions the gyre takes place. Hence, further studies are needed to
investigate the frequency of these features.
Acknowledgements
In this investigation the remote sensing data was obtained by the Swedish Meteorologieal and
Hydrological Institute during a monitoring program of the Skagerrak area dunng 1989 and
1990, initiated by the Swedish Enviromental Board. The hydrographie survey data were nicely
delivered by the Institute of Marine Research at Flödevigen Biological Station.
7

•
..4. References
Aarup, T., GrooIn, S.and Holligan, P. (1987): CZCS Scenes from the North Sea. ICES,CM.19871C;31
Barton, I. (i989): Digitization effects in AVHRR and MCSST data. RemOte Sens. Environ., 29, 8789.
. .
Holligan, P, Aarup, T. and S. Groom (1987): The North Sea satellite colour atlas. Cont. SheljRes.,vol 9, No. 8, 667-765.
Häkansson, B. (1989):Remote sensing oftotal suspended matter from the Glomma river in the.• Skagemik. Vatten, 45, Nr. 4, 271-277.
Johannesseen, J., Johannessen, 0., arid P. Haugan (1989): Remote sensing and model simulationstudies of the Norrwegian coastal current during the algal bloom in May 1988. Int. J. RemoteSensing, 1989, vol. 10, no. 12.
Merk, M., and R., Saetre (1980): The Norwegian coastal current. Proceedingsjrom the Non't'egiancoastal current symposium, Geilo, vol1+2.
Mork, M. (1981): Circulation phenomena and frontal dynamics of the Norwegian coastal cirrrent .Royal Soc. London, Philosophical transactions, ServA, mathematical and physical sciences,302(1472): 635-647.
Pettersson, H. (1989): Norwegian rerriote sensing spectrometry for mapping and rnonitoring of algalblooms and polurion - NORSMAP'89. Summary of field campaign. NRSC, Techizical report No.22.
Pettersson, H: (1990): NORSMAP'89 Project report & recominendaiions. NRSC, Technical reportNo. 28. '.
Pingree, R., Holligan, P., Mardell, G. and R. Harns (1982): Vertical distributiOll ofplankton in theSkagerrak in relation to doming of the seasonal thennocline. Cont.SheljRes., vol. 1, no. 2.
Richardson,K (1989): Phytoplankton distribution and activity in the Skagerrak: a reView. ICESpaper CM19891L:24 Sess Q.
RObinson,I. och N. Ward (1989): Co~parison between satellite and ship measurements of seasurface temperature in the north-east Atlantic Ocean. IntJRemote Sensing,Vol.10,NoA and 5,787-799.' .
Rodhe. J. (1987): The large-scale circulation in the Skagerrak; interpretation of some observations.Tellus 39A, 245-253.
Svarisson, A. (1975): Physical anrl chemiCal oceanography of the Skagerrak and the Kattegatt Inst.Marine Res., Report No. 1.
Svejkovsky, J.,(1988): Sea sunace flowestimation from advanced very high resolution radiometerand coastal zone color scanner satellite imagery. J.GeophysRes.,Vol.93,No.C6,6735-6743.
Sörenseri,K., Lfnddl, T. and J. Nisell (1989): The informatiori content of AVimR, TM and SPOTdata in the Skagerrak sea. Proceedings ofthe IGARRS'89-12th Canadian SymposiUm on RemoteSensing. Vancouver, Canada, July 10-14,1989. .
.Tassan,S. (1987): Evahiation of th~ pOtential of the thematic mapper for manne applicarlon.Int.JRemote Sensing,Vol.8,No.lO,1455-1478.

..Figure captions
Figure 2.1: Topography, ship transects and some coastal meterological and
oceanographic stations along the Swedish coast.
I'I
•
Figure 2.2:
Figure 2.3:
Figure 3.1.1:
Figure 3.1.2:
Figure 3.2.1:
Figure 3.2.2:
Figure 3.2.3:
Figure 3.3.1:
Figure 3.3.2:
The satellite derived sea surface temperature shows good correlation with the
in situ measured temperature at 5 m depth' The correlation coefficient is 0.91
and data were obtained from May 17 and 18, 1989.
Air temperature from 10 m height and water temperature from 5 m depth
measured hourly at the coastal station Koster.
Wind speed and direction from the two coastal stations Koster and
Mäseskär. The presented observations are daily average values, beginning on
May 10, 1989 and ending on May 20, corresponding to the Julian days
130 and 140.
The upper figure shows the salinity distribution in the surface layer along the
transect between Norway Oeft) and Denmark (right). The bottom
configuration on the Danish side of the seetion is schematically drawn in
dark. The lower figure shows the salinity distribution of the surface layer in
the section from Sweden (left) and westward.
Schematically shown MeSST distribution in the Skagerrak.
Th6 horizontal salinity distribution at 5 m depth, obtained from the in situ
measurements.
Enhanced sea surface temperature schematically obtained from MCSST
covering the eastem part of Skagerrak. Notice the Baltic current separation
from the coast and the warm plym from the river Glomma tuming sharply to
southeast.
The surface velocity drift obtained from feature identification in the satellite
images from May 17,1989.
Vector diagram of the current offshore the Swedish west coast at N 58014' E
11003'. The current meter was placed at a depth of 15 m.

9E llE 13 E
S9N
S8N
S7N

11
10.5
10-u0
9.5-E-VJ• rI'.lU
9~
8.5
8.5 9 9.5 10In situ (OC)
10.5
---------------1
11

•12.5..----"---....&...- -.....1...-.............-..............- ...........---'--""'---'--+
(lC) 12 • VII., I.nI..• AirttaJe ..
11oS
11
10.5
10
9.5
9
80S
8~--r-..,....- .........----.--........-..---""""T""-~---r-~~ .........o 25 SO 7S 100 125 lSO 17S 200 225 ~
15i' 111' 1715 . 1115 1115

•
•
•
14
12
10
8
6
4
2 • Wind Speed m/s (MAseskär)o Wind Speed m/s (Koster)
142140138136134132130O+------.,...---.----r-----...----.----.----+128
JulianDays
350• Wind Direction (Mäseskär)
300 0 Wind Direction (Koster)
250
== 200.gj~ 150o"0.5 100~
50
142140138134 136JulianDays
132130O.J----.---..---__--.---r-----.----Io128

•
•
0
·10
·20
[;] ·30
·40
·50
·60
o 10 20 30 40 50 60 70 80
, 36,35
:..:
'. 34
t33
~{32
{31
,.:.,30
29
90 100 110 28
27
o 10 20 30 40 50 60 70 80 eo 100 110 120 130 140 150
36
35..34
;?33
..32
~31
~ 30-:~.
::29
28
27
26
25
24

•
•
•
59N
saN
57N
- ---- ------ ------1
~11.0°C
10.510.0
9.59.08.58.07.5
FI'S .3. J.. 1.
•
---------------------------------
•
9E UE 13 E
59N
S8N
57N

•
""""""""'"""""""""'"""""""""'"""""""""'"""""""""'"""""""""'"""""""""""""""""'"
" """""'"""""""""""""""""""""'""""'"'" """'""""""'""""""'""""""'":--..""""""""""""""""""""""""""""""""""'"""""'"""""'"""""'"""""'"""""'""""""", "'", "'"
"""""'""""""""'""""'"" ", '"" '":-... '"
"""'""'""'""""""'"'"" ,
10.8 oe10.410.0
9.69.2
•
17 maj 1989
1m/s

•
N
Velocity scale
O.5m/s
lat: 58-14'long:1r 03'depth:15 m