paper-based gis - university of canterbury
TRANSCRIPT

Paper-Based GIS: A Practical Answer to the Implementation of GISEducation into Resource-Poor Schools in South Africa
Gregory Breetzke, Sanet Eksteen, and Erika Pretorius
ABSTRACTGeographical information systems (GIS)was phased into the geography curriculumof South African schools from 2006–2008as part of the National CurriculumStatement (NCS) for grades 10–12.Since its introduction, GIS education inschools across the country has been metwith a number of challenges includingthe cost of purchasing the hardwareand software required to elucidate thebasic concepts of GIS to learners. Thisarticle examines the introduction of GISeducation in schools in South Africa.The development and distribution of apaper-based GIS educational package forresource-poor schools in the country isalso highlighted. Preliminary educatorand learner evaluations of the paper-based GIS package are discussed andthe broader learning opportunities andbenefits associated with flexible teachingmechanisms are examined.
Key Words: South Africa, geographicalinformation systems (GIS), schools, paperGIS, education
Gregory Breetzke is a lecturer of geographicalinformation systems (GIS) at the Universityof Canterbury, Christchurch, New Zealand.His research focuses on different pedagogicalapproaches to GIS education, particularly inAfrica.
Sanet Eksteen is a GIS lecturer at the Universityof Pretoria, Pretoria, South Africa. She hasinterests in GIS education in schools and spatialmodeling.
Erika Pretorius is a geographer at the Universityof Pretoria, Pretoria, South Africa. Her researchinterests include cartography, geovisualization,and the incorporation of different learningtechniques in geography classrooms.
INTRODUCTIONGeographical information systems (GIS) is an exciting and fast-growing tool
that holds a lot of potential for South Africa. GIS can be defined as a system forcapturing, storing, analyzing, and managing data and associated attributes that5are spatially referenced to the Earth (Longley et al. 2005). A system typicallycomprises hardware, software, geographic data, and personnel designed tomanipulate geographically referenced information in order to achieve a statedobjective. Through GIS analysis researchers in a variety of disciplines are ableto better examine geographic patterns in their data and investigate possible10spatial relationships between features of interest. Internationally GIS is one ofthe fastest growing industries with more than 170,000 people in the UnitedStates currently employed in the geospatial information industry in government,academic, and commercial sectors (Fazekas 2005). Worldwide GIS revenue fromsoftware, hardware, services, and data products exceeded $3.6 billion in 200615(Daratech Inc. 2006), with revenues from GIS software vendors comprising morethan half of the total. From an education perspective, GIS and its related techniquesand methods has “helped open [sic] Geography’s door” (Getis 2008, 4) witheducators noting the ability of the tool to progress beyond traditional school-basedgeography and spatial problem solving (Bednarz and van der Schee 2006). GIS is20envisaged as an invaluable resource for use in extending a learner’s understandingof geography as it allows for the visual illustration, and manipulation of centralconcepts of the discipline.
The South African Department of Education (DoE) has not been oblivious tothe rapid growth of GIS both locally and abroad. Indeed, GIS was listed as a25“skill to be acquired” in the National Curriculum Statement (NCS) for geographyin 2003 (South African Department of Education 2003, 10) although its actualinclusion in the curriculum was only phased in from 2006–2008. Anecdotalevidence suggests that the recent introduction of GIS in schools in South Africahas been problematic. Among concerns researchers note a lack of funding, and30infrastructure in schools (Nxele 2007) as well as a lack of any theoretical groundingand practical experience in using GIS by educators (Zietsman 2002). This articleinvestigates the introduction of GIS education in schools in South Africa, andidentifies a number of challenges when attempting to implement computerizedGIS teaching methods in technologically disadvantaged countries. In doing so35the article highlights the development and distribution of a manual paper-basedGIS system for use in teaching GIS in resource-poor schools in South Africa. Thequestion posed is: can GIS be successfully taught in developing countries such asSouth Africa where technological and bureaucratic barriers so frequently impedethe learning process?40
GIS IN SOUTH AFRICADespite lagging several years behind more-developed countries, GIS has
developed along similar lines in South Africa (Schwabe 2001). The initial useof the technology lay in the environmental field before being discovered in the1990s by larger metropolitan areas and municipalities that saw the value of GIS45for managing their information and infrastructure. The availability of large-scalepopulation and environmental datasets coupled with the proliferation of opensource desktop mapping systems has resulted in GIS becoming a fast-growingindustry in the country. The technology is currently being utilized by a number
Journal of Geography 110: 1–10C©2011 National Council for Geographic Education 1

Gregory Breetzke, Sanet Eksteen, and Erika Pretorius
of key role players in South Africa including specific50central, provincial, and local government departments,semiprivatized government institutions, as well as by agrowing number of consulting firms and universities. Froma governmental perspective, the key role players in the GISindustry are the Chief Directorate: Surveys and Mapping55and the Chief Surveyor-General of South Africa. These stateinstitutions are tasked with driving the overall growth anddevelopment of GIS in South Africa and currently play avital role in providing a basic geospatial framework fordata (Zietsman 2002). Other government departments pro-60vide ancillary data as part of their line functions, includingthe Department of Water Affairs and Forestry (DWAF),the Department of Agriculture (DA), and the Departmentof Environmental Affairs and Tourism (DEAT). Otherkey role-players include semiprivatized institutions such65as the Council for Scientific and Industrial Research (CSIR),the Human Sciences Research Council’s (HSRC) GIS Unit,the Institute for Soil, Water and Climate (ISWC), the Councilfor Geosciences, and the Satellite Application Centre (SAC).These institutions are all directly involved in the provision70of GIS data or products based on their relative expertise ina variety of disciplines. In the private sector a plethora ofGIS consultancies and suppliers have emerged to provide arange of GIS products and services to public and privatesector clients. Specializations abound in various sectors75including mining, industry, transport, tourism, agriculture,conservation, commerce, and water. The added popularityof mobile phone networks has also allowed consultancies tomake their GIS solutions available from mobile phones aswell as to develop specific mobile applications that utilize80their geographical information. From an educational stand-point most universities in South Africa offer a GIS degreeor include substantial GIS components within a relateddegree or diploma. South African tertiary institutions havehistorically adopted curricula based on the adaptations of85those developed in North America and Europe (Zietsman2002), although most institutions are currently developingtheir own GIS curricula to suit their particular studyprogram. Final key role players in the GIS industry inSouth Africa are nonprofit organizations (NPOs) such as the90Geographical Information Society of South Africa (GISSA).GISSA was formed in 2000 and aims to create a nationalidentity for GIS in South Africa, as well as to protect andpromote the interests of the geographic information (GI)community. Among its more recent accomplishments are95the creation of a standards generating body (SGB), which iscurrently tasked with the establishment of GI unit standardsfor the country, and the standardization of geographicinformation science (GISc) qualifications across the countryto allow for a GIS graduate to be professionally registered100at the South African Qualification Authority (SAQA).
Despite the rapid growth of GIS across South Africa, itsintroduction in the South African school syllabus has notbeen as forthcoming. The curriculum for GIS was phasedin incrementally and systematically over three years: into105grade 10 in 2006, grade 11 in 2007, and grade 12 in 2008
as part of the geography curriculum. At the grade 10level, the learner is taught the general concepts of GISas well as the geographical concepts that form part ofthe technology such as entity types, scale (large versus 110small), and resolution (spectral and spatial). At the grade11 level, the learner is taught the functional elements ofGIS including data acquisition, satellite remote sensing as adigital data source, preprocessing and data processing. Atthe grade 12 level, which is the final level of schooling, 115the learner is taught additional functional elements ofGIS including data management, data manipulation andanalysis, and spatial analysis, product generation, andapplication. At the completion of schooling, the learneris expected to be competent in geographical numeracy 120through “applying GIS procedures and spatial statistics”(South African Department of Education 2003, 13). Whileit may be too early to thoroughly evaluate the introductionof GIS into schools in South Africa, anecdotal evidencesuggests that a number of technological and bureaucratic 125challenges need to be overcome before widespread GISeducation can be achieved in the country.
CHALLENGES TO THE SUCCESSFUL IMPLEMENTATIONOF GIS IN SCHOOLS IN SOUTH AFRICA
The educational challenge for GIS in South Africa 130lies in trying to establish an environment in which thetechnology can be adequately taught. Kidman and Palmer(2006) identify three main impediments to the successfulintegration of GIS within schools that can be considered forGIS education in South Africa. 135
MoneyPerhaps the biggest impediment to the successful im-
plementation of GIS in schools in South Africa is thelack of funding and financial resources. The introductionof computerized GIS in any schooling system requires 140considerable financial input in terms of purchasing thenecessary software, hardware, and educational materialsas well as money for the training of educators. Whilethe problems of funding GIS education in schools isrelatively widespread (see Britton 2000; Bednarz and van 145der Schee 2006; Kidman and Palmer 2006), the situationis exacerbated in South Africa when one considers thecountry’s recent political history. Segregationist educationpolicies introduced by the Nationalist government duringapartheid—notably the Bantu Education Act of 1953— 150resulted in the skewed distribution of financial resourcesin favor of former whites-only schools and to the detrimentof black1 schools. At the peak of apartheid, schools servingwhite learners had more than ten times the funding perlearner than schools serving black learners (Fiske and Ladd 1552005). As late as 1994, the amount spent per learner in whiteschools was more than two and a half times that spenton behalf of black learners. The result at the beginning ofdemocracy was a shortfall of 29,000 classrooms in blackprimary schools and a shortfall of 14,000 classrooms in black 160
2

Paper-Based GIS: A Practical Answer to the Implementation of GIS Education into Resource-Poor Schools in South Africa
secondary schools throughout the country (Nicolaou 2001).The shortage of classrooms was only part of the facilitiesproblem as the majority of black primary schools had noelectricity, 25 percent had no access to water within walkingdistance, and 15 percent had no sanitation facilities (Fiske165and Ladd 2005).
The dawn of democracy initiated a pursuit of race-blind policies in both the funding and structure of publiceducation by the newly elected African National Congress(ANC). The ANC sought to redress the policies of racial170inequity in education through the introduction of a batteryof laws including the 1995 White Paper on Education andTraining, and the South African Schools Act (SASA) of 1996.The initial achievements made by the ANC government tofashion a racially equitable state education system were175substantial and a number of their accomplishments areoutlined in the School Register of Needs Survey conducted bythe DoE in 2000. The results of the survey indicated signifi-cant advances in the provision of electricity, computers, andtelephones in schools throughout the country from 1996 to1802000. It is discouraging to note, however, that despite theseadvances almost 90 percent of schools in the country stilldid not have computers in 2000. In addition, 80 percentof schools had no functioning libraries. More recently astudy in the Eastern Cape Province of South Africa by Nxele185(2007) highlighted the fact that 41 percent of schools in theprovince still do not have electricity and only 48 percent ofsecondary schools have computers. Contrast this with theover 1,900 U.S. high school classrooms that have a desktopGIS (Baker 2005), and it becomes increasingly evident190that South Africa is still some way off technologically toestablish a suitable environment for GIS education.
SupportMuch prior research (see Bednarz and Ludwig 1997;
Alibrandi 2001; Baker 2005) has shown that a lack of support195is an additional factor impeding the widespread adoptionof GIS in schools. Kidman and Palmer (2006) outline threelevels of support required: first, support from school leader-ship and the school community; second, support from localtertiary institutions offering educator education programs;200and third, support from government and industry. Supportfrom the school leadership is important to ensure thatfunds and facilities are available for the development andsustainability of the GIS program in the school. Additionalsupport from those members of the school community not205directly involved in teaching GIS is also vital and verymuch dependent on the benefits they perceive GIS canoffer the school as a whole. Support from local tertiaryinstitutions offering educator-training programs is alsoof paramount importance. This support should involve210not only the training of educators in the basic hardwareand software identified for use in the classroom but alsothe development of GIS curriculum support materials.Structured support from government and industry in SouthAfrica for GIS education in schools has been forthcom-215ing but has been largely restricted to the provision of
a limited amount of educator-training or “professionaldevelopment” programs. In South Africa, the training ofeducators or educator “professional development” (PD)forms part of the Continuing Professional Development 220for Teachers (CPDT) component of the National PolicyFramework for Teacher Education and Development (2006).Under this policy all educators registered with the SouthAfrican Council for Educators (SACE) must earn a certainnumber of PD points over a three-year cycle dependent 225on their developmental needs (South Africa 2007; Steyn2009). Unfortunately, educators who wish to developprofessionally by taking a program aimed at training themin GIS face a number of challenges. The first—and mostpoignant—is that no formal or regulated educator-training 230GIS programs exist publicly. This mandate has fallen largelyon the GIS industry in South Africa with a number of privatecompanies currently training educators and guiding thedevelopment of GIS educational material. Companies suchas ESRI South Africa (Pty) Ltd2 and Geomatica (Pty) Ltd 235have taken the lead in this regard and conducted a numberof training courses aimed at teaching curriculum advisorsand educators about GIS. Only a limited number of theseworkshops have, however, taken place and they have beenrestricted to the training of a handful of curriculum advisors 240and educators.
The reasons why the training of GIS educators in SouthAfrica has shifted away from educational authorities andtowards private companies are difficult to fathom. Apossible reason could be the lack of individuals in public 245educational institutions in South Africa with specialistknowledge in GIS. A study by Steyn (2009) found that PDpresenters in South Africa often lacked practical experiencein the topics that they were presenting. Tardiness and a lackof fluency in English were other criticisms leveled at a large 250number of PD presenters. Moreover, Rust (2008) notes thatthose individuals that are attending GIS educator-trainingprograms often lack the skills for imparting the knowledgethey acquire to learners. Under such a malaise it is easyto envisage how commercial companies could sense an 255opportunity in the market. A second factor limiting theparticipation in GIS-related PD is that those programs thatare offered to “teach the teachers GIS” are not compulsorybut are classified as self-selected PD programs by the DoE.Self-selected PD programs are not funded (as opposed 260to compulsory programs, which are) and educators arerequired to pay for these programs themselves or applyfor a limited number of provincial bursaries in order to Q1
take them. Moreover, these GIS educator-training programsare often located in major cities, which adds to the cost 265of educators attending them, particularly those educatorscoming from rural areas. So while the DoE had the foresightto include GIS in the National Schools curriculum, it hasyet to institute sufficient measures to facilitate instructionaland technical support. The support measures provided by 270government thus far have tended to focus on issues such asinstitutional vision and strategy and have not been linked todefined targets of improved learner performance (Fiske and
3

Gregory Breetzke, Sanet Eksteen, and Erika Pretorius
Ladd 2005). The establishment of an overarching supportframework or curriculum plan embedded with the existing275school structures would ideally improve the delivery of thenew GIS component in schools.
TimeOther researchers (see Kerski 2003; Baker 2005; Chalmers
2006) regard a lack of time as the single biggest impediment280to getting GIS into classrooms. This refers to the timerequired for educators to attend PD workshops to learnthe necessary GIS software; the time required to developor modify instructional materials supported by GIS; aswell as the time required in the curriculum of various285subject disciplines to effectively educate learners about thetechnology. Scrimshaw (2004) identifies the allocation ofsufficient time for PD as the key element for educatorsto successfully integrate information technologies like GISinto their daily teaching and learning practices. In South290Africa, the appropriate timing for the PD training ofeducators “is a big bone of contention” (Steyn 2009, 131).Typically, educators attending PD programs in South Africado so on school holidays or in the afternoon followingthe conclusion of the school day. These times are however295often considered unfeasible or unsuitable by educators asmany are tired or involved in extracurricular activities.Paradoxically, these two options are preferred by schooladministrators since schools cannot afford relief staff ifeducators attend such programs during school hours (Steyn3002009). Related to the issue of time is the incentive foreducators to take the time to attend PD programs. Whilethere are a minimum number of PD points that an educatoris required to obtain over a cycle of three years, the measuresprescribed for failing to obtain these points is ambiguous,305often resulting in a lack of desire and will on the part ofeducators to enroll in these programs. Indeed, the punitivemeasure that “teachers who do not achieve a minimumnumber of PD points over two successive cycles of threeyears will be accountable to SACE for such failure” (South310Africa 2007, 20) is not only inadequate but encouragesmediocrity.
The time constraints placed on educators in SouthAfrica is further exacerbated by an ever-changing nationalcurriculum framework. Educational transformation in the315country has seen the adoption of a number of national cur-riculum frameworks including Curriculum 2005 (C2005),the National Curriculum Statement (NCS), and the RevisedNational Curriculum Statement (RNCS). These changeswere necessitated partly by the need to take into account the320knowledge and skills required to participate in a globalizedsociety, and partly by the need to transform educationand training to realize the aims of South Africa’s evolvingdemocracy. According to Jansen (1999), the revision in thegeography curriculum postapartheid was indicative of a325state seeking legitimacy following the national electionsand had more symbolic than actual significance. Essential asthese changes may appear in theory, their implementationin classrooms throughout the country has proven difficult in
resource-poor contexts like South Africa and has resulted in 330a general lack of understanding by educators regarding theinterrelationship between, and the “transcendence” fromCurriculum 2005 to the NCS to the RNCS (Pudi 2006). Thecontinuously changing curriculum in geography has alsoplaced greater pressure on educators in South Africa to 335improve existing content, introduce new content (such asGIS), and strengthen continuity and progression in theirprograms under often time-strained circumstances.
Confronting the ChallengesOne possible solution to the mounting challenges of 340
implementing GIS education in technologically restrictivecontexts such as South Africa is provided in the form ofpaper-based GIS education. The use of manual techniquesto teach the basic concepts of GIS to learners is certainlynot new. As early as the 1980s, a Manual GIS Approach 345to GIS education was proposed by Walsh (1988). Inhis research paper Walsh (1988, 17) familiarizes teacherswith the “. . . relative simplicity of GIS implementationfor investigations using both the manual analog and theautomated digital GIS approach.” Walsh outlines in detail 350the manual framework for GIS education with the aid ofa case study. More recently Green (2001, 37) examinedsome of the ways in which GIS can be taught both withand without information technology, and highlighted thefact that “. . . some of the limitations of manual techniques 355makes them ideally suited to school-level education.” In2003 a special issue of the Journal of Geography investigatedthe various ways of implementing GIS in school classrooms.In that edition Baker and Bednarz (2003) bemoaned thelack of research in the domain of geographic information 360technology implementation in schools, particularly in theUnited States. Since then a number of studies have doc-umented the implementation of digital GIS education inschools across the world (see Chalmers 2006; Kidman andPalmer 2006; Lam, Lai, and Wong 2009), but few studies 365have documented the implementation of analogue GISeducation in schools, particularly in a developing worldcontext. As outlined previously, while developing countriesmay face similar challenges as more developed countriesin trying to implement and maintain GIS education in 370schools, their ability to confront these challenges does differconsiderably.
PAPER-BASED GIS IN SOUTH AFRICAThe paper-based GIS initiative is the output of a project
managed by ESRI South Africa (Pty) Ltd and supported by 375the Department of Geography, Geoinformatics and Mete-orology at the University of Pretoria (UP) in South Africa.The members of the project team facilitated the introductionof GIS in resource-poor schools in South Africa throughthe development and distribution of a paper-based GIS 380educational package. The educational material containedwithin the package includes a 1:50,000 topographic map, a1:10,000 orthophotograph, tracing paper, a ruler, coloredcrayons, adhesive, an exercise book for learners, and a
4

Paper-Based GIS: A Practical Answer to the Implementation of GIS Education into Resource-Poor Schools in South Africa
handbook for educators. The paper-based GIS is packaged385in a sealed A3 cardboard box and is currently being sold toQ2
schools at a price of R150 ($15) each. In terms of content,the handbook consists of seven practical lessons as well asan additional lesson on the GIS process developed by UPresearchers. The lesson content includes the following:390
� Lesson plan 1: Introduction to GIS� Lesson plan 2: Definition of GIS, Components of GIS,
and Uses of GIS� Lesson plan 3: How GIS Is Represented Using Raster
and Vector Data395� Lesson plan 4: Introducing the Concept of Data
Acquisition� Lesson plan 5: Digitizing Points, Attributes, Symbol-
izing, Labeling� Lesson plan 6: Digitizing and Buffering400� Lesson plan 7: Answering a Ggeographic Question
The first four lesson plans in the paper-based packageare aimed at teaching the basic principles and componentsof GIS to learners. The exercise book (for learners) andthe handbook (for educators) are the two main tools of405the paper-based GIS educational package that are utilizedin these lesson plans. Two key questions are coveredin lesson plan one. First, what are the key features ofGIS? And second, what is the information age? In thelesson, the educator introduces the concepts of GIS and410the information age, and generates discussion. Learners arerequired to write down the concepts that they are taughtduring the course of the discussion in their exercise books.Learners are then required to write a letter in their exercisebooks in which they discuss the impact that they think the415information age is having on society and on themselvesin general. In lesson plan two entitled “Definition ofGIS, Components of GIS, and Uses of GIS,” the educatorintroduces the concept of GIS as a link to map interpretationand as a skill for teaching geography. The main components420that make up GIS are introduced and the many uses ofGIS are identified. The purpose of the lesson is to generatediscussion among the learners about this relatively newtechnology that they are being exposed to and to postulateon a definition of GIS. Learners are required to explain what425GIS is and the different definitions that emerge from thelearners are discussed. Using the 1:50,000 topographic mapprovided in the paper-based educational package, learnersare then asked to identify the three basic entity types inGIS: points, lines, and polygons. If the topographical map430provided covers an area that is known to the learnersthen they are asked to identify a series of features andlandmarks. According to Liben and Downs (2003) spatialthinking begins with distinguishing and identifying spatialfeatures of the real world on a map. By getting learners435to identify points, lines, and polygons as well as knownfeatures on the analogue maps provided to them enablesthem to not only increase their map literacy but to generatemental representations of space.
The key question covered in lesson plan three is: How 440is GIS represented on a map? In the lesson the educatorintroduces the concept of map overlay using a hamburgeranalogy. Accordingly, each layer of the hamburger isemphasized as being important and plays a vital role informing a complementary and complete hamburger. The 445educator then demonstrates the map overlay operation us-ing the tracing paper provided in the educational package.There are two key activities for the learner in this lesson.First, learners are again asked to identify points, lines, andpolygon features on the 1:50,000 topographic maps. Second, 450the learners are asked to draw a map of where they liveusing points, lines, and polygons and employing both rasterand vector data structures. In this way learners engender aspatial understanding of their place in the world, as well asrecognize how the real world can be envisaged as a model 455(a key concept in GIS). In lesson plan four entitled “DataAcquisition” the educator explains how GIS obtains its dataand emphasizes the importance of scale, coordinates, andmap projections in GIS. In the lesson each learner is givenan orange and is asked to draw a map of the world on it. The 460concepts of scale, coordinates, and map projections are thentaught to the learners using the orange as a teaching aid.For example, the difficulty in representing the real worldin two dimensions is illustrated by attempting to squashthe orange on a flat surface. The distortions in scale that 465occur during this process are identified and explained tothe learners. Similarly, learners spatialize the world that istranscribed onto the orange as well as attempt to createdifferent projections.
Lesson plan five involves getting the learners to under- 470stand how to approach a computerized GIS and how GIScan be used as a tool in geography. The educator intro-duces the concepts of digitizing, and discusses importantcartographic principles such as symbolization and mapannotation. It is at this juncture that the full contents of the 475paper-based resource are introduced and described to thelearners. The key questions covered in lesson plan six are:How do we digitize? How do we construct layers? How andwhy do we buffer features? In the lesson plan the educatorexplains the concepts of digitizing, buffering, and map 480overlay to the learners and demonstrates these conceptsusing either a chalkboard or the tracing paper and crayonsprovided. In lesson plan seven, the learners have the chanceto utilize and apply the knowledge they have acquiredin the previous lessons to answer a geographical question 485using manual techniques. An example of such a lesson planwas developed at the University of Pretoria. Lambert andBalderstone (2000) see a lesson plan as being analogous toa play with a number of scenes that follow a clear structureand develop a plot (relating to the objectives). Similarly, the 490lesson plan developed by UP employs a narrative pedagog-ical strategy and uses multiple criteria analysis to assessthe expansion possibilities of a small-scale South Africanbusiness. In the lesson a hypothetical young man namedOliver is introduced as an entrepreneur in South Africa who 495sells comic books and wishes to expand his business into
5

Gregory Breetzke, Sanet Eksteen, and Erika Pretorius
Figure 1. The South African Development Community (SADC).
the Southern African Development Community (SADC)(Fig. 1). Oliver wishes to identify which SADC countriesare most suitable for him to expand into, and locate themon a map. Five fundamental GIS steps are followed by the500learner— through the learning activities—in order to finda solution to Oliver’s problem. First is the definition ofthe information product. In this step the learner is askedto formulate a research question as well as identify threecriteria that he or she would like to satisfy when identifying505suitable countries.3 For example, one criterion could bethat Oliver wishes to expand into countries that have apopulation density greater than twenty people per squarekilometer. The rationale behind this step is to encourage thelearner to conceptualize the broader problem that Oliver510faces as well as to break down the problem into smallermanageable parts. In doing so, the learner also illustrateshis or her ability to identify a methodological point ofdeparture in the steps that follow. The second step involvesdesigning the GIS model of reality. In this step the learner515is required to identify what GIS data Oliver requires inorder for him to satisfy the before-mentioned criteria. Thisprocess allows the learner to firstly seek out relevant dataand secondly organize and display the data in a way thataids subsequent analysis and interpretation. Creating a520representation of the real world based on user requirementsis one of the fundamental planning operations in GIS(Longley et al. 2005). By encouraging learners to identifydata relevant to their stated criteria not only challengesthem to search and reject information but is also a useful525way for learners to confront the often quoted computer sci-ence teaching mantra of “garbage in, garbage out (GIBO).”
The third step involves data ac-quisition and quality assurance. Inthis step the learner is provided 530with an incomplete attribute tablecontaining financial and social in-formation about SADC countries.The learner is required to identifymissing data in the attribute table 535and fill in the blanks by using datain existing fields (e.g., populationdensity (missing) = total popula-tion (provided) / area (provided)).After the completion of this task 540the learner is required to checkthe attribute table for completenessand correctness. The fourth step—data analysis—forms the analyt-ical backbone of the lesson and 545involves the use of a number ofcore GIS techniques in order forlearners to solve Oliver’s problem.The first technique used is classi-fication whereby the learner is re- 550quired to group the given attributedata into two classes: those that
satisfy a stated criterion (e.g., population densities greaterthan twenty people per square kilometer), and those thatdo not satisfy the criterion (e.g., population densities less 555than twenty people per square kilometer). On separatetracing paper and using different shading patterns, thelearner then creates a separate map sheet for each statedcriterion (Fig. 2). The second GIS technique—overlay—isthen used to overlay the map layers on top of each other 560in order to identify those SADC countries in which allthe stated criteria are satisfied (Fig. 3). This penultimatestep in the lesson enables the learner to identify spatialpatterns, relationships, and connections between differentsets of geographic data. According to Aronoff (1989) the 565real power of GIS lies in its ability to integrate the analysisof spatial and attribute data. By using core GIS analyticaltools such as classify and overlay the learner is taught tosynthesize attribute and spatial data in a way that createsa meaningful observation. In the fifth and final step, the 570resultant map is created (Fig. 4). The rationale behind thisstep is to emphasize the importance of communicating theresults of data analysis efficiently and effectively. Despitethe growing popularity of GIS a limited amount of researchhas been done on the ability of the general public to read and 575make sense of geographic information (GI) being presentedto them, particularly GI displayed online (Bayram andIbrahim 2005). By introducing the basic principles ofcartography at an early stage in a learner’s developmentit is possible to develop a progression in learning that 580stresses the importance of map literacy all the way throughto higher education. Throughout the lesson plan the learneris encouraged to understand the difference that place makes,
6
Paper-Based GIS: A Practical Answer to the Implementation of GIS Education into Resource-Poor Schools in South Africa
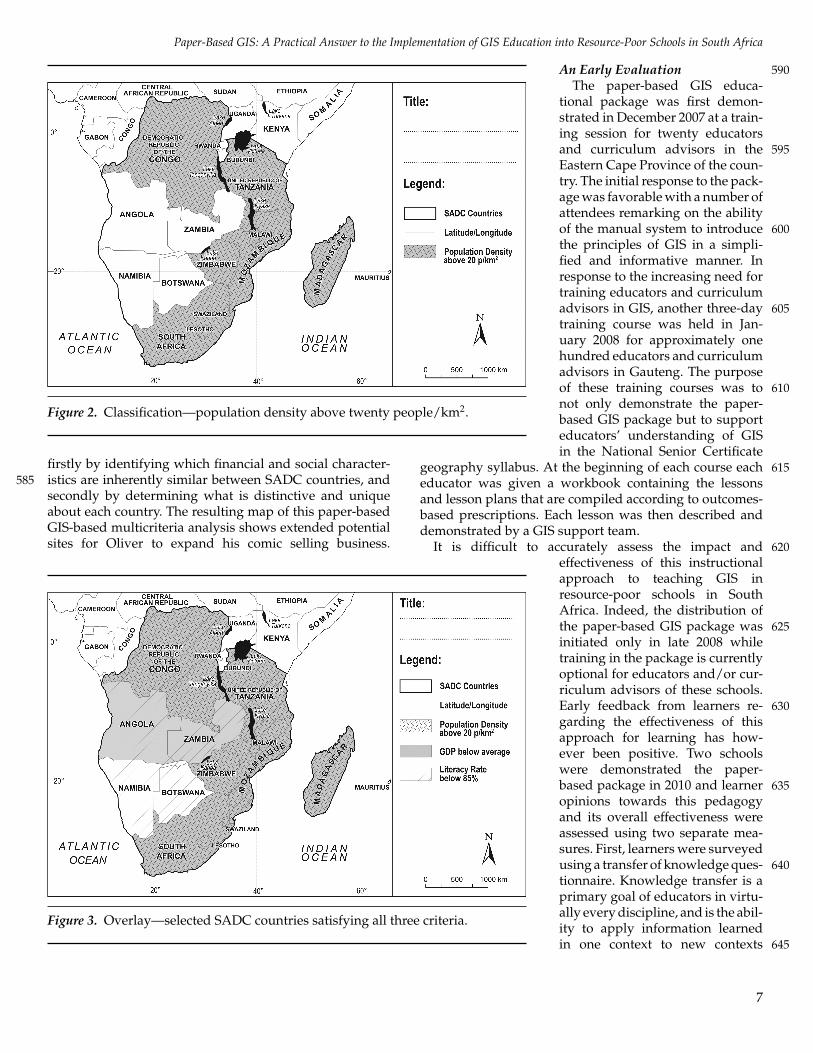
Figure 2. Classification—population density above twenty people/km2.
firstly by identifying which financial and social character-istics are inherently similar between SADC countries, and585secondly by determining what is distinctive and uniqueabout each country. The resulting map of this paper-basedGIS-based multicriteria analysis shows extended potentialsites for Oliver to expand his comic selling business.
Figure 3. Overlay—selected SADC countries satisfying all three criteria.
An Early Evaluation 590The paper-based GIS educa-
tional package was first demon-strated in December 2007 at a train-ing session for twenty educatorsand curriculum advisors in the 595Eastern Cape Province of the coun-try. The initial response to the pack-age was favorable with a number ofattendees remarking on the abilityof the manual system to introduce 600the principles of GIS in a simpli-fied and informative manner. Inresponse to the increasing need fortraining educators and curriculumadvisors in GIS, another three-day 605training course was held in Jan-uary 2008 for approximately onehundred educators and curriculumadvisors in Gauteng. The purposeof these training courses was to 610not only demonstrate the paper-based GIS package but to supporteducators’ understanding of GISin the National Senior Certificate
geography syllabus. At the beginning of each course each 615educator was given a workbook containing the lessonsand lesson plans that are compiled according to outcomes-based prescriptions. Each lesson was then described anddemonstrated by a GIS support team.
It is difficult to accurately assess the impact and 620effectiveness of this instructionalapproach to teaching GIS inresource-poor schools in SouthAfrica. Indeed, the distribution ofthe paper-based GIS package was 625initiated only in late 2008 whiletraining in the package is currentlyoptional for educators and/or cur-riculum advisors of these schools.Early feedback from learners re- 630garding the effectiveness of thisapproach for learning has how-ever been positive. Two schoolswere demonstrated the paper-based package in 2010 and learner 635opinions towards this pedagogyand its overall effectiveness wereassessed using two separate mea-sures. First, learners were surveyedusing a transfer of knowledge ques- 640tionnaire. Knowledge transfer is aprimary goal of educators in virtu-ally every discipline, and is the abil-ity to apply information learnedin one context to new contexts 645
7

Gregory Breetzke, Sanet Eksteen, and Erika Pretorius
Figure 4. The final map indicating suitable countries.
(Devine 2006). The questionnaire itself consisted of twoparts, the first part contained a set of questions designedto assess learners’ spatial literacy and knowledge of GISbefore the paper-based exercises were completed. Uponthe completion of the exercises and after a considerable650period of time, the second part of the questionnaire wasgiven to the learners. It contained similar questions to thefirst part although a number of questions were added withthe purpose of evaluating the learners’ acquired knowledgeapplied to differing contexts. Second, learners were given655an open-ended questionnaire in which they were askedto express their opinions on the paper GIS exercises andtheir thoughts of GIS in general. These two measures wereinitially applied to a pilot group of twelve grade 10 learners(15–16 year olds) to determine if the questions being asked660obtained the desired information and if the questions wereconfusing to the learners. The results of the pilot studywere positive with learners indicating that they liked theapproach and found the lesson interesting. The group alsoclearly displayed an improved ability to transfer knowledge665of GIS across various subject areas of geography includingcartography. A number of challenges were experienced inthe pilot group that were later attributed to the effect oflanguage barriers as the group was very diverse with regardto their language and cultural background. A number of670questions were revised and modifications made after thepilot session.
A second cohort of forty learners from a separate schoolwas then surveyed using these two measures. The selectedlearners had some previous theoretical knowledge of GIS675but—as is the case in most South African schools—had noprevious access to computerized GIS. The results of the
questionnaire before and after thecompletion of the paper-basedexercise indicated that learners 680greatly improved their ability tothink spatially and apply GIS con-cepts and principles in contextsoutside the paper-based exercisesthey had previously completed. 685For example, in the first part of thequestionnaire learners were givena map without the required mapelements such as a north arrow,scale bar, and legend. The learners 690were then asked what essential in-formation should have been addedto the map in order to make itmore useful and understandable.This was also expanded upon in 695the paper-based exercises. Later,learners had to create a new andunrelated map. Their maps werethen evaluated by checking for allthe required map elements. Ac- 700cording to the National Academyof Science (2006), one characteristic
of a spatially literate learner is the ability to adopt acritical stance to spatial thinking. In doing do, a spatiallyliterate learner should be able to evaluate the quality 705of a spatial data product on the basis of its accuracy,reliability, and usability. Getting the learners to critique andsubsequently create a map enabled us to not only gain anunderstanding of their map literacy but also allowed usto gauge their level of spatial literacy too. Similarly, in the 710first part of the questionnaire learners were asked to usethematic mapping to indicate economic and social trendsamong a group of countries. Later, learners had to indicatethe location of various African global organizations on amap as well as trace member countries’ boundaries. By 715getting learners to firstly identify countries of a certainmembership and secondly group these countries on thebasis of social similarity and/or geographic proximity, wewere able to assess the second characteristic of a spatiallyliterate student, namely that learners have a broad and 720deep knowledge of what spatial entities represent (NationalAcademy of Science, 2006).
The results of the open-ended questionnaire assess-ing learners’ opinions of the paper-based GIS packagewere extremely favorable. Approximately 93 percent of 725learners gave positive feedback on the exercises with mostindicating that they found the exercises interesting andenjoyable. With the exception of one learner, all learnersindicated that they had learned something new duringthe course of the exercises. Almost all learners found GIS 730innovative and believed that the technology will enhancetheir understanding of, and interest in, geography. As acaveat to this discussion it must be emphasized that theassessment of this instructional approach to teaching GIS
8

Paper-Based GIS: A Practical Answer to the Implementation of GIS Education into Resource-Poor Schools in South Africa
in resource-poor schools in South Africa is ongoing. The735results presented here reflect the opinions of two schoolscurrently utilizing this approach and are therefore context-specific and preliminary. This fact notwithstanding, theseinitial results suggests that the paper-based GIS package ishaving a positive impact and does provide an adequate740alternative to contemporary computerized GIS teachingmethods.
CONCLUSIONInternationally GIS has long been regarded as an im-
portant part of geography education, both on its own745and in association with other subjects such as informationtechnology and environmental studies (Green 2001). Onlyrecently, however, has South Africa taken measures tointroduce the technology into its school syllabus withthe technology now part of the geography curriculum in750grades 10–12. GIS education in South Africa has provento be fraught with difficulties, however, arising from alack of money, time, and support from the broader schoolcommunity to facilitate the integration of GIS within class-rooms, particularly among the country’s poorer schools.755A solution to the challenges facing South African schoolsin implementing GIS education is provided in the formof a paper-based GIS educational package developed anddistributed by ESRI South Africa (Pty) Ltd in collaborationwith UP. The package is ideally suited to teaching GIS760in resource-poor schools as it is cheap (money), easy touse (time), obtainable (support), and provides a basicintroduction to GIS. While a computer is sine quo non forGIS education in much of the developed world, this studyhas highlighted the fact that in a developing world context,765the manual GIS approach to education still has an importantrole to play.
NOTES1. The South African population is still officially clas-
sified into racial groups. “Black Africans” representthe descendants of west and central African popula-770tions. The “Indian” population group represent thedescendents of south Asian populations. The “Col-ored” group comprise a mixed population includingthe descendents of the indigenous Khoisan popula-tion, imported Malay slaves, and people born out775of mixed-race relations. The collective term “blacks”from this point onwards refers to these groups whilethe “white” population includes the descendentsof European and other non-Indian Asians. Whileit might be expedient to employ the term “black”780here, the group designated by the term should notbe considered homogeneous.
2. ESRI South Africa is the sole distributor of ESRIsoftware in South Africa and acted as the privatesector partner in the introduction of this form of GIS785education to schools in South Africa.
3. The learners are limited in the criteria they can selectbased on the availability of relevant data.
REFERENCES 790Alibrandi, M. 2001. Making a place for technology in teacher
education with geographic information systems (GIS).Contemporary Issues in Technology & Teacher Education 1(4): 483–500.
Aronoff, S. 1989. Geographic Information Systems: A Manage- 795ment Perspective. Ottawa, Canada: WDL Publications.
Baker, T. R. 2005. Internet-based GIS mapping in supportof K–12 education. The Professional Geographer 57 (1):44–50.
Baker, T. R., and S. W. Bednarz. 2003. Lessons learnt 800from reviewing research in GIS education. Journal ofGeography 102 (6): 231–233.
Bayram, S., and R. Ibrahim. 2005. Digital map literacybounded with culture under geographical informationsystems perspective. Journal of Visual Literacy 25 (2): 805167–176.
Bednarz, S. W., and G. Ludwig. 1997. Ten things highereducation needs to know about GIS in primary andsecondary education. Transactions in GIS 2 (2): 123–133.
Bednarz, S. W., and J. van der Schee. 2006. Europe and 810the United States: The implementation of geographicinformation systems in secondary education in twocontexts. Technology, Pedagogy and Education 15 (2): 191–205.
Britton, J. M. R. 2000. GIS capacity building in the Pacific 815Island countries: Facing the realities of technology,resources, geography and cultural difference. Carto-graphica 37 (4): 7–18.
Chalmers, L. 2006. GIS in New Zealand schools. In-ternational Research in Geographical and Environmental 820Education 15 (3): 268–270.
Daratech Inc. 2006. Daratech report reveals geospatialmarket growth. http://www.daratech.com/login/login.html?loc=/research/gis/overview/print.html(accessed December 10, 2008).
Q3
825
Devine, K. L. 2006. Improving the knowledge transfer skillsof industrial technology students. Journal of IndustrialTechnology 22 (2): 2–10.
Fazekas, A. 2005. Careers in geoscience and remote sensing.Netwave-Science Magazine August 19: 1–5. 830
Fiske, E. B., and H. F. Ladd. 2005. Elusive Equity: EducationReform in Post-apartheid South Africa. Pretoria, SouthAfrica: HSRC Press.
Getis, A. 2008. What holds us together. ArcNews 29 (4): 1, 4.
9

Gregory Breetzke, Sanet Eksteen, and Erika Pretorius
Green, D. R. 2001. GIS in school education: You don’t835necessarily need a computer. In GIS: A Sourcebook forSchools, ed. D. R. Green, pp. 34–61. New York: Taylor &Francis.
Hochberg, J. 1978. Perception. Englewood Cliffs, New Jersey:Prentice-Hall.Q4 840
Kerski, J. J. 2003. The implementation and effectivenessof geographic information systems technology andmethods in secondary education. Journal of Geography102 (4): 128–137.
Kidman, G., and G. Palmer. 2006. GIS: The technology is845there but the teaching is yet to catch up. InternationalResearch in Geographical and Environmental Education 15(3): 289–296.
Lam, C., E. Lai, and J. Wong. 2009. Implementation ofgeographic information system (GIS) in secondary850geography curriculum in Hong Kong: Current situ-ations and future directions. International Research inGeographical and Environmental Education 18 (1): 57–74.
Lambert, D., and D. Balderstone. 2000. Learning to855Teach Geography in the Secondary School. New York:Routledge.
Liben, L. S., and R. M. Downs. 2003. Investigating andfacilitating children’s graphic, geographic and spatialdevelopment. Applied Developmental Psychology 24: 663–860679.
Longley, P. A., M. F. Goodchild, D. J. Maguire, and D. W.Rhind. 2005. Geographic Information Systems and Science,2nd ed. Chichester, UK: John Wiley & Sons.
National Academy of Science. 2006. Learning to Think865Spatially. Washington, D.C.: The National AcademiesPress.
National Policy Framework for Teacher Educationand Development. 2006. Pretoria: GovernmentPrinters.Q5
Nicolaou, K. 2001. The link between macroeconomic poli- 870cies, education policies and the education budget. InEducation and Equity: The Impact of State Policies onSouth African Education, eds. E. Motala and J. Pampallis.Sandown, South Africa: Heinemann. Q6
Nxele, A. 2007. The impact of the transition from Grade 7–9 875to FET (Grade 10–12) on the teaching and learning ofGeography in Eastern Cape schools. Paper presentedat the Society of South African Geographers, NelsonMandela Metropolitan University, Port Elizabeth.
Pudi, T. 2006. ‘From OBE to C2005 to RNCS’: Are we still 880on track? Africa Education Review 3 (3): 100–112.
Rust, L. 2008. South African educators teach GIS—Withor without computers. http://www.esri.com/news/arcnews/spring08articles/south-african-educators.html (accessed December 10, 2008).
Q7
885
Schwabe, C. A. 2001. African renaissance: Towards thedevelopment of a spatial information system for socio-economic development in Africa. Paper presented atthe 5th AfricaGIS Conference, Nairobi.
Scrimshaw, P. 2004. Enabling Teachers to Make Successful Use 890of ICT. Coventry, UK: Becta.
South Africa (RSA). 2007. National Education Policy Act,27 of 1996. Government Gazette 502 (29832) Q8
South African Department of Education (DoE). 2003.National Curriculum Statement Grades 10–12 (General) 895Geography. Pretoria, South Africa: Government Printer.
Steyn, T. 2009. Teachers’ perceptions of continuing profes-sional development programmes in South Africa: Aqualitative study. Acta Academica 41 (4): 113–137.
Walsh, S. J. 1988. Geographic information systems: An 900instructional tool for earth science educators. Journalof Geography: 17–25.
Q9
Zietsman, H. L. 2002. Geographic information science inSouth Africa. South African Geographical Journal 84 (1):30–37. 905
10