paper 2.4 - atc international
TRANSCRIPT

7/27/2019 Paper 2.4 - ATC International
http://slidepdf.com/reader/full/paper-24-atc-international 1/73

7/27/2019 Paper 2.4 - ATC International
http://slidepdf.com/reader/full/paper-24-atc-international 2/73
Accountancy Tuition Centre (Overseas Courses) Ltd 2001 (i)
ATC
ACCA
PAPER 2.4
FINANCIAL MANAGEMENT AND CONTROL
STUDY SYSTEM

7/27/2019 Paper 2.4 - ATC International
http://slidepdf.com/reader/full/paper-24-atc-international 3/73
Accountancy Tuition Centre (Overseas Courses) Ltd 2001 (ii)
No responsibility for loss occasioned to any person acting or refraining from action as aresult of any material in this publication can be accepted by the author, editor or
publisher.
This training material has been published and prepared by Accountancy Tuition Centre Limited
16 Elmtree RoadTeddington
TW11 8STUnited Kingdom.
Editorial material Copyright Accountancy Tuition Centre Limited, 2001.
All rights reserved. No part of this training material may be translated, reprinted or reproduced
or utilised in any form either in whole or in part or by any electronic, mechanical or other
means, now known or hereafter invented, including photocopying and recording, or in any
information storage and retrieval system, without permission in writing from the Accountancy
Tuition Centre Limited.

7/27/2019 Paper 2.4 - ATC International
http://slidepdf.com/reader/full/paper-24-atc-international 4/73
CONTENTS
Accountancy Tuition Centre (Overseas Courses) Ltd 2001 (iii)
Page
Introduction (v)
MANAGEMENT ACCOUNTING
1 Management accounting and costing 0101
2 Activity based costing 0201
3 Costs for decision making 0301
4 Budgetary control systems 0401
5 Preparation of budgets 0501
6 Quantitative techniques for budgeting 0601
7 Standard costing and variance analysis 0701
8 Advanced variance analysis 0801
9 Costing methods 0901
FINANCIAL MANAGEMENT
10 Organisational objectives 1001
11 Working capital management 1101
12 Cash management 1201
13 Management of debtors and creditors 1301
14 Inventory management 1401
15 The financial environment 1501
16 The economic environment 1601
17 Equity finance 1701
18 Debt finance 1801
19 The capital structure decision 1901
20 Investment decisions 2001
21 Net present value and internal rate of return 2101
22 Relevant cash flows for DCF 2201
23 Applications of DCF 2301
24 Project appraisal under risk 2401

7/27/2019 Paper 2.4 - ATC International
http://slidepdf.com/reader/full/paper-24-atc-international 5/73
CONTENTS
Accountancy Tuition Centre (Overseas Courses) Ltd 2001 (iv)

7/27/2019 Paper 2.4 - ATC International
http://slidepdf.com/reader/full/paper-24-atc-international 6/73
INTRODUCTION
Accountancy Tuition Centre (Overseas Courses) Ltd 2001 (v)
Introduction
This Study System has been specifically written for The Chartered Association of CertifiedAccountants Part 2 examination , Paper 2.4 Financial Management and Control .
It provides comprehensive coverage of the core syllabus areas and is designed to be used both as a reference text and interactively with the ATC Learning System to provide youwith the knowledge, skill and confidence to succeed in your ACCA studies.
SYLLABUS
Aim
To develop knowledge and understanding of financial management methods for analysing the benefits
of various sources of finance and capital investment opportunities and of the application of managementaccounting techniques for business planning and control.
Objectives
On completion of this paper students should be able to:
explain the role and purpose of financial management
evaluate the overall management of working capital
evaluate appropriate sources of finance for particular situations
appraise capital investment through the use of appropriate methods
identify and implement appropriate costing systems and techniques
prepare budgets and use them to control and evaluate organisational performance
critically assess the tools and techniques of financial management and control
demonstrate the skills expected in Part 2.
Position of the paper in the overall syllabus
Students must have a thorough knowledge of the material in Paper 1.2 Financial Information for Management and a good knowledge of other Part 1 papers. Financial Management and Control isintegrated with other Part 2 papers as it provides a management decision framework within whichaspects of the Part 2 syllabus are developed.
The effects of capital allowances and corporation tax on capital investment appraisal is examinable.Knowledge gained from Paper 2.3 Business Taxation (UK) will be useful in this respect.
Topics from Financial Management and Control are developed and advanced in Part 3 in Paper 3.3 Performance Management and Paper 3.7 Strategic Financial Management .

7/27/2019 Paper 2.4 - ATC International
http://slidepdf.com/reader/full/paper-24-atc-international 7/73
INTRODUCTION
Accountancy Tuition Centre (Overseas Courses) Ltd 2001 (vi)
Financial Management
and Control
MANAGEMENTACCOUNTING
(40%)
FINANCIALMANAGEMENT
(60%)
MANAGEMENT ACCOUNTING
COST ANDMANAGEMENTACCOUNTING
METHODS
COSTING/PRICING OFPRODUCTS
AND SERVICES
Management accountingand costing
Activity based costing
Costs for decision making
Costing methods
INFORMATION FOR PLANNING
AND CONTROL
Budgetary control systems Preparation of budgets
Quantitative techniques
for budgeting Standard costing and variance
analysis
Advanced variance analysis

7/27/2019 Paper 2.4 - ATC International
http://slidepdf.com/reader/full/paper-24-atc-international 8/73
INTRODUCTION
Accountancy Tuition Centre (Overseas Courses) Ltd 2001 (vii)
FINANCIAL MANAGEMENT
ORGANISATIONAL
OBJECTIVES
SOURCES OF
FINANCE
Organisational
objectives
MANAGEMENT OF
WORKING CAPITAL
CAPITAL EXPENDITURE
AND INVESTMENT
Equity finance Debt finance The capital structure
decision
Working capital
management Cash management Management of debtors
and creditors
Inventory management
Investment decisions Net present value and
internal rate of return Relevant cash flows for DCF Applications of DCF
Project appraisal under risk
FINANCIAL MANAGEMENT
FRAMEWORK
The financial environment
The economic environment

7/27/2019 Paper 2.4 - ATC International
http://slidepdf.com/reader/full/paper-24-atc-international 9/73
INTRODUCTION
Accountancy Tuition Centre (Overseas Courses) Ltd 2001 (viii)
Syllabus Content
1 Financial management objectives
a The nature, purpose and scope of financial management.
b The relationship between financial management, management accounting andfinancial accounting.
c The relationship of financial objectives and organisational strategy.
d Problems of multiple stakeholders in financial management and the
consequent multiple objectives.
e Objectives (financial and otherwise) in not-for-profit organisations.
2 The financial management environment
a Financial intermediation and credit creation.
b Money and capital markets
i Domestic and international
ii Stock markets (both major markets and small firm markets).
c The Efficient Markets Hypothesis.
d Rates of interest and yield curves.
e The impact of fiscal and monetary policy on business.
f Regulation of business (for example, pricing restrictions, green policies andcorporate governance).
3 Management of working capital
a The nature and scope of working capital management.
b Funding requirements for working capital.
c Working capital needs of different types of business.
d The relationship of working capital management to business solvency.
e Management of stock, debtors, short term funds, cash, overdrafts andcreditors.
f Techniques of working capital management (including, inter alia, ratioanalysis, EOQ, JIT, credit evaluation, terms of credit, cash discounts,factoring and invoice discounting, debtors cycles, efficient short term fundinvesting, cash forecasting and budgets, Miller-Orr models, basic foreignexchange methods, probabilities and risk assessment, terms of trade withcreditors).

7/27/2019 Paper 2.4 - ATC International
http://slidepdf.com/reader/full/paper-24-atc-international 10/73
INTRODUCTION
Accountancy Tuition Centre (Overseas Courses) Ltd 2001 (ix)
4 Sources of finance
a Sources and relative costs (including issue costs) of various types of financeand their suitability to different circumstances and organisations (large andsmall, listed and unlisted) including:
i access to funds and the nature of business risk
ii the nature and importance of internally generated funds
iii capital markets (types of share capital, new issues, rights issues,
loan capital, convertibles, warrants)
iv the effect of dividend policy on financing needs
v bank finance (short, medium and long term, including leasing)
vi trade credit
vii government sources: grants, regional and national aid schemes and
tax incentives.
viii problems of small company financing (collateral, maturity, funding
gap, risk)
ix problems of companies with low initial earnings (R&D, Internet,
and other high-technology businesses)
x venture capital and financial sources particularly suited to the smallcompany
xi international money and capital markets, including an introductionto international banking and the finance of foreign trade.
b Requirements of finance (for what purpose, how much and for how long) inrelation to a business’s operational and strategic objectives.
c The importance of the choice of capital structure: equity versus debt and basic analysis of the term profile of funds.
d Financial gearing and other key financial ratios and analysis of their significance to the organisation.
e Appropriate sources of finance, taking into account:
i cost of finance
ii timing of cash payments
iii effect on gearing and other ratios
iv effect on company’s existing investors.

7/27/2019 Paper 2.4 - ATC International
http://slidepdf.com/reader/full/paper-24-atc-international 11/73
INTRODUCTION
Accountancy Tuition Centre (Overseas Courses) Ltd 2001 (x)
5 Capital expenditure and investment
a Appraisal of domestic capital investment opportunities for profit and non- profit making organisations through the use of appropriate methods andtechniques
i the risk return relationship
ii return on capital employed
iii payback
iv internal rate of return
v net present value
vi single and multi-period capital rationing
vii lease or buy decisions
viii asset replacement
Including (in categories (i)-(viii)) the effects of taxation, inflation, risk anduncertainty (probabilities, decision trees, sensitivity analysis, simulation).
6 Costing systems
a The purpose of costing as an aid to planning, monitoring and control of
business activity.
b Information requirements of different approaches.
c Costing information requirements and limitations in not-for-profitorganisations.
d Behavioural implications of different costing approaches including
performance evaluation.
e Implications of costing approaches for profit reporting, the pricing of products and internal activities/services.
f The role of costing systems in performance evaluation and decision making.
7 Costing techniques
a Allocating/apportioning costs through the use of appropriate techniques
i absorption, marginal and opportunity cost approaches to theaccumulation of costs for specific orders (job, batch, contract) or operations (process, service)
ii activity based costing; use of cost drivers and activities
iii life cycle costing
iv target costing.

7/27/2019 Paper 2.4 - ATC International
http://slidepdf.com/reader/full/paper-24-atc-international 12/73
INTRODUCTION
Accountancy Tuition Centre (Overseas Courses) Ltd 2001 (xi)
8 Standard costing and variance analysis
a Standard costing
i determination of standards
ii identification and calculation of sales variances (including quantityand mix), cost variances (including mix and yield); absorption andmarginal approaches
iii significance and relevance of variances
iv operating statements
v interpretation and relevance of variance calculations to business
performance.
b Planning and operational variances.
c Behavioural implications of standard costing and variance reporting.
9 Budgeting and budgetary control
a Objectives of budgetary planning and control systems including aspects of
behavioural implications.
b Evaluation of budgetary systems such as fixed and flexible, zero based and
incremental, periodic, continuous and activity based.
c Development, implementation and coordination of budgeting systems:functional, subsidiary and master/principal budgets (including cash budgeting); budget review.
d Calculation and cause of variances as aids to controlling performance.
e Quantitative aids to budgeting and the concepts of correlation, basic timeseries analysis (seasonality) and forecasting; use of computer based models.
f Implications of costing systems on profit reporting.
g Behavioural implications of budgeting and budgetary control.
Excluded Topics
The following topics are specifically excluded from the syllabus:
Calculations involving the derivation of cost of capital in discounting problems. Candidates will always be supplied with an appropriate discountrate.
Calculations relating to Modigliani and Miller propositions.

7/27/2019 Paper 2.4 - ATC International
http://slidepdf.com/reader/full/paper-24-atc-international 13/73
INTRODUCTION
Accountancy Tuition Centre (Overseas Courses) Ltd 2001 (xii)
Key Areas Of The Syllabus
The core of the syllabus is aimed at developing the skills required in supporting managerial decisionmaking. They reflect the core competencies needed for students to satisfy the aim of the paper identified above. The core areas are:
financial management objectives
management of working capital
sources of finance
capital expenditure and investment
costing systems
standard costing and variance analysis
budgeting and budgetary control.
Approach To Examining The Syllabus
The examination is a three hour paper in two sections. Financial management issues will always, butnot exclusively, be examined in Section A. The Section A question will typically be a scenario based
question.
Most of the Section B questions will contain a mix of computation and discursive elements although it
is intended that at least one question will be entirely discursive. The balance between computation anddiscursive elements will remain largely constant from one examination to the next.
Section A: One compulsory scenario-based question 50
Section B: Choice of 2 from 4 questions (25 marks each) 50
Additional Information
Present value and annuity tables will be provided in the examination. The ACCA Study Guide providesmore detailed guidance on the syllabus. Wider reading is also desirable, especially regular study of relevant articles in the ACCA “student accountant” magazine.
EXAMINATION TECHNIQUE
Time allocation
Divide your time in proportion to the marks on offer. To allocate your time multiply themarks for each question by 1.8 minutes.
eg 25 mark question should take you 25 × 1.8 = 45 minutes
Stick to this time allocation.
The first marks are the easiest to gain in each question, so don’t overstep the time allocationon one question to tidy up a complicated answer, start the next question instead.

7/27/2019 Paper 2.4 - ATC International
http://slidepdf.com/reader/full/paper-24-atc-international 14/73
INTRODUCTION
Accountancy Tuition Centre (Overseas Courses) Ltd 2001 (xiii)
Numerical Questions
Before starting a computation, picture your route. Do this by jotting down the steps you aregoing to take and imagining the layout of your answer. For example an NPV calculation willrequire a cashflow table and workings for tax savings, working capital etc.
Set up a pro-forma structure to your answer before working the numbers. For example in an NPV calculation with tax it is important to maintain the distinction between the revenue andthe capital cashflows.
Use a columnar layout. This helps to avoid mistakes and is easier for the marker to follow.
Include all your workings and cross-reference them to the face of your answer. For example
ensure the marker can see where the entries for tax savings on your cashflow statement havecome from. In that way it is easy for your marker to identify your errors and give you themarks you deserve.
A clear approach and workings will help earn marks even if you make an arithmetic mistake.
If you do spot a mistake in your answer, often it is not worthwhile spending time amending
the consequent effects of it.
Don’t ignore marks for written recommendations or comments based upon your computation.
These are easy marks to gain. If you have been unable to complete the previous part of thequestion or your answer is obviously wrong then assume a sensible answer and base your comments on this. Do not try to justify the unjustifiable!
Case Study/Scenario based questions
Read the requirements carefully to identify
Instruction eg “outline, discuss .....”Content eg “the factors, the advantages ......”Vehicle/Format eg “report, memo, letter ......”Addressee eg “the board, the accountant ........”
Read the scenario quickly to identify
Company name, dates, nature of business, performance.
Recall the technical knowledge you have learned relating to the content from
the requirements and your quick read of the scenario. The different methodsof Investment Appraisal for example
Read the scenario again slowly and actively
highlighting key points, or noting implications in the margin, andnoting points on a plan of your answer.
Draw together your technical knowledge and the points from the scenario. Do this bythinking and rearranging your plan, before you write up your answer.

7/27/2019 Paper 2.4 - ATC International
http://slidepdf.com/reader/full/paper-24-atc-international 15/73
INTRODUCTION
Accountancy Tuition Centre (Overseas Courses) Ltd 2001 (xiv)
Written Questions
Planning
Read the requirements carefully at least twice to identify exactly how many areas you are being asked to address. Use the marking guide to establish how many points each section of your answer needs to make.
Jot down relevant thoughts on your plan. Make yourself generate sufficient points.
Give your plan a structure which you will follow when you write up the answer. Very often
the structure can be developed from the structure of the requirement.
Presentation
Use headings, indentation and bullet points to give your answer structure and to make itmore digestible for the marker.
Use short paragraphs for each point that you are making.
Separate paragraphs by leaving at least one line of space between each one.
Style
Pompous waffle does not impress markers. Concise, easily understood language scores marks.
Lots of points briefly explained tends to score higher marks than one or two points elaboratelyexplained.
GOOD LUCK!

7/27/2019 Paper 2.4 - ATC International
http://slidepdf.com/reader/full/paper-24-atc-international 16/73
MANAGEMENT ACCOUNTING AND COSTING
Accountancy Tuition Centre (Overseas Courses) Ltd 2001 0101
OVERVIEW
Objectives
To consider the role of the management accountant.
To review various methods of product costing.
COSTACCUMULATION
ABSORPTION v MARGINAL
COSTING
LIFE CYCLECOSTING
TARGETCOSTING
Features Steps
Possible methods
Definition Features
MANAGEMENTACCOUNTING
FUNCTION
MA and FA
Financial management Planning, control and
decision-making
Allocation Apportionment
Service departments
Stock level changes Profit reconciliation Quick calculations
Comparison

7/27/2019 Paper 2.4 - ATC International
http://slidepdf.com/reader/full/paper-24-atc-international 17/73
MANAGEMENT ACCOUNTING AND COSTING
Accountancy Tuition Centre (Overseas Courses) Ltd 2001 0102
1 MANAGEMENT ACCOUNTING – FUNCTION
1.1 Management accounting and Financial accounting
Management accounting is concerned with the preparation and presentation of
accounting information to management in order to help them plan, control and make
decisions about the operations of the business.
Financial accounting is concerned with the preparation and presentation of accounting
information on the performance and financial position of the business.
1.2 Comparison
Management accounting Financial accounting
Users of
information
Management Shareholders, banks, creditors,
potential investors, Customs &
Excise, Government, InlandRevenue
Format of
information
Can take any form Presentation regulated by law
and by the profession through
Accounting Standards and
European Directives
Purpose of
information
Useful to plan, control and make
decisions
Stewardship and investment
decisions
Bases of
valuation
Relevant costs Historical costs
1.3 Financial management
As well as a need for financial accounting and management accounting an organisation
will also require financial management. Financial management is concerned with:
the raising of long-term finance;
appraising potential investments or projects;
determining dividend policy ;
controlling working capital.
The financial manager will therefore determine the overall financing requirements of
the organisation and its investment policy. The management accountant will be
responsible for the control and reporting of these activities for management purposes
and the financial accountant will be responsible for reporting the activities for external
purposes.

7/27/2019 Paper 2.4 - ATC International
http://slidepdf.com/reader/full/paper-24-atc-international 18/73
MANAGEMENT ACCOUNTING AND COSTING
Accountancy Tuition Centre (Overseas Courses) Ltd 2001 0103
1.4 Planning, control and decision-making
1.4.1 Planning
Encompasses establishing objectives and evaluating policies and actions required to
achieve them.
Planning is the setting of goals and selecting the means of achieving them.
As businesses become large, these procedures will need to be formalised.
Short-term plans such as the annual budget show in detail the intended results
for the forthcoming year. (See Session 4)
Long-term plans are usually documents showing the long-term objectives of
the business.
1.4.2 Control
Control is the assessment of performance by comparing the budgeted results
with actual results.
This usually takes the form of an operating statement which breaks down the
difference into its component parts.
1.4.3 Decision-making
Decision-making usually involves using the information provided by the
costing system to make decisions.
2 COST ACCUMULATION
2.1 Approaches
Costs are recorded and accumulated in cost accounting systems using one of two main
approaches:
absorption costing;
marginal costing.
Under an absorption costing system overhead costs must be allocated, apportioned and
then absorbed.
2.2 Allocation
This is where costs that relate to a single cost centre are allocated to that cost centre.
2.3 Apportionment
Apportionment is where an overhead is common to more than one cost centre and
therefore needs to be shared out amongst the relevant cost centres using an appropriate
method of apportionment.

7/27/2019 Paper 2.4 - ATC International
http://slidepdf.com/reader/full/paper-24-atc-international 19/73
MANAGEMENT ACCOUNTING AND COSTING
Accountancy Tuition Centre (Overseas Courses) Ltd 2001 0104
Illustration
Cost Basis of apportionment
Rent, rates, heat − Floor area
Supervision, canteen costs − Number of employees
Depreciation, plant insurance − Book value of plant
2.4 Service department costs
Service departments are cost centres which exist to provide services to other
departments. The canteen is a common example.
Having allocated and apportioned the costs to the production and service departments,
the totals of the latter need to be reallocated and reapportioned to the former.
Three methods available:
Direct method – ignores work between service departments.
Step method – service department which does most work for other service
departments is reapportioned first. Other reciprocal services are ignored.
Reciprocal method – Full recognition is given for all work done by service
departments for each other. May be solved algebraically by simultaneous
equations.
Example 1
Production Service Pressing Assembly Canteen Main-
dept dept tenance£ £ £ £
Allocated costs specific toa department 10,000 20,000 5,000 6,000
Apportioned costs, eg rates
according to square footage 5,000 6,000 3,000 3,000 ——— ——— ——— ——— 15,000 26,000 8,000 9,000
Re-allocate service overheads to production departments
Use of canteen 50% 30% 20%Use of maintenance 55% 40% 5%
Required:
Reapportion the service department costs using:
(i) direct method;
(ii) step method;
(iii) reciprocal methods.

7/27/2019 Paper 2.4 - ATC International
http://slidepdf.com/reader/full/paper-24-atc-international 20/73
MANAGEMENT ACCOUNTING AND COSTING
Accountancy Tuition Centre (Overseas Courses) Ltd 2001 0105
Solution
(i) Direct method
Pressing Assembly Canteen Maintenance
£ £ £ £
Canteen (50:30)
Maintenance (55:40)
15,000 26,000 8,000 9,000
———
———
———
———
———
———
———
———
(ii) Step (down) method
Pressing Assembly Canteen Maintenance
£ £ £ £
Canteen (50:30:20)
15,000 26,000 8,000 9,000
——— ——— ——— ———
Maintenance (55:40)
———
———
———
———
———
———
———
———

7/27/2019 Paper 2.4 - ATC International
http://slidepdf.com/reader/full/paper-24-atc-international 21/73
MANAGEMENT ACCOUNTING AND COSTING
Accountancy Tuition Centre (Overseas Courses) Ltd 2001 0106
(iii) Reciprocal method
Repeated distribution
Pressing Assembly Canteen Maintenance
£ £ £ £
Canteen (50:30:20)
15,000 26,000 8,000 9,000
——— ———
Maintenance (55:40:5) ____
———
Canteen (50:30:20) ____
____
Maintenance (55:40:5) ____
____
Canteen (50:30:20)
———
———
———
———
____
––––
____
––––
OR Algebraically
Let x be the total cost of canteen service department
Let y be the total cost of maintenance service department
x = y =
Rearranging
Solve simultaneously
~
y =
Substitute
x =

7/27/2019 Paper 2.4 - ATC International
http://slidepdf.com/reader/full/paper-24-atc-international 22/73
MANAGEMENT ACCOUNTING AND COSTING
Accountancy Tuition Centre (Overseas Courses) Ltd 2001 0107
Pressing Assembly Canteen Maintenance
£ £ £ £
Canteen (50:30:20)
Maintenance (55:40:5)
15,000 26,000 8,000 9,000
———
———
———
———
———
———
———
———
As can be seen by the above results the differences between the methods are marginal
and generally insignificant. This is especially true when it is remembered that the
process of apportionment has already introduced subjective judgement into the
calculations.
What is the most appropriate apportionment basis?
2.5 Absorption
The total of the overheads in each production department must now be absorbed into
the units of production.
This is achieved using one of the following methods:
direct labour hour rate
direct material cost rate
direct labour cost rate
prime cost percentage rate
machine hour rate
unit of output rate.

7/27/2019 Paper 2.4 - ATC International
http://slidepdf.com/reader/full/paper-24-atc-international 23/73
MANAGEMENT ACCOUNTING AND COSTING
Accountancy Tuition Centre (Overseas Courses) Ltd 2001 0108
Example 2
X Ltd estimates that its factory costs for the coming year will be as follows:
£Direct material 40,000Direct wages 60,000
——— PRIME COST 100,000Factory overhead 30,000
——— Total factory cost 130,000
———
During the year there will be 100,000 direct labour hours, 50,000 machine hours and
200,000 units will be produced.
Required:
Work out the absorption rate using the following methods:
(i) direct labour hour rate;
(ii) direct material cost rate;
(iii) direct labour cost rate;
(iv) prime cost % rate;
(v) machine hour rate;
(vi) unit of output rate.
Solution
(i) Direct labour hour rate
(ii) Direct material cost rate
(iii) Direct labour cost rate
(iv) Prime cost % rate
(v) Machine hour rate
(vi) Unit of output rate

7/27/2019 Paper 2.4 - ATC International
http://slidepdf.com/reader/full/paper-24-atc-international 24/73
MANAGEMENT ACCOUNTING AND COSTING
Accountancy Tuition Centre (Overseas Courses) Ltd 2001 0109
2.6 Pre-determined overhead rates
As the above figures have been calculated using estimates of costs for the coming year,
it is known as a pre-determined overhead absorption rate (POAR). This is then used to
apportion the overheads to the products. This rate is generally derived from the
budgeted overhead and the normal level of production figures, in order to avoid
distortion caused by seasonal fluctuations and to provide a consistent basis for
measuring costs.
Finally there are three relevant figures relating to overheads:
originally budgeted overhead;
actual overhead spent;
overhead absorbed (POAR × Actual activity level).
The difference between (2) and (3) is the under or over absorption which will be
adjusted for in the profit and loss account for the period.
> = under-absorption – debit to P&L
> = over-absorption – credit to P&L
2.7 Summary
The diagram below shows the process described above.
PRODUCTION OVERHEADS
PRODUCTION COST
PRODUCTION
DEPARTMENT B
SERVICE
DEPARTMENT
DIRECT
COSTS
Allocation
Apportionment
Reapportionment
Absorption
Charging of direct costs
PRODUCTION
DEPARTMENT B

7/27/2019 Paper 2.4 - ATC International
http://slidepdf.com/reader/full/paper-24-atc-international 25/73
MANAGEMENT ACCOUNTING AND COSTING
Accountancy Tuition Centre (Overseas Courses) Ltd 2001 0110
3 ABSORPTION V MARGINAL
3.1 Methods
Absorption
costing Variable
production costs
Fixed
production costs
Selling
costs
Product
costs
Closing stock
⇒ Balance sheet
⇒ Profit and
loss account
period expenditure
Marginal costing Variable
production costs
Fixed
production costs
Selling
costs
Product
costs
Closing stock
⇒ Balance sheet
⇒ Profit and
loss account
period expenditure
period expenditure
These diagrams clearly show the difference between Total absorption costing (TAC)
and Marginal costing (MC). Under TAC fixed production costs are charged to the
products made and, to the extent that items remain in closing stock, a proportion of
those costs are carried forward as an asset in the balance sheet. Under MC all fixed
production costs are charged to the profit and loss account as a period charge.
Hence the reconciliation between TAC profits and MC profits (see later ) relates to
stock movement.

7/27/2019 Paper 2.4 - ATC International
http://slidepdf.com/reader/full/paper-24-atc-international 26/73
MANAGEMENT ACCOUNTING AND COSTING
Accountancy Tuition Centre (Overseas Courses) Ltd 2001 0111
Example 3
Budgeted sales and production are 10,000 items.
Standard/Budgeted figures
Selling price = £20 per unitMaterials = £3 per unitOther variable production costs = £2 per unitVariable selling costs = £3 per unitFixed production costs = £40,000Fixed selling costs = £20,000
Actual figures
Opening stock = 1,000 unitsSales = 9,000 units
Production = 11,000 units
Required:
Produce
(i) a marginal costing standard cost card;
(ii) an absorption costing standard cost card;(iii) a marginal costing profit and loss account;
(iv) an absorption costing profit and loss account.
(Produce profit and loss accounts assuming that revenues and costs are as originally budgeted.)
Solution
(i) Marginal costing standard cost card
£ £
Selling price
Materials
Other variable production costs
— Production costs – stock valuation
Variable selling costs
—
Cost of sales
Contribution
——
——

7/27/2019 Paper 2.4 - ATC International
http://slidepdf.com/reader/full/paper-24-atc-international 27/73
MANAGEMENT ACCOUNTING AND COSTING
Accountancy Tuition Centre (Overseas Courses) Ltd 2001 0112
(ii) Absorption costing standard cost card
£ £
Selling price
Materials
Other variable production costs
Fixed production overhead —
Production costs – stock valuation
Variable selling costs
Fixed selling costs
—
Cost of sales
Profit
——
——
(iii) Marginal costing profit and loss
£000 £000
Sales
Less: Cost of sales
Opening stock †
Variable production costs
Closing stock †
——
——
Variable selling and administrative costs
—— Contribution
Fixed production costs
Fixed selling and administrative costs
Net profit
——
——
† Stocks valued at variable production cost per unit only.

7/27/2019 Paper 2.4 - ATC International
http://slidepdf.com/reader/full/paper-24-atc-international 28/73
MANAGEMENT ACCOUNTING AND COSTING
Accountancy Tuition Centre (Overseas Courses) Ltd 2001 0113
(iv) Absorption costing profit and loss
£000 £000
Sales
Less: Cost of sales
Opening stock*
Variable production costs
Fixed production costs
Closing stock*
——
——
Gross profit
Fixed selling and administrative costs
Variable selling and administrative costs
Net profit
——
——
* Stocks valued at variable production cost plus fixed production cost per unit.
An alternative layout of the absorption costing profit or loss account, which clearly
shows the over or under-absorption of overheads, would be as follows:
£000 £000
Sales
Opening stock
Total production costs
Closing stock
–––
––––
Under/over absorption
Overhead absorbed
Overhead spent
–––
Over absorption
––––
Gross profit
Fixed selling and administrative costs
Variable selling and administrative costs
Net profit
––––
––––

7/27/2019 Paper 2.4 - ATC International
http://slidepdf.com/reader/full/paper-24-atc-international 29/73

7/27/2019 Paper 2.4 - ATC International
http://slidepdf.com/reader/full/paper-24-atc-international 30/73
MANAGEMENT ACCOUNTING AND COSTING
Accountancy Tuition Centre (Overseas Courses) Ltd 2001 0115
(b) Marginal costing
Month 1 Month 2 Month 3
£ £ £ £ £ £
Sales
Opening stock Variable production costs
Closing stock
——— ——— ———
Cost of goods sold
——— ——— ———
CONTRIBUTION
Fixed production costs
Gross profit
———
———
———
———
———
———
3.2 Stock level changes
Change in stock Effect on profit
(1)
(2)
(3)
Closing stock > Opening stock
Closing stock = Opening stock
Closing stock < Opening stock
TAC profit > MC profit
TAC profit = MC profit
TAC profit < MC profit
3.3 Profit reconciliation
Using Example 4 figures : Month 1 Month 2 Month3
£ £ £Marginal cost profit 38,000 70,500 64,000
Difference in profit
(Change in stock level × Fixed prodn o/h per unit)
2,000 × £5
500 × £5 10,000 (2,500) −
——— ——— ———
Absorption cost profit 48,000 68,000 64,000 ——— ——— ———
The above profit reconciliation assumes that the fixed overhead absorption rate per unit
remains constant. If this were to change, the reconciling difference would become the
difference between fixed production costs:
(i) b/f in opening stock; and
(ii) c/f in closing stock.

7/27/2019 Paper 2.4 - ATC International
http://slidepdf.com/reader/full/paper-24-atc-international 31/73
MANAGEMENT ACCOUNTING AND COSTING
Accountancy Tuition Centre (Overseas Courses) Ltd 2001 0116
3.4 Quick profit calculations
If there is no requirement to show a profit and loss account, quick profit calculations
can be used.
The calculations shown below are illustrated using the data from Example 3 .
(i) Marginal profit calculation
£000
Unit contribution × Units sold (12 × 9,000) 108Less Fixed production costs (40)
Fixed selling and administrative costs (20) ––––
Net profit 48 ––––
(ii) Absorption profit calculation£000
Unit profit × Unit solds (6 × 9,000) 54Adjust for:
Over/(under) absorption of fixed production overhead
((11,000 × 4) – 40,000) 4Over/(under) absorption of fixed selling and administrative
overhead ((9,000 × 2) – 20,000) (2) ––––
Net profit 56
––––
3.5 Comparison of methods
Total absorption costing Marginal costing
Stock valuation Conforms to accounting
standards
Prudent valuation
Profits Depends on sales and
production (manipulate it
by over-stocking)
Depends on sales
Costing procedures Avoids splitting semi-variable costs
Avoids allocation,apportionment and absorption
Decision-making Pricing More useful and relevant
Cost control Focuses on all costs Focuses on controllable costs

7/27/2019 Paper 2.4 - ATC International
http://slidepdf.com/reader/full/paper-24-atc-international 32/73
MANAGEMENT ACCOUNTING AND COSTING
Accountancy Tuition Centre (Overseas Courses) Ltd 2001 0117
4 TARGET COSTING
4.1 Features
A target for product cost is derived by subtracting a desired profit margin from a
competitive market price.
A technique used to try to ensure that desired profit margins are achieved.
Used at the planning and design stage for a new product.
Particularly used in the car industry.
4.2 Steps
The sales department estimates the competitive market price for the new
product ie the estimated price that customers will be prepared to pay.
Management sets a required profit margin.
The target cost is calculated as
Target cost = Estimated selling price – required profit margin
The target cost is then given to the product and process designers who must
try to reduce budgeted costs to target.
4.3 Possible methods of meeting target cost
Value analysis
MRP/MRPII
5 LIFE CYCLE COSTING
4.1 Definition
A system which tracks and accumulates the actual costs and revenues attributable to
each product from development through to abandonment
4.2 Features
In the modern manufacturing environment a high proportion of a product’s
costs will be at the early stages in its life cycle eg development, design and
set-up costs.
This requires an accounting system that compares the revenue from a product
with all the costs incurred over the entire product life cycle.
Life Cycle Costing traces development, design and set-up costs to individual
products over the entire life cycle of that product.
Final profitability of a product is therefore determined at the end of the lifecycle.

7/27/2019 Paper 2.4 - ATC International
http://slidepdf.com/reader/full/paper-24-atc-international 33/73
MANAGEMENT ACCOUNTING AND COSTING
Accountancy Tuition Centre (Overseas Courses) Ltd 2001 0118
At any stage during the life cycle accumulated costs can be compared to life
cycle budgeted costs to aid control.
FOCUS
You should now be able to:
outline and distinguish between the nature and scope of management
accounting and the role of costing in meeting the needs of management
describe the purpose of costing as an aid to planning, monitoring and
controlling business activity
explain the potential for different costing approaches to influence cost
accumulation and profit reporting
explain the requirement to allocate overheads
describe, explain and apply absorption and marginal costing
reconcile the resulting profits/losses from absorption and marginal costing
explain the impact of life cycle costing on cost accumulation
describe and apply target costing methods
evaluate the relative advantages and disadvantages of the different costing
approaches

7/27/2019 Paper 2.4 - ATC International
http://slidepdf.com/reader/full/paper-24-atc-international 34/73
MANAGEMENT ACCOUNTING AND COSTING
Accountancy Tuition Centre (Overseas Courses) Ltd 2001 0119
EXAMPLE SOLUTIONS
Solution 1 – Service departments
(i) Direct method
Pressing Assembly Canteen Maintenance
£ £ £ £
Canteen (50:30)
Maintenance (55:40)
15,000
5,000
5,211
26,000
3,000
3,789
8,000
(8,000)
9,000
(9,000)
———
25,211
———
———
32,789
———
———
–
———
———
–
———
(ii) Step method
Pressing Assembly Canteen Maintenance
£ £ £ £
Canteen (50:30:20)
15,000
4,000
26,000
2,400
8,000
(8,000)
9,000
1,600
——— ——— ——— ———
19,000 28,400 – 10,600
Maintenance (55:40) 6,137 4,463 (10,600)
———
25,137
———
———
32,863
———
———
–
———
———
–
———
(iii) Reciprocal method
Repeated distribution
Pressing Assembly Canteen Maintenance
£ £ £ £
Canteen (50:30:20)
15,000
4,000
26,000
2,400
8,000
(8,000)
9,000
1,600
——— ———
Maintenance (55:40:5) 5,830 4,240
–
530
10,600
(10,600)
——— ———
Canteen (50:30:20) 265 159530
(530) –
106
——— ———
Maintenance (55:40:5) 58 42
–
6
106
(106)
——— ———
Canteen (50:30:20) 3 3
6
(6) –
———
25,156
———
———
32,844
———
———
–
———
———
–
———

7/27/2019 Paper 2.4 - ATC International
http://slidepdf.com/reader/full/paper-24-atc-international 35/73
MANAGEMENT ACCOUNTING AND COSTING
Accountancy Tuition Centre (Overseas Courses) Ltd 2001 0120
OR Algebraically
Let x be the total cost of canteen service department
Let y be the total cost of maintenance service department
x = 8,000 + 0.05 y
y = 9,000 + 0.20 x
Rearranging
x – 0.05 y = 8,000
–0.20 x + y = 9,000
Multiply by 0.2
0.20 x – 0.01 y = 1,600
– 0.20 x + y = 9,000
Add 0.99 y = 10,600 ~
y =10 600
0 99
,
.
y = £10,707
Substitute into
x – 535 = 8,000
x = £8,535
Pressing Assembly Canteen Maintenance£ £ £ £
Canteen (50:30:20)
Maintenance (55:40:5)
15,000
4,267
5,889
26,000
2,561
4,283
8,000
(8,535)
535
9,000
1,707
(10,707)
———
25,156
———
———
32,844
———
———
–
———
———
–
———
Solution 2 – Overhead absorption
(i) Direct labour hour rate
hrs10,000
£30,000= 30p
(ii) Direct material cost rate £30,
£40,
000
000= 75%
(iii) Direct labour cost rate £30,
£60,
000
000= 50%
(iv) Prime cost % rate £30,
£100,
000
000
= 30%

7/27/2019 Paper 2.4 - ATC International
http://slidepdf.com/reader/full/paper-24-atc-international 36/73
MANAGEMENT ACCOUNTING AND COSTING
Accountancy Tuition Centre (Overseas Courses) Ltd 2001 0121
(v) Machine hour rate £30,
,
000
50 000 hrs= 60p
(vi) Unit of output rate £30 000
200 000 units
,
,= 15p
Solution 3 – MC vs AC
(i) Marginal costing standard cost card
£ £
Selling price 20
Materials
Other variable production costs
3
2
—
Production costs – stock valuation
Variable selling costs
5
3
—
Cost of sales (8)
Contribution
——
12
——
(ii) Absorption costing standard cost card
£ £
Selling price 20
MaterialsOther variable production costs
Fixed production overhead
32
4
—
Production costs – stock valuation
Variable selling costs
Fixed selling costs
9
3
2
—
Cost of sales (14)
Profit
——
6
——

7/27/2019 Paper 2.4 - ATC International
http://slidepdf.com/reader/full/paper-24-atc-international 37/73
MANAGEMENT ACCOUNTING AND COSTING
Accountancy Tuition Centre (Overseas Courses) Ltd 2001 0122
(iii) Marginal costing profit and loss
£000 £000
Sales 180
Less: Cost of sales
Opening stock †
Variable production costs
Closing stock †
5
55
(15)
—— (45)
——
135
Variable selling and administrative costs (27)
——
Contribution
Fixed production costs
Fixed selling and administrative costs
108
(40)
(20)
Net profit
——
48 ——
† Stocks valued at variable production cost per unit only.
(iv) Absorption costing profit and loss
£000 £000
Sales 180
Less: Cost of sales
Opening stock*
Variable production costs
Fixed production costsClosing stock*
9
55
40(27)
—— (77)
——
Gross profit
Fixed selling and administrative costs
Variable selling and administrative costs
3 × 9,000
103
(20)
(27)
Net profit
——
56
——
* Stocks valued at variable production cost plus fixed production cost per unit.

7/27/2019 Paper 2.4 - ATC International
http://slidepdf.com/reader/full/paper-24-atc-international 38/73
MANAGEMENT ACCOUNTING AND COSTING
Accountancy Tuition Centre (Overseas Courses) Ltd 2001 0123
Alternative layout
£000 £000
Sales
Opening stock
Total production costs (11 × 9)
Closing stock
9
99
(27)
180
––– (81)
––––
99
Under/over absorption
Overhead absorbed (11 × 4)
Overhead spent
44
(40)
–––
Over absorption 4
––––
Gross profit
Fixed selling and administrative costsVariable selling and administrative costs
103
(20)(27)
Net profit
––––
56
––––
Solution 4 – Costing profit and loss accounts
(a) Absorption costing
Month 1 Month 2 Month 3
£ £ £ £ £ £
Sales 120,000 170,000 160,000
Opening stock
Variable production costs
Fixed production costs
Closing stock
12,000
56,000
40,000
(36,000)
36,000
56,000
40,000
(30,000)
30,000
56,000
40,000
(30,000)
——— ——— ———
Cost of goods sold 72,000 102,000 96,000
Gross profit
———
48,000
———
———
68,000
———
———
64,000
———

7/27/2019 Paper 2.4 - ATC International
http://slidepdf.com/reader/full/paper-24-atc-international 39/73
MANAGEMENT ACCOUNTING AND COSTING
Accountancy Tuition Centre (Overseas Courses) Ltd 2001 0124
(b) Marginal costing
Month 1 Month 2 Month 3
£ £ £ £ £ £
Sales 120,000 170,000 160,000
Opening stock
Variable production costs
Closing stock
7,000
56,000
(21,000)
21,000
56,000
(17,500)
17,500
56,000
(17,500)
——— ——— ———
Cost of goods sold 42,000 59,500 56,000
——— ——— ———
CONTRIBUTION
Fixed production costs
78,000
40,000
110,500
40,000
104,000
40,000
Gross profit
———
38,000
———
———
70,500
———
———
64,000
———

7/27/2019 Paper 2.4 - ATC International
http://slidepdf.com/reader/full/paper-24-atc-international 40/73
ACTIVITY BASED COSTING
Accountancy Tuition Centre (Overseas Courses) Ltd 2001 0201
OVERVIEW
Objective
! To consider the differences between traditional costing systems and activity based costing.
COST DRIVERS
ACTIVITYBASED
COSTING
ADVANTAGES &DISADVANTAGES
CALCULATIONOF PRODUCT
COST

7/27/2019 Paper 2.4 - ATC International
http://slidepdf.com/reader/full/paper-24-atc-international 41/73
ACTIVITY BASED COSTING
Accountancy Tuition Centre (Overseas Courses) Ltd 2001 0202
1 ACTIVITY BASED COSTING
Activity-based costing (ABC) is an approach to costing and activity monitoring which
assigns resources consumed to activities and activities to cost objects (based onestimated consumption). Cost drivers are used to apportion activity costs to output.
This approach for calculating product costs was developed by Cooper and Kaplan.
It recognises that traditional ideas of fixed and variable cost categorisations are notalways appropriate and that, as the proportion of overhead costs in manufacture hasincreased, there is a need for a more accurate method of absorbing these costs into costunits.
It looks for a clearer picture of cost behaviour and a better understanding of what
determines the level of costs – “cost drivers”.
In finding total product costs, overheads are traced to individual production
departments as usual – apportioning common costs according to suitable bases.

7/27/2019 Paper 2.4 - ATC International
http://slidepdf.com/reader/full/paper-24-atc-international 42/73
ACTIVITY BASED COSTING
Accountancy Tuition Centre (Overseas Courses) Ltd 2001 0203
Then
Identify major activities within each
department which create
cost
Determine
what causes the cost of each activity – the “cost
driver”
Create a cost
centre/cost poolfor each activity – the
“activity cost pool”
Step 1
Step 2
Step 3
Step 4
Examples
(1) Production scheduling
(2) Machining(3) Despatching of orders(4) Inspections
(1) Number of batch set-ups for production
scheduling(2) Machine hours for machining(3) Number of despatch orders for despatching(4) Number of inspections
Cost pool for:(1) all production scheduling costs(2) all machining costs
(3) all despatching costs
(4) all inspection costs
Cost per
(1) batch set up
(2) machine hour (3) despatch order (4) inspection
Eg Product Z(1) No of batch set ups for Product Z
× Cost per batch set up x(2) No of machine hours for Product Z
× Cost per machine hour x
(3) No of despatch orders for Product Z× Cost per despatch order x
(4) No of inspections for Product Z
× Cost per inspection x –––
y –––
Eg Product Z
Overhead cost per unit = producedZsof No
y
Calculate anabsorption rate
for each
“cost driver”
Calculate the totaloverhead cost
for manufacturing
each product
Calculate overhead
cost per unit
Step 5
Step 6
Having discovered the cost drivers within the business, it may well be decided to re-organise the original production departments.
2 COST DRIVERS
As can be seen, rather than use a single absorption rate, different types of overhead costare absorbed into units of production according to more appropriate rates based on costdrivers.
For example, for a particular production department find a warehousing cost/kg of material used, electricity cost/machine hour, production scheduling cost/production
order, etc. These can then each be costed for every product and aggregated to calculatean overhead cost per unit as described above.

7/27/2019 Paper 2.4 - ATC International
http://slidepdf.com/reader/full/paper-24-atc-international 43/73
ACTIVITY BASED COSTING
Accountancy Tuition Centre (Overseas Courses) Ltd 2001 0204
3 ADVANTAGES AND DISADVANTAGES OF ABC
3.1 Advantages
! Allotment of overhead is fairer and therefore product costs are more accurate.
! There is a better understanding of what causes cost.
! The company can concentrate on producing the most profitable items.
! Control of overheads is easier, as responsibility for incoming costs must beestablished before ABC can be implemented.
! Performance appraisal is more meaningful.
! Cost driver rates can be monitored and used to identify areas of weakness or inefficiency.
! Budget setting and sensitivity analysis are more accurate.
! Activity based budgeting (ABB) can be used.
Activity-based budgeting (ABB) is a budgeting method based on an activityframework which uses cost driver data in the processes of budget-setting and
variance feedback .
! New products can be designed to utilise efficient cost drivers. Cost can bedesigned out of products.
3.2 Disadvantages
! ABC may be based on historic information but could be used for futurestrategic decisions.
! Selection of cost drivers may not be easy.
! Additional time and cost of setting up and administering the system.
! Cost measurement may not be easy.
! Exclusion of non-production overheads can be difficult.
! Assessing the degree of completion of work in progress with respect to eachcost driver is difficult.
! Variance analysis is complicated.
! Many judgemental decisions still required in the construction of an ABCsystem.

7/27/2019 Paper 2.4 - ATC International
http://slidepdf.com/reader/full/paper-24-atc-international 44/73
ACTIVITY BASED COSTING
Accountancy Tuition Centre (Overseas Courses) Ltd 2001 0205
4 CALCULATION OF PRODUCT COST
Example 1
Total budgeted fixed overheads for a firm are £712,000. These have traditionally been
absorbed on a machine hour basis. The firm makes two products, A and B.
A B
Direct material cost £20 £60Direct labour cost £50 £40Machine time 3 hrs 4 hrsAnnual output 6,000 40,000
Required:
(a) Calculate the total cost for each product on the assumption that the firm
continues to absorb overheads on a machine hours basis.
The firm is considering changing to an Activity Based Costing system and hasidentified the following information:
Machine Annual Total No of No of hours/unit output machine hrs set ups purchase orders
Product A 3 6,000 18,000 16 52Product B 4 40,000 160,000 30 100
——— ——— —— —— 46,000 178,000 46 152
——— ——— —— ——
Cost pools: Cost driver:£
Machine related 178,000 Machine hoursSet-up related 230,000 Set-ups
Purchasing related 304,000 Purchase orders
———— Total overheads 712,000
————
Required:
(a) Calculate the cost per unit using traditional overhead absorption.
(b) Calculate the cost per unit using the ABC system.

7/27/2019 Paper 2.4 - ATC International
http://slidepdf.com/reader/full/paper-24-atc-international 45/73
ACTIVITY BASED COSTING
Accountancy Tuition Centre (Overseas Courses) Ltd 2001 0206
Solution
(a) Traditional
Total overhead =
Total machine hours =
Rate per hour =
A£
B£
Direct materialDirect labour
2050
6040
Fixed o/h
— —— Total
— ——
(b) ABC
Activities Machinerelated
Set-uprelated
Purchasing related
Overheads £178,000 £230,000 £304,000Consumption of activities
(cost drivers) 178,000 hrs 46 set ups 152 ordersCost per unit of consumption
Cost traced to products
AB
Cost per unit
A
B
A£
B£
Direct materialDirect labour Fixed overhead
20.0050.00
60.0040.00
_____
_____
Total
––––– –––––

7/27/2019 Paper 2.4 - ATC International
http://slidepdf.com/reader/full/paper-24-atc-international 46/73
ACTIVITY BASED COSTING
Accountancy Tuition Centre (Overseas Courses) Ltd 2001 0207
FOCUS
You should now be able to
! understand some of the limitations of traditional cost allocation,apportionment and absorption.
! explain and apply activity based costing .

7/27/2019 Paper 2.4 - ATC International
http://slidepdf.com/reader/full/paper-24-atc-international 47/73
ACTIVITY BASED COSTING
Accountancy Tuition Centre (Overseas Courses) Ltd 2001 0208
EXAMPLE SOLUTIONS
Solution 1 – Product cost
(a) Traditional
Total overhead = £712,000
Total machine hours = £178,000
Rate per hour =
000178
000712
,
,
= £4/hr
A£
B£
Direct material
Direct labour
20
50
60
40Fixed o/h
3hrs @ £44hrs @ £4
1216
— ——
Total 82 116 — ——
(b) ABC
Activities Machinerelated
Set-uprelated
Purchasing related
Overheads £178,000 £230,000 £304,000Consumption of activities
(cost drivers) 178,000 hrs 46 set ups 152 ordersCost per unit of consumption £1 per hour £5,000 per set up £2,000 per order Cost traced to products
AB
£18,000£160,000
£80,000£150,000
£104,000£200,000
Cost per unit
A
6,000
104,00080,00018,000 ++
= £33.67
B
40,000
200,000150,000160,000 ++
= £12.75
A£
B£
Direct materialDirect labour Fixed overhead
20.0050.0033.67
60.0040.0012.75
_____
_____
Total 103.67 112.75
––––– –––––

7/27/2019 Paper 2.4 - ATC International
http://slidepdf.com/reader/full/paper-24-atc-international 48/73
COSTS FOR DECISION MAKING
Accountancy Tuition Centre (Overseas Courses) Ltd 2001 0301
OVERVIEW
Objective
! To consider the information and costing requirements for managementdecision making.
BREAK-EVENANALYSIS
Break-even pointsBreak-even charts Margin of safety
INFORMATIONREQUIREMENTS
KEY FACTOR ANALYSIS
RELEVANTCOSTS
MeaningDifficultiesDeprival value
MISLevels of managementTypes of information
Limiting factors
MethodLimitations
MAKE OR BUYDECISIONS
MethodLimitations

7/27/2019 Paper 2.4 - ATC International
http://slidepdf.com/reader/full/paper-24-atc-international 49/73
COSTS FOR DECISION MAKING
Accountancy Tuition Centre (Overseas Courses) Ltd 2001 0302
1 INFORMATION REQUIREMENTS
1.1 Management information system
A management information system (MIS) is a set of formalised procedures designed to
provide managers at all levels with appropriate information from all relevant sources(internal and external) to enable them to make timely and effective decisions for planning and controlling the activities for which they are responsible.
Therefore a typical MIS:
! receives input data! processes the input data into information for output! communicates the output information.
The part of the accountant within the MIS will vary, depending on:
! the type of organisation and the type of costing system used! techniques used, eg budgets, standard costs! type and volume of information required.
1.2 Planning information
! Information is needed to decide the firm’s objectives and how they are to beachieved
! It pre-supposes that the current position of the firm is understood.Knowledge of the current position can be achieved through strategic analysis
of internal and external information (See Session 20).
1.2.1 Internal information
! Production and operations! Marketing and sales! Finance! Research and development! Personnel and organisation
1.2.2 External information
!
Markets and competitors! Economic conditions! Political situation! Technological change! Social trends

7/27/2019 Paper 2.4 - ATC International
http://slidepdf.com/reader/full/paper-24-atc-international 50/73
COSTS FOR DECISION MAKING
Accountancy Tuition Centre (Overseas Courses) Ltd 2001 0303
1.3 Levels of management and information needs
1.3.1 Strategic
! Investment appraisal! Potential markets! Forecasting and budgeting
In essence strategic planning looks at the “big picture” and is long-term and forward-looking in nature.
1.3.2 Tactical
Concerns effective and efficient resource utilisation to achieve specified objectives
encompassing:
! Purchasing decisions! Stock locations! Sales analysis! Cash flow projections
1.3.3 Operational
! Debtors and creditors! Payroll details! Customer complaints! Meeting schedules! Variances
In essence operational planning is concerned with detail and considers the immediate past and future; hence it is short-term in nature.
1.4 Control information
! Information which provides a comparison between actual results and the plan
! Only useful if it is timely, concise and reliable
! Useless if it:
− arrives too late;
− is unreliable;− concerns matters outside the control of the recipient
1.5 Decision-making information
! Must be relevant, up-to-date, as accurate as is necessary for the decision! Most important to use relevant costs.

7/27/2019 Paper 2.4 - ATC International
http://slidepdf.com/reader/full/paper-24-atc-international 51/73
COSTS FOR DECISION MAKING
Accountancy Tuition Centre (Overseas Courses) Ltd 2001 0304
2 BREAK-EVEN ANALYSIS
2.1 Definition
Break-even point is the level of sales in units or revenue at which no profit or loss is
made.
Example 1
Selling price = 80p per unitVariable costs = 60p per unit
Total fixed costs = £2,000
Required:
What is the profit if sales are as follows?
10,000 units20,000 units30,000 units
Solution
Output 10,000
———
£
20,000
———
£
30,000
———
£SalesVariable costs
——— ——— ——— Contribution
Fixed costs
Profit ———
———
———
———
———
———
2.2 Determining the break-even point
units)in(expressed
pointevenBreak − =
unit per onContributi
costsFixed
Contribution margin=
unit per priceSelling
unit per onContributi=
ratioP/VratioumeProfit/Vol
ratioC/Sratioon/SalesContributi
−
−

7/27/2019 Paper 2.4 - ATC International
http://slidepdf.com/reader/full/paper-24-atc-international 52/73
COSTS FOR DECISION MAKING
Accountancy Tuition Centre (Overseas Courses) Ltd 2001 0305
revenue)salesof in terms (expressed
pointeven-Break =
ratioP/Vor
ratioC/Sor
marginonContributi
costsFixed
C/S ratio = contribution/sales ratio
Also in Cost Volume Profit (CVP) analysis :
Required profit (in units)=
unit per onContributi
profitRequiredcostsFixed +
revenue)salesof in terms(expressed
profitRequired =
marginonContributi
profRequired+costFixed
2.3 Break-even chart
Costs/Rev(£)
Sales revenue
Fixed andvariable costs
Currentoutput
Output (units)
L O S S
P R O F
I T
Safetymargin
Break-even
point
Margin of safety
Safety margin = Expected sales – Break-even sales
As a percentage =Expected sales Break-even sales
Expected sales
−×100
This can be expressed in terms of units or sales revenue.

7/27/2019 Paper 2.4 - ATC International
http://slidepdf.com/reader/full/paper-24-atc-international 53/73
COSTS FOR DECISION MAKING
Accountancy Tuition Centre (Overseas Courses) Ltd 2001 0306
2.4 A contribution break-even chart
Costs/Rev(£) Sales revenue
Fixedcosts
Output (units)
Break-even point
L O S S
PROFIT
CONTRIBUTION
Total costs
Variable costs
2.5 Limitations of break-even analysis
! Assumes costs and revenues are linear (ie constant)
! Assumes all costs are either fixed or variable
! Assumes selling prices, variable cost per unit and fixed costs remain constant
! Cannot be used where more than one product is made and sold (unless the
sales mix is constant)
! Assumes all goods produced are sold (ie ignores changing stock levels).
2.6 Profit-volume (P/V) chart
Whilst break-even charts show details of costs and revenues, they do not illustrateeasily the sizes of profits and losses at different activity levels.
A P/V chart does show the net profit/(loss) at different activity levels.
Profit
Volume(sales units)
BEP
x y
Profit atvolume y
0
Loss atvolume x
£
Fixedcosts
!
The vertical axis shows the profit above and the loss below the horizontalsales axis

7/27/2019 Paper 2.4 - ATC International
http://slidepdf.com/reader/full/paper-24-atc-international 54/73
COSTS FOR DECISION MAKING
Accountancy Tuition Centre (Overseas Courses) Ltd 2001 0307
! When sales are zero, the loss is equal to the fixed costs
! If fixed costs and variable costs per unit are constant – then the P/V chart isrepresented by a straight line
! To draw a P/V chart – it is only necessary to know the profit/(loss) at onelevel of sales. Plot this point – then link it to fixed costs on the vertical axis – and draw a straight line through both points
! The slope of the line represents the contribution. The steeper the slope the
greater is the contribution per unit.
3 KEY FACTOR ANALYSIS
3.1 Method
Rule: Where resources are unlimited – make all those products which give“positive contribution”
Rule: Where a factor of production is limited – contribution (and profit ) will bemaximised by concentrating production on that product(s) which make(s)
“best use” of the scarce resource.
This is the product which gives the highest contribution per unit of key (limiting) factor
or resource, calculated as:
usedresourcescarceof Units
unit per onContributi
In order to decide which products to make, in order to maximise profit, where one of the factors of production is limited, the following approach should be undertaken:
(1) Calculate contribution per key factor for each product
(2) Rank the products according to the contribution per unit (CPU) of scarceresource calculated
(3) Concentrate production on those products with the highest CPU of scarceresource – until all of the scarce resource is used up
Example 2
Material I is restricted to 12,000 kg.
Product A B C
Contribution per unit 16 10 24 No of kg of I per unit 4 2 8
Required:
What is the maximum contribution which can be achieved?

7/27/2019 Paper 2.4 - ATC International
http://slidepdf.com/reader/full/paper-24-atc-international 55/73
COSTS FOR DECISION MAKING
Accountancy Tuition Centre (Overseas Courses) Ltd 2001 0308
Solution
Product A B C
Contribution per unit No of kg per unit
Contribution per kgRank
∴ Produce
Maximum contribution =
Example 3
Suppose in Example 2 above sales of B are restricted to 4,000 units.
Required:
What is the maximum contribution which can now be achieved?
Solution
kg 4,000 units of B uses up1,000 units of A uses up
———
———
∴ Maximum contribution £
From BFrom A
———
———
3.2 Limitations
! Assumes constant variable cost per unit and constant total fixed costs.
! Takes no account of loss of customer goodwill.
! Can deal with only one scarce resource.
! Applies only to situations where capacity constraints cannot be removed inthe short term.
7/27/2019 Paper 2.4 - ATC International
http://slidepdf.com/reader/full/paper-24-atc-international 56/73
COSTS FOR DECISION MAKING
Accountancy Tuition Centre (Overseas Courses) Ltd 2001 0309
4 MAKE OR BUY
4.1 Method
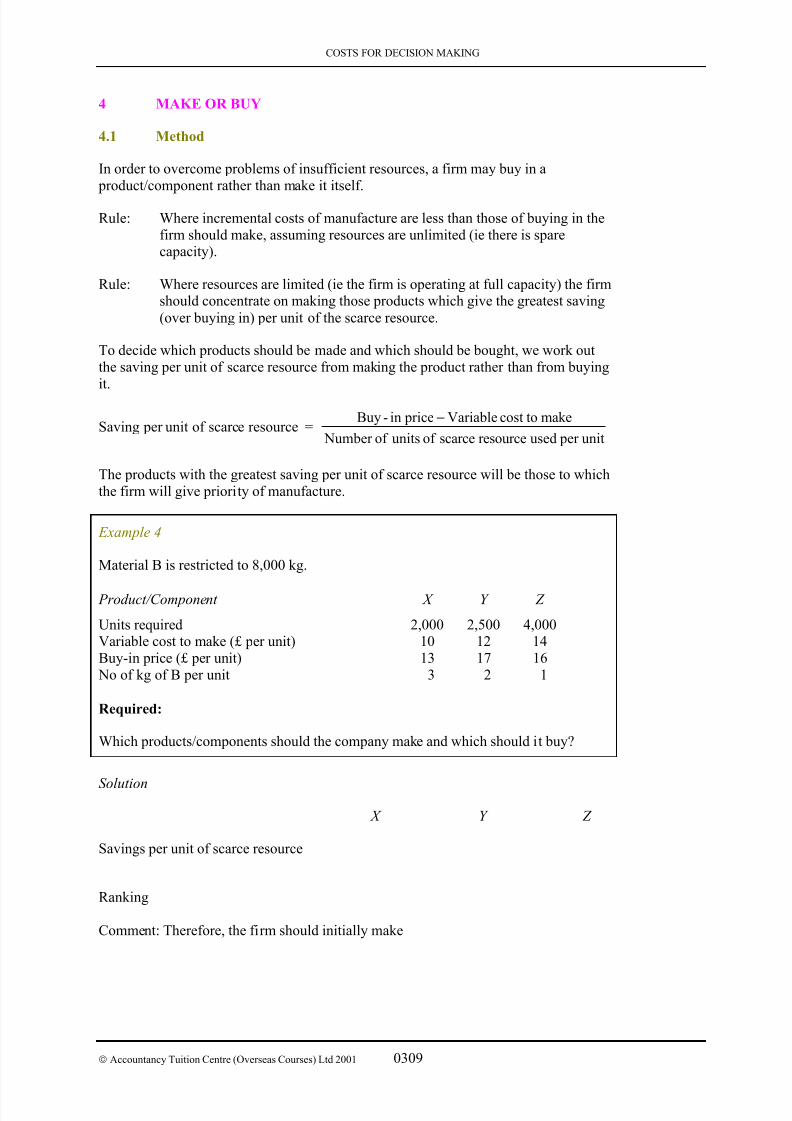
In order to overcome problems of insufficient resources, a firm may buy in a product/component rather than make it itself.
Rule: Where incremental costs of manufacture are less than those of buying in thefirm should make, assuming resources are unlimited (ie there is sparecapacity).
Rule: Where resources are limited (ie the firm is operating at full capacity) the firmshould concentrate on making those products which give the greatest saving
(over buying in) per unit of the scarce resource.
To decide which products should be made and which should be bought, we work outthe saving per unit of scarce resource from making the product rather than from buyingit.
Saving per unit of scarce resource =unit per usedresourcescarceof unitsof Number
makecost toVariable pricein-Buy −
The products with the greatest saving per unit of scarce resource will be those to whichthe firm will give priority of manufacture.
Example 4
Material B is restricted to 8,000 kg.
Product/Component X Y Z
Units required 2,000 2,500 4,000Variable cost to make (£ per unit) 10 12 14Buy-in price (£ per unit) 13 17 16 No of kg of B per unit 3 2 1
Required:
Which products/components should the company make and which should it buy?
Solution
X Y Z
Savings per unit of scarce resource
Ranking
Comment: Therefore, the firm should initially make
7/27/2019 Paper 2.4 - ATC International
http://slidepdf.com/reader/full/paper-24-atc-international 57/73
COSTS FOR DECISION MAKING
Accountancy Tuition Centre (Overseas Courses) Ltd 2001 0310
Utilisation of B
kg of B
Total B overall ––––– 8,000
–––––
Comment:
4.2 Limitations
! Assumes constant unit variable cost and constant total fixed costs.! Ignores qualitative factors (eg reliability of supplier).
Therefore any decision to buy in a product or component should only be taken after aconsideration of other factors such as:
! suitability of component to be bought-in when compared with owncomponent;
! quality of proposed supplier;
! reliability of proposed supplier;
! reaction of workforce or customers.
5 RELEVANT COSTS
5.1 Meaning
Only those costs which will be affected by a decision are relevant to the decision-making process. Therefore
! only future costs are relevant
! sunk costs or committed costs can be ignored; research already carried outwould be a sunk cost and rental payments already agreed would be a
committed cost
! only incremental costs (costs which will change as a result of the decision)
are relevant
! fixed costs which are unaffected are therefore irrelevant
! only cash costs are relevant; book values and historic costs can be ignored
! all opportunity costs are relevant; an opportunity cost is the value of a benefitsacrificed in favour of an alternative course of action, eg the contribution lost
if a key worker is moved to a new project is a relevant opportunity cost whenassessing that new project.

7/27/2019 Paper 2.4 - ATC International
http://slidepdf.com/reader/full/paper-24-atc-international 58/73
COSTS FOR DECISION MAKING
Accountancy Tuition Centre (Overseas Courses) Ltd 2001 0311
5.2 Difficulties in using opportunity costs
! Estimating future costs/revenues and hence the benefit sacrificed can bedifficult
! Identifying alternative uses and hence the best alternative forgone can bedifficult
! Ignores effect on accounting profit
! Ignores the risk of each alternative
5.3 Deprival value
! This measures the value to a business of an existing asset in terms of the cost
incurred if the business were to be deprived of it
! Deprival value is calculated as follows
RC = Replacement cost NRV = Net realisable valuePV = PV of expected future earnings which the asset will generate
The lower of
RC and The hi her of
NRV PV
Example 5
Identify the deprival value in each case.
Case RC NRV PV
1 500 600 550
2 700 600 550
3 700 600 650
Solution
1
2
3

7/27/2019 Paper 2.4 - ATC International
http://slidepdf.com/reader/full/paper-24-atc-international 59/73
COSTS FOR DECISION MAKING
Accountancy Tuition Centre (Overseas Courses) Ltd 2001 0312
FOCUS
You should now be able to
! describe and distinguish between relevant and non-relevant costs
! apply and evaluate limiting factor analysis
! evaluate short run decisions e.g. make or buy.
! describe and apply cost-volume-profit (breakeven) analysis

7/27/2019 Paper 2.4 - ATC International
http://slidepdf.com/reader/full/paper-24-atc-international 60/73
COSTS FOR DECISION MAKING
Accountancy Tuition Centre (Overseas Courses) Ltd 2001 0313
EXAMPLE SOLUTIONS
Solution 1 – BEA
Output 10,000 ———
£
20,000 ———
£
30,000 ———
£Sales
Variable costs
8,000
(6,000)
16,000
(12,000)
24,000
(18,000) ——— ——— ———
ContributionFixed costs
2,000(2,000)
4,000(2,000)
6,000(2,000)
Profit ———
0 ———
——— 2,000
———
——— 4,000
———
Solution 2 – KFA
Product A B C Contribution per unit
No of kg per unitContribution per kg
Rank
£16
4£4
2
£10
2£5
1
£24
8£3
3
∴ Produce2
000,12= 6,000 units of B
Maximum contribution = 6,000 × 10 = £60,000
Solution 3 – KFA
kg
4,000 units of B uses up 4,000 × 21,000 units of A uses up
8,0004,000
———
12,000 ———
∴ Maximum contribution £
From B 1,000 × £16
From A 4,000 × £10
16,00040,000
——— 56,000
———

7/27/2019 Paper 2.4 - ATC International
http://slidepdf.com/reader/full/paper-24-atc-international 61/73
COSTS FOR DECISION MAKING
Accountancy Tuition Centre (Overseas Courses) Ltd 2001 0314
Solution 4 – Make or buy
X Y Z
Savings per unit of scarce resource
3
1013−= 1
2
1217 −=
2.5 1
1416−= 2
Ranking z y x
Comment: Therefore, the firm should initially make Ys and then make as many Zs as possible.
Utilisation of B:
kg of B
2,500 Ys × 2 kg each uses3,000 Zs × 1 kg each uses
5,0003,000
Total B overall ––––– 8,000
–––––
Comment: The additional 1,000 Zs and 2,000 Xs required should be bought in.
Solution 5 – Deprival value
Case RC NRV PV
1 500 600 550
2 700 600 550
3 700 600 650

7/27/2019 Paper 2.4 - ATC International
http://slidepdf.com/reader/full/paper-24-atc-international 62/73
BUDGETARY CONTROL SYSTEMS
Accountancy Tuition Centre (Overseas Courses) Ltd 2001 0401
OVERVIEW
Objectives
! To understand the purpose of budgeting and to appreciate the variety of different methods of budgeting.
! To appreciate the behavioural as well as the accounting aspects of budgeting.
Activity levelBudget periodPrevious budgets
BUDGETPREPARATION
BUDGETARYSYSTEMS
ROLE OFBUDGETS
BEHAVIOURALASPECTS
Top down/bottom up MotivationResponsibility accounting Management by objectives Management stylesBudget politics
Budget processPrincipal budget factor Key budgetFunctional budgets
Objectives

7/27/2019 Paper 2.4 - ATC International
http://slidepdf.com/reader/full/paper-24-atc-international 63/73
BUDGETARY CONTROL SYSTEMS
Accountancy Tuition Centre (Overseas Courses) Ltd 2001 0402
1 ROLE OF BUDGETS
A budget is a quantitative statement, for a specified period of time, which may include
planned income and expenditure, assets, liabilities and cash flows.
1.1 Objectives of budgeting
Coordination Brings together the many different activities in theorganisation.
R esponsibility Assigns responsibility to individual for costs, profit, revenues,
investment etc.
Utilisation Ensures best use of scarce resources is made.
Motivation Motivates individuals to achieve the budget (links to
responsibility) .
Planning & control Budget is short-term version of long-term plan.
It ensures that in the short term the correct action is taken toensure that the long-term goals are achieved.
Actual versus budget comparison for control.
Evaluation Provides a “target” for performance evaluation.
Telling
Communicates plans and helps achieve goal congruence ie thestate which leads managers and staff to take actions which arein their self-interest and the entity’s best interest.

7/27/2019 Paper 2.4 - ATC International
http://slidepdf.com/reader/full/paper-24-atc-international 64/73
BUDGETARY CONTROL SYSTEMS
Accountancy Tuition Centre (Overseas Courses) Ltd 2001 0403
2 BUDGET PREPARATION
2.1 Budget process
Identify the objectives
of the business
Clarify the organisational
structure of the business
Identify the principal
bud et factor
Prepare theke bud et
Prepare the
functional bud ets
Budget officer produces master budget
includin rofit and loss account and balance sheet
Budgets approved
b the board
Budgets communicated to centre
mana ers res onsible for im lementation
Actual results measured, compared
with bud et and anal sis undertaken
Budget submitted to
bud et committee for a roval
Action taken
The budget officer manages the whole budget process. In larger organisations hewill issue a budget manual which details how the budgets of every division are to be
developed. This ensures that the budgets are drawn up using consistent assumptionsand bases.

7/27/2019 Paper 2.4 - ATC International
http://slidepdf.com/reader/full/paper-24-atc-international 65/73
BUDGETARY CONTROL SYSTEMS
Accountancy Tuition Centre (Overseas Courses) Ltd 2001 0404
2.2 Principal budget factor
! The activity level at which a business can operate will seldom beunlimited.
! Limitations may be imposed by:
# market demand for its products or services# number of skilled employees available# availability of material supplies# space available either as a working area or for the storage of goods# amount of cash or credit facilities available to finance the business.
! The most limiting factor which is of major importance (usually sales) iscalled the “principal budget factor”.
2.3 Key budget
This budget is produced by reference to this principal budget factor. Sales areuniquely difficult to predict because they are affected by factors outside the control
of a business such as:
! action of competitors! the state of the economy! the effectiveness of advertising.
2.4 Functional budget
Once the key budget has been prepared the functional budgets are then drafted.
! Production budget! Materials usage budget! Materials purchase budget! Labour budget! Overhead budget.
3 BUDGETARY SYSTEMS
Budgetary systems can be split into three categories, each of which is looking at aspecific budgetary problem. The categories can be defined by the following
questions:
(1) How should the budget respond to changes in activity level?
(2) How should the budget respond to changes that occur during the budgeted period?
(3) How much regard should be given to previous budgets in the setting of thecurrent budget?
Each of these will be considered in turn.

7/27/2019 Paper 2.4 - ATC International
http://slidepdf.com/reader/full/paper-24-atc-international 66/73
BUDGETARY CONTROL SYSTEMS
Accountancy Tuition Centre (Overseas Courses) Ltd 2001 0405
3.1 Changes in activity level
3.1.1 Fixed budgets
Prepared at the anticipated level of activity.
Budget will be compared with actual results with no adjustment made for anychanges in activity level.
Uses: Service industries where most costs are fixed (rather than manufacturingindustries where many costs are variable).
3.1.2 Flexible budgets
A budget which recognises different cost behaviour patterns and so changes with
volume of activity.
! Prepared at a number of different possible activity levels.
Uses: Activity levels chosen to take into account:
! stepped fixed costs
! non-constant variable costs per unit due to economies of scale, thelearning curve effect, bulk discounts, etc.
3.1.3 Flexed budgets
The budgeted cost (or revenue) attributed to an actual level of activity achieved.
! Initially prepared at the anticipated level of activity.
! Then figures are pro-rated to actual activity level before comparisons aremade.
Uses: Variance analysis. However, no account is taken of:
!
stepped fixed costs! variable costs per unit which are not constant.

7/27/2019 Paper 2.4 - ATC International
http://slidepdf.com/reader/full/paper-24-atc-international 67/73
BUDGETARY CONTROL SYSTEMS
Accountancy Tuition Centre (Overseas Courses) Ltd 2001 0406
3.2 Changes during budgeted period
3.2.1 Periodic budgets
Budget prepared for typically one year at a time.
! No alterations are made once the budget has been set.
Uses: Suitable for stable businesses where forecasting is easy and where tightcontrol is not necessary.
3.2.2 Rolling budgets
A budget kept continuously up to date by adding another accounting period (eg monthor quarter) when the earliest accounting period has expired.
Aim: To keep tight control and always have a budget for the next 12 months which is accurate.
Illustration
1 January 2001 prepare 12 months to 31 December 2001.
On 1 February 2001:
! compare actual with budget for January
! if budget was shown to be unrealistic, adjust the remaining 11 months (not
merely because we did not achieve the target)
! prepare the next month to 31 January 2002.
Uses: When accurate forecasts cannot be made. Also for any area or component which needs
tight control. Probably too time consuming for the whole business.
3.3 Reliance on previous budgets
3.3.1 Incremental budgeting
Start with either the previous period’s budget or the previous period’s actual results.
Add/subtract an incremental amount to cover inflation and other known changes.
Advantages:
! Quickest and easiest method.
! Assuming that the historic figures are acceptable, only the increment needs
to be justified.

7/27/2019 Paper 2.4 - ATC International
http://slidepdf.com/reader/full/paper-24-atc-international 68/73
BUDGETARY CONTROL SYSTEMS
Accountancy Tuition Centre (Overseas Courses) Ltd 2001 0407
Disadvantages:
! Builds in previous problems and inefficiencies.! Uneconomic activities may be continued.
Uses: Suitable for stable businesses where costs are not expected to changesignificantly. There should be good cost control and limited discretionary costs.
3.3.2 Zero-based budgeting (ZBB)
A budgeting method which requires each element of cost to be justified as though the
related activities were being undertaken for the first time. Without approval, the budget allowance is zero.
! Each activity is considered on its own merits, without any reference to the
previous period.
! A number of decision packages are prepared for each activity. Each
decision package considers the costs and benefits of operating an activityat a particular level.
! Each decision package will detail its:
# Function# Goal# Measure of performance# Level of funding needed# Consequence to the company of non-performance.
! Decision packages are evaluated. Those which are supported are rankedand compete for the resources available.
! Resources are allocated to activities in accordance with these rankings.
Advantages:
! Establishes minimum resource requirements! Establishes priorities! Produces a working plan that can be adjusted if resource availability changes! Makes managers think about what they are doing!
Identifies and removes inefficient operations! Avoids wasteful expenditure! More efficient allocation of costs.
Disadvantages:
! Time consuming and costly! Requires management training! Initial results may be disappointing! May emphasise short term at expense of long term! May be seen as threatening by managers.

7/27/2019 Paper 2.4 - ATC International
http://slidepdf.com/reader/full/paper-24-atc-international 69/73
BUDGETARY CONTROL SYSTEMS
Accountancy Tuition Centre (Overseas Courses) Ltd 2001 0408
3.3.3 Programme planning budgeting systems
A method developed specifically to deal with budgeting in the public sector.
Instead of budgets being set for each particular department, resources are allocatedto specific programmes of activity.
Departmental budgets are finally constructed by determining the contribution of each department to each programme, and therefore the proportion of each programme’s resources which should be allocated to each department.
This ensures that resources are allocated fairly and used efficiently.
4 BEHAVIOURAL ASPECTS
It is very easy for the budgetary process to cause dysfunctional activity. For example, if junior management believe that a budget imposed upon them isunattainable, their aim may well be to ensure that the budget is not achieved, thereby proving themselves to be correct.
This needs to be avoided, and therefore an understanding of the behavioural aspectsis necessary.
4.1 Participation
4.1.1 Top-down budgeting
A budget which is set without allowing the ultimate budget holder to have the
opportunity to participate in the budgeting process.
4.1.2 Bottom-up budgeting
Bottom-up budgeting – a system of budgeting in which budget holders have the
opportunity to participate in setting their own budgets.
4.1.3 Advantages of bottom-up
! Increased motivation!
Should contain better information, especially in a fast-moving or diverse business! Increases managers’ understanding and commitment! Better communication! Senior managers can concentrate on strategy.

7/27/2019 Paper 2.4 - ATC International
http://slidepdf.com/reader/full/paper-24-atc-international 70/73
BUDGETARY CONTROL SYSTEMS
Accountancy Tuition Centre (Overseas Courses) Ltd 2001 0409
4.1.4 Disadvantages of bottom-up
! Senior managers may resent loss of control
! Bad decisions from inexperienced managers
! Budgets may not be in line with corporate objectives
! Budget preparation is slower and disputes can arise
! Figures may be subject to bias if junior managers either try to impress or set easily achievable targets
! There may be pseudo participation
! Certain environments may preclude participation, eg sales manager may be faced with long-term contracts already agreed.
Whilst bottom-up is generally seen as preferable, there are situations where top-down is applicable. An example is an entrepreneurial business where only the
entrepreneur has sufficient knowledge to construct the budget. Furthermore, thenature of workers differs such that whilst some will react positively to a
participative approach, others may not.
4.2 Target setting and motivation
Targets will assist motivation and appraisal if they are at the right level.
! Not too difficult, as this will demotivate staff.! Not too easy, as managers are unlikely to strive for optimal performance.! An ideal target should be slightly above the anticipated performance level.
Degree of difficulty
Budget
Adverse
variance
Actual performance
Hard
Degree of budget difficultyEasy
Performance
level
Optimal
budget
Zerovariance

7/27/2019 Paper 2.4 - ATC International
http://slidepdf.com/reader/full/paper-24-atc-international 71/73
BUDGETARY CONTROL SYSTEMS
Accountancy Tuition Centre (Overseas Courses) Ltd 2001 0410
Implications of the above graph include the following:
! A budget set to maximise performance is likely to create an adversevariance. This will need to be managed carefully.
! If the budget has been set to maximise performance, then the central
management in their own planning must accept that it is unlikely to beachieved.
Targets should be:
! communicated in advance! dependent on factors controllable by the individual! based on quantifiable factors! linked to appropriate rewards and penalties! chosen carefully to ensure goal congruence.
4.3 Responsibility accounting
A system of accounting that segregates revenues and costs into areas of separate
responsibility which are then assigned to managers.
4.3.1 Key features
! May be cost, revenue, profit or investment centres! Managers must be aware of the basis on which they are evaluated! Managers should only be assessed on items substantially within their control! Managers “in the know” investigate and “cure” variances.
Care must be taken as it is quite possible for a manager to take action which will“improve” his performance, whilst at the same time harming the business as a whole.
For example, the purchasing manager who buys cheap raw materials will have savedmoney but potentially the cost in the production departments may be great.
4.4 Management by objectives (Mbo)
A system of management incorporating clearly established objectives at every levelof the organisation.
In Mbo there is less emphasis on monetary budgets and more emphasis on takingaction which helps the business to achieve its objectives.
4.4.1 Key features
! Subordinate writes a “management letter” setting out key objectives, howhe will achieve them and criteria for measuring performance
! Discussed and agreed with superior
! Starts with top management and moves down through organisation
! Individuals see how personal goals tie in with organisational goals.

7/27/2019 Paper 2.4 - ATC International
http://slidepdf.com/reader/full/paper-24-atc-international 72/73
BUDGETARY CONTROL SYSTEMS
Accountancy Tuition Centre (Overseas Courses) Ltd 2001 0411
4.5 Hopwood’s management styles
AG Hopwood identified three styles of using budget and actual cost information inthe evaluation of management performance, and he identified the following featuresassociated with each of the styles.
Involvementwith costs
Job-relatedtension
Manipulation
of data
Relationshipswith superiors
and colleagues
Features
Budget-constrained
! Evaluate on ability
to achieve budget
Profit-conscious
! Evaluate on theability to improveoverall effectivenessof area especiallywith respect to
long-term goals
Non-accounting
! Accounting data plays little part
in performance
evaluation
Hi h
Hi h
Extensive
Poor
Hi h
Medium
Little
Good
Low
Medium
Little
Good
St le
Use of the budget-constrained style generally led to the worst performance bymanagers.
4.6 Budget politics
! Budgeting is a “political” process. Conflicts must be expected due to themultiple objectives of the organisation and the personal objectives of participants.
! Bargaining strategies from budget holders include:
# Budget padding (building in additional cost and, sometimes,revenues)
# Offering to cut “vital” services such as health and safety
# Alliance building with other managers in order to present aunited front to the senior management
# Year-end “spend-ups” to prove the total budget was required
# “Spend now or pay later” arguments
! Accountants in turn often ignore objectives and use “funds available” toforce issues.

7/27/2019 Paper 2.4 - ATC International
http://slidepdf.com/reader/full/paper-24-atc-international 73/73
BUDGETARY CONTROL SYSTEMS
FOCUS
You should now be able to
! identify the purposes of budgetary planning and control systems
! describe the planning and control cycle, and the control process
! prepare, review and explain a budget preparation timetable
! explain the process of participation in budget setting and how this canaddress motivational problems
! describe and evaluate the main features of zero based budgeting systems
! describe and evaluate incremental budgeting and discuss the differenceswith zero based budgeting
! describe and evaluate periodic and continuous budgeting (rolling) systems