panoramic ecg display versus conventional ecg: ischaemia detection by critical care nurses
TRANSCRIPT

RESEARCH
doi: 10.1111/j.1478-5153.2012.00492.x
Panoramic ECG display versusconventional ECG: ischaemiadetection by critical care nursesNick Wilson, Aimen Hassani, Vanessa Gibson, Timothy Lightfoot and Claudio Zizzo
ABSTRACTAim: To compare accuracy and certainty of diagnosis of cardiac ischaemia using the Panoramic ECG display tool plus conventional 12-leadelectrocardiogram (ECG) versus 12-lead ECG alone by UK critical care nurses who were members of the British Association of Critical CareNurses (BACCN).Background: Critically ill patients are prone to myocardial ischaemia. Symptoms may be masked by sedation or analgesia, and ECG changesmay be the only sign. Critical care nurses have an essential role in detecting ECG changes promptly. Despite this, critical care nurses may lackexpertise in interpreting ECGs and myocardial ischaemia often goes undetected by critical care staff.Method: British Association of Critical Care Nurses (BACCN) members were invited to complete an online survey to evaluate the analysis oftwo sets of eight ECGs displayed alone and with the new display device.Results: Data from 82 participants showed diagnostic accuracy improved from 67·1% reading ECG traces alone, to 96·0% reading ECGplus Panoramic ECG display tool (P < 0·01, significance level α = 0·05). Participants’ diagnostic certainty score rose from 41·7% reading ECGalone to 66·8% reading ECG plus Panoramic ECG display tool (P < 0·01, α = 0·05).Conclusion: The Panoramic ECG display tool improves both accuracy and certainty of detecting ST segment changes among critical carenurses, when compared to conventional 12-lead ECG alone. This benefit was greatest with early ischaemic changes. Critical care nurses whoare least confident in reading conventional ECGs benefit the most from the new display.Relevance to clinical practice: Critical care nurses have an essential role in the monitoring of critically ill patients. However, nurses donot always have the expertise to detect subtle ischaemic ECG changes promptly. Introduction of the Panoramic ECG display tool into clinicalpractice could lead to patients receiving treatment for myocardial ischaemia sooner with the potential for reduction in morbidity and mortality.
Key words: Coronary care nursing • Electrocardiograms • High dependency care • Intensive care • Monitoring • Myocardial infarction
Authors: Dr N Wilson, FRCA, MBBS, BSc (Intercal), Honorary SeniorClinical Fellow, Postgraduate Medical Institute, Anglia Ruskin University,Chelmsford Campus, Chelmsford CM1 1SQ, UK; Dr A Hassani, FRCA,MBChB, Director of Research in Medical Devices and Technologies, Facultyof Science and Technology, Postgraduate Medical Institute, Anglia RuskinUniversity, Chelmsford Campus, Chelmsford CM1 1SQ, UK; V Gibson,RGN, RNT, PG Dip Health and Social Research, MSc Health Sciences(Research Methods) Ad. Dip Health Sciences Information and ManagementTechnology, Fellow Higher Education Academy, Teaching Fellow andPrincipal Lecturer Critical Care, Post Qualifying and Postgraduate Studies,Northumbria University, School of Health Community and EducationStudies, Benton, Newcastle NE7 7XA, UK, Professional Advisor, BritishAssociation of Critical Care Nurses, National Board, Newcastle Upon Tyne,UK; T Lightfoot, FRCA, MBBS, BMedSci, Postgraduate Medical Institute,Anglia Ruskin University, Chelmsford Campus, Chelmsford CM1 1SQ, UK;Emeritus Professor C Zizzo, Emeritus Professor Anglia Ruskin University,Visiting Professor Loughborough University, Clinical Research Scientist MidEssex Hospitals Trust, Doctorate Degree (Italy) in Electronic Engineering,Postgraduate Medical Institute, Anglia Ruskin University, ChelmsfordCampus, Chelmsford CM1 1SQ, UKAddress for correspondence: A Hassani, Faculty of Science andTechnology, Postgraduate Medical Institute, Anglia Ruskin University,Chelmsford Campus, Bishop Hall Lane, Chelmsford CM1 1SQ, UKE-mail: [email protected]
INTRODUCTIONThis article provides an overview of an online surveywhich was undertaken to investigate whether a newmethod of displaying electrocardiogram (ECG) infor-mation can improve diagnostic accuracy and certaintyin critical care nurses. The Panoramic ECG display toolis a new, patented technology that presents the infor-mation from a 12-lead ECG as coloured areas on animage of a heart on a computer monitor (Figure 1). Thecolours on the image of the heart change from greenshowing a healthy region of myocardium to red or blueshowing areas of ST segment elevation or depression.This takes place in real time for rapid diagnosis and toenable the response to treatment to be clearly seen. Atthe time of writing this article, the device was a work-ing prototype, running on a laptop, but the programcould be used in all devices that are currently usedto display 12-lead ECGs. It could therefore be used atall points in a patient’s journey, from prehospital carethrough A&E, critical care, coronary care or theatres.
© 2012 The Authors. Nursing in Critical Care © 2012 British Association of Critical Care Nurses 1

Panoramic ECG display versus conventional ECG
Figure 1 Example images from the panoramic electrocardiogram (ECG) display tool.
BACKGROUNDCritical care patients have often been described asthe sickest patients in the hospital with, by definition,one or more organ system failures and will requirecontinuous ECG monitoring (Intensive Care Society,2009). Patients who are critically ill are under a greatdeal of physiological stress with myocardial infarctionoccurring in as many as 37% of the patient popula-tion (Lim et al., 2006a; Lim et al., 2006b). Critical carepatients on ventilatory support who suffer myocardialinfarction are ventilated longer, have a longer intensivecare unit (ICU) stay and a higher mortality (Lim et al.,2008; Hurford and Favorito 1995). In addition, myocar-dial ischaemia can cause weaning failure, but it oftengoes undetected (Randles et al., 2004). This has majorimplications for critically ill patients regarding lengthof time on mechanical ventilation and the resultantcomplications.
Despite the significance of myocardial infarction inthis patient group and the fact that these patientsare being continuously monitored, traditional ECGinterpretation looking for the presence of myocardialischaemia is difficult with only moderate reliability atbest (Lim et al., 2006a; Lim et al., 2008). This is furthercompounded in this patient group by chest pain beingmasked by unconsciousness, analgesia or sedation(Patton and Funk 2001). The diagnosis may be missed
altogether on a number of occasions, particularlyin patients with sepsis, where the correct diagnosisof myocardial infarction is lower than 50% withother individual physiological markers often beingmasked by their sustained abnormal physiology (Berlotet al., 2010). Recent work in this area has focused on theuse of biomarkers to detect myocardial infarction, inparticular troponin I (Lim et al., 2006b; Lim et al., 2008).However, regular screening for these biomarkers isboth invasive and expensive and has a long time delayfrom initiation of the test to receiving a result. Thisis clearly undesirable as delays in treatment result inpoorer outcomes (Vincent et al., 2002). Repeated bloodsampling has also been shown to lower critical carepatients’ haemoglobin (De Luca et al., 2004). Patientsin this group are also more likely to have concurrentconditions known to cause small rises in troponins andcause equivocal results (Lim et al., 2006b; Krenn andDelle Karth 2010).
The American Heart Association (AHA) has pub-lished a consensus statement on electrocardiographicmonitoring, endorsed by the International Society ofComputerized Electrocardiology and the AmericanAssociation of Critical Care Nurses (Drew et al., 2004).They considered that advances in automated ST seg-ment analysis were hampered by lack of physicianinterest and a high number of false ST alarms and
2 © 2012 The Authors. Nursing in Critical Care © 2012 British Association of Critical Care Nurses

Panoramic ECG display versus conventional ECG
lack of education about how to use the technologyand what to do in response to ST alarms (Patton andFunk, 2001). The AHA concluded that even in hospitalswith ST-monitoring capability, ischaemia monitoringis vastly underutilized by health care professionals.Drew et al., (2004) also suggest that there is a short-age of nurses who are specifically trained in ECGinterpretation.
The Panoramic ECG display tool is a new methodof interpreting and displaying continuous 12-leadECG data. It displays acute changes in real time ona graphical representation of the heart, with colourcoding to represent areas of acute ischaemia over theanatomically relevant areas of myocardium (Figure 1).This display is designed to be intuitive and eye-catching and can be viewed with or without raw ECGdata. Previous research has shown favourable resultsin increasing diagnostic proficiency and certainty inparamedics and resident hospital doctors, and a smallprevious sample of critical care nurses (Hassani et al.,2007; Al-Hassani et al., 2007).
METHODSMembers of the British Association of Critical CareNurses (BACCN) were sent an invitation to participatein an online questionnaire. One thousand eighthundred and twenty-four potential participants wereidentified by the BACCN from their database andwere invited to take part via an e-mail explaining thepurpose of the study. A link from the e-mail directedthem to the questionnaire. Potential participantswere sent a reminder e-mail approximately 1 monthafter the initial e-mail to further encourage them totake part. Completion of the questionnaire impliedconsent to take part in the study and the participantinformation sheet was sent as an attachment to both theinvitation and reminder e-mails. Local Research EthicsCommittee approval was granted before commencingthe study.
The research team designed the questionnaire and itwas hosted on the internet by a commercial internet-based questionnaire provider (www.surveymonkey.com, Palo Alto, CA, USA). Cochrane et al., (2009) reporton the growing popularity of web-based surveys andsuggest they provide a credible option for conductingscientific research. The questionnaire in this onlinesurvey was developed by members of the researchteam and is a development of a questionnaire usedin their previous published research with juniordoctors (Zizzo et al., 2008). The initial part of thequestionnaire captures demographic data about theparticipant and asks the participant to rate theirsubjective proficiency at ECG interpretation. Eight
ECGs are then presented and the participant wasasked to rank each as ‘normal’ or ‘abnormal with signsof myocardial ischaemia’. The correct interpretationof each ECG was decided by unanimous agreementof Dr Delphine Turner, Consultant Cardiologistand Dr Aimen Hassani, Consultant Anaesthetist(Broomfield Hospital, Chelmsford, UK). The criteriaused for diagnosis are in keeping with the currentinternationally agreed criteria (Thygesen et al., 2007).The same ECGs are then presented alongside thePanoramic ECG display images and the participantis again asked to rank each as ‘normal’ or ‘abnormalwith signs of myocardial ischaemia’.
Each participant was asked to enter the same e-mail address to which the invitation to participatewas sent. The time of completion of the questionnairewas recorded automatically by the service providerand the more recent of any duplicate entries fromthe same e-mail address were excluded. The listof those invited to participate was checked againstthe submitted e-mail addresses and all data relatingto any unverifiable addresses were erased from thedataset, thus excluding any uninvited participation bymembers of the public finding the questionnaire on theinternet. After deletion of duplicate and unverifiableentries all e-mail addresses were permanently erasedfrom the dataset prior to analysis. After this point, anyparticular data was not traceable back to any individualparticipant. Data were automatically recorded by thesoftware for analysis by the research team. A set ofbackground data on each participant was collected,comprising area of work (ICU/Coronary Care Unit,etc.), number of years of critical care experience,number of hours of formal ECG training they hadreceived in the last year and subjective confidence ininterpreting ECGs (Table 1).
Participants were shown a set of eight ECGsin Phase 1 of the assessment. Unbeknown to theparticipant three of these were normal (no ischaemicchanges) and five showed ST segment elevation ordepression. Participants were asked to mark each as‘normal’ or as ‘abnormal with signs of acute ischaemia’by selecting the appropriate choice in the onlinequestionnaire. After each ECG, participants were askedto indicate their level of certainty in their diagnosis ona five point scale (low, average, moderate, high andvery high). This score was labelled the ‘DiagnosticCertainty Score’ (Hassani et al., 2007; Al-Hassani et al.,2007).
Phase 2 of the assessment commenced with a briefoverview of the method of display of the PanoramicECG display tool. A further eight ECGs followed,presented alongside the corresponding images fromthe Panoramic ECG display tool. The participants were
© 2012 The Authors. Nursing in Critical Care © 2012 British Association of Critical Care Nurses 3

Panoramic ECG display versus conventional ECG
again asked to answer the same questions on whetherthe ECGs were normal or abnormal and their degree ofcertainty in their diagnosis. Although not made explicitto the participant during the questionnaire, these ECGswere actually the same as the first eight presented. Inthis way, each participant acted as his/her own controlto compare accuracy and certainty of diagnosis with orwithout the new monitoring aid.
RESULTSData were presented automatically by the onlinesurvey provider in Microsoft Office Excel (MicrosoftCorporation, Redmond, USA) spreadsheet format.Parametric and non-parametric data analysis wasperformed using SPSS 13·0 statistical analysis program(2009 SPSS Inc., Chicago, IL, USA) wherever P-valueswere required. A P-value of less than 0·05 wasconsidered statistically significant.
From the total of 1824 members that qualified for thestudy, there were a total of 118 entries to the survey (aresponse rate of 6·5%). Twenty-four incomplete entriesand the latter entry of three duplicate entries wereexcluded. Following this, 91 entries remained of which82 were verified by the BACCN and were included inthe final analysis (a verifiable entry response rate of4·5%). Demographic details and levels of experienceof these individuals are shown in Table 1. Mostrespondents work predominantly in General intensivetherapy unit (ITU) or high dependency unit (HDU)(50 participants) and most participants have workedin a critical care environment for more than 10 years(55 participants). Participants indicated a wide rangeof number of hours spent in formal ECG training(mode 4–6 h, interquartile range ‘2–4 h’ to ‘more than
8 h’). Most (68) had not received any formal trainingin the year prior to the study. The mode subjectiveranking of confidence in correctly interpreting signsof myocardial ischaemia on ECGs was ‘average’(29 participants).
The three normal ECGs and correspondingPanoramic ECG tool displays were labelled ‘a–c’,and the five ischaemic ECGs and displays labelled‘d–h’, for the purpose of data analysis. The percentageaccuracy in determining the correct diagnosis (normalor ischaemic) of each participant was calculated. Themean of all participants’ percentage accuracy scoresfor each of the normal ECGs (a–c) and the ischaemicECGs (d–h) in both Phase 1 and Phase 2 of the assess-ment are presented in Table 2. To calculate certainty indiagnosis, when participants indicated a low, average,moderate, high or very high certainty, we assigned ascore of 0%, 25%, 50%, 75% and 100%, respectively.The mean score of all participants reading each ECGwas calculated and for ease of reference this scorewas labelled the ‘Diagnostic Certainty Score’ (Hassaniet al., 2007; Al-Hassani et al., 2007). Scores for individ-ual ECGs in both Phases of the assessment are shownin Table 3. The accuracy and certainty means of partici-pants while reading conventional ECG alone comparedto ECG aided by the new Panoramic ECG displaytool was compared using Wilcoxon matched-pairssigned-ranks tests. Table 4 shows the mean accuracyand diagnostic certainty scores for the participants inPhase 1 and Phase 2 of the assessment and the P-valuesfor comparing these results. Data are presentedfor normal ECGs (a–c), abnormal ECGs (d–h) andall ECGs.
When using the Panoramic ECG display tool asignificant improvement in the mean accuracy and
Table 1 Demographic details and levels of experience of study participants
In which area do you do‘most’ of your work?(Please pick the optionthat best fits your practice)(number of participants)
How many years have youworked in a critical careenvironment?(number of participants)
Approximately how manyhours of formal ECGtraining have you had overthe course of your career?(number of participants)
Has any of this trainingbeen in the last year?(number of participants)
How confident do you feel aboutcorrectly interpreting signs ofmyocardial ischaemia (ST elevationor depression) on ECGs?(number of participants)
A&E 1 Less than 1 year 1 Less than 2 h 15 Yes 14 Low (I am not very good with ECGs) 18Cardiac ITU/HDU 8 1–2 years 2Coronary care 3 2–3 years 4 2–4 h 14 Moderate 15Education/research 8 3–4 years 3General ITU/HDU 50 4–5 years 6 4–6 h 15 Average 29Management 1 5–10 years 11 No 68Neuro ITU 2 10–15 years 25 6–8 h 7 High 17Outreach 3 15–20 years 16Paediatric ITU 1 More than 20 years 14 More than 8 h 31 Very high (I am very good with ECGs) 3Other 5
ECG, electrocardiogram.
4 © 2012 The Authors. Nursing in Critical Care © 2012 British Association of Critical Care Nurses

Panoramic ECG display versus conventional ECG
Table 2 Mean of all participants’ percentage accuracy scores
Normal ECG Ischaemic ECG
ECG a(0 mm)
ECG b(0 mm)
ECG c(0 mm)
ECG d (+1 mmV5, V6)
ECG e (+1 mmI, aVL)
ECG f (+2 mmII, III, aVF)
ECG g (−1 mmV5, V6)
ECG h (−2 mmV5, V6)
Accuracy (%) Phase 1 conventionalECG alone
74·4 75·6 65·7 52·4 40·2 96·3 47·6 84.1
Phase 2 conventionalECG plus panoramicECG display tool
98·8 96·3 93·9 95·1 91·5 98·8 93·9 100
ECG, electrocardiogram.
Table 3 Mean diagnostic certainty score for all participants
Normal ECG Ischaemic ECG
ECG a (0 mm)ECG b(0 mm)
ECG c(0 mm)
ECG d(+1 mmV5, V6)
ECG e(+1 mm I,
aVL)
ECG f(+2 mm II,
III, aVF)
ECG g(−1 mmV5, V6)
ECG h(−2 mmV5, V6)
Diagnostic certaintyscore (%)
Phase 1 conventionalECG alone
45·4 39·6 37·2 35·1 35·7 61·0 33·8 45·4
Phase 2 conventionalECG plus panoramicECG display tool
61·3 58·2 70·1 65·6 59·5 82·9 61·3 75·3
ECG, electrocardiogram.
Table 4 Mean percentage accuracy and diagnostic certainty scores for the participants
Phase 1 conventionalECG alone
Phase 2 conventional ECG pluspanoramic ECG display tool P-value
Normal ECG (ECGs a–c) Accuracy (%) 72·0 96·3 <0·01Diagnostic certainty score (%) 40·8 63·2 <0·01
Ischaemic ECG (ECGs d–h) Accuracy (%) 64·2 95·9 <0·01Diagnostic certainty score (%) 42·2 68·9 <0·01
All ECGs Accuracy (%) 67·1 96·0 <0·01Diagnostic certainty score (%) 41·7 66·8 <0·01
ECG, electrocardiogram.
diagnostic certainty scores was demonstrated forboth normal and ischaemic ECGs. When reading thethree normal ECGs there was a significant differencebetween the mean accuracy of 72·0% in Phase 1(ECG alone) and 96·3% in Phase 2 (ECG plusPanoramic display tool images) (P < 0·01) while themean diagnostic certainty scores were 40·8% and 63·2%for Phases 1 and 2, respectively (P < 0·01). The meanaccuracy for reading all five ischaemic ECG’s in Phase1 was 64·2% and in Phase 2 was 95·9% (P < 0·01).The mean diagnostic certainty score for reading theseECGs was 42·2% in Phase 1 and 68·9% in Phase 2(P < 0·01).
The degree of correlation between variableswas assessed using the Pearson product moment
correlation coefficient, r. Pearson correlations are usedto demonstrate the linear dependence between vari-ables. The variables in this case were accuracy ofdiagnosis of myocardial ischaemia using conventionalECG alone, accuracy of diagnosis using conventionalECG plus Panoramic ECG display tool, improvementseen by using the Panoramic ECG display tool (definedas the difference between the accuracy score usingthe Panoramic ECG tool minus the accuracy scoreusing conventional ECG), subjective confidence atreading ECGs and years of experience (time in service).A strong negative correlation (r = −0·86) was demon-strated between subjective assessment of accuracy inreading ECGs and improvement in measured accuracywhen using the Panoramic ECG display tool.
© 2012 The Authors. Nursing in Critical Care © 2012 British Association of Critical Care Nurses 5
Panoramic ECG display versus conventional ECG
Table 5 Diagnostic accuracy and certainty scores across different health care professions
1 ischaemic ECG, 120doctors (Berger et al.,
2005)5 ischaemic ECGs, 50 doctors
(Al-Hassani et al., 2007)
5 ischaemic ECGs, 240 paramedicsand student paramedics (Hassani
et al. (In press))
5 ischaemic ECGs, 82 experiencedcritical care nurses (Hassani et al. (this
study))
ConventionalECG alone
ConventionalECG alone
Conventional ECGplus panoramic ECG
display toolConventional
ECG alone
Conventional ECGplus panoramic ECG
display toolConventional
ECG alone
Conventional ECGplus panoramic ECG
display tool
Accuracy (%) 65 50 100 64·8 96 64·2 95·9Certainty (%) 79 65 80 57·5 76·4 42·2 68·9
ECG, electrocardiogram.
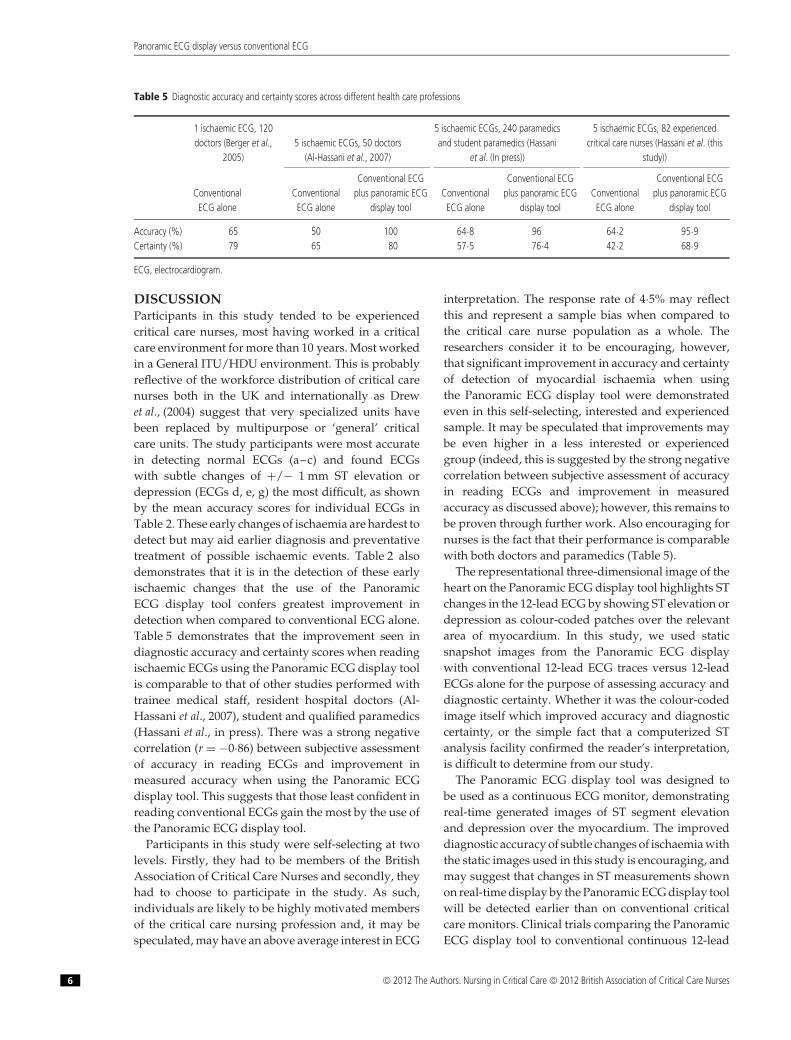
DISCUSSIONParticipants in this study tended to be experiencedcritical care nurses, most having worked in a criticalcare environment for more than 10 years. Most workedin a General ITU/HDU environment. This is probablyreflective of the workforce distribution of critical carenurses both in the UK and internationally as Drewet al., (2004) suggest that very specialized units havebeen replaced by multipurpose or ‘general’ criticalcare units. The study participants were most accuratein detecting normal ECGs (a–c) and found ECGswith subtle changes of +/− 1 mm ST elevation ordepression (ECGs d, e, g) the most difficult, as shownby the mean accuracy scores for individual ECGs inTable 2. These early changes of ischaemia are hardest todetect but may aid earlier diagnosis and preventativetreatment of possible ischaemic events. Table 2 alsodemonstrates that it is in the detection of these earlyischaemic changes that the use of the PanoramicECG display tool confers greatest improvement indetection when compared to conventional ECG alone.Table 5 demonstrates that the improvement seen indiagnostic accuracy and certainty scores when readingischaemic ECGs using the Panoramic ECG display toolis comparable to that of other studies performed withtrainee medical staff, resident hospital doctors (Al-Hassani et al., 2007), student and qualified paramedics(Hassani et al., in press). There was a strong negativecorrelation (r = −0·86) between subjective assessmentof accuracy in reading ECGs and improvement inmeasured accuracy when using the Panoramic ECGdisplay tool. This suggests that those least confident inreading conventional ECGs gain the most by the use ofthe Panoramic ECG display tool.
Participants in this study were self-selecting at twolevels. Firstly, they had to be members of the BritishAssociation of Critical Care Nurses and secondly, theyhad to choose to participate in the study. As such,individuals are likely to be highly motivated membersof the critical care nursing profession and, it may bespeculated, may have an above average interest in ECG
interpretation. The response rate of 4·5% may reflectthis and represent a sample bias when compared tothe critical care nurse population as a whole. Theresearchers consider it to be encouraging, however,that significant improvement in accuracy and certaintyof detection of myocardial ischaemia when usingthe Panoramic ECG display tool were demonstratedeven in this self-selecting, interested and experiencedsample. It may be speculated that improvements maybe even higher in a less interested or experiencedgroup (indeed, this is suggested by the strong negativecorrelation between subjective assessment of accuracyin reading ECGs and improvement in measuredaccuracy as discussed above); however, this remains tobe proven through further work. Also encouraging fornurses is the fact that their performance is comparablewith both doctors and paramedics (Table 5).
The representational three-dimensional image of theheart on the Panoramic ECG display tool highlights STchanges in the 12-lead ECG by showing ST elevation ordepression as colour-coded patches over the relevantarea of myocardium. In this study, we used staticsnapshot images from the Panoramic ECG displaywith conventional 12-lead ECG traces versus 12-leadECGs alone for the purpose of assessing accuracy anddiagnostic certainty. Whether it was the colour-codedimage itself which improved accuracy and diagnosticcertainty, or the simple fact that a computerized STanalysis facility confirmed the reader’s interpretation,is difficult to determine from our study.
The Panoramic ECG display tool was designed tobe used as a continuous ECG monitor, demonstratingreal-time generated images of ST segment elevationand depression over the myocardium. The improveddiagnostic accuracy of subtle changes of ischaemia withthe static images used in this study is encouraging, andmay suggest that changes in ST measurements shownon real-time display by the Panoramic ECG display toolwill be detected earlier than on conventional criticalcare monitors. Clinical trials comparing the PanoramicECG display tool to conventional continuous 12-lead
6 © 2012 The Authors. Nursing in Critical Care © 2012 British Association of Critical Care Nurses

Panoramic ECG display versus conventional ECG
ECG monitoring on patients with symptoms ofmyocardial ischaemia are the next step to determineits future role in earlier detection and treatment ofpatients with myocardial ischaemia.
LIMITATIONSA major limitation of this online survey was theresponse rate. Polit and Beck (2008) state that the useof questionnaires are a common method of collectingdata using a survey method. However, questionnaireresponse rates have notoriously remained problem-atic (Oppenheim 1992). The internet offers researchersthe capacity to collect survey data speedily and inex-pensively. In addition web-based survey softwareoptions aid the process of questionnaire design anddata management (Cochrane et al., 2009). Despite theseadvantages online surveys do not guarantee improvedresponse rates. Kaplowitz et al., (2004) found thatonline surveys achieved a comparable response rateto a mail hard copy questionnaire when both were pre-ceded by an advance mail notification. The responserate in this online survey was low despite the e-mailrequesting participation coming from a professionalbody of which the recipient was a member. In addi-tion, a news item was placed in the BACCN’s electronicnewsletter to try to encourage participation. The lowresponse rate in this survey may be for many rea-sons but a possible explanation is e-mail fatigue. Asdiscussed earlier the participants were self-selectingand presumably responded because of their interestin ECGs. Another potential limitation is the heteroge-neous nature of the sample with nurses working in avariety of clinical departments. Despite the variety ofclinical departments, the participants were all members
of the BACCN and demonstrate the umbrella term of‘critical care’. The variety of clinical departments inwhich the nurses work may explain their differences inECG training and abilities to interpret them. Similarlythere was a wide range of experience and ECG training.Future work should consider tighter inclusion criteriaand target a larger potential sample.
CONCLUSIONThe Panoramic ECG display tool improves both theaccuracy and the certainty of detecting ST segmentchanges among critical care nurses when they arepresented with static 12-lead ECG images. This benefitseemed to be greatest when detecting early ischaemicECG changes. Additionally, critical care nurses whowere least confident in reading conventional ECGsstated they benefited more from the use of the newdisplay. Future research will focus on comparing real-time images from the Panoramic ECG display toolto conventional continuous 12-lead ECG monitoringon patients with symptoms of myocardial ischaemia.If similar improvements in accuracy and certainty ofdiagnosis are found, in the future the display could beincorporated into the routine monitoring equipmentused in critical care environments.
ACKNOWLEDGEMENTSThis study was funded directly by investigators withno conflicting interest in the Panoramic ECG displaytool, its marketing or sale. We thank Vicky Quinn,Membership Administrator, British Association ofCritical Care Nurses for her invaluable administrativesupport.
WHAT IS KNOWN ABOUT THIS TOPIC
• A considerable amount of critical care nurses’ time is taken up by monitoring patients and responding to physiological changes.• Critical care nurses do not always have the expertise to recognize ECG changes and may have had very little formal training.• Ischaemic changes on a conventional ECG may be subtle and diagnosis might be delayed or missed.
WHAT THIS PAPER ADDS
• This paper is original research into the use of ground breaking technology that provides critical care nurses with a tool to enable them todetect ischaemic changes sooner.
• Static images from the Panoramic ECG display tool improve diagnostic accuracy and certainty in detection of myocardial ischaemia whencompared to conventional ECG alone.
• Further research will focus on comparing real-time images from the Panoramic ECG display tool to conventional continuous 12-lead ECGmonitoring on patients with symptoms of myocardial ischaemia. If similar improvements in accuracy and certainty of diagnosis are found,in the future the display could be incorporated into the routine monitoring equipment used in critical care environments.
© 2012 The Authors. Nursing in Critical Care © 2012 British Association of Critical Care Nurses 7

Panoramic ECG display versus conventional ECG
REFERENCESAl-Hassani A, Zizzo C, Turner D. (2007). Interim results of a study
to evaluate the effectiveness of a new electrocardiography(ECG) monitor in helping doctors improve their diagnosticproficiency and certainty in detecting acute ischaemia.European Journal of Anaesthesiology; 24 (Suppl. 39): 21–22.
Berger JS, Eisen L, Nozad V, D’Angelo J, Calderon Y, BrownDL, Schweitzer P. (2005). Competency in electrocardiograminterpretation among internal medicine and emergencymedicine residents. American Journal of Medicine; 118: 873–880.
Berlot G, Vergolini A, Calderan C, Bussani R, Torelli L, Lucan-gelo U. (2010). Acute myocardial infarction in non-cardiaccritically ill patients: a clinical-pathological study. MonaldiArchives for Chest Disease; 74: 164–171.
Cochrane D, Palmer J, Tolmie E, Allan D, Currie K. (2009).Formulating a web-based educational needs assessmentquestionnaire from healthcare competencies. Nurse Researcher;16: 64–75.
De Luca G, Suryapranata H, Ottervanger JP. (2004). Time delayand mortality in primary angioplasty for acute myocardialinfarction. Circulation; 109: 1223–1225.
Drew J, Califf R, Funk M, Kaufman E, Krucoff M, Laks M,Macfarlane P, Sommargren C, Swiryn S, Van Hare G. (2004).Practice standards for electrocardiographic monitoring inhospital settings: an American Heart Association ScientificStatement from the Councils on Cardiovascular Nursing,Clinical Cardiology, and Cardiovascular Disease in the young:endorsed by the International Society of ComputerizedElectrocardiology and the American Association of CriticalCare Nurses. Circulation; 110: 2721–2746.
Hassani A, Zizzo C, Turner D, Spoors C, Sherratt K. (2007).Improving the proficiency and certainty of critical care. Nursesin making accurate detection of acute myocardial ischaeis.Intensive Care Medicine; 33 (Suppl. 2): S203.
Hassani A, Wilson N, Woollard M, Lightfoot T, Zizzo C. ECGalone versus the Panorama, ECG tool: an online study of theaccuracy and diagnostic certainty of ECG interpretation byqualified and student paramedics. (In press).
Hurford WE, Favorito F. (1995). Association of myocardialischemia with failure to wean from mechanical ventilation.Critical Care Medicine; 23: 1475–1480.
Intensive Care Society. (2009). Levels of Critical Care for AdultPatients. London: ICS Standards.
Kaplowitz MD, Hadlock TD, Levine R. (2004). A comparison ofweb and mail survey response rates. Public Opinion Quarterly;68: 94–101.
Krenn L, Delle Karth G. (2010). Myocardial infarction in criticallyill patients: a diagnostic challenge. Critical Care Medicine; 38:2412–2413.
Lim W, Qushmaq I, Cook DJ, Devereaux PJ, Heels-Ansdell D,Crowther MA, Tkaczyk A, Meade MO, Cook RJ. (2006a).Reliability of electrocardiogram interpretation in critically illpatients. Critical Care Medicine; 34: 1338–1343.
Lim W, Cook DJ, Griffith LE, Crowther MA, Devereaux PJ.(2006b). Elevated cardiac troponin levels in critically illpatients: prevalence, incidence, and outcomes. AmericanJournal Of Critical Care; 15: 280–288.
Lim W, Holinski P, Devereaux PJ, Tkacyk A, McDonald E,Clarke F, Qushmaq I, Terrenato I, Schunemann H, Crow-ther M, Cook D. (2008). Detecting myocardial infarction incritical illness using screening troponin measurements andECG recordings. Critical Care; 12: 1186/cc6815.
Oppenheim AN. (1992). Questionnaire Design, Interviewing andAttitude Measurement. London: Cassell.
Patton JA, Funk M. (2001). Survey of use of ST-segmentmonitoring in patients with acute coronary syndromes.American Journal of Critical Care; 10: 23–24.
Polit DF, Beck CT. (2008). Nursing Research: Generating andAssessing Evidence for Nursing Practice. Philadelphia: WoltersKluwer Health/Lippincott, Williams and Wilkins.
Randles D, CosgroveJ F, Nesbitt I. (2004). Myocardial ischaemiaas a cause of failure to wean from mechanical ventilation – anoverview of its incidence and investigation in critically illpatients. Care of the Critically Ill; 20: 117–118.
Thygesen K, Alpert JS, White HD. (2007). Joint ESC/ACCF/AHA/WHF task force for the redefinition of myocardial infarction.European Heart Journal; 28: 2525–2538.
Vincent JL, Baron JF, Reinhart K. (2002). Anemia and bloodtransfusion in critically ill patients. Journal of the AmericanMedical Association; 288: 1499–1507.
Zizzo C, Hassani A, Turner D. (2008). Automatic detection andimaging of ischemic changes during electrocardiogrammonitoring. IEEE Transactions on Biomedical Engineering; 55:1243–1247.
8 © 2012 The Authors. Nursing in Critical Care © 2012 British Association of Critical Care Nurses