pandemic-related disruptions learning proficiency indicators
TRANSCRIPT

Pandemic-related disruptions to schooling and impacts on learning proficiency indicators: A focus on the early grades
March 2021

UNESCO
The constitution of the United Nations Educational, Scientific and Cultural Organization (UNESCO) was adopted by 20 countries at the London Conference in November 1945 and entered into effect on 4 November 1946. The Organization currently has 195 Member States and 11 Associate Members.
The main objective of UNESCO is to contribute to peace and security in the world by promoting collaboration among nations through education, science, culture and communication in order to foster universal respect for justice, the rule of law, and the human rights and fundamental freedoms that are affirmed for the peoples of the world, without distinction of race, sex, language or religion, by the Charter of the United Nations.
To fulfil its mandate, UNESCO performs five principal functions: 1) prospective studies on education, science, culture and communication for tomorrow's world; 2) the advancement, transfer and sharing of knowledge through research, training and teaching activities; 3) standard-setting actions for the preparation and adoption of internal instruments and statutory recommendations; 4) expertise through technical cooperation to Member States for their development policies and projects; and 5) the exchange of specialized information.
UNESCO Institute for Statistics
The UNESCO Institute for Statistics (UIS) is the statistical office of UNESCO and is the UN depository for global statistics in the fields of education, science, technology and innovation, culture and communication. The UIS was established in 1999. It was created to improve UNESCO's statistical programme and to develop and deliver the timely, accurate and policy-relevant statistics needed in today’s increasingly complex and rapidly changing social, political and economic environments.
This paper was written by Martin Gustafsson, Research on Socio-Economic Policy (ReSEP), University of Stellenbosch
Published in 2021 by:
UNESCO Institute for Statistics P.O. Box 6128, Succursale Centre-Ville Montreal, Quebec H3C 3J7 Canada Tel: +1 514-343-6880 Email: [email protected] http://www.uis.unesco.org Ref: UIS/2021/LO/SDG4/RP/1 © UNESCO-UIS 2021
This publication is available in Open Access under the Attribution-ShareAlike 3.0 IGO (CC-BY-SA 3.0 IGO) license (http://creativecommons.org/licenses/by-sa/3.0/igo/). By using the content of this publication, the users accept to be bound by the terms of use of the UNESCO Open Access Repository (http://www.unesco.org/open-access/terms-use-ccbysa-en).
The designations employed and the presentation of material throughout this publication do not imply the expression of any opinion whatsoever on the part of UNESCO concerning the legal status of any country, territory, city or area or of its authorities or concerning the delimitation of its frontiers or boundaries.
The ideas and opinions expressed in this publication are those of the authors; they are not necessarily those of UNESCO and do not commit the Organization.

2
SUMMARY
The United Nations Secretary-General, António Guterres, echoed the concerns of people and organisations around the world when he recently referred to the impact of the COVID-19 pandemic on schooling as a ‘generational catastrophe’1. Children and youths are falling behind in their learning, and this is expected to have an impact lasting decades, especially if longer term effects on economic development and future earnings are taken into account.
This report focusses on the impacts of the pandemic on learning proficiency, specifically as measured by Sustainable Development Goal (SDG) Indicator 4.1.1. Over the last couple of decades, there has been a growing awareness of how crucial learning proficiency, especially that of younger children, is for human development. The evidence is clear that improvements in proficiency underpin future economic development, and the building of more cohesive and equal societies. The indicators on learning proficiency are among the most discussed indicators within the SDG framework.
There have been a number of attempts to understand and quantify the learning losses caused by the pandemic, with a view to shaping the necessary mitigation strategies. The current report represents one such attempt. What was clear around the end of 2020, when the pandemic was still far from over, is that the effects of the pandemic on schooling and learning were large, yet it was still too early to gauge precise effects. Moreover, while education actors around the world have responded to the crisis in often heroic and innovative ways, the optimal approaches to mitigating long-term impacts remain unclear. The pandemic’s threats to education are unprecedented in their nature and magnitude. While a wealth of evidence on how learning occurs, and what improves educational quality, is enormously helpful in charting the way forward, a greater understanding about the specificities of the pandemic and schooling is needed.
This report brings certain important specificities to the fore. This is done in a manner which emphasizes issues education planners would be familiar with, and need to grapple with. Though the model developed for the current report uses country-level data, the aim is not to provide guidance to individual countries. Rather, this report aims to provide global projections, and to identify dynamics which planners must focus on. These include: the magnitude and nature of the pandemic-related disruptions, not just to schools, but also pre-school institutions; the relationship between disruptions in the contact time of learners and losses in learning proficiency; the movement of age cohorts through the schooling system, and what this means for future proficiency levels and recovery strategies; what recovery means in terms of accelerating learning, and the point at which one can expect a return to trajectories envisaged before the pandemic.
The model producing the projections, in an Excel file, uses as its point of departure a projection model published by the UNESCO Institute for Statistics (UIS) shortly before the start of the pandemic. A key input in the new model is the contact time with teachers that children have lost, per country, from February to November 2020, expressed as a percentage of the regular school year. These statistics take into account partial closures, including situations where schools are open but attendance occurs on a rotational basis. By 11 November, the average child had lost 54% of a year’s contact time. Time lost is then converted to a fraction of a year of learning lost. Evidence, both from before and during the pandemic, point to an important effect: interruptions in contact time lead to learning losses which are larger than what is suggested by the actual time lost. This is because learners tend to forget skills acquired even before the interruption. A ‘forgetting ratio’ of 2.0 is used in the model: for every month of contact time lost, two months of learning are assumed to have been lost. A value of 2.0 is in line with the limited evidence we have on the magnitude of the ratio. Thus, if on average 54% of the school year has been lost, just over a year’s learning will have been
1 https://www.un.org/en/coronavirus/future-education-here

3
lost on average. The model takes into account the fact that a year’s learning is not the same across the world: countries which perform relatively poorly in internationally comparable assessments, do so because the amount of learning occurring between one grade and the next is lower. The model assumes that learning losses in each country are coupled with worsening inequality: learners who performed well previously, and would often be socio-economically advantaged, experience smaller learning losses than learners who did not perform well previously.
Beyond 2020, the model assumes learners moving into, for instance, Grade 6 will continue to be less proficient than what could be expected without the pandemic, because these students lost learning in a previous year. In fact, without any remedial acceleration, or catching up, Grade 6 learners up to 2025 would all be equally behind – in 2025 children who were in Grade 1 in 2020 would reach Grade 6. But the model assumes that even beyond 2025, Grade 6 children would display the effects of the 2020 disruptions, because these disruptions affected pre-schools too. Though the data on pre-school disruptions in 2020 are very limited, it appears pre-schooling was as disrupted as schooling in Grade 1 and above. The model draws from UIS data on pre-school participation to gauge the probability within each country of pre-school disruption effects having been felt when children enter school.
What is also taken into account is the possibility that children who were in utero during 2020 could experience exceptional cognitive development difficulties. This draws from evidence that a social and economic shock such as the pandemic can have a lasting impact which is especially large for children who were in utero during the shock. While in many countries these effects may not endure beyond a few years, it nonetheless seems important to bear in mind within any projections which age cohorts of children were in utero during the onset of the pandemic.
The trajectory which has just been described is illustrated by the red curve in the following graph, which focuses on Grade 3. The red curve represents the world’s children in Grade 3, drawing from the data of individual countries, and assumptions such as the 2.0 forgetting ratio discussed above.
Lower primary reading trajectories
In 2019, around 59% of the world’s approximately 132 million children who should be in Grade 3 were proficient in reading. Thus, 54 million children in 2019 were not reading as they should. The 54 million includes roughly 12 million children who were not attending any form of schooling in 2019, who are all considered non-proficient for the purposes of this analysis. The figures for proficiency in numeracy would be similar. It is estimated that the learning losses associated with the pandemic would reduce the percentage of proficient children at the Grade 3 level to 49%. This means the number of non-proficient
4
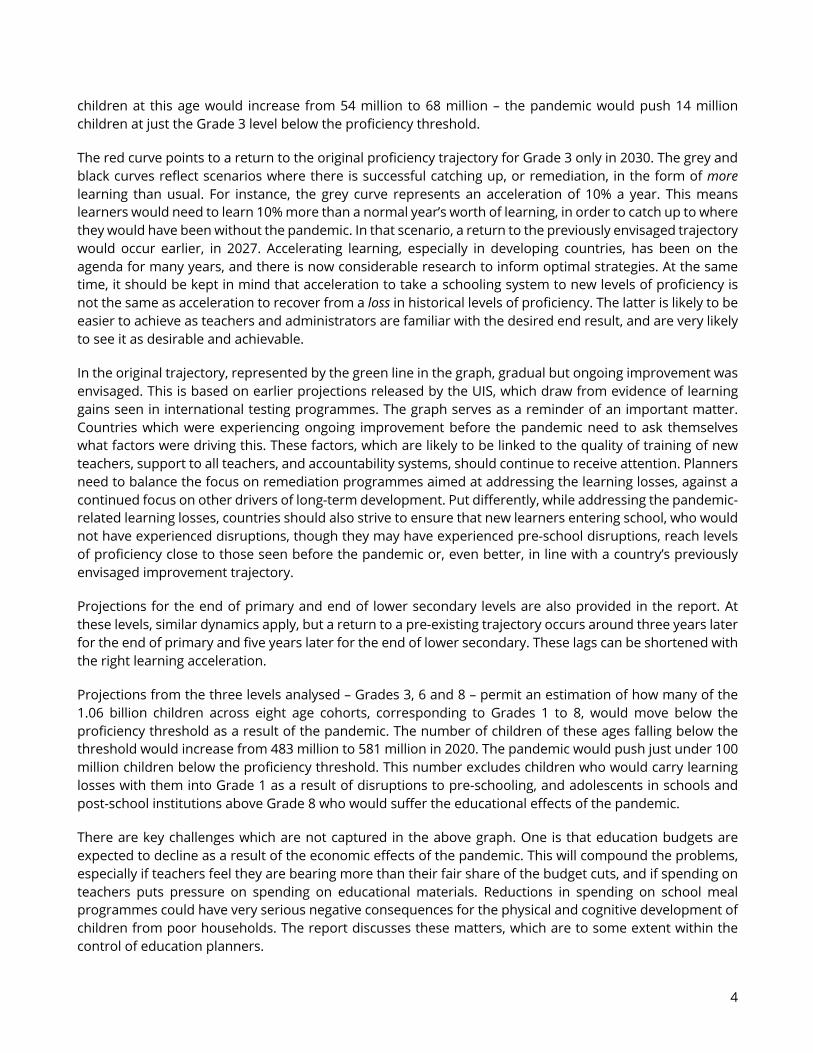
children at this age would increase from 54 million to 68 million – the pandemic would push 14 million children at just the Grade 3 level below the proficiency threshold.
The red curve points to a return to the original proficiency trajectory for Grade 3 only in 2030. The grey and black curves reflect scenarios where there is successful catching up, or remediation, in the form of more learning than usual. For instance, the grey curve represents an acceleration of 10% a year. This means learners would need to learn 10% more than a normal year’s worth of learning, in order to catch up to where they would have been without the pandemic. In that scenario, a return to the previously envisaged trajectory would occur earlier, in 2027. Accelerating learning, especially in developing countries, has been on the agenda for many years, and there is now considerable research to inform optimal strategies. At the same time, it should be kept in mind that acceleration to take a schooling system to new levels of proficiency is not the same as acceleration to recover from a loss in historical levels of proficiency. The latter is likely to be easier to achieve as teachers and administrators are familiar with the desired end result, and are very likely to see it as desirable and achievable.
In the original trajectory, represented by the green line in the graph, gradual but ongoing improvement was envisaged. This is based on earlier projections released by the UIS, which draw from evidence of learning gains seen in international testing programmes. The graph serves as a reminder of an important matter. Countries which were experiencing ongoing improvement before the pandemic need to ask themselves what factors were driving this. These factors, which are likely to be linked to the quality of training of new teachers, support to all teachers, and accountability systems, should continue to receive attention. Planners need to balance the focus on remediation programmes aimed at addressing the learning losses, against a continued focus on other drivers of long-term development. Put differently, while addressing the pandemic-related learning losses, countries should also strive to ensure that new learners entering school, who would not have experienced disruptions, though they may have experienced pre-school disruptions, reach levels of proficiency close to those seen before the pandemic or, even better, in line with a country’s previously envisaged improvement trajectory.
Projections for the end of primary and end of lower secondary levels are also provided in the report. At these levels, similar dynamics apply, but a return to a pre-existing trajectory occurs around three years later for the end of primary and five years later for the end of lower secondary. These lags can be shortened with the right learning acceleration.
Projections from the three levels analysed – Grades 3, 6 and 8 – permit an estimation of how many of the 1.06 billion children across eight age cohorts, corresponding to Grades 1 to 8, would move below the proficiency threshold as a result of the pandemic. The number of children of these ages falling below the threshold would increase from 483 million to 581 million in 2020. The pandemic would push just under 100 million children below the proficiency threshold. This number excludes children who would carry learning losses with them into Grade 1 as a result of disruptions to pre-schooling, and adolescents in schools and post-school institutions above Grade 8 who would suffer the educational effects of the pandemic.
There are key challenges which are not captured in the above graph. One is that education budgets are expected to decline as a result of the economic effects of the pandemic. This will compound the problems, especially if teachers feel they are bearing more than their fair share of the budget cuts, and if spending on teachers puts pressure on spending on educational materials. Reductions in spending on school meal programmes could have very serious negative consequences for the physical and cognitive development of children from poor households. The report discusses these matters, which are to some extent within the control of education planners.

5
What education planners have little control over is the economic effects of the pandemic on households, the most serious effect being a worsening of poverty. One result of this could be an increase in the percentage of children not in school. Little is known at this stage about the likely magnitude of this. While poverty may make it more difficult for households to send children to school, reductions in child labour, the abolition of school fees in many countries and increases in the coverage of school meal programmes in the last two decades are all factors which would work against higher levels of dropping out, especially for younger learners.
Tragically, increased dropping out is unlikely to affect the SDG proficiency indicators to a large degree. This is because those countries where more dropping out is most likely are also countries where children had low levels of proficiency even before the pandemic. In sub-Saharan Africa, in particular, only 20% of lower primary children are proficient in reading, yet 81% of primary-aged children are in school. Given the strong links between socio-economic background and learning, one can roughly say that outside the middle class, few learners in this region become proficient. And given that the poor are most likely to drop out of school, the result would be more non-proficient children outside school and fewer non-proficient learners in school. Clearly, even if more dropping out does not have an impact on the SDG proficiency statistics, the matter is a serious one in terms of, for instance, child nutrition and psychological well-being. Moreover, there are degrees of ‘non-proficiency’. Children should be as close as possible to the level of proficiency they should ideally be at.
Of the previously mentioned figure of 100 million children across eight age cohorts who would move below the proficiency threshold, 34 million would be children in Central and Southern Asia, while 29 million would be in Eastern and South-eastern Asia. These would be the two worst affected regions in absolute terms. In terms of percentage point changes in the percentage of proficient children, the largest decline is seen in Latin America and the Caribbean – from 70% to 51% in Grade 3, for example. Sub-Saharan Africa sees rather small declines. This is because even in 2019, the percentage of children who were proficient was low – for instance 20% at the Grade 3 level. Much of the learning losses occurring in this region would occur among children already below the level of proficiency. Put differently, the SDG indicators on learning proficiency provide a rather limited picture of the impacts of the pandemic on learning in sub-Saharan Africa.
Countries with effective programmes to monitor progress in, for instance, early grade reading will be in a good position to compare likely future trends without the pandemic, to actual outcomes with the pandemic, of the kind presented in the current report. Such comparisons will assist in determining what the effect of the pandemic has been on learning outcomes, and what remediation seems best. Countries which do not have these monitoring programmes will find it harder to interpret what lies behind the unusual trends which can be expected in the coming years. In particular, such countries may find it difficult to determine exactly how large the initial learning losses of 2020 were. The shock to learning brought about by the pandemic should be a catalyst for ‘building back better’, specifically improving the monitoring of learning, and taking teacher training, support to schools, and school accountability systems to new levels.
6
Table of Contents
1 Introduction .................................................................................................................. 7 2 Trajectories of learners and grades ........................................................................... 9 3 The institutional framework and COVID-19 threats .............................................. 16 4 The existing evidence and modelling ...................................................................... 19 4.1 Evidence on effects of the 2020 pandemic ................................................................. 19 4.2 Relevant evidence from before the pandemic ........................................................... 21 4.3 Early attempts to predict COVID-19 impacts on learning ......................................... 24 5 The reliability and relevance of UIS pre-school participation statistics ............. 26 6 The extent of school disruptions to date ................................................................ 29 7 A pandemic-sensitive update to previous UIS projections for SDG 4.1.1 ............ 37 7.1 A rationale for this set of projections .......................................................................... 37 7.2 The details of the methodology ................................................................................... 39 7.3 Results ............................................................................................................................. 43 8 Conclusion ................................................................................................................... 49
List of Figures
Figure 1: Learner trajectories .................................................................................................... 10 Figure 2: Grade 3 skills stock without system improvement ................................................. 12 Figure 3: Grade 3 skills stock with system improvement ....................................................... 13 Figure 4: Grade 3 percentage proficient with system improvement .................................... 14 Figure 5: Grade 6 percentage proficient with system improvement .................................... 15 Figure 6: Grade 8 percentage proficient with system improvement .................................... 16 Figure 7: Pandemic-related impacts on learning proficiency ................................................ 18 Figure 8: UNICEF and UIS pre-school compared ..................................................................... 27 Figure 9: UNICEF and UIS ECED plus pre-school compared .................................................. 28 Figure 10: Pre-school coverage ................................................................................................. 28 Figure 11: Pre-school coverage and lower primary reading proficiency .............................. 29 Figure 12: UNESCO and OxCGRT school closure trends ........................................................ 31 Figure 13: Categories of school year ......................................................................................... 33 Figure 14: Distribution across child population of school time lost ..................................... 34 Figure 15: Percentage of school year lost due to total closures ........................................... 35 Figure 16: Percentage of school year lost including partial closures .................................... 36 Figure 17: Percentage of school year lost due to total and partial closures ........................ 36 Figure 18: Modelling of 2020 learning losses in one country ................................................ 41 Figure 19: Lower primary reading trajectories ........................................................................ 44 Figure 20: Reading trajectories at three levels with no catching up ..................................... 45 Figure 21: Reading trajectories at three levels with 20% acceleration ................................. 45 Figure 22: Current UIS and earlier World Bank projections compared ................................ 46 Figure 23: Lower primary reading trajectories by region with no catching up ................... 47 Figure 24: Lower primary reading trajectories by region with 20% acceleration ................ 47

7
1 Introduction
There is by now some research on understanding the impacts of the COVID-19 pandemic on the learning proficiency of children at school. Immediate impacts have been felt as a result of total school closures, below-normal attendance as schools partially re-open, and income and social shocks to households, which affect learning. To a limited extent, negative impacts have been mitigated through remote schooling and interventions outside school aimed at assisting distressed households. However, resource constraints would have made such mitigation minimal for the great majority of the world’s children.
In this report, the term ‘school disruptions’ or ‘disruptions in schooling’ means loss of contact time between learners and their teachers. Though the term ‘school closures’ became widely used when the pandemic started affecting schooling systems, as schools began re-opening it became clear that not just school closures, but also open schools offering contact time at a reduced level risked slowing down the learning process. Hence ‘disruptions’ is used to refer to the wider problem of contact time lost.
A critical matter is what the long-term impacts will be on learning proficiency. To what extent are schools likely to succeed in getting learners to catch up to a point where they would have been without the pandemic? What are the long-term impacts of the serious economic, health and social disruptions on children’s learning? How will the anticipated decline in public spending on education affect learning?
The current paper offers a broad framework for understanding how education authorities around the world can mitigate the impacts of COVID-19 on learning proficiency. This framework is similar to other such frameworks. Much of the focus is on impacts on reading and mathematics proficiency in Grades 2 and 3, according to Sustainable Development Goal (SDG) Indicator 4.1.1(a). This indicator represents the level of schooling at which fundamental skills are taught; learning losses in these grades cause ripple effects on proficiency at higher levels. The purpose of the framework is twofold: it is aimed at informing a pandemic-focused adjustment to projections already published by the UNESCO Institute for Statistics (UIS); and it is designed to assist national and sub-national education authorities in planning responses to the pandemic.
The evidence currently available to inform decisions on how to minimize learning losses, is inadequate. This is particularly true for developing countries. By bringing together the evidence we have, particulary as it relates to developing countries, this paper attempts to assist national planners in these countries, where local research may not be available. Yet the obvious should be underlined: national circumstances require policy responses which are sensitive to those circumstances.
Projections in relation to Indicator 4.1.1 published in early 20202, and produced before the pandemic, point to 58% of the world’s children being in three world regions where no more than half of children are reading proficient at the lower primary level. These regions are: sub-Saharan Africa; Northern Africa and Western Asia; and Central and Southern Asia. In sub-Saharan Africa, which accounts for 22% of the world’s children, only 16% can read at a minimum level in lower primary, and this declines to 10% at the lower secondary level. In Latin America and the Caribbean, reading proficiency at lower primary is also weak, with just two-thirds of children reading proficiently. At the top of the range, Europe and Northern America, accounting for 10% of the world’s children, sees 95% of its lower primary learners reading proficiently. These figures
2 UIS, 2020. The report an accompanying Excel tool can be accessed through the page http://uis.unesco.org/en/blog/benchmarks-using-data-set-evidence-based-targets-improve-learning-proficiency, headed ‘Benchmarks: Using data to set evidence-based targets to improve learning proficiency’.

8
underscore the importance of focusing on developing countries in the current report, countries which were struggling educationally even before the pandemic.
Section 2 explains a simple and largely theoretical, yet mathematical, approach for modelling changes to the previously expected trajectory of learning proficiency in a country. This model is informed by available research.
Section 3 presents a framework for understanding the various direct and indirect impacts of the pandemic on learning, but also the impacts of policies and actions aimed at mitigating learning losses.
Section 4 discusses past research that can guide pandemic-sensitive planning with respect to achieving the SDGs on learning proficiency. The bulk of this research is from before the COVID-19 pandemic, and not always easy to apply to the current challenges, which are in so many ways unprecedented. But new research on, for instance, the impact of the 2020 disruptions on learning outcomes, is beginning to emerge (with a few exceptions, the review in the current paper considers evidence available up to the end of August 2020). This body of research will undoubtedly grow in the coming months and years. What research is needed, and how developing countries can contribute to this, is discussed.
There have been a few attempts to predict the future of learning proficiency, in the context of COVID-19, using evidence from disruptions to schooling before 2020. There cannot be high levels of certainty around any projections, including the ones presented in the current paper. The pandemic continues to influence societies in unpredictable ways. Even when the pandemic ends, projecting impacts on learning will remain difficult, as there are still serious knowledge gaps around, for instance, how much learning typically happens in a year of schooling in different national contexts. Yet projections can help to reduce the uncertainties, and the process of arriving at projections is important and interesting, as it helps to bring to the fore issues national policymakers should focus on.
Section 4 includes a limited discussion of the evidence on how countries can best accelerate learning in schools. The evidence in this regard is fortunately substantial. The pandemic has made it more important than ever.
Section 5 presents an analysis of existing UIS national statistics on participation in pre-school and early childhood programmes in general, with a view to assessing the utility of these statistics for producing SDG 4.1.1 projections. Levels of participation across countries are likely to have a bearing on both the kinds of pandemic-related disruptions felt by children, and opportunities for recovery, in particular at the lower primary level.
Section 6 provides an account of the extent of disruptions to schooling, by 11 November 2020, drawing from both UNESCO’s international school disruptions database, and Oxford University’s OxCGRT dataset, which includes school disruptions within its broader coverage of pandemic-related disruptions to economies and societies.
Section 7 provides an update of existing UIS projections of learning proficiency, taking into account possible effects of COVID-19, and using the model, framework and analysis presented in the foregoing sections. First, a broad rationale for the approach is explained, with an emphasis on national education planners as a target audience. An argument is made for differentiating between medium-term and longer-term effects, and the strategies needed for each, in the wake of the pandemic. Secondly, details of the modelling are explained, in part through a series of equations. Thirdly, projections for the SDG 4.1.1 indicators are provided, the emphasis being on reading at the lower primary level. A comparison against

9
projections made recently by the World Bank is provided. Projections by world region are presented. As was the case with projections produced before the pandemic, as explained in UIS (2020), global and regional trends are based on country-level data. However, as was the case with the earlier projections, it is emphasized that gaps and other problems with the data at the country level mean that much caution must be exercised in interpreting trends at that level.
2 Trajectories of learners and grades
The model explained in this section is intended to assist in the calculation of adjusted estimates of existing UIS projections relating to SDG 4.1.1 available in UIS (2020). While the model presented here includes many elements not used for the previous set of projections, as the exceptional circumstances of the COVID-19 pandemic had to be taken into account, what is presented here nonetheless shares much of the logic of the previous projections. For instance, the assumption of normal distributions when converting mean scores to the percentage of children who are proficient, continues to apply.
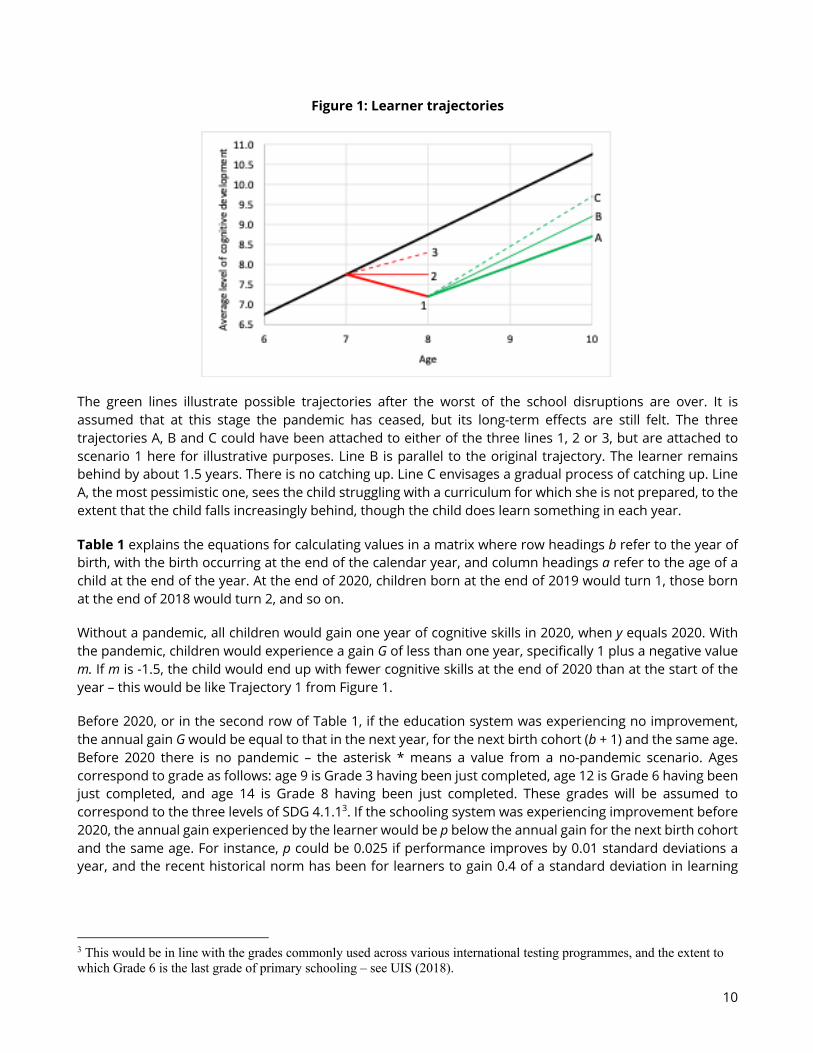
Figure 1 describes what could happen to one learner, or the average learner, in a schooling system. The graph is theoretical, though informed broadly by empirical evidence, much of which is discussed in Section 4.
The black line represents progress with respect to cognitive skills expected before the pandemic. For every additional age completed, the learner gains an additional year of skills. The vertical axis represents the typical rate of progress in the country, not what is optimal. Another country may see learners gain annually more than the one year of learning seen in the graph. The reason why, say, the age 7 level of cognitive development is 7.75, is that the starting point is considered to be not birth, but conception.
In this scenario, the worst of COVID-19 is assumed to occur between the 7th and 8th birthdays, which corresponds to calendar year 2020. During this period schooling is assumed to be heavily disrupted. In reality, disruptions in the form of schooling losses are expected to last less than a year in many countries. The graph uses a whole year for ease of illustration. The red lines illustrate three different, but plausible, trajectories for 2020. In Trajectory 3, the most optimistic one, skills acquired are fewer than anticipated, but cognitive skills are acquired, possibly through remote learning occurring in the home and supported by the education authorities. In Trajectory 2, the child’s development comes to a standstill. It is assumed that in the absence of schooling, nothing is learnt. In Trajectory 1, the child regresses as skills learnt previously are lost. There is evidence supporting this problem of forgetting. Here the child ends up losing half a year’s worth of learning during the pandemic, meaning that by age 8, the child is around 1.5 years behind: one year is lost due to a year’s loss of schooling, and a further half a year is lost through forgetting.
10
Figure 1: Learner trajectories
The green lines illustrate possible trajectories after the worst of the school disruptions are over. It is assumed that at this stage the pandemic has ceased, but its long-term effects are still felt. The three trajectories A, B and C could have been attached to either of the three lines 1, 2 or 3, but are attached to scenario 1 here for illustrative purposes. Line B is parallel to the original trajectory. The learner remains behind by about 1.5 years. There is no catching up. Line C envisages a gradual process of catching up. Line A, the most pessimistic one, sees the child struggling with a curriculum for which she is not prepared, to the extent that the child falls increasingly behind, though the child does learn something in each year.
Table 1 explains the equations for calculating values in a matrix where row headings b refer to the year of birth, with the birth occurring at the end of the calendar year, and column headings a refer to the age of a child at the end of the year. At the end of 2020, children born at the end of 2019 would turn 1, those born at the end of 2018 would turn 2, and so on.
Without a pandemic, all children would gain one year of cognitive skills in 2020, when y equals 2020. With the pandemic, children would experience a gain G of less than one year, specifically 1 plus a negative value m. If m is -1.5, the child would end up with fewer cognitive skills at the end of 2020 than at the start of the year – this would be like Trajectory 1 from Figure 1.
Before 2020, or in the second row of Table 1, if the education system was experiencing no improvement, the annual gain G would be equal to that in the next year, for the next birth cohort (b + 1) and the same age. Before 2020 there is no pandemic – the asterisk * means a value from a no-pandemic scenario. Ages correspond to grade as follows: age 9 is Grade 3 having been just completed, age 12 is Grade 6 having been just completed, and age 14 is Grade 8 having been just completed. These grades will be assumed to correspond to the three levels of SDG 4.1.13. If the schooling system was experiencing improvement before 2020, the annual gain experienced by the learner would be p below the annual gain for the next birth cohort and the same age. For instance, p could be 0.025 if performance improves by 0.01 standard deviations a year, and the recent historical norm has been for learners to gain 0.4 of a standard deviation in learning
3 This would be in line with the grades commonly used across various international testing programmes, and the extent to which Grade 6 is the last grade of primary schooling – see UIS (2018).

11
each year. The arithmetic is 0.01 times 1 over 0.4 is 0.025. As discussed in UIS (2019), ongoing though slow improvements are a reality in many countries, especially developing countries.
Table 1: Equations for annual learning gains
Calendar year (y) and year of birth (b)
Applicable equation for annual gain (G) for learners with year of
birth b and age a
! = 2020 %!,# = 1 +(
! < 2020 %!,# = %!$%,#∗ − +
! > 2020&/ < 2020 %!,# = (1 + 1) × %!,#∗
/ ≥ 2020 %!,# = %!'%,#∗ + +
For children born in or after 2020 (the last row of Table 1 – the second-last row is discussed below), the calculation of the annual gain is simple. It is the gain applicable to the previous birth cohort and the same age, plus p (p would be zero if there is no systemic improvement). In this model, it is thus assumed that long-term adverse effects on learning in schools, flowing from the 2020 crisis, are not felt by children born in 2020 or later. Of course, this may not hold true. Perhaps the simplest way of taking this into account, in particular for countries experiencing some form of improvement before the pandemic, would be to vary p after 2020.
The second-last equation applies for years later than 2020, but where the child was born before 2020. Here the non-pandemic gain G* is adjusted by c, which would be positive if catching up is occurring (Trajectory C) and negative if increasing falling behind is occurring (Trajectory A). For instance, c could be 0.2, meaning a learner was learning 20% more than a year’s worth of learning, as a result of a vigorous catch-up programme.
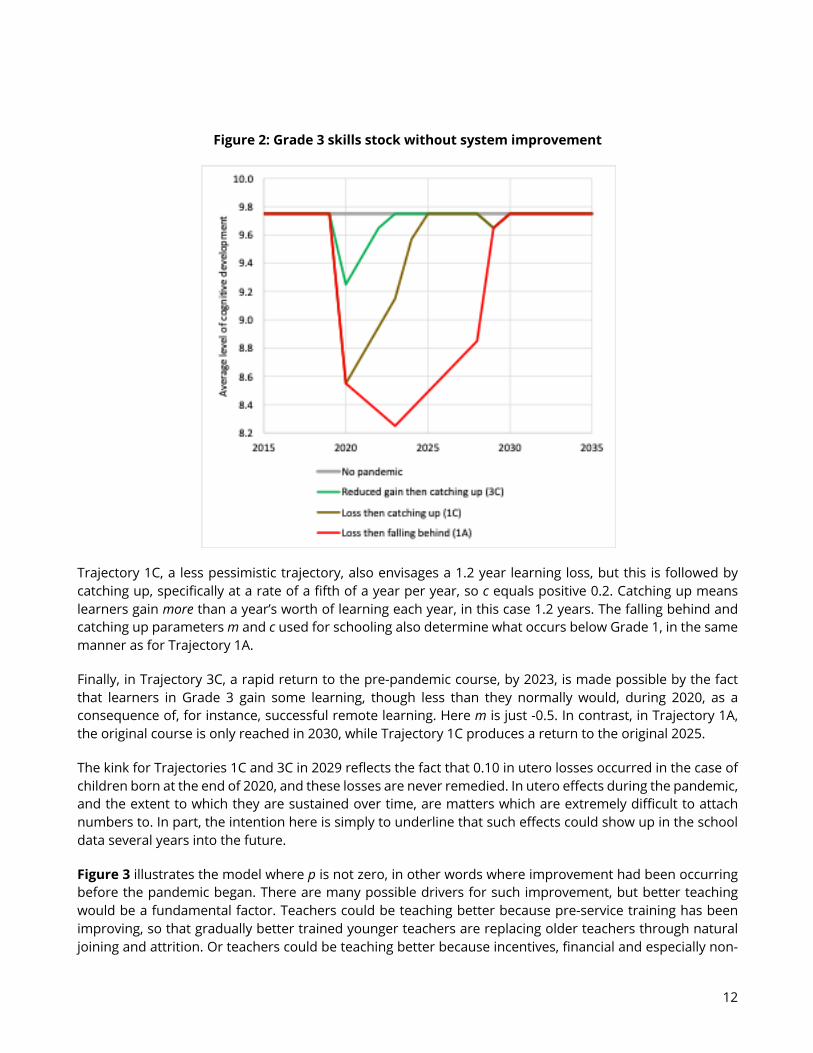
Figure 2 demonstrates the outcomes of this simple model. Here p is zero – there is no systemic improvement. By the end of Grade 3, with no pandemic, children would on average have acquired 9.75 years of cognitive skills (0.75 is acquired in utero). Trajectories in terms of the lines of the earlier Figure 1 are illustrated. While the numbering of trajectories is consistent across the two graphs, similarities in colouring have no meaning. Note too that while Figure 1 refers to the trajectory of a child,
Figure 2 refers to a trajectory of a grade.
Trajectory 1A, the most pessimistic trajectory, sees a drop of 1.2 years of skills between the end of 2019 and 2020, due to the disruption of the pandemic. Of the 1.2, 0.2 is accounted for by forgetting. Up to the end of 2023, even further declines are seen, as learners fall behind, not just in Grade 3, but also the earlier grades. The parameter c takes the value -0.1. Only after 2023 is an improvement seen. This occurs because 2020 declines in the quality of child care and pre-schooling below Grade 1 are not as large as for Grade 1 schooling and above. Specifically, development in utero is assumed to drop from 0.75 to 0.65. This same 0.10 loss applies to age 1, the school-level loss of 1.2 years applies to age 6, and for ages 2 to 5 a linear trend for m between ages 1 and 6 is used. The logic here is that below Grade 1 children are less sensitive to COVID-19 disruptions, but that the impacts are felt more the higher the age, as participation in pre-schooling increases.
12
Figure 2: Grade 3 skills stock without system improvement
Trajectory 1C, a less pessimistic trajectory, also envisages a 1.2 year learning loss, but this is followed by catching up, specifically at a rate of a fifth of a year per year, so c equals positive 0.2. Catching up means learners gain more than a year’s worth of learning each year, in this case 1.2 years. The falling behind and catching up parameters m and c used for schooling also determine what occurs below Grade 1, in the same manner as for Trajectory 1A.
Finally, in Trajectory 3C, a rapid return to the pre-pandemic course, by 2023, is made possible by the fact that learners in Grade 3 gain some learning, though less than they normally would, during 2020, as a consequence of, for instance, successful remote learning. Here m is just -0.5. In contrast, in Trajectory 1A, the original course is only reached in 2030, while Trajectory 1C produces a return to the original 2025.
The kink for Trajectories 1C and 3C in 2029 reflects the fact that 0.10 in utero losses occurred in the case of children born at the end of 2020, and these losses are never remedied. In utero effects during the pandemic, and the extent to which they are sustained over time, are matters which are extremely difficult to attach numbers to. In part, the intention here is simply to underline that such effects could show up in the school data several years into the future.
Figure 3 illustrates the model where p is not zero, in other words where improvement had been occurring before the pandemic began. There are many possible drivers for such improvement, but better teaching would be a fundamental factor. Teachers could be teaching better because pre-service training has been improving, so that gradually better trained younger teachers are replacing older teachers through natural joining and attrition. Or teachers could be teaching better because incentives, financial and especially non-

13
financial for doing so have improved. Improving teaching through better in-service training may also have occurred.
Two different no-pandemic improvement trajectories are shown in Figure 3, one which assumes that improvements are occurring only in schooling – Grade 1 and above – and the other that qualitative improvements are also occurring in early childhood care and pre-schooling. The vertical position of the ‘general improvement’ curves is adjusted so that they meet the ‘just school improvement’ curves in the year 2020.
If these developments were not interrupted by COVID-19, one could easily assume that the quality of teaching would continue to improve beyond 2020. While the model predicts that a return to the pre-pandemic trajectory occurs in 2025, whether there is improvement or not, the steeper the improvement, the better the 2025 catch-up point is. It seems intuitively right that a schooling system which was on an improvement pathway even before the pandemic, is likely to be a more effective and responsive one, and more likely to bring about very successful post-pandemic remediation. Of course, whether a return to exactly the same improvement pathway expected before the pandemic is possible, is debatable. Clearly, the planning of remediation needs to take into account what strengths the schooling system displayed before 2020.
Figure 3: Grade 3 skills stock with system improvement
Figure 4 translates the curves from the previous graph, which deal with the stock of skills children have in Grade 3, to the percentage of children in Grade 3 who are proficient. The method behind this relies on the assumption that within any grade and schooling system cognitive skills are distributed along a normal curve, and assumptions around the degree of inequality in this, specifically the standard deviation. UIS (2020) provides details in this regard, and these also receive attention in Section 7.2. Here it is assumed that
Assumed impact of being in utero in 2020

14
children at the end of Grade 3, who are assumed to turn 9 years at that point, should have a minimum of 9.75 years of learning (where this includes the 0.75 in utero development). It is also assumed that the standard deviation within Grade 3 is 2.5 years of learning. This would be line with the notion that grade-on-grade improvements are around 0.4 standard deviations a year. A gain of 0.4 standard deviations a year can be considered high. It seems roughly the norm in developed countries (Hill et al, 2008: 173), and is around double what Evans and Yuan (2019) find using data on adult skills, from five developing countries, as a proxy for data on young learners. However, Gustafsson (2020) finds two separate data sources giving grade-on-grade annual gains at the lower primary level in South Africa of about 0.5 standard deviations. As Evans and Yuan point out, good data on grade-on-grade gains in developing countries is especially scarce.
Figure 4: Grade 3 percentage proficient with system improvement
According to Figure 4, the percentage of Grade 3 learners who are proficient drops dramatically in 2020, by over 10 percentage points, as a result of the pandemic, and recovery occurs within five years. It is of course impossible to forecast with a high degree of certainty what will actually happen in the coming years. Yet this basic modelling suggests that for many years the monitoring of learning outcomes will have to proceed cautiously, with a full awareness of the disruptions caused by the pandemic. Clearly, gauging whether a system is coping well or poorly with the medium- to long-term effects of the pandemic will not be easy, and comparisons of trends across countries are likely to be especially useful.
Figure 5 and Figure 6 provide the same analysis as Figure 4, but for Grades 6 and 8, other levels which receive the focus for SDG 4.1.1. Here the effects of the pandemic last longer, because these grades must deal for a longer period of time with children born before or during 2020. A return to the original trajectory was found to occur in 2024 for Grade 3 in the above analysis. According to the following graphs, this return

15
would occur in 2028 in Grade 6 and 2029 in Grade 8. One may expect the return to the original in Grade 8 always to occur two years after this occurs in Grade 6, given that one is dealing with grades two years apart. A lag of two years will often occur, for instance depending on the value of c. However, the lag calculated by the model may deviate from two years.
Figure 5: Grade 6 percentage proficient with system improvement

16
Figure 6: Grade 8 percentage proficient with system improvement
3 The institutional framework and COVID-19 threats
The empirical evidence we can draw from in gauging the magnitude of the impacts of COVID-19 on learning is limited to a few specific, but important, areas. This empirical evidence is discussed in Section 4. But it is also important to speculate what, out of all conceivable contributing factors, is likely to play a key role in mitigating or worsening the COVID-19 effects, even where rigorous evidence is missing.
Figure 7 is structured in line with the typical functions of a Ministry of Education. It also explores what policies and strengths existing before, during and after the pandemic are likely to influence future learning trajectories. The World Health Organization declared the pandemic on 11 March 2020. It will declare the pandemic over when COVID-19 no longer poses a serious health threat across the world. When this might happen is currently impossible to predict. The differentiation in the diagram between ‘During pandemic’ and ‘After pandemic’ is not rigid. Many ‘After pandemic’ priorities have already become important now, in particular as schools re-open. At the same time, resurgences of COVID-19 could force schooling systems to move backwards, from ‘After pandemic’ to ‘During pandemic’ priorities.
The diagram draws broadly from what we know about effective policies and institutions in the schooling sector, for instance as discussed in UNESCO’s Global Education Monitoring Reports, but also the World Bank’s 2018 World Development Report, which focused specifically on schooling.
One can think of three key channels through which the pandemic affects pre-existing learning trajectories. Nutrition is arguably the most critical channel. The negative impacts of disruptions in the nutrition of

17
children tend to be even more difficult to remedy than disruptions in the learning process. Most education authorities have school nutrition directorates, who now play a critical role in combatting a worsening child nutrition situation. Even before the pandemic, many children who should have been receiving school meals, were not. In many developing countries, the percentage of learners receiving school meals has clearly been too low to cover all children from poor households4. As schools closed, many countries, and the World Food Programme, developed approaches for providing safe access to school meals. As schools re-open, the challenge will increasingly be a budgetary one as the economic effects of the pandemic hit the ability of governments to spend. School nutrition directorates will need to invest in strengthening their budget arguments in the face of Ministry of Finance attempts to re-prioritize budgets. This requires accounting for and communicating nutritional needs well, keeping in mind that the worsening economic climate could raise the demand for school meals. Directorates dealing with cross-government coordination need to work closely with authorities providing relief to households to ensure that children also access the food they need in the home.
At least in developing countries, and especially at the primary level, regular contact with teachers at school is vital for learning. Countries which, before the pandemic, had longer school years, and ensured that schools and teachers were accountable for the proper use of school time, would be at an advantage currently. While system-wide policies on how to implement social distancing in schools need to be grounded in evidence, it is also important for head teachers to have access to the relevant evidence, and to be able to process this, so that responses to school-specific circumstances can be properly planned. Depending on how teaching is usually organized, this could involve complex adjustments to school timetables. As schooling systems move towards catching up efforts, head teachers would need to mediate programmes requiring additional teaching time, and some re-organization of teaching. It is important that these programmes focus not just on having more teaching time, but also the achievement of the desired learning outcomes.
More teaching time could be difficult from a labour relations perspective. Countries where learning proficiency and professional teacher development have in the past featured strongly in the interactions between the employer and employees are less likely to experience difficulties. It is important that good evidence inform decisions around when teachers stay away from school to protect themselves and others from COVID-19. What could also threaten contact time with learners are the anticipated budget constraints, which could lead to a reduction in the number of teachers in schools, for instance when teachers who retire are not replaced.
School meals, apart from assisting the physical and cognitive growth of children, will play an important role in promoting contact time by encouraging especially poorer households to send children to school. At the same time, shocks to household income could threaten attendance, for instance if households cannot pay for things such as transport.
Those in the Ministry of Education dealing with communication and advocacy have a vital role to play in explaining to parents, and teachers, the magnitudes of the pandemic-related learning losses, and hence the need for society’s commitment towards catching up. They also need to counter misinformation regarding the COVID-19 risks in school settings.
4 World Food Programme, 2013.

18
Figure 7: Pandemic-related impacts on learning proficiency
Assessments
Teaching and learning
Budgeting
Human resources
Communicationand advocacy
School nutrition
Across-sectoral coordination
Before pandemic During pandemic After pandemicSample-based and censal programmes to monitor
improvements in learning.
Adapting teaching to the
new context
Maximizing contact time
Protecting child nutrition
Minimizinglearning losses
Management capacity and school accountability
systems.
Existence of ongoing improvement.
Existence of school meals, at least for the vulnerable.
Commitment to and monitoring of equitable
financing.Teacher development and
focus on learning in employer-union relations.
Alignment between schooling and poverty
alleviation.
Minimizing disruptions to assessments.
Evidence-based responses to COVID-19 and timetabling skills.
Teacher ability to support learners experiencing a variety of constraints.
Minimizing interruptions to school meal programmes.
Financing of new items while protecting pre-
existing essentials.Balancing teacher safety
and the protection of learning.
Promoting child-focussed support to households in
distress.
Enhancements to properly gauge success of catch-up
programmes.Ability to manage and
mediate complex recoveryinterventions.
Commitment to a return to the pre-pandemiclearning trajectory.
Protecting school nutrition budgets, possible
programme expansion. Placing learning outcomes
at the centre of difficult budget decisions.
Evidence-based andcollaborative tackling of
the budget crisis.
Continuation of child-focused poverty
alleviation.
School management
Success in placing learning outcomes at the centre of
public debates.
Addressing fears by providing clear and
accurate information.
Prioritizing catch-up and new school joiners in the
public debates.
Factors influencing the impact of COVID-19 on
learning proficiency
Early childhood development
Interventions aimed at improving early cognitive
development.
Monitoring closures, and keeping pre-schooling on
the policy agenda.
Promoting recovery and strengthening, despite
budget cuts.

19
Contact time needs to be maximized, but then this time should be utilized as effectively as possible by adapting teaching methods to the new context. The success of this depends on a complex combination of factors. Countries which could reliably claim to be experiencing improvements in learning proficiency in their schools before the pandemic are likely to be most resilient to COVID-19 shocks, as schooling systems in such countries would be more innovative and responsive in general. Assessment directorates have a central role to play, but need to respond to new monitoring needs. Countries with rigorous sample-based standardized assessment programmes, capable of detecting changes in the system over time, are at an enormous advantage. They will be most capable of quickly gauging the extent and nature of the immediate learning losses, and will be in a position to track how quickly the system is able to return to its original trajectory. This will assist decisionmakers elsewhere in the ministry in identifying appropriate interventions, and adjusting them over time. Countries which did not have good national assessments previously, but which introduce them soon, may not be able to gauge initial learning losses, but will still have valuable information which can in some ways assist in evaluating the success of catch-up initiatives. Countries with no standardized assessments at the primary level will find themselves in a particularly difficult situation.
While censal assessment programmes extending across all schools are seldom as reliable as sample-based programmes in providing accurate information on systemic trends, they are important as even imperfect information on learning outcomes is better than no information when schools themselves take decisions on how to return to their pre-pandemic learning trajectories.
Teaching and learning directorates have struggled to find alternatives to traditional teaching during school closures, in part because in any school there tend to be large inequalities among learners when it comes to the availability of tools such as internet access in the home. Teachers and schools have an obligation provide schooling equitably to learners, and this can become impossible outside the actual school. As schools re-open, opportunities will improve, but strategies such as rotational teaching, where learners come to school on certain days to facilitate social distancing, inevitably reduces contact. But insofar as such strategies result in smaller classes, they can also offer opportunities for more individualized attention.
The willingness of teachers to adapt relies strongly on a stable and sound labour relations situation. As far as possible, teachers need predictability around their pay and tenure, and there needs to be a sense that sacrifices are being spread fairly across those working in education, and the public service in general. Sacrifices are inevitable. World Bank (2020a) projections see education spending being around 8% lower than anticipated as a result of the pandemic, and a return to historical spending levels is unlikely to occur quickly. Human resources directorates will need to monitor carefully trends in the teacher workforce, such as teacher purchasing power, teacher attrition and the equity and efficiency of processes to fill vacancies.
Teacher remuneration easily ‘crowds out’ other spending in education, for instance spending on textbooks. Budgeting directorates will need to monitor whether this is happening, and warn about the possible educational implications. The situation has been made more difficult by the need to spend on new items, such as personal protective equipment (PPEs) for staff and learners. Clearly, teachers without pedagogical tools, such as textbooks, will make educational progress and catching up almost impossible.
4 The existing evidence and modelling
4.1 Evidence on effects of the COVID-19 pandemic up to August 2020
By the end of August 2020, some rigorous evidence on the nature and magnitudes of the impact of COVID-19 on learning had started to emerge. What are the key questions on which planners need evidence? The following four stand out.

20
What is the relationship between the duration and nature of the disruptions, on the one hand, and the magnitude of learning losses on the other? If a child loses three months of schooling, does she fall behind by three months of learning? This is what many would assume, yet the evidence suggests that learning losses are larger than what the loss in classroom contact time would suggest. But if this is the case, how much larger are these learning losses? As will be discussed, some researchers have argued that that if there is a learning loss due to a disruption in schooling, what learners gain in a year after the disruption has passed is smaller than what they would have gained had there been no disruption. What is the evidence on this, and what are the magnitudes of these longer-term effects?
1. Given the role of schools in providing nutrition to children, what are the effects of disruptions in school meals on learning?
2. What are the effects of a disruption of pre-school on subsequent learning? This is similar to the first question, but can be regarded as separate, given that organized learning below the first grade of school tends to work very differently for primary and secondary schooling.
3. How do socio-economic shocks to households, of the kind seen during the pandemic, affect attendance and learning in the short- to long-term, including through shocks experienced by pregnant mothers?
Further questions one could add to the list are the following: How effective are various non-contact schooling approaches, of the kind employed during the COVID-19 pandemic? What are the impacts on learning of risk mitigation strategies being employed as schools re-open, such as rotational school attendance, the use of masks by learners, and the enforcement of physical distancing in schools? These questions are closely linked to Question 1 above, but would be especially difficult to answer with good evidence, given they present considerable research methodology challenges. Yet these challenges are not insurmountable, and planning requires answers to these questions, even if they are informed speculation.
By the end of August 2020, a paper by Maldonado and De Witte (2020) stood out as the only data-rich analysis of the impact of school disruptions on learning proficiency in an entire schooling system. The paper examines learning losses in Belgium. Even if one can expect these kinds of findings to differ substantially across countries, this paper provides an important demonstration of how the data should be used, and what precautions should be taken by researchers. The analysis involves gauging by how much Grade 6 test results from the end of the 2019-2020 school year, following standardized tests conducted in June 2020, differed from comparable results in previous years. One factor that had to be taken into account was that COVID-19 affected not just learning, but who took the tests. The conclusion is that the 2020 results were around a fifth to a quarter of a standard deviation lower than in previous years, with losses being larger in reading than mathematics. The researchers speculate that it may have been easier for teachers to conduct distance learning in the latter subject. Inequality within and between schools moreover increased substantially.
Using evidence from the United States on grade-on-grade standard deviation gains in learning at the Grade 6 level, Maldonado and De Witte suggest that around half a year of learning was lost, though less than half a school year was disrupted. Specifically, just over a third of the school year was disrupted. One can deduce a crucial ratio from this information, of the learning loss in terms of a year of learning relative to the actual fraction of the school year lost. Here the ratio would be around 1.5-to-1, meaning that for every one day of schooling lost, 1.5 days of learning was lost. This is an under-estimate, insofar as the one-third of the school year lost included periods when certain learners could attend, meaning there was partial schooling. Moreover, in Belgium there were comprehensive efforts, not always successful, to interact with learners at home to ensure they continued learning.

21
That learning losses should exceed what one might expect from the actual disruption of schooling is a relatively well-established phenomenon which is probably under-appreciated by education planners and the general public. Interruptions to schooling represent not just a loss of contact time, but also time during which learners increasingly forget what they had learnt previously. In terms of the equations presented in Section 2, the ratio of 1.5-to-1 seen in the Belgian study means the parameter m takes on a value of -1.5, assuming a particularly long school closure of a whole year.
In the coming months and years, more research similar to the Belgian study will emerge, though evidence from developing countries is likely to be less available than would be ideal. In many of these countries, national assessment systems remain weak and participation in good international programmes remains relatively scarce. A critical programme is Progress in International Reading Literacy Study (PIRLS), whose 2021 wave of testing can be expected to produce final results by around the end of 2022. Yet Morocco and South Africa are the only two developing countries which will have the historical series of PIRLS results necessary for a proper analysis. Indonesia has participated in PIRLS in the past, but is not participating in 2021, while Chile and Brazil are participating for the first time in 2021.
4.2 Relevant evidence from before the pandemic
Until more research relating specifically to the impacts of COVID-19 becomes available, earlier research from somewhat similar contexts will continue to be important in answering the four questions outlined in Section 4.1. The current section moves through the four questions in identifying and discussing the relevant research.
One phenomenon that can assist in understanding the relationship between the duration and nature of disruptions, on the one hand, and the magnitude of learning losses on the other is teacher strikes. An analysis that stands out in this regard is that of Wills (2020), who uses test data collected shortly after a 2007 strike in South Africa, which caused schooling losses of up to 30 school days, and the fact that some learners were taught by both a striking and a non-striking teacher. The results presented by Wills point to each day lost translating to two days of lost learning5, meaning a 2-to-1 loss in terms of the ratio introduced earlier. Wills speculates that this loss is somewhat over-estimated, given the possibility that teachers who strike do not display similar teaching skills to those who did not strike.
Apart from Wills, perhaps the only other study of its kind dealing with the relationship between strike days and learning losses is Baker (2013), using data from Canada. It is difficult to extract a meaningful ratio from that analysis, yet its findings suggest that at least in the Canadian context catching up is possible. A year after the strike, learning losses observed immediately after the strike had been reduced by around 80%.
Scheduled school breaks provide an idea of the extent to which being away from school results in forgetting what was previously taught. Much of this research is from the United States, where several studies have examined the magnitude of the ‘summer slide’, the magnitude of forgetting occurring during the summer holidays. Findings draw from comparable testing before and after the break. Figures in Kuhfeld (2019) point to each day in this break contributing to a loss equal to half a day of learning. Moreover, the loss is found to increase more among older learners.
Effects of school breaks have been studied in a few developing countries. A study by Slade et al (2017: 479), using Malawi data, point to a very high ratio of around 2.1-to-1. Every day of schooling ‘lost’ during the break translated to 2.1 days of learning being forgotten. Figures from Sabates et al (2020), for especially
5 See interpretation of the relevant figures in Gustafsson and Nuga Deliwe (2020: 15).
22
marginalized children in Ghana moving from a special intervention programme to a three-month break and then formal schooling, point to a similarly high ratio of around 2.5-to-1. Obviously, it cannot be assumed that if there were no breaks at all, none of this loss in learning would occur, as presumably breaks are necessary and serve a psychological, if not educational, purpose.
Schooling disruptions following natural disasters offer another possibility to understand how learning losses occur. Andrabi et al (2020: 5, 10, 21, 30) provide an analysis of educational and other effects experienced by children following the 2005 Pakistan earthquake, which killed over 70,000 people. This study has informed both of the sets of projections discussed in Section 4.3. Andrabi et al had data on learning outcomes of children aged 7 to 15 four years after the disaster, which resulted in school closures of 14 weeks for children in the most affected areas. They find that after four years, learners who experienced the school closures, and other impacts of the earthquake, were 1.5 to 2.0 years behind learners not affected directly by the earthquake. The authors speculate that such a large learning loss came about because children fell increasingly behind the normal trajectory, because teachers continued to teach as before, without adapting their teaching level to the new context. It is noteworthy that the study found no learning loss, after four years, for children whose mothers had completed primary schooling. However, only one in six children were in this fortunate situation. Also noteworthy is that the normal grade-on-grade gain among learners in the area within Pakistan studied was found to be low, at just 0.17 standard deviations. Lastly, it seems as if the duration of 14 weeks is the official duration of the school closures. What appears not to have been available is data on the extent to which children in disaster areas missed school beyond the 14 weeks.
The only other study found linking a natural disaster to learning losses was Thamtanajit (2020), who focuses on the impacts of 2011 floods occurring in Thailand, which resulted in school closures of up to a month. The learning loss of 0.11 standard deviations observed in the data translates to a ratio of around 3-to-1.
The suggestion of the Pakistan study that initial learning losses can result in a decline in annual grade-on-grade learning gains in subsequent grades, especially for the most disadvantaged in society, because teachers do not adjust their teaching level, is a risk that warrants serious consideration. It is similar to the risk that under normal circumstances whole schools which perform poorly will fall increasingly behind other schools, because all teachers teach at a level prescribed by policy, without adapting to the actual situation in the classroom. Evidence on the existence and nature of that risk is unfortunately weak. To assess whether or not teachers are teaching to children’s needs, would ideally require data on results from comparable tests conducted each year over several years as learners across schools move up grade levels. Dumont and Ready (2019: 743), using data from the United States, find that between-school inequality, in terms of intraclass correlations, declines between the start of the year before Grade 1 and the end of Grade 2, suggesting that here teachers succeed in ensuring that weaker schools do not fall further behind. Singh (2019: 1777), focusing on developing countries, finds no clear pattern with regard to between-learner inequality trajectories. While Ethiopian children can expect inequality to worsen more than in Vietnam between ages 5 and 8, children in Peru can expect inequality to worsen less than in Vietnam. Both Peru and Ethiopia are worse performers than Vietnam. The extent to which inequality worsened in the reference country, Vietnam, could not be ascertained as different tests were used at the two ages. Taylor (2011: 17) finds a visible increase in between-learner reading inequality between Grades 3 and 5 using the same test in South Africa. However, whether between-school inequality also increased is not clear. More research is clearly needed on how inequality between and within schools evolves as learners advance through grade levels, and the role played by the level at which teachers set their teaching.
There appears to be little evidence on the effects of disruptions in school meals on learning. One can speculate that some of the large learning losses seen in the Malawi study referred to above would be due to children’s lack of access to school feeding during their longest school break. The Global Survey of School

23
Meal Programs6 found that 61% of Malawi’s primary school learners were recipients of school feeding. Evidence on the positive impacts on learning outcomes of the introduction of school meals exists. Chakraborty and Jayaraman (2019) stands out as a particularly data-rich and rigorous analysis. Using India’s Annual Status of Education Report (ASER), and data on the localized initiation of school meal programmes, the authors find an improvement in reading results at the end of primary of 0.17 standard deviations, and half this gain in mathematics, linked to having school meals. The improvement in reading is conceivably the equivalent of half a year of learning. As one might expect, the link between nutrition and learning is strong. However, even in the new research emerging after the start of the pandemic, it will be difficult to separate out the effects of the disruption on school meals from the disruption on teaching. Especially in developing countries, the first effect is conceivably significant.
While the effects of a disruption of pre-schooling on subsequent learning may be identifiable in the coming COVID-19 research, for now we must rely largely on evidence of the positive impacts of the introduction of pre-school services. Evidence on large positive impacts in developed countries is readily available, for instance in the meta-analysis of Van Huizen and Plantenga (2018). Yoshikawa and Kabay (2015: 9), in a meta-analysis focusing largely on developing countries, conclude that substantial positive impacts are common. However, the magnitudes of these impacts in developing countries on subsequent learning remain largely unknown, which is unfortunate in terms of the projections presented in Section 7. Berlinski et al (2008), using data from Argentina, conclude that an additional year of pre-primary schooling increases Grade 3 test scores by 0.23 standard deviations, which would be roughly one half to one year of learning.
As pointed out in Crouch and Gove (2017), pre-schooling is not just beneficial in the sense that it prepares children educationally for primary school. It also appears to reduce grade repetition in the initial primary school grades, thereby reducing class sizes, and presumably facilitating better teaching.
The research on socio-economic shocks to households and impacts on schooling tends to focus on changes in school attendance. Escoval and Saavedra (2005) find that in Peru economic shocks affecting individual households, not necessarily the economy as a whole, resulted in no significant decline in school attendance, though affected households spent less on educational inputs, which could have impacted negatively on the quality of schooling. Cameron (2001) found no major impact of the 1997 Asian financial crisis on school attendance, but this was in a context where government programmes sought to cushion the impact of the crisis on vulnerable households. But in both of the studies mentioned here, schools did not close. Smith (2020) examines impacts on school attendance of the 2013 to 2016 Ebola outbreak in West Africa, a crisis described as approximating the effects of COVID-19 in the affected countries. Schools were closed in Guinea and Sierra Leone for seven and nine months respectively, and food insecurity and income losses affected households severely7. While school closures appear to have increased dropping out marginally, the percentage of the primary- and secondary-aged populations enrolled at school was in fact slightly higher one to two years after the outbreak than during the previous decade8. This is in part because the two countries had seen ongoing improvements in enrolments. This serves as a reminder of the need to examine the impacts of COVID-19 in terms of the long-term historical trend.
It is important to bear in mind the channels through which household-level economic shocks could reduce attendance. This is most likely to occur where schools charge fees, where schools do not provide meals, where it is costly for the household to transport children to school, and where learners can easily find
6 https://gcnf.org/survey. 7 United Nations Development Group, 2015. 8 Depending on the grade-specific breakdown of dropping out, it is possible for dropping out overall to increase while the percentage of the population attending school increases.
24
employment on leaving school. The evidence suggests that access to school meals across the world has increased9, that the trend has been towards the abolition of school fees10, and that child labour has declined11. The global and national efforts behind these trends would have made school attendance more resilient to shocks such as COVID-19. It is obviously important that these trends continue. In particular, the budget shocks caused by the pandemic should not compromise school meal programmes.
The impact of socio-economic shocks on households appears to be magnified if children were in utero during the shock. Figures in Millet and Shah (2012) indicate that being in utero during a drought in India resulted in reading scores at the primary level which were 0.04 standard deviations below the norm. Being aged one or two during the drought had a smaller impact on subsequent learning. Bundervoet and Fransen (2018) find that young Rwandan adults who were in utero during the 1994 Rwandan genocide had 0.3 years less schooling, in terms of attendance, than those in utero immediately after genocide.
4.3 Early attempts to predict COVID-19 impacts on learning
Two international sets of projections, using data from multiple countries, have recently been produced. The World Bank’s simulations by Azevedo et al, released in June 2020, are ultimately concerned with gauging the impact of pandemic-related learning losses on income losses in the long term. It is projected that at the lower primary level, or for children aged 10, the immediate learning losses arising from the 2020 school disruptions result in a stalling of an improvement trajectory which had been seen previously. However, by 2023 there is a return to improvements, at about the rate occurring previously. Yet the disruptions mean that even beyond 2023, the percentage of children who are proficient is expected to be around three percentage points below what was previously anticipated. Yet even maintaining this will be difficult, it is argued, given the wider economic impacts of the pandemic. The 2015 point of departure, of 47% of lower primary children being proficient, is substantially lower than the 56% previously estimated by the UIS12.
The World Bank’s projections see larger negative impacts at the lower secondary level. The percentage of proficient youths drops by 10 percentage points, from 60% to 50%, in an intermediate scenario13, and no closing of this gap in the foreseeable future is envisaged. Moreover, inequality in learning outcomes is expected to grow. The World Bank’s 60% pre-pandemic percentage proficient for lower secondary is considerably better than the corresponding baseline put forward by the UIS, which is around 40%14. This seems to be due in part to the World Bank’s use of just PISA15 countries. Turning to mean scores, the deterioration at the lower secondary level is expected to be 16 PISA points, or around 0.16 of a standard deviation, in the intermediate scenario. The loss is as large as 27 PISA points in a pessimistic scenario, and 7 points in an optimistic scenario. School closures are assumed to last between 30% and 70% of a school year, with 50% in the intermediate scenario. Figures from the World Bank report16 point to the ratio of learning losses to actual time lost being around 2-to-1. It is assumed that around seven million children, around 0.5% of all the world’s learners, drop out of school as a result of the 2020 disruptions.
Projections by Kaffenberger (2020) conclude that at the Grade 10 level, learners in lower and middle income countries are expected to be 1.5 years behind by 2027, relative to a no-pandemic scenario. The
9 World Food Programme, 2013. 10 UNESCO, 2015. 11 International Labour Organization, 2017. 12 UIS, 2020: 36. 13 Azevedo et al, 2020: 17. 14 UIS, 2020: 36. 15 Programme for International Student Assessment. 16 Azevedo et al, 2020: 14.

25
percentage of youths above the SDG 4.1.1 minimum proficiency level drops from 7% to 3% as a result of the pandemic – these figures can be expected to be rather low because high income countries are excluded, yet they are considerably lower than the 2015 estimates of the UIS17. Kaffenberger uses data from seven PISA-D18 countries19. The modelling is largely based on the process assumed to occur between Grade 3, in 2020, and Grade 10, in 2027. Initial disruptions lasting one-third of the school year are expected to result in losses, which are then compounded in subsequent grades, on the assumption that teachers fail to adjust their teaching level to the new reality. The aforementioned decline in the percentage of proficient youths, from 7% to 3%, hides a serious phenomenon below the minimum proficiency level. The percentage of Grade 10 learners who learn nothing in a year, rises from 43% in 2020 to as much as 82% in 2027. Changes to pre-pandemic patterns of dropping out are not assumed, meaning that teachers are physically faced with an increasing proportion of under-performing learners, but even then do not adjust their level of teaching.
Kaffenberger, and to some extent the World Bank projections, put forward the Teaching at the Right Level (TaRL) approach to improvement as a means of grappling with the new learning deficits brought about by the pandemic. Banerjee et al (2016) found that TaRL improved learning outcomes in India on a relatively large scale, in around 600 schools in total in two districts in the state of Haryana and a further two in Uttar Pradesh. The programme involves remedial and catch-up teaching for learners in Grades 3 to 5, occurring in addition to regular teaching. In Haryana, teachers spent one hour a day implementing TaRL, while in Uttar Pradesh 40 days in the year were spent in special classes run by tutors who were not the learners’ regular teachers. A key feature of TaRL is that it involves regrouping learners according to their ability, as opposed to grade. Positive results from TaRL have led to government commitments to expand the programme20. TaRL offers one solution to the difficult task of pitching the level of teaching correctly. This task is not easy, partly for political reasons. Developing countries tend to want to set their textbooks and examinations at developed country standards. Not doing so is easily seen to be lacking in ambition. Moreover, setting lower standards for schools serving more disadvantaged learners within countries is unlikely to be accepted. By preserving the traditional model of teaching, and operating as an add-on remedial programme, TaRL attempts to deal with these policy complexities.
TaRL is described in the Global Education Monitoring Report21 of 2020 as an example of an approach that promotes inclusive education, by reducing the number of marginalized learners who fall behind. The World Bank’s (2018: 208) World Development Report argues that TaRL exemplifies how interventions to strengthen learning need to be piloted and evaluated iteratively before being taken to scale. As explained in Banerjee et al (2016), certain attempts at TaRL were not successful, and the challenge was to ensure that only effective versions of the programme were implemented at scale.
The projections presented in the current report share many of the assumptions of the two sets of projections described in this section. Crucially, not only is an impact of the pandemic on the mean level of performance assumed, it is also assumed that the pandemic is likely to worsen inequality with respect to learning outcomes. Neither of the projections discussed above, nor the new ones presented in the report, attempt to reconcile empirically observed proficiency statistics at different levels of the schooling system. In Section 7 below, projections for the three levels are calculated completely separately from each other. While
17 For instance, around 10% in sub-Saharan Africa and around 50% in Latin America and the Caribbean. See UIS (2020: 36). 18 PISA for Development. 19 See Kaffenberger and Pritchett (2020: 3). Figures for the lower secondary level in UIS (2020: 36) draw in part from PISA, but not from PISA-D. 20 Times of India, 2018. 21 UNESCO, 2020: 138.

26
Kaffenberger does use a model of progression from Grade 3 to Grade 10, this modelling is anchored only in Grade 10 data, meaning Grade 3 is simulated by projecting backwards from Grade 10. While more work on reconciling proficiency statistics at different levels of schooling is necessary, any global modelling of this should be based on country-level analyses that are better than those currently available.
5 The reliability and relevance of UIS pre-school participation statistics
As will be seen in Section 6, where primary schooling was disrupted, pre-schooling was also disrupted. Given how widespread disruptions to primary and secondary schooling have been, it is assumed that disruptions to pre-primary schooling were also extensive, and that this should be taken into account in some way when gauging learning losses.
In this section ‘pre-schooling’ refers to any institutional participation by children with at least some educational focus, below the first grade of primary school.
While internationally comparable data on the quality of pre-schooling barely exist, in particular as far as developing countries are concerned, data on the quantity of pre-schooling per country are relatively good. This section examines those data.
Both the UIS and UNICEF have collected data on pre-school coverage. These data appear not to be widely used beyond basic descriptive reporting. Analyses of how internally consistent these data are appear to be rare.
The UIS, within its UIS.Stat collection, publishes national totals for ‘Enrolment in early childhood educational development programmes’ (ECED) and ‘Enrolment in pre-primary education’. These values are obtained through ministries of education. From the questionnaires used by these institutions, it appears countries may understand the two categories rather differently, depending on national specificities. However, the questionnaires and the statistics themselves suggest that there is not a serious problem of double-counting. Countries count enrolled children in just one of the two categories in any annual round of reporting. UIS.Stat statistics were downloaded in September 2020, and for every country the most recent values for the period 2014 to 2019, the most recent reporting year, were used. Of the total of 227 countries, 81 had values for the first ‘early childhood educational development programmes’ category, giving a global sum of 21 million children, while 185 countries had values for the second ‘pre-primary education’ category, the global sum being 207 million children. All countries with second-category values also had first-category values, meaning there was some value for 185 countries. These 185 countries represent 90% of the world’s children.
UNICEF’s (2019) State of the World’s Children annual report includes ‘Attendance in early childhood education’ per country as a percentage. This is the percentage of children aged 3 to 5 years, or 36 to 59 months, enrolled in an institution according to household data. The values attributed to the year 2019 by UNICEF, though presumably the year of collection could be some year before 2019, cover 97 countries and 41% of the world’s children. The coverage becomes 45% if high-income OECD22 members are excluded from the analysis. Considering both the UIS and UNICEF values gives statistics for 201 of the 227 countries, or as much as 99% of the world’s child population. There are 81 countries with both UIS and UNICEF data, which provide an opportunity to examine how comparable the two sets of values are.
UNESCO’s (2006: 20) 2007 Global Monitoring Report, which focused specifically on early childhood development, implicitly deemed the UIS pre-primary data good enough to draw conclusions around
22 Organisation for Economic Co-operation and Development.

27
progress in participation rates. The report found that 124 million children were enrolled in some form of pre-school, and that improvements had occurred in the years preceding the report, especially in developing countries. Nonetheless, it found participation levels to be twice as high in developed as developing countries.
King et al (2018) attempted to audit the quality of the UIS pre-school data, but with a focus on published ratios, not raw enrolment numbers, as is the case below. Black et al (2017) used household survey data made available by UNICEF to examine inequality in pre-school access across 58 developing countries.
No attempt in recent years to compare UNICEF and UIS pre-school statistics could be found. Figure 8 and Figure 9 provide basic comparisons of the 81 countries with statistics from both sources. The first graph uses just the second UIS category, while the second graph combines both categories. For the vertical axis, the UIS enrolment was divided by the size of one child age cohort, using population data released through UIS.Stat. Though pre-school enrolments in UIS.Stat clearly cover more than one age cohort, using an age cohort as the denominator is one straightforward way of comparing coverage across countries. The correlation between the two sets of Figure 9 values is relatively high, at 0.73 (the values 0.60 and 0.53 seen in the graphs are regression coefficients of determination, not correlation coefficients). Several factors would prevent a higher correlation, in particular the fact that the UIS values would span more than just two years of pre-schooling.
There were 16 countries with UNICEF values but no UIS values. For these 16 countries, the prediction provided in the equation in Figure 9 was used to impute values expressed in terms of the UIS-based ratio.
Figure 8: UNICEF and UIS pre-school compared
R² = 0.60
0.0
0.5
1.0
1.5
2.0
2.5
3.0
3.5
4.0
4.5
5.0
0 20 40 60 80 100
UIS
pre
-sch
ool e
nrol
men
t ove
r one
age
coh
ort
UNICEF % of enrolled children 36 to 59 months

28
Figure 9: UNICEF and UIS ECED plus pre-school compared
The 201 countries, representing 99% of the world’s children, with values after this first imputation are illustrated in the following map (Figure 10). The higher levels of coverage in developed countries is clear, though the United States is a clear outlier. There are also large differences between developing countries. Among developing countries, the high level of coverage in Indonesia stands out.
Figure 10: Pre-school coverage
Source: Combined UIS and UNICEF data
For the remaining 26 countries, representing 1% of the world’s children, pre-school coverage values were imputed using per capita income and world region, along the lines of imputations explained in UIS (2020). Figure 11 reflects all 227 countries. If the assumption is made that disruptions to pre-schooling affect
y = 0.04x + 0.25R² = 0.53
0.0
0.5
1.0
1.5
2.0
2.5
3.0
3.5
4.0
4.5
5.0
0 20 40 60 80 100
UIS
ECE
D pl
us p
re-s
choo
l enr
olm
ent o
ver o
ne a
ge
coho
rt
UNICEF % of enrolled children 36 to 59 months

29
learning losses, then at specific disruption levels, more pre-schooling in a country would bring about larger learning losses. The graph illustrates that it would be those countries with relatively high proficiency levels which would lose most learning from pre-school disruptions. Presumably, these countries have reaped the benefits of high pre-school coverage, in part as evidenced by higher proficiency levels, but they are also the countries with the most to lose in this respect.
Figure 11: Pre-school coverage and lower primary reading proficiency
Note: The trendline is logarithmic. Source: Combined UIS and UNICEF data
6 The extent of school disruptions to date
In response to the pandemic, UNESCO started compiling data on school disruptions from 16 February onwards. The resultant database23, which is still being updated, captures the status of schools each day in each country. The four possible statuses used by UNESCO are indicated in the first panel of Figure 12. A methodological note24 clarifies that the pre-primary to upper secondary levels are covered in the daily status value, which is a single value not disaggregated by level. ‘Closed due to COVID-19’ means ‘closures of educational institutions affecting most or all of the student population’ according to the note. ‘Partially open’ would include the following:
(a) partial reopening in certain areas, and/or (b) a phased re-opening by grade level or age and/or (c) the use of a hybrid approach combining in-person and distance learning.
The UNESCO data therefore do not just deal with school closures narrowly defined, but conceivably any disruptions to normal contact time. This is important. Guthrie et al (2020) confirm that there is indeed a great variety of strategies countries have adopted whereby schools function each day, but at a lower than
23 File covid_impact_education.csv available at en.unesco.org/sites/default/files/covid_impact_education.csv. 24 ‘Global tracking of COVID-19 caused school closures and re-openings: Methodological note’.
R² = 0.45
0
10
20
30
40
50
60
70
80
90
100
0.0 1.0 2.0 3.0 4.0 5.0 6.0 7.0 8.0
Perc
enta
ge p
rofic
ient
in lo
wer
prim
ary
read
ing
Pre-school children over one age cohort

30
usual capacity. The UNESCO data cover 209 countries, accounting for 99.7% of the world’s children – 100% would be the 227 countries covered in, for instance, UIS (2020).
A second initiative which tracks school disruptions, is the Oxford COVID-19 Government Response Tracker, or OxCGRT25, whose scope covers all major types of pandemic-related disruptions to the economy and society. Though in a tiny number of cases OxCGRT has drawn from the UNESCO database in tracking school disruptions, most of OxCGRT’s education values are captured independently, using a team of researchers who monitor documents and media reports available online. OxCGRT’s education data thus differ slightly from that of UNESCO. Comparison of the two datasets permits some degree of verification of both.
The OxCGRT data cover 173 countries, or 95% of the world’s children. Its focus is the primary to tertiary levels. Two daily values per country are entered. The first deals with the general degree of closure, the second with whether measures are limited to regions within a country. The five OxCGRT categories shown in Figure 12 draw from both these values. What is not in brackets is the general degree of closure. The percentage of ‘Require closing all levels’ which is regionally targeted is 23%, the figures for ‘Require closing some levels’ and ‘Recommend closing’ being 65% and 36% respectively. These percentages are weighted by each country’s child population. Only ‘Require closing all levels’ has been disaggregated by targeting in Figure 12.
Figure 12 is based on data from the two sources downloaded 12 November 2020. The two broadly agree with each other with respect to the patterns they produce. Both follow the approach of counting seven days a week, so if ongoing school closures are applicable, closure is specified for seven days in a week, though obviously learners are losing less than seven days of schooling. A key difference is that UNESCO distinguishes between a normal academic break and pandemic-related disruptions. In the OxCGRT data, this distinction is not made, and days considered within an academic break in the UNESCO data have ‘require closing’ as the most common status in OxCGRT. The academic break values in UNESCO are however not as encompassing as they might be. There are eight countries with no academic break at all over a period of at least nine months, when one can assume these countries would have had some form of break. The countries are mostly countries where promotion from one grade to the next occurs between one calendar year and the next. The countries include Brazil, India and Uganda. Here even the UNESCO data would over-estimate disruptions, by not recognizing breaks.
A key advantage with the OxCGRT data is that it has values from as early as 24 January 2020, and thus captures more closures in, above all, China, than the UNESCO data. On the other hand, there are missing values in the OxCGRT in the final days before the end point, 11 November, as there is a lag in the data entry process. In contrast, UNESCO includes values for around two weeks into the future, presumably obtained from what countries intend to do.
Figure 12 weights countries using the population aged zero to 14. UNESCO’s red and pink account for 63% of UNESCO’s non-missing values, while the roughly comparable red plus pink for OxCGRT produces 58%. These two figures are reassuringly close. Differences would to a large extent be found in how the orange segments were defined, specifically the concepts ‘partial’ and ‘some levels’. As the technical metadata for both datasets do not go into much detail around how data capturers worked and took decisions, the publicly available data do not allow for much further investigation.
25 See https://www.bsg.ox.ac.uk/research/research-projects/coronavirus-government-response-tracker, also Hale et al (2020).

31
Figure 12: UNESCO and OxCGRT school closure trends
The UNESCO and OxCGRT datasets, apart from very limited information in a comments field in the data, do not provide the information one would ideally want on how different degrees of disruption applied at different levels of the education system. This is important information from an educational perspective: disruptions at the primary level are arguably more harmful than at the secondary level, as secondary learners are more able to use alternative technologies and work on their own. From a health angle the level
0102030405060708090
100
Perc
enta
ge o
f chi
ldre
n
Closed due to COVID-19 Academic break Partially open Fully open
0102030405060708090
100
Perc
enta
ge o
f chi
ldre
n
No measures
Recommend closing
Require closing some levels
Require closing all levels (regional)
Require closing all levels (everywhere)
OxCGRT
UNESCO

32
distinction is also important: younger children seem less likely to transmit the virus26, making secondary-level closures appear more effective in curbing transmissions.
A recent European Union27 report is one of the few sources available with details on pandemic-related disruptions by level, though this report covers only European countries. In this report, it is clear that lower levels of education have experienced lower levels of disruption, which would be in line with the educational and health concerns mentioned previously. To illustrate, of 31 European countries with statistics, nine countries had fewer days lost at the primary than secondary level, while only three displayed the reverse (Germany is one of the three). The difference is even greater if one looks at the pre-primary level: of the 31 countries, 16 lost fewer days at the pre-primary level than at the primary level, with three countries displaying the reverse.
A special survey run by UNESCO28 which does differentiate across levels suggests that in developing countries there were no large policy differences across levels of the education system, though smaller differences may be hidden because details down to days lost are not available. The UNESCO data thus suggest that the differentiation by level found in Europe was less prevalent in developing countries. The results of a basic analysis of the data are presented in Table 2. The statistics refer to numbers of developing countries, defined as countries outside of the set of high-income OECD countries. Data were collected from May to September. The survey data suggest that what countries did at one level, they also tended to do at an adjacent level29.
Table 2: Comparison across levels in developing countries
Primary è Pre-primary ê
Nation-wide closure Partial
Schools are not closed
Nation-wide closure 47 1 Partial 2 29 Schools are not closed 1 4 Lower secondary è Primary ê
Nation-wide closure Partial
Schools are not closed
Nation-wide closure 57 Partial 34 Schools are not closed 4
Of critical importance for comparing schooling disruptions across countries is the length and type of school year used in each country. UIS.Stat has been collecting basic statistics in this regard for many years, and these inform Figure 13. Type A school years end near the middle of the calendar year, while type B years are years largely coinciding with the calendar year. The general pattern is for countries to align the longer break following the end of the school year with the summer experienced in the hemisphere in question. Notable exceptions are a few countries where the school year ends in winter: countries in South Asia, including India; moreover Japan and South Korea. The length of the school year illustrated in the map uses
26 World Health Organization, 2020. 27 European Centre for Disease Prevention and Control, 2020: 24-27. 28 Page headed ‘Survey on National Education Responses to COVID-19 School Closures’ at http://tcg.uis.unesco.org/survey-education-covid-school-closures. Excel table downloaded 16 September 2020. 29 ‘Partial’ in Table 2 is a combination of two categories in the data: ‘Partial/Gradual’, which can refer to geographical differentiation, and ‘Phasing students’. The latter is described as possibly ‘progressive scheduling according to grade/age’ in the questionnaire national authorities fill in.

33
the UIS.Stat starting and finishing month. For instance, a year starting in September and ending in August would be considered an 11-month year.
Figure 13: Categories of school year
Source: UIS.Stat. Note: ‘A’ means school year starts in January to April, ‘B’ that it starts in July to October.
Table 3 presents various ways of calculating the percentage of a school year lost up to 11 November. The denominator is in all instances the length of the school year, based on the UIS.Stat data. What differs is the numerator. The second column attempts not to count a day outside the school year, as specified by UIS.Stat, as a lost day. To illustrate, in a school year stretching from September to June (easily the most common school year), days in July or August displayed as lost according to the UNESCO or OxCGRT data, would not be considered lost. Both the numerator and the denominator count seven-day weeks and, as indicated previously, UNESCO and OxCGRT both apply their categorizations across all seven days of the week. There is thus no need to make any adjustments taking into account on how many days in a normal week schooling occurs.
Table 3: Percentage of the year lost up to 11 November
Overriding exclusion of all between-grade breaks?
Calculation of numerator No Yes A Total closure using just UNESCO 42 40 B (A) with OxCGRT total closure before 16 February 43 41 C (B) with UNESCO academic break 59 48 D (B) with UNESCO partially open 61 59 E (C) with UNESCO partially open 77 66 F (E) with OxCGRT any required closing 80 68
Calculation A, counting only total closure in UNESCO, is the most conservative. Calculation B adds any ‘require closing’ from OxCGRT from before 16 February. C is given simply to see the effect of counting UNESCO academic breaks as lost days, though clearly these breaks should not be counted as lost days. D and E are more useful, as UNESCO ‘partially open’ clearly does represent some loss. Finally, F considers all ‘required closing’ in OxCGRT, whether regionally targeted or not, as time lost, regardless of how the day is classified in UNESCO, and also counts UNESCO ‘partially open’ as lost time. The values for B and F, in the

34
second column, of 41% and 68%, are highlighted as they seem to represent reasonable lower and upper bounds to the proportion of time lost. The 41% is an under-estimate largely because partial closures are not counted, while 68% is an over-estimate largely insofar as it assumes that when OxCGRT says time has been lost, and UNESCO says there was a school break, the OxCGRT conclusion is always correct. Of course, all statistics are under-estimates insofar as the disruptions continue beyond 11 November, but also because there is clear evidence that on re-opening, attendance levels are lower than they were before the pandemic. For instance, Mohohlwane et al (2020) find that in South Africa school attendance levels were often 10% below normal levels after schools re-opened, for a number of reasons, including household concerns relating to infections at school. While such fears may subside, permanent dropping out of school linked to increased poverty, as discussed in Section 4.3, is likely to be one of the results of the pandemic.
Figure 14 displays the distribution across the child population of the two bolded means from Table 3. Clearly, zero disruptions are extremely rare. The great majority of learners have experienced some level of disruption to their schooling, with some having lost up to 90%, even using the ‘total closure’ measure.
Figure 14: Distribution across child population of school time lost
Table 4 presents a simple regression analysis examining what regions and school year types are associated with the highest levels of disruption. The first regression uses disruption statistics corresponding to calculation B, second column, of Table 3. School years which follow the calendar year are associated with 12 percentage points more disruption, even when one controls for world region. This is to be expected. This type of school year does not have the long break seen around July in countries with year type A. There has thus been more planned schooling that could be disrupted. The reference region in the regression is Europe and Northern America30. Eastern and South-eastern Asia is associated with similar levels of disruption to the reference region, while Oceania has seen less disruption. All other regions are associated with considerably higher levels of disruption, for instance an additional 15 percentage points in the case of Latin America and the Caribbean. The second regression, which uses calculation F (second column) from Table 3, finds patterns which are largely similar.
30 Regions used here are those used by the UNESCO (2020) Global Education Monitoring Report, and also UIS (2020).

35
Table 4: Regression on percentage of school year lost
Dependent variable→ Total closure Including partial Coefficient p Coefficient p Constant 0.214*** 0.000 0.490*** 0.000 Year type A 0.122*** 0.000 0.130*** 0.000 Year type Other 0.013 0.890 0.011 0.901 Central and Southern Asia 0.100* 0.076 0.019 0.710 Eastern and South-eastern Asia 0.012 0.816 0.073 0.119 Latin America and the Caribbean 0.154*** 0.000 0.133*** 0.000 Northern Africa and Western Asia 0.181*** 0.000 0.171*** 0.000 Oceania -0.229*** 0.000 -0.301*** 0.000 Sub-Saharan Africa 0.074** 0.045 0.030 0.372
N 210 210 Adjusted R squared 0.268 0.324
Note: *** indicates that the estimate is significant at the 1% level of significance, ** at the 5% level, and * at the 10% level. Observations are unweighted countries.
The following two maps illustrate country-level values behind the global 41% and 68% estimates from Table 3. There are 11 countries, including Russia, the United States and Australia, which all carry values of zero in Figure 15, as these countries did not experience total closures according to the data.
Figure 15: Percentage of school year lost due to total closures
Note: Data up to 11 November 2020 Source: Combined UNESCO and OxCGRT data
A very different picture emerges if days displaying total or partial closures are used, as in Figure 16. Here, for instance, the United States carries a value of 74% of the year disrupted.

36
Figure 16: Percentage of school year lost including partial closures
Note: Data up to 11 November 2020 Source: Combined UNESCO and OxCGRT data
Figure 17 reflects values inserted into the Excel tool and used for the projections discussed in Section 7.3. Here each day of partial closure is counted as half a day lost, and is added to the days when total closures applied, which are then counted as full days lost. The global population-weighted mean associated with Figure 17 is 54% of the year lost, or just over half a school year.
Figure 17: Percentage of school year lost due to total and partial closures
Note: Data up to 11 November 2020 Source: Combined UNESCO and OxCGRT data
For 17 small countries, no disruption data were available in the UNESCO and OxCGRT datasets. For these countries, the mean for the region in which they were located was used.

37
7 A pandemic-sensitive update to previous UIS projections for SDG 4.1.1
7.1 A rationale for this set of projections
Estimating the future impact of the COVID-19 pandemic on educational quality requires superimposing a shock on previously existing indicator values, which themselves reflected assumptions around future changes. This can be conceptually and practically complex.
There are obviously many ways of undertaking the task. The assumed audience should to some extent determine what is modelled, and how results are presented. As stated in Section 1, education planners, and those who assist them, are a key target audience. The focus in what follows (and the basic model discussed in Section 2) is thus largely on factors under the control of the education authorities. A problem that planners often face is that they know what the challenges and solutions are, but often not their associated magnitudes. This can make prioritization of interventions difficult. The modelling explained below pays special attention to relative magnitudes. For instance, how large are the benefits of paying careful attention to managing remedial catch-up programmes, relative to the benefits of pursuing ongoing improvements in the teaching abilities of the average teacher? How important is it to pay attention to recovery at the pre-primary schooling level in bringing about recovery at the lower primary level?
Section 3 described the activities education planners normally focus on, and how these activities can be adapted to deal with the crisis arising from the pandemic. It seems clear that in the wake of the pandemic any schooling system must plan for two types of learners: those whose experience of the 2020 pandemic slowed down their learning and cognitive development, and those who are born late enough not to have been directly affected by school disruptions, though they may be indirectly affected, for instance if the pandemic brings about worsening household conditions for a protracted period of time. Planning for these two types of learners means paying sufficient attention to two areas of work, each of which requires effort, innovative thinking and budgets.
What is understandably receiving much attention currently is responses to the more immediate effects of the pandemic – limiting disruptions to schooling and implementing remedial catch-up programmes, for instance. These factors influence the depth of the initial learning losses, but also the extent to which learning losses are subsequently reduced. They appear in the columns ‘During pandemic’ and ‘After pandemic’ in Figure 7 above. It is likely that remedial programmes will need to continue for several years. One way of viewing their required duration is to see them as necessary up to the point at which the schooling system returns to the trajectory the system was expected to be on before the pandemic. Remedial programmes will moreover need to be informed by the nature of the pandemic-related disruption. For instance, assuming disruptions are mostly limited to 2020, Grade 5 learners in 2022 will be behind largely because they did not acquire skills they should have acquired in Grade 3. Grade 8 learners in 2022 will need remediation that is largely designed to address disruptions that occurred in Grade 6, and so on. It seems the most urgent remediation will be that required at the earlier grades as it is here that there is a greater likelihood that losses would have occurred in the fundamentals of reading and numeracy. In later grades, it seems most important to remedy learning losses where subsequent learning would be seriously compromised, because of the cumulative nature of the learning process. Losses in mathematics represent such a situation.
An area of work which may be ‘crowded out’ by the pandemic is protecting longer term institutional development, or what Section 2 referred to as pre-existing drivers of improvement. Virtually all education authorities have plans to improve educational outcomes, and the Sustainable Development Goals (SDGs) have helped to shift this emphasis towards proficiency in fundamental language and numeracy competencies. What these plans typically focus on appears in the column ‘Before pandemic’ of Figure 7. The

38
apparent success and known success of interventions to improve education outcomes varies considerably across country. In certain countries, there is rigorous monitoring of changes in proficiency over time. In such countries, planners roughly know that the overall improvement strategies are producing results. Of course, it is hardly ever possible to precisely pinpoint the causes of improvements at a system-wide level. In countries without countrywide rigorous monitoring of proficiency, planners need to depend on imperfect evidence: improvements observed in certain regions which do monitor well; expert opinion on the likely efficacy of existing interventions; the extent to which the teaching profession is positive about existing strategies.
In some countries, the priority should be to protect interventions known to have worked. In other countries, the priority may have to be to monitor results better, in order to provide a better basis for assessing the impact of interventions. Some countries should ensure they continue with experimentation with new interventions started before the pandemic. For countries that have clearly failed to plan properly for educational improvement, the pandemic can provide an opportunity to take stock of past failures, and to embrace the ‘build back better’31 idea promoted by the UN and the World Bank32. However long-term improvement is planned, it is imperative to assess past efforts, and how reliable historical data on proficiency trends are.
While all the ‘Before pandemic’ functional areas in Figure 7 are important for long-term improvements, two areas seem particularly critical: ‘Human resources’ and ‘School management’. Human resourcing is a particularly difficult area to deal with as budgetary shocks are likely to impact negatively on teacher pay. Attempts to soften the impact on teacher pay could reduce the ratio of spending on teaching materials relative to teacher pay. All this affects the motivation and ability of teachers to bring about better learning outcomes. School management is crucial as many necessary strategies relating to support to teachers, and accountability for learning outcomes, revolve around how schools are managed.
A practical way of viewing the need for longer term improvement is focus on new Grade 1 learners in 2021 and the years beyond that. These learners would not have experienced the serious 2020 disruptions in a school, though they may have experienced pre-school disruptions. The question planners need to ask whether these learners can reach levels of proficiency seen before the pandemic, already in 2021. These new incoming cohorts of learners, who may not be targeted by remedial programmes as older learners are, should not receive less attention than they would have received in the absence of the pandemic.
The above discussion informs the strong emphasis in the modelling that follows on both future trends envisaged before the pandemic, particularly feasible improvement over time, and the dynamics brought about by the pandemic. Moreover, the role of birth cohorts, along the lines of the basic models presented in Section 2, is emphasized. Birth cohorts are something education planners would mostly be very familiar with.
What the modelling does not pay explicit attention to, apart from the acknowledgement of in utero effects, is a worsening of poverty as a result of the pandemic, which will undoubtedly affect factors such as attendance and educational support available in the home. Household poverty is of course something education planners have little direct control over.
An important consideration is the possible effects of increased dropping out caused by the pandemic. As discussed in Section 4.3, the World Bank estimates that poverty effects could cause an additional 0.5% of
31 This term originated with the Sendai Framework for Disaster Risk Reduction 2015-2030 (United Nations, 2015). 32 World Bank, 2020.

39
school learners to drop out and not return. Conceivably, the figure could be higher than this. How might this affect the SDG proficiency indicators? Tragically, the answer is not at all, or barely. This is because in those countries where a worsening of the dropping out situation is most likely, a combination of poverty and poor schooling means that even before the pandemic large proportions of children were far from being proficient, despite attending school. For instance, in sub-Saharan Africa around 80% of lower primary-aged children in the population are below proficient, the figure in Central and Southern Asia and Northern Africa and Western Asia being 50%33. This is despite the fact that the out-of-school rate at the primary level for these regions is 19%, 7% and 9% respectively. In such a context, increased dropping out means more below-proficient children out of school and fewer below-proficient children in school. While this has serious implications for child health, learning and psychological well-being, the historical learning levels are too low to affect the percentage of children who are proficient in a substantial way. It can be assumed that by far most of the additional dropping out would occur among the most vulnerable, in other words children who were not proficient, though they attended school.
7.2 The details of the methodology
This section follows the structure and section headings of the Excel tool which accompanies this report, specifically the sheet Projections. The tool is an adaptation of the original tool accompanying UIS (2020), which produced projections before the pandemic had begun. While relevant elements of the original tool are described here, the reader wishing to gain a deeper understanding of the original tool should consult the UIS (2020) report.
Row 2602 of the Excel tool, sheet Projections, refers to COVID-19 adjustments, and is where the pandemic-related projections work begins. What comes before row 2602 is the original pre-COVID projections. These rows before 2602 remain important as this is where general parameters are changed, for instance the level of schooling and school subject receiving the focus. The published version of the Excel file has the general parameters set in such a way that the ‘optimistic BAU’ scenario for lower primary reading proficiency is displayed34. This can easily be changed.
Inputs on starting point for universal score in the tool is where the value of the universal score at conception is entered. This value reflects the cognitive development of an average child on conception, so nine months before birth. This is thus the starting point for the accumulation of cognitive ability modelled in the tool. Default values are 100 for the lower primary analysis, and 10 for both the end of primary and lower secondary analyses. Values differ as the model does not integrate the three analyses (see Section 4.3), meaning a starting point in each analysis must be found which provides plausible results, specifically plausible grade-on-grade gains. This section of the tool reports on the distribution across countries of these gains. This gain is the G discussed in Section 2, expressed in terms of gains in the universal score. For instance, for the lower primary reading analysis, the median is a gain of 38 points per year for the average child. This gain is in turn based on recent levels of proficiency seen in the country, and the universal score at conception.
Inputs relating to learning losses in 2020 (m) in the tool include a ‘forgetting ratio’, or the days of learning lost for every actual day of schooling lost. The default value for this is 2.0. This ratio is used to calculate the
33 UIS, 2020: 36. 34 The outcomes of the optimistic business-as-usual (BAU) scenario are expressed in Table 20 of UIS (2020). Essential parameters for this scenario are an annual improvement of 0.049 for a country with a mean score of 250 and of 0.012 for a country with a mean score of 550 (cells B8 and B9). Moreover, a standard deviation of 100 is used throughout (both cells B33 and B34 must be set at 100).

40
2020 value of m for the grade receiving attention, m being the learning loss brought about by the pandemic, expressed as a fraction of a year of learning. The model is designed in such a way that if m is made zero, trends revert to what they would have been without the pandemic.
The choice of the forgetting ratio is clearly a crucial step in producing projections. The 2.0 default value is in line what the World Bank has used (Section 4.3) and worse than the 1.5 seen from the earliest evidence we have, from Belgium, of impacts of the 2020 disruptions on learning losses (Section 4.1 – of course, the ratio in Belgium could worsen as disruptions to schooling proceed in that country).
The losses for age 0 and age 1 are also entered, the default values being -0.05 and -0.10. The latter serves as an anchor for calculating age-specific pre-school learning losses.
The ‘Pre-school coverage value beyond which no further learning losses counted’ is the ‘pre-school children over one age cohort’ illustrated in Figure 10, capped at whatever ceiling is entered in the tool. The default cap is 3.0. This limits the learning losses associated with pre-school disruptions to plausible levels.
Inputs on catching up capacity (c) reflects a fraction of a year’s worth of learning. For instance, if it is assumed that remediation can succeed in accelerating the pace of learning by 10%, what is learnt in a year becomes 110% of the typical learning that occurs. Catching up is capped in the tool in the sense that it can only narrow the gap between the learning trajectory expected before the pandemic and actual learning levels. It can never take the actual beyond the originally expected.
There are two graphs generated. The first reflects two global trajectories, one being the originally anticipated one, and the other the learning proficiency trajectory expected as a result of the pandemic. The second graph breaks the global with-pandemic trajectory down by world region.
The section Non-changing country-level input data on pre-school coverage (children attending over one age cohort) contains the Figure 10 values per country, as well as a summary table reflecting population-weighted regional averages.
The section Non-changing country-level input data on percentage of schooling year lost in 2020 contains the Figure 17 values per country, and summary statistics per world region.
The background calculations section is duly labelled and can be examined to gain an in-depth understanding of the calculations. The methodology is also explained below, using Kenya as an example, and the lower primary reading ‘optimistic BAU’ parameters set at the top of the worksheet. These parameters include keeping the standard deviation for all years at 100. The tool assumes Grade 3 is the lower primary grade of focus. The reader is reminded of what is explained in UIS (2020), that the tool is not intended to reflect faithfully what occurs in each country. The aim is to draw from relatively accurate country-level statistics to produce statistics per world region and the world. The methodology can certainly be used to produce, say, projections for Kenya to inform debates and planning in relation to Kenya. However, the methodology may have to be adapted to Kenya-specific dynamics, and input data may have to be changed in line with what those familiar with Kenya’s data know to be the most reliable data.

41
First, Kenya’s percentage proficient statistic for 2020 is explained. This is 29%, considerably lower than the 2019 value of 39%. The 29% is calculated as follows (see section of the tool headed ‘Percentage proficient per single year in the COVID-19 trajectory’):
!! = 1 − NORM.DIST(400, 2!, 3!,TRUE) (1)
Here the Excel function NORM.DIST is used. This function produces the fraction of learners under a normal curve to left of, or below, a threshold, in this case 400, which is the proficiency threshold which has been used within the universal score range. D refers to the standard deviation, and S to the average score for Kenya, subscript v denoting that this is in the scenario with COVID-19. The value of Sv is 338 (section ‘Realistic targets per single year in the COVID-19 trajectory’) and of Dv 112 (‘Standard deviations with COVID-19’). ‘TRUE’ in the equation tells Excel that the cumulative percentage of learners to the left of 400 is needed, and not the probability of having a score of 400.
What p would be in the absence of the pandemic is given by the following (‘Percentage proficient per single year in the original trajectory’).
!" = 1 − NORM.DIST(400, 2", 100,TRUE) (2)
Here the mean score Sa is 375, the score expected for Kenya in 2020 had there been no pandemic. The normal curves reflecting the parameters from the above two equations are illustrated in Figure 18. What the tool does is that it assumes that learning losses are worst among the less advantaged. In fact, the most advantaged barely experience any losses. This would be in line with the assumption that the elite in any country on the whole succeeds in avoiding learning losses as in this segment of society there were considerable means to continue with learning. Technologies needed for remote learning would have been available both among teachers and learners, and importantly, adults in the household would be more equipped to support children. The drop in the 2020 mean, from the previously assumed 375 to 338, is thus modelled by keeping learners at the top right-hand end of the distribution more or less unaffected, and increasing the standard deviation, and thus inequality, to produce the lower mean. As seen above, the standard deviation increased from 100 to 112.
Figure 18: Modelling of 2020 learning losses in one country
0 100 200 300 400 500 600 700
Lear
ners
with
this
scor
e
No pandemic With 2020 learning losses
mean 375s.d. 100mean 338
s.d. 112
42
The with-pandemic mean of 338 is calculated as follows:
2! = 2" +89 (3)
The mean expected in 2020 before the pandemic, Sa, is added to m, which is a negative fraction of a year, multiplied by G, what Kenya could expect as its grade 2 to grade 3 gain in 2020, before the pandemic. m is -1.30 (section ‘Magnitude of the 2020 shock m’) while G is 28 universal score points (section ‘Value of pre-pandemic annual gain G’).
m is calculated as follows:
8 = :; (4)
Here r is the portion of the school year lost due to the pandemic, the value being 0.65 in the case of Kenya, and f is the forgetting factor, the value being 2.0 here.
G is calculated as follows:
9 = 2" − <= (5)
Here A is the assumed score at conception, carrying the value 100 as discussed above, and Y is how many years have lapsed since conception by the end of Grade 3. The latter is 9.75 years. Equation (5) thus assumes that since conception, an equal gain of cognitive development has occurred each year. While progress in, say, reading would clearly be more rapid once a child is in school, cognitive development in the sense of G at the pre-school stage means broadly the various forms of cognitive development necessary to make a child ready for school.
Dv from equation (1), the standard deviation or level of inequality after the 2020 shock, is calculated as follows:
3! =NORM.INV(0.9987, 2", 100) − 2!
3 (6)
The Excel function NORM.INV calculates the score below which a certain fraction of learners are found. This fraction is always 0.9987, giving a score of 675, or the score of virtually the best performing learner in Kenya. This is in the pre-pandemic scenario: the mean score Sa is 375 and the standard deviation 100. The fraction 0.9987 happens to be the point three standard deviations to the right of the mean. The numerator in equation (6) is the distance, in score points, between almost the best learner and the new, and lower, with-pandemic mean of Sv, which is 338. Dividing by 3 produces the new, now larger, standard deviation.
The focus now turns to Kenya’s Grade 3 values after 2020, but before the point at which the country returns to the original pre-pandemic trajectory, because children have not experienced the pandemic directly, or in the less likely case of catching up having been so effective, and c so high, that the impact of the 2020 disruptions is eliminated. Specifically, the year 2022 is used to illustrate the calculation. From equations (1) to (6), there is only one equation which would be different in 2022, and that is equation (3), which would become the following:

43
2! = 2",$%$$ +89$%$% + C D9$%$$
$%$& (7)
The with-pandemic score Sv in 2022 takes into account learning losses experienced in 2020, when children would have been in Grade 1, and catching up experienced in 2021 and 2022, during Grades 2 and 3, resulting from an acceleration of learning to deal with the 2020 losses. The point of departure, Sa,2022 is the mean score expected in Grade 3 in 2022 before the pandemic began. From this, we must subtract mG2020, or the magnitude of the 2020 losses. Here m remains -1.30, as in equation (3). Had the children been below Grade 1 in 2020, m would have been lower, and the learning losses consequently smaller, in line with the parameters entered for m. We then add the magnitude of the catching up, which in this instance has been occurring during two years, in 2021 and 2022. The value c is 0.10 here, meaning learning in 2021 and 2022 is accelerated by 10%. G can differ from one year to the next, in line with equation (5). Equation (7) produces a mean score of 345 which, though higher than the 338 with-pandemic value for 2020, is still worse than the originally anticipated 381 for 2022. A ceiling is applied to equation (7): Sv can never be higher than the originally anticipated Sa.
Equation (7) applies even for pre-primary years experienced since 2020. Just as a learning loss m can apply as the pre-primary level, so too does catching up after 2020 captured in c. Pre-primary institutions are thus assumed to be in a position to accelerate learning and cognitive development with a view to getting children to reach the level of age-specific child development seen before the pandemic.
There is one loss which is never recovered, and that is the cognitive loss associated with having been in utero in 2020. This draws from evidence discussed in Section 4.2 that in utero effects of a socio-economic shock can be surprisingly persistent. It thus seemed important to mark within the projections, through at least a minor kink in the trend, the point at which children born in 2020 reach the grade being analysed, assuming of course a perfect alignment between grade and age.
The standard deviation declines, meaning inequality declines, during the recovery process. Because the mean is improving, while learners at the very top end remain roughly on their original pre-pandemic trajectory, equation (6) forces performance at the lower end of the spectrum up.
7.3 Results
Figure 19 illustrates three global trajectories emerging from the model. The focus here is on Grade 3 reading. The trajectories differ only with respect to the assumption of how much catching up occurs. No catching up, and accelerating annual learning in all grades by 10% and 20%, are modelled. The SDG indicator value reflecting children in the population who are proficient declines by a whole 10 percentage points between 2019 and 2020, from 59% to 49%. This translates into 14 million fewer proficient children within the global age cohort corresponding to Grade 3 – the entire age cohort is estimated at 133 million. In line with earlier UIS projections, one can assume that around 12 million of the 133 million children would be non-proficient because they were not attending school35.
After the sharp drop in 2020, there are two years of relatively slow improvement. These two years are years when learners who previously suffered disruptions in Grades 1 and 2 participate in Grade 3. The years 2023 and beyond see considerably better levels of proficiency, as Grade 3 learners without a history of primary
35 UIS, 2020: 32.

44
school disruptions enter the schooling system, though they might have experienced disruptions at the pre-primary level. The simplifying assumption here is obviously that there is no grade repetition. Depending on how effective catching up efforts are, a return to the original pre-pandemic trajectory occurs in 2031 or 2027 – both the 10% and 20% acceleration scenarios result in all countries reaching their historical trajectories in 2027, though the 20% scenario sees more countries reaching this point before 2027. (It may seem from the graph as if the 20% trajectory reaches the original before the 10% trajectory does, but smaller distances from the original seen in the data are not really visible in the graph.)
Figure 19: Lower primary reading trajectories
In all three COVID-19 trajectories in Figure 19, there is a slight drop in proficiency in 2029 as children who were in utero in 2020 enter Grade 3.
Trajectories for mathematics are not provided here as they appear almost indistinguishable from the reading trajectories, at all three education levels. The mathematics trajectories can easily be extracted from the Excel tool by changing the subject parameter.
Figure 20 reproduces the ‘no annual catching up’ curve from Figure 19, and adds the corresponding curves for the end of primary and lower secondary levels, the grades used being Grades 6 and 8. The ‘optimistic business-as-usual’ trajectories envisaged in UIS (2020) look similar at the two primary levels, but the secondary-level trajectory is positioned considerably lower. This fact, and the fact that the new model assumes a larger grade-on-grade gain G at the primary levels, results in a smaller 2020 learning loss, in percentage point terms, at the secondary level. Catching up, however, takes much longer at the secondary level, because children who experienced 2020 disruptions pass through Grade 8 during more years. A return to the original trajectory occurs in 2034 at the end of primary, and 2035 in lower secondary (at the lower primary level the year was said to be 2031 with no catching up). It seems easy to under-estimate how long the COVID-19 learning losses will continue to be felt in schooling systems around the world. In particular, not taking into account how specific cohorts progress through the system, and not considering the detrimental effects of pre-school disruptions, can easily lead to the conclusion that the schooling system can ‘fix itself’ within three or four years. Figure 20 suggests there is a considerable risk that this will not happen.

45
Figure 20: Reading trajectories at three levels with no catching up
Figure 21 takes a more optimistic view and assumes that all countries are able to accelerate learning in schools and pre-schools, through catch-up programmes, by 20%. This leads to a much earlier return to the pre-pandemic trajectory: 2027 for lower primary (as in Figure 19), also 2027 for end of primary, and 2029 for end of lower secondary.
Figure 21: Reading trajectories at three levels with 20% acceleration
Figure 22 compares the approach presented above to trajectories the World Bank has put forward for the lower primary level. Specifically, Grade 3 trajectories presented above are compared to the age 10 projections of the World Bank36 – the latter were discussed in Section 4.3 above. The World Bank’s trajectory anticipated before the pandemic has a lower starting point, of 47%, than the 57% of the UIS. This is not surprising, considering that somewhat different methodologies and data sources were used. The World Bank’s optimistic scenario is steeper than that of UIS (2020), in part because the former is aligned to the World Bank’s ‘cut learning poverty at least by half’ call37 – the move from 47% in 2015 to 73% in 2030 represents roughly a halving of the non-proficient percentage from 53% to 27%.
36 Azevedo et al, 2020: 25. 37 World Bank, 2019: 21.
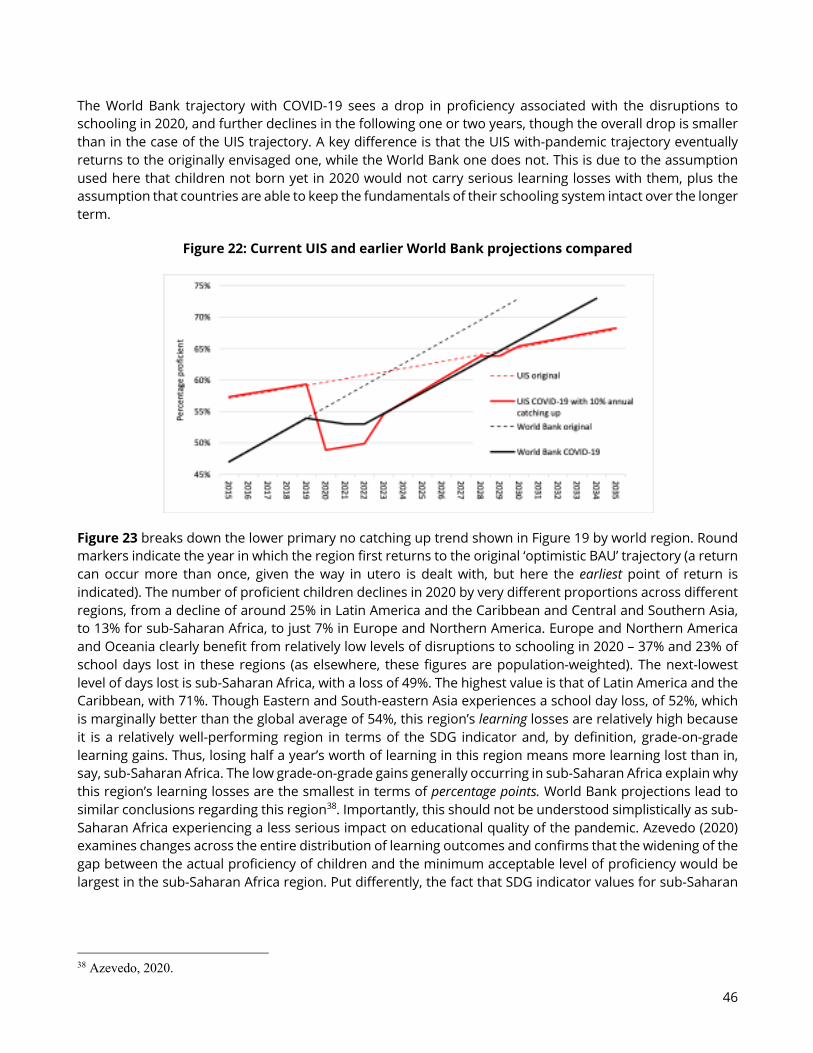
46
The World Bank trajectory with COVID-19 sees a drop in proficiency associated with the disruptions to schooling in 2020, and further declines in the following one or two years, though the overall drop is smaller than in the case of the UIS trajectory. A key difference is that the UIS with-pandemic trajectory eventually returns to the originally envisaged one, while the World Bank one does not. This is due to the assumption used here that children not born yet in 2020 would not carry serious learning losses with them, plus the assumption that countries are able to keep the fundamentals of their schooling system intact over the longer term.
Figure 22: Current UIS and earlier World Bank projections compared
Figure 23 breaks down the lower primary no catching up trend shown in Figure 19 by world region. Round markers indicate the year in which the region first returns to the original ‘optimistic BAU’ trajectory (a return can occur more than once, given the way in utero is dealt with, but here the earliest point of return is indicated). The number of proficient children declines in 2020 by very different proportions across different regions, from a decline of around 25% in Latin America and the Caribbean and Central and Southern Asia, to 13% for sub-Saharan Africa, to just 7% in Europe and Northern America. Europe and Northern America and Oceania clearly benefit from relatively low levels of disruptions to schooling in 2020 – 37% and 23% of school days lost in these regions (as elsewhere, these figures are population-weighted). The next-lowest level of days lost is sub-Saharan Africa, with a loss of 49%. The highest value is that of Latin America and the Caribbean, with 71%. Though Eastern and South-eastern Asia experiences a school day loss, of 52%, which is marginally better than the global average of 54%, this region’s learning losses are relatively high because it is a relatively well-performing region in terms of the SDG indicator and, by definition, grade-on-grade learning gains. Thus, losing half a year’s worth of learning in this region means more learning lost than in, say, sub-Saharan Africa. The low grade-on-grade gains generally occurring in sub-Saharan Africa explain why this region’s learning losses are the smallest in terms of percentage points. World Bank projections lead to similar conclusions regarding this region38. Importantly, this should not be understood simplistically as sub-Saharan Africa experiencing a less serious impact on educational quality of the pandemic. Azevedo (2020) examines changes across the entire distribution of learning outcomes and confirms that the widening of the gap between the actual proficiency of children and the minimum acceptable level of proficiency would be largest in the sub-Saharan Africa region. Put differently, the fact that SDG indicator values for sub-Saharan
38 Azevedo, 2020.

47
Africa are so low means that much of the harm done to learning by the pandemic is not captured by these indicators.
Figure 23: Lower primary reading trajectories by region with no catching up
In Figure 23, the return to the original trajectory occurs in 2030 or 2031 for all regions. Assuming, very optimistically, a 20% acceleration in learning, until a return to the original trajectory, results in this return occurring several years earlier, between 2024 and 2027 – see Figure 24. The last region to see this return is Latin America and the Caribbean, not only because the primary school disruptions in 2020 were large, but also because pre-primary participation in this region is relatively high, as seen in Section 5, meaning relatively large effects of 2020 disruptions to pre-schooling are carried through to future Grade 3 classes.
Figure 24: Lower primary reading trajectories by region with 20% acceleration
Table 5 provides key statistics, by region, for the three education levels. Because of the lower 2019 indicator values at the lower secondary level, 2020 proficiency declines at this level in terms of millions in an age cohort are somewhat lower: around 9 million more non-proficient, compared to around 13 million for each of the two primary levels. With regard to the last three columns, similarities across regions in one column mean little. What is meaningful is differences across columns, depending on rates of acceleration in the learning process. This rate is likely to differ across countries, and regions, with those having better capacity their education administrations being more capable of bringing about the required recovery and catching up in the near future.
0%
10%
20%
30%
40%
50%
60%
70%
80%
90%
100%
2015
2016
2017
2018
2019
2020
2021
2022
2023
2024
2025
2026
2027
2028
2029
2030
2031
2032
2033
2034
2035
Perc
enta
ge p
rofic
ient
Europe and Northern America
Latin America and the Caribbean
Oceania
Eastern and South-eastern Asia
Central and Southern Asia
Northern Africa and Western Asia
Sub-Saharan Africa

48
Table 5: Summary of reading proficiency impacts by region
% proficient Million children of one age cohort who are proficient
Return to original trajectory by rate of
acceleration
2019 2020 Change 2019 2020
Change
% change
0% 10% 20%
Lower primary Sub-Saharan Africa 20% 17% -3.0 6.1 5.2 -0.8 -13% 2030 2026 2024 Northern Africa and Western Asia 55% 44% -11.0 5.9 4.7 -1.2 -20% 2030 2026 2025 Central and Southern Asia 55% 41% -13.6 20.1 15.1 -5.0 -25% 2030 2026 2024 Eastern and South-eastern Asia 85% 73% -11.9 26.3 22.4 -3.9 -15% 2031 2026 2025 Oceania 83% 78% -5.0 0.6 0.5 0.0 -5% 2030 2025 2025 Latin America and the Caribbean 70% 51% -18.4 7.3 5.4 -2.0 -27% 2030 2027 2027 Europe and Northern America 96% 90% -6.1 12.1 11.3 -0.8 -7% 2030 2026 2024 World 59% 49% -10.4 78.3 64.6 -13.7 -17% 2031 2027 2027 End of primary Sub-Saharan Africa 18% 15% -2.9 5.4 4.6 -0.8 -14% 2033 2028 2027 Northern Africa and Western Asia 55% 44% -10.8 5.9 4.7 -1.1 -19% 2033 2030 2026 Central and Southern Asia 55% 41% -13.4 20.1 15.1 -4.9 -25% 2033 2028 2026 Eastern and South-eastern Asia 85% 74% -11.0 26.3 22.7 -3.6 -14% 2034 2028 2027 Oceania 83% 79% -4.6 0.6 0.5 0.0 -5% 2033 2027 2025 Latin America and the Caribbean 79% 61% -18.2 8.3 6.3 -1.9 -23% 2034 2034 2027 Europe and Northern America 96% 91% -5.4 12.1 11.3 -0.7 -6% 2033 2028 2026 World 59% 49% -10.0 78.5 65.4 -13.2 -17% 2034 2034 2027 End of lower secondary Sub-Saharan Africa 13% 11% -1.7 4.0 3.5 -0.4 -11% 2035 2029 2028 Northern Africa and Western Asia 39% 32% -6.7 4.2 3.5 -0.7 -17% 2035 2029 2027 Central and Southern Asia 26% 21% -4.9 9.6 7.7 -1.8 -19% 2035 2029 2027 Eastern and South-eastern Asia 64% 54% -10.3 19.9 16.6 -3.4 -17% 2035 2030 2027 Oceania 70% 66% -4.3 0.5 0.4 0.0 -6% 2035 2029 2025 Latin America and the Caribbean 55% 42% -13.0 5.8 4.4 -1.4 -24% 2035 2031 2029 Europe and Northern America 82% 75% -7.9 10.4 9.3 -1.0 -10% 2035 2029 2026 World 41% 34% -6.7 54.3 45.5 -8.7 -16% 2035 2031 2029

49
Aggregating across the three levels in Table 5, and assuming that lower primary and end of primary each represent three age cohorts, while end of lower secondary represents two age cohorts, produces estimates across eight age cohorts. Of the 1.06 billion children across these eight age cohorts, 581 million would be proficient in 2019, against 483 million at the end of 2020. The pandemic would push just under 100 million children below the proficiency threshold.
8 Conclusion
This paper has reviewed evidence from the before the COVID-19 pandemic, and some of the vital evidence that has emerged since the beginning of the pandemic, to arrive at an approach and model for understanding the impact of the pandemic on a vital human development indicator, namely attainment of learning proficiency among children and adolescents. This is not the only attempt to do this, and comparisons were made to other analyses of a similar nature. In the coming months and years, much more analytical work will emerge. Key unknowns currently are, firstly, the relationship between contact time lost by children and learning losses, especially in developing countries and, secondly, the ability of schooling systems to ‘catch up’, or accelerate learning so that there can be a return to historical levels of learning.
The reader wanting a high-level view of the findings of the current report and their implications for strategy, should consult the executive summary.
50
References
Andrabi, T., Daniels, B. & Das, J. (2020). Human capital accumulation and disasters: Evidence from the Pakistan earthquake of 2005. Oxford: RISE.
Azevedo, J.P. (2020). Learning poverty: Measures and simulations. Washington: World Bank. Azevedo, J.P., Hasan, A., Goldemberg, D., Iqbal, S.A. & Geven, K. (2020). Simulating the potential impacts of
COVID-19 school closures on schooling and learning outcomes: A set of global estimates. Washington: World Bank.
Baker, M. (2013). Industrial actions in schools: Strikes and student achievement. Canadian Journal of Economics, 46(3): 1014-1036.
Banerjee A., Banerji, R., Berry, J., Duflo, E., Kannan, H. et al (2016). Mainstreaming an effective intervention: Evidence from randomized evaluations of “teaching at the right level” in India. Washington: National Bureau of Economic Research.
Berlinski, S., Galiani, S. & Gertler, P. (2008). The effect of pre-primary education on primary school performance. Journal of Public Economics, 93: 219-234.
Black, M., Walker, S., Fernald, L.C.H., Andersen, C.T. et al (2017). Early childhood development coming of age: Science through the life course. The Lancet, 389: 77-90.
Bundervoet, T. & Fransen, S. (2018). The educational impact of shocks in utero: Evidence from Rwanda. Economics and Human Biology, 29: 88-101.
Cameron, L.A. (2001). The impact of the Indonesian financial crisis on children: an analysis using the 100 villages data. Bulletin of Indonesian Economic Studies, 37:1, 43-64.
Chakraborty, T. & Jayaraman, R. (2019). School feeding and learning achievement: Evidence from India’s midday meal program. Journal of Development Economics, 139: 249-265.
Crouch, L. & Gove, A. (2017). Stumbling at the first step: Efficiency implications of poor performance in the foundational first five years, Prospects, 47:175–196.
Dumont, H. & Ready, D.D. (2019). Do schools reduce or exacerbate inequality? How the associations between student achievement and achievement growth influence our understanding of the role of schooling. American Educational Research Journal, 57(2): 728-774.
Escoval, J. & Saavedra, J. (2005). Economic shocks and changes in school attendance levels and education expenditure in Peru. Munich: MPRA.
European Centre for Disease Prevention and Control (2020). COVID-19 in children and the role of school settings in COVID-19 transmission. Stockholm.
Evans, D.K. & Yuan, F. (2019). Equivalent years of schooling: A metric to communicate learning gains in concrete terms. Washington: World Bank.
Gustafsson, M. (2020). A revised PIRLS 2011 to 2016 trend for South Africa and the importance of analysing the underlying microdata. Stellenbosch: Stellenbosch University.
Gustafsson, M. & Nuga Deliwe, C. (2020). How is the COVID-19 pandemic affecting educational quality in South Africa? Evidence to date and future risks. Stellenbosch: Stellenbosch University.
Guthrie, B.L., Tordoff, D.M., Meisner, J., Tolentino, L. et al (2020). Summary of school re-opening models and implementation: Approaches during the COVID 19 pandemic. Seattle: University of Washington.
Hale, T., Petherick, A., Phillips, T. & Webster, S. (2020). Variation in government responses to COVID-19: Version 6.0. Oxford: Blavatnik School of Government.
Hill, C.J., Bloom, H.S., Black, A.R. & Lipsey, M.W. (2008). Empirical benchmarks for interpreting effect sizes in research. Child Development Perspectives, 2(3): 172-175.
International Labour Organization (2017). Global estimates of child labour: Results and trends, 2012-2016. Geneva.
Kaffenberger, M. (2020). Modeling the Long-Run Learning Impact of the COVID-19 Learning Shock: Actions to (More Than) Mitigate Loss. Oxford: RISE.

51
Kaffenberger, M. & Pritchett, L. (2020). Failing to plan: Estimating the impact of achieving schooling goals on cohort learning. Oxford: RISE.
King, K.M., Crouch, L., Wils, A. and Baum, D.R. (2020), How well are we measuring access to early childhood education?. In Wiseman, A.W. (ed.), Annual Review of Comparative and International Education 2019. Bingley: Emerald Publishing: 171-189.
Kuhfeld, M. (2019). Surprising new evidence on summer learning loss. Phi Delta Kappan, 101(1): 25-29. Maldonado, J.E. & De Witte, K. (2020). The effect of school closures on standardised student test outcomes.
Leuven: Katholieke Universiteit Leuven. Millet, B. & Shah, M. (2012). The effects of in-utero shocks on cognitive test scores: Evidence from droughts
in India. Oakland: University of California. Mohohlwane, N, Taylor, S. & Shepherd, D. (2020). COVID-19 and basic education: Evaluating the initial
impact of the return to schooling. Pretoria: Department of Basic Education. Sabates, R., Carter, E. & Stern, J. (2020). Using educational transitions to estimate learning loss due to
Covid-19 school closures: The case of Complementary Basic Education in Ghana. Cambridge: University of Cambridge.
Singh, A. (2019). Learning more with every year: School year productivity and international learning divergence. Journal of the European Economic Association, 18(4): 1770–1813.
Slade, T.S., Piper, B., Kaunda, Z., King, S. & Ibrahim, H. (2017). Is ‘summer’ reading loss universal? Using ongoing literacy assessment in Malawi to estimate the loss from grade-transition breaks. Research in Comparative & International Education, 12(4): 461-485.
Smith, W.C. (2020). Potential long-term consequences of school closures: Lessons from the 2013-2016 Ebola pandemic. Durham: Research Square.
Taylor, S. (2011). Uncovering indicators of effective school management in South Africa using the National School Effectiveness Study. Stellenbosch: University of Stellenbosch.
Thamtanajit, K. (2020). The impacts of natural disaster on student achievement: Evidence from severe floods in Thailand. Journal of Developing Areas, 54(4): 129-143.
Times of India (2018). Govt-NGO partnership sees improvement in quality of education in primary schools. Delhi. 24 August.
UNESCO Institute for Statistics (UIS) (2018). Costs and benefits of different approaches to measuring the learning proficiency of students (SDG Indicator 4.1.1). Montreal.
UNESCO Institute for Statistics (UIS) (2019). How fast can levels of proficiency improve? Examining historical trends to inform SDG 4.1.1 scenarios. Montreal.
UNESCO Institute for Statistics (UIS) (2020). Evidence-based projections and benchmarks for SDG Indicator 4.1.1. Montreal.
UNESCO (2006). Education for All global monitoring report 2007: Strong foundations. Paris. UNESCO (2015). EFA Global Monitoring Report 2015: Education for all 2000-2015: Achievements and challenges.
Paris. UNESCO (2020). Global Education Monitoring Report 2020: Inclusion and education – All means all. Paris. UNICEF (2019). The state of the world’s children 2019: Children, food and nutrition. New York. United Nations (2015). Sendai Framework for Disaster Risk Reduction 2015-2030. New York. United Nations Development Group (2015). Socio-economic impact of ebola virus disease in West African
countries. New York: United Nations. Van Huizen, T. & Plantenga, J. (2018). Do children benefit from universal early childhood education and
care? A meta-analysis of evidence from natural experiments. Economics of Education Review, 66: 206-222.
World Bank (2018). World Development Report 2018: Learning to realize education’s promise. Washington. World Bank (2019). Ending learning poverty: What will it take? Washington. World Bank (2020a). The impact of the COVID-19 pandemic on education financing. Washington.

52
World Bank (2020b). The COVID-19 pandemic: Shocks to education and policy responses. Washington. World Food Programme (2013). State of school feeding worldwide 2013. Rome. World Health Organization (2020). Annex to Considerations in adjusting public health and social measures
in the context of COVID-19, 14 September 2020. Geneva. Wills, G. (2020). Teachers’ unions and industrial action in South African primary schools: Exploring their
impacts on learning. Development Southern Africa, 37(2): 328-347. Yoshikawa, H. & Kabay, S. (2015). The evidence base on early childhood care and education in global
contexts. Paris: UNESCO.