pam golding properties research winter 2016...price inflation in different regions and price-bands...
TRANSCRIPT
Pam Golding Properties Research
Winter 2016
FOCUS ON AFFORDABILITY
First-time buyers and focus on affordability fuel lower price band housing boom P5
CAPE STILL KING
Wealthy buyers flock to Cape, boosting metros and towns along Wine and Garden Routes P3
PROPERTY SA’S ASSET OF CHOICE
Investors favour “real” assets and diversify offshore during economic uncertainty P8
Insights into the dynamics of the Residential Property Market
The continued resilience of the South African housing market this year has been somewhat surprising, given that it is occurring against a background of persistently weak economic growth and a slow, but steady increase in interest rates.
It seems the strength of the national housing market is largely attributable to two dominant trends: the continued outperformance of the Western Cape market relative to the national market and the robust growth in the prices of homes in the lower income price band.
The Cape’s outperformance reflects the continued migration of South Africans to the Western Cape. This is not only bolstering the housing market in Cape Town but also in towns along the Wine and Garden Routes.
South Africa’s young population, coupled with a renewed focus on affordability, appears to be fuelling the demand for properties in lower price bands. This may partially explain why house price inflation for smaller sectional title units has been outperforming growth in prices for larger freehold homes in recent years. Finally, during periods of economic uncertainty and financial market volatility, individuals often turn to more stable, real assets like property. A recent survey revealed that real estate is the most popular asset class among South African investors while globally, large investors seeking to bolster their returns are increasing their exposure to property. It seems property - both local and offshore - can provide an excellent investment opportunity during what can only be described as uncertain times.
Welcome to the Winter 2016
issue of The Study, incorporating
the Pam Golding Residential
Property Index
Dr Andrew Golding Chief Executive
Pam Golding Properties Research 1
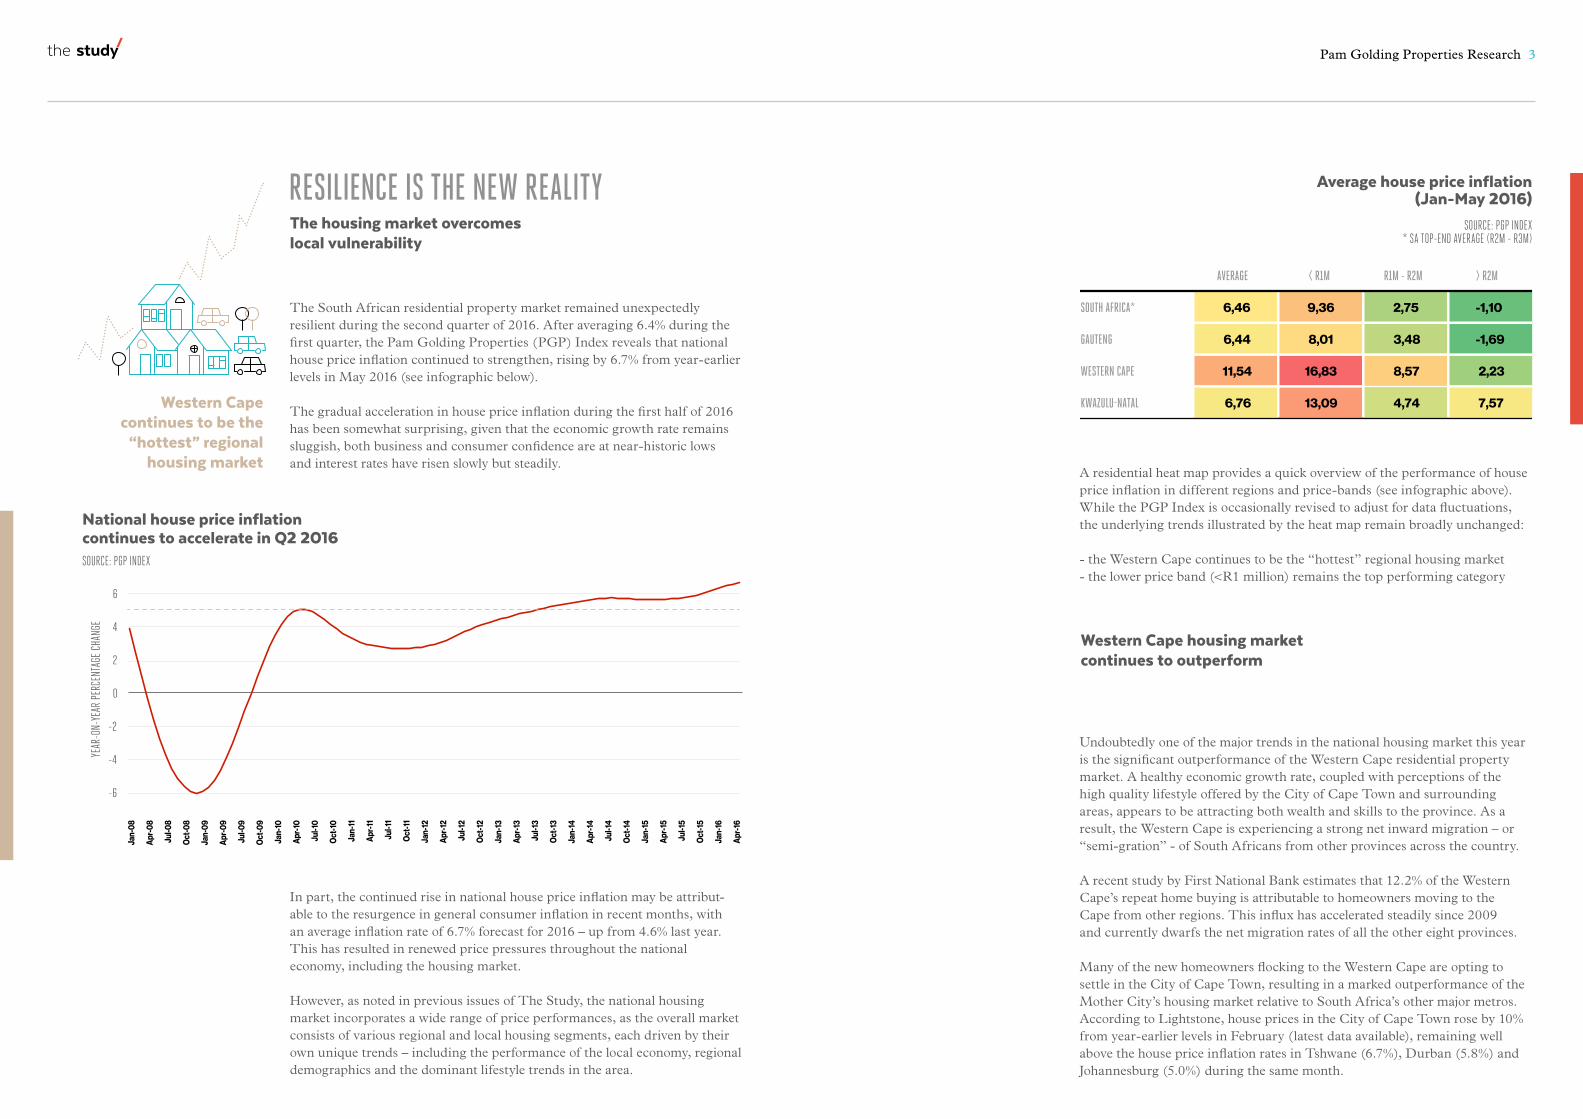
A residential heat map provides a quick overview of the performance of house price inflation in different regions and price-bands (see infographic above). While the PGP Index is occasionally revised to adjust for data fluctuations, the underlying trends illustrated by the heat map remain broadly unchanged:
- the Western Cape continues to be the “hottest” regional housing market- the lower price band (<R1 million) remains the top performing category
Average house price inflation (Jan-May 2016)
SOURCE: PGP INDEX * SA TOP-END AVERAGE (R2M - R3M)
AVERAGE < R1M R1M - R2M > R2M
SOUTH AFRICA* 6,46 9,36 2,75 -1,10
GAUTENG 6,44 8,01 3,48 -1,69
WESTERN CAPE 11,54 16,83 8,57 2,23
KWAZULU-NATAL 6,76 13,09 4,74 7,57
Undoubtedly one of the major trends in the national housing market this year is the significant outperformance of the Western Cape residential property market. A healthy economic growth rate, coupled with perceptions of the high quality lifestyle offered by the City of Cape Town and surrounding areas, appears to be attracting both wealth and skills to the province. As a result, the Western Cape is experiencing a strong net inward migration – or “semi-gration” - of South Africans from other provinces across the country.
A recent study by First National Bank estimates that 12.2% of the Western Cape’s repeat home buying is attributable to homeowners moving to the Cape from other regions. This influx has accelerated steadily since 2009 and currently dwarfs the net migration rates of all the other eight provinces.
Many of the new homeowners flocking to the Western Cape are opting to settle in the City of Cape Town, resulting in a marked outperformance of the Mother City’s housing market relative to South Africa’s other major metros. According to Lightstone, house prices in the City of Cape Town rose by 10% from year-earlier levels in February (latest data available), remaining well above the house price inflation rates in Tshwane (6.7%), Durban (5.8%) and Johannesburg (5.0%) during the same month.
Western Cape housing market continues to outperform
The South African residential property market remained unexpectedly resilient during the second quarter of 2016. After averaging 6.4% during the first quarter, the Pam Golding Properties (PGP) Index reveals that national house price inflation continued to strengthen, rising by 6.7% from year-earlier levels in May 2016 (see infographic below).
The gradual acceleration in house price inflation during the first half of 2016 has been somewhat surprising, given that the economic growth rate remains sluggish, both business and consumer confidence are at near-historic lows and interest rates have risen slowly but steadily.
In part, the continued rise in national house price inflation may be attribut-able to the resurgence in general consumer inflation in recent months, with an average inflation rate of 6.7% forecast for 2016 – up from 4.6% last year. This has resulted in renewed price pressures throughout the national economy, including the housing market.
However, as noted in previous issues of The Study, the national housing market incorporates a wide range of price performances, as the overall market consists of various regional and local housing segments, each driven by their own unique trends – including the performance of the local economy, regional demographics and the dominant lifestyle trends in the area.
The housing market overcomes local vulnerability
RESILIENCE IS THE NEW REALITY
Pam Golding Properties Research 3
Western Cape continues to be the
“hottest” regional housing market
National house price inflation continues to accelerate in Q2 2016SOURCE: PGP INDEX
-6
-4
-2
0
2
4
6
Jan-
08
Apr-
08
Jul-0
8
Oct
-08
Jan-
09
Apr-
09
Jul-0
9
Oct
-09
Jan-
10
Apr-
10
Jul-1
0
Oct
-10
Jan-
11
Apr-
11
Jul-1
1
Oct
-11
Jan-
12
Apr-
12
Jul-1
2
Oct
-12
Jan-
13
Apr-
13
Jul-1
3
Oct
-13
Jan-
14
Apr-
14
Jul-1
4
Oct
-14
Jan-
15
Apr-
15
Jul-1
5
Oct
-15
Jan-
16
YEAR
-ON-
YEAR
PER
CENT
AGE
CHAN
GE
Apr-
16
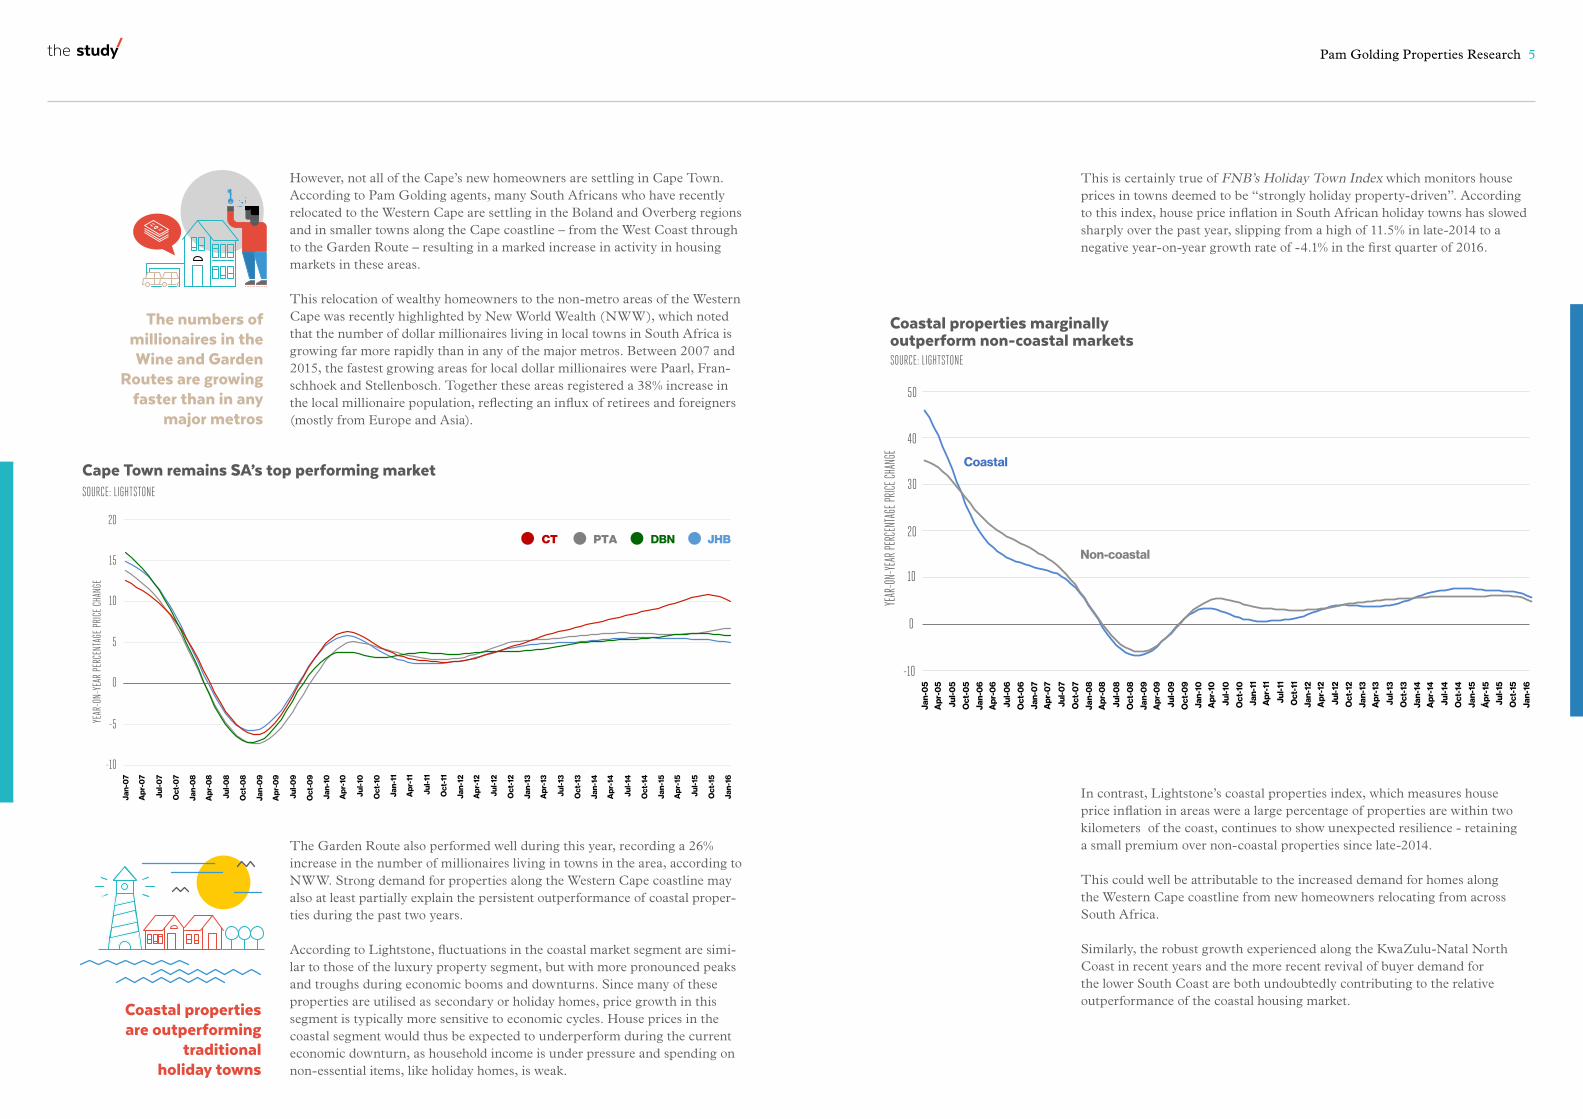
The Garden Route also performed well during this year, recording a 26% increase in the number of millionaires living in towns in the area, according to NWW. Strong demand for properties along the Western Cape coastline may also at least partially explain the persistent outperformance of coastal proper-ties during the past two years.
According to Lightstone, fluctuations in the coastal market segment are simi-lar to those of the luxury property segment, but with more pronounced peaks and troughs during economic booms and downturns. Since many of these properties are utilised as secondary or holiday homes, price growth in this segment is typically more sensitive to economic cycles. House prices in the coastal segment would thus be expected to underperform during the current economic downturn, as household income is under pressure and spending on non-essential items, like holiday homes, is weak.
Cape Town remains SA’s top performing marketSOURCE: LIGHTSTONE
However, not all of the Cape’s new homeowners are settling in Cape Town. According to Pam Golding agents, many South Africans who have recently relocated to the Western Cape are settling in the Boland and Overberg regions and in smaller towns along the Cape coastline – from the West Coast through to the Garden Route – resulting in a marked increase in activity in housing markets in these areas.
This relocation of wealthy homeowners to the non-metro areas of the Western Cape was recently highlighted by New World Wealth (NWW), which noted that the number of dollar millionaires living in local towns in South Africa is growing far more rapidly than in any of the major metros. Between 2007 and 2015, the fastest growing areas for local dollar millionaires were Paarl, Fran-schhoek and Stellenbosch. Together these areas registered a 38% increase in the local millionaire population, reflecting an influx of retirees and foreigners (mostly from Europe and Asia).
The numbers of millionaires in the Wine and Garden
Routes are growing faster than in any
major metros
Coastal properties are outperforming
traditional holiday towns
-10
-5
0
5
10
15
20
YEAR
-ON-
YEAR
PER
CENT
AGE
PRIC
E CH
ANGE
JHBCT PTA DBN
This is certainly true of FNB’s Holiday Town Index which monitors house prices in towns deemed to be “strongly holiday property-driven”. According to this index, house price inflation in South African holiday towns has slowed sharply over the past year, slipping from a high of 11.5% in late-2014 to a negative year-on-year growth rate of -4.1% in the first quarter of 2016.
In contrast, Lightstone’s coastal properties index, which measures house price inflation in areas were a large percentage of properties are within two kilometers of the coast, continues to show unexpected resilience - retaining a small premium over non-coastal properties since late-2014. This could well be attributable to the increased demand for homes along the Western Cape coastline from new homeowners relocating from across South Africa.
Similarly, the robust growth experienced along the KwaZulu-Natal North Coast in recent years and the more recent revival of buyer demand for the lower South Coast are both undoubtedly contributing to the relative outperformance of the coastal housing market.
Coastal properties marginally outperform non-coastal marketsSOURCE: LIGHTSTONE
-10
0
10
20
30
40
50
YEAR
-ON-
YEAR
PERC
ENTA
GE PR
ICE CH
ANGE
Coastal
Non-coastal
Pam Golding Properties Research 5
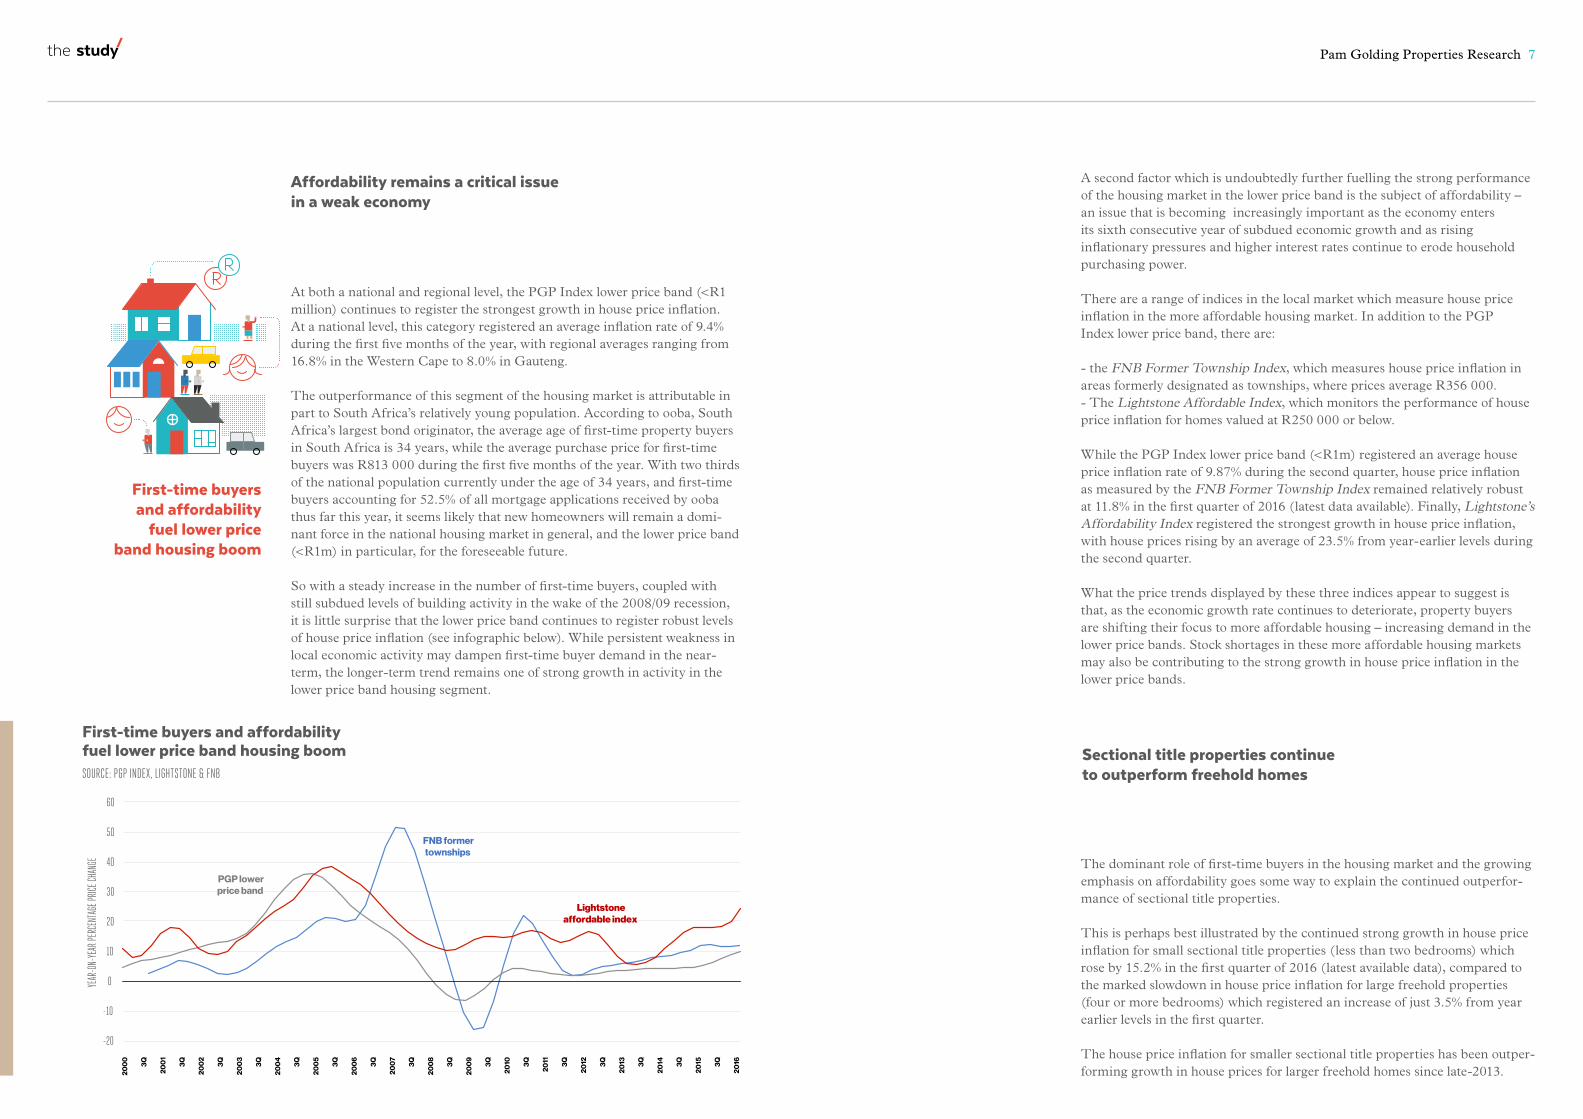
At both a national and regional level, the PGP Index lower price band (<R1 million) continues to register the strongest growth in house price inflation. At a national level, this category registered an average inflation rate of 9.4% during the first five months of the year, with regional averages ranging from 16.8% in the Western Cape to 8.0% in Gauteng.
The outperformance of this segment of the housing market is attributable in part to South Africa’s relatively young population. According to ooba, South Africa’s largest bond originator, the average age of first-time property buyers in South Africa is 34 years, while the average purchase price for first-time buyers was R813 000 during the first five months of the year. With two thirds of the national population currently under the age of 34 years, and first-time buyers accounting for 52.5% of all mortgage applications received by ooba thus far this year, it seems likely that new homeowners will remain a domi-nant force in the national housing market in general, and the lower price band (<R1m) in particular, for the foreseeable future.
So with a steady increase in the number of first-time buyers, coupled with still subdued levels of building activity in the wake of the 2008/09 recession, it is little surprise that the lower price band continues to register robust levels of house price inflation (see infographic below). While persistent weakness in local economic activity may dampen first-time buyer demand in the near-term, the longer-term trend remains one of strong growth in activity in the lower price band housing segment.
Affordability remains a critical issue in a weak economy
First-time buyers and affordability
fuel lower price band housing boom
First-time buyers and affordability fuel lower price band housing boomSOURCE: PGP INDEX, LIGHTSTONE & FNB
-20
-10
0
10
20
30
40
50
60
200
0
3Q
200
1
3Q
200
2
3Q
200
3
3Q
200
4
3Q
200
5
3Q
200
6
3Q
200
7
3Q
200
8
3Q
200
9
3Q
2010
3Q
2011
3Q
2012
3Q
2013
3Q
2014
3Q
2015
3Q
2016
YEAR
-ON-
YEAR
PERC
ENTA
GE PR
ICE CH
ANGE
FNB formertownships
Lightstoneaffordable index
PGP lowerprice band
Sectional title properties continue to outperform freehold homes
A second factor which is undoubtedly further fuelling the strong performance of the housing market in the lower price band is the subject of affordability – an issue that is becoming increasingly important as the economy enters its sixth consecutive year of subdued economic growth and as rising inflationary pressures and higher interest rates continue to erode household purchasing power.
There are a range of indices in the local market which measure house price inflation in the more affordable housing market. In addition to the PGP Index lower price band, there are:
- the FNB Former Township Index, which measures house price inflation in areas formerly designated as townships, where prices average R356 000.- The Lightstone Affordable Index, which monitors the performance of house price inflation for homes valued at R250 000 or below.
While the PGP Index lower price band (<R1m) registered an average house price inflation rate of 9.87% during the second quarter, house price inflation as measured by the FNB Former Township Index remained relatively robust at 11.8% in the first quarter of 2016 (latest data available). Finally, Lightstone’s Affordability Index registered the strongest growth in house price inflation, with house prices rising by an average of 23.5% from year-earlier levels during the second quarter.
What the price trends displayed by these three indices appear to suggest is that, as the economic growth rate continues to deteriorate, property buyers are shifting their focus to more affordable housing – increasing demand in the lower price bands. Stock shortages in these more affordable housing markets may also be contributing to the strong growth in house price inflation in the lower price bands.
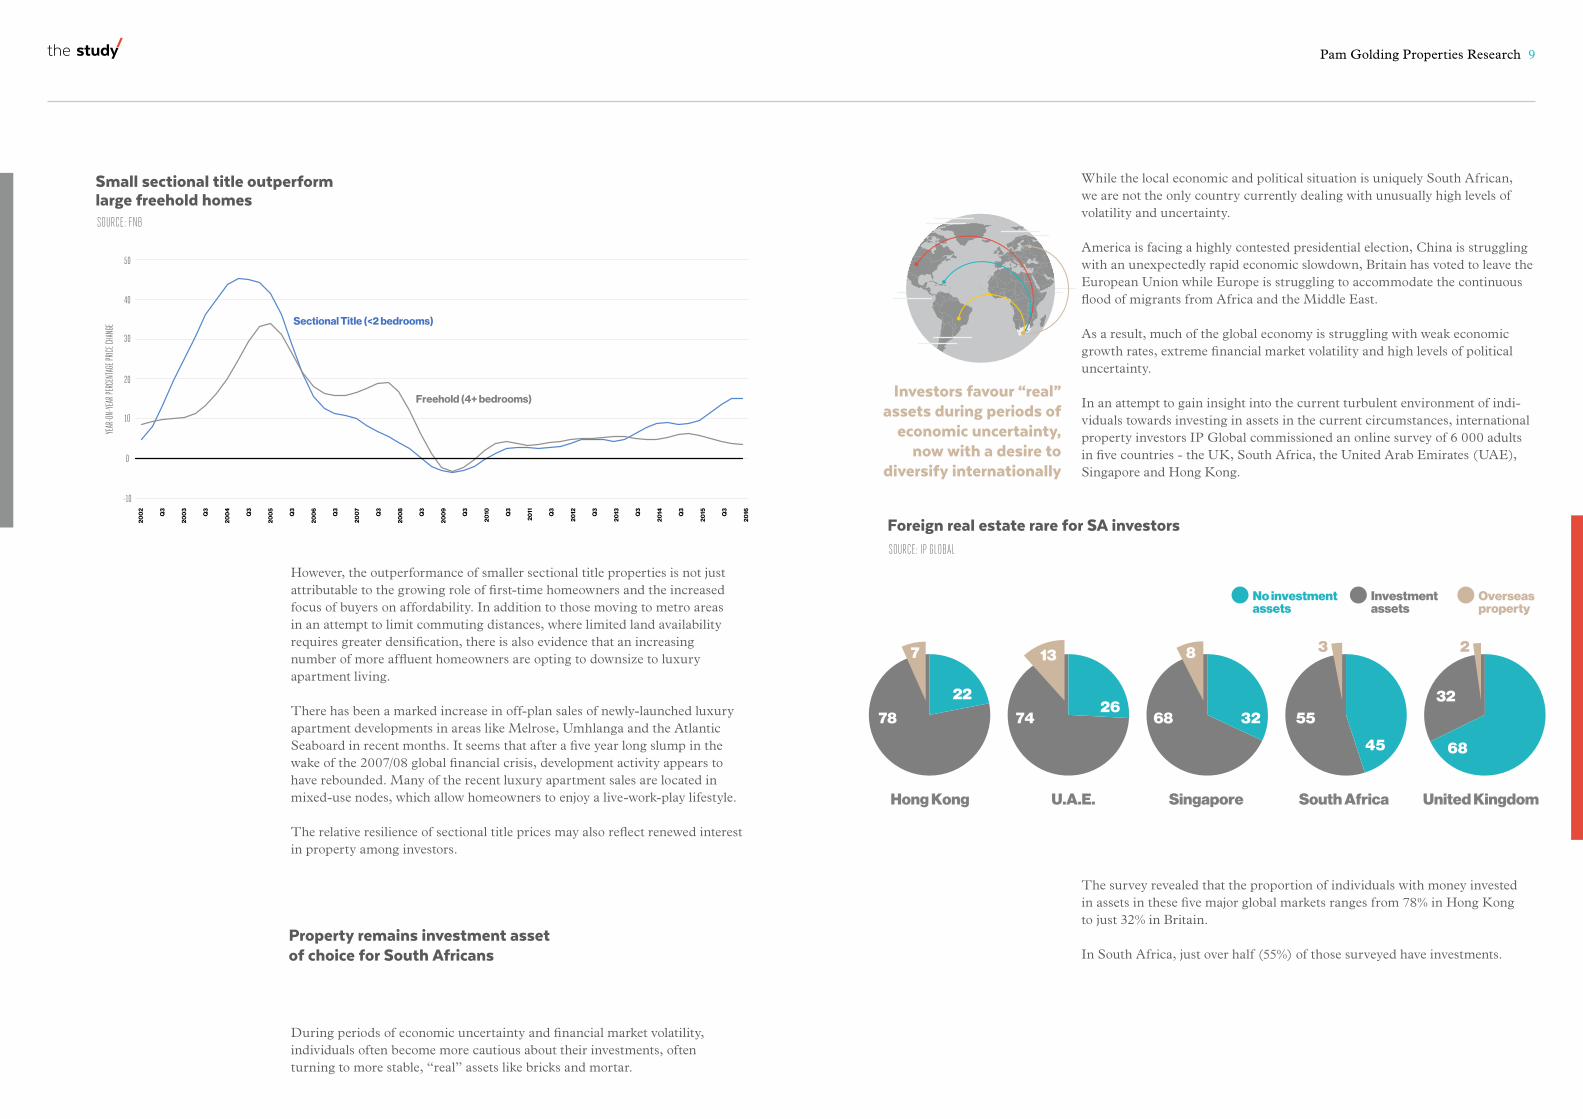
The dominant role of first-time buyers in the housing market and the growing emphasis on affordability goes some way to explain the continued outperfor-mance of sectional title properties.
This is perhaps best illustrated by the continued strong growth in house price inflation for small sectional title properties (less than two bedrooms) which rose by 15.2% in the first quarter of 2016 (latest available data), compared to the marked slowdown in house price inflation for large freehold properties (four or more bedrooms) which registered an increase of just 3.5% from year earlier levels in the first quarter.
The house price inflation for smaller sectional title properties has been outper-forming growth in house prices for larger freehold homes since late-2013.
Pam Golding Properties Research 7
Property remains investment asset of choice for South Africans
However, the outperformance of smaller sectional title properties is not just attributable to the growing role of first-time homeowners and the increased focus of buyers on affordability. In addition to those moving to metro areas in an attempt to limit commuting distances, where limited land availability requires greater densification, there is also evidence that an increasing number of more affluent homeowners are opting to downsize to luxury apartment living.
There has been a marked increase in off-plan sales of newly-launched luxury apartment developments in areas like Melrose, Umhlanga and the Atlantic Seaboard in recent months. It seems that after a five year long slump in the wake of the 2007/08 global financial crisis, development activity appears to have rebounded. Many of the recent luxury apartment sales are located in mixed-use nodes, which allow homeowners to enjoy a live-work-play lifestyle.
The relative resilience of sectional title prices may also reflect renewed interest in property among investors.
During periods of economic uncertainty and financial market volatility, individuals often become more cautious about their investments, often turning to more stable, “real” assets like bricks and mortar.
Small sectional title outperformlarge freehold homesSOURCE: FNB
-10
0
10
20
30
40
50
YEAR
-ON-
YEAR
PERC
ENTA
GE PR
ICE CH
ANGE
Sectional Title (<2 bedrooms)
Freehold (4+ bedrooms)
While the local economic and political situation is uniquely South African, we are not the only country currently dealing with unusually high levels of volatility and uncertainty. America is facing a highly contested presidential election, China is struggling with an unexpectedly rapid economic slowdown, Britain has voted to leave the European Union while Europe is struggling to accommodate the continuous flood of migrants from Africa and the Middle East.
As a result, much of the global economy is struggling with weak economic growth rates, extreme financial market volatility and high levels of political uncertainty.
In an attempt to gain insight into the current turbulent environment of indi-viduals towards investing in assets in the current circumstances, international property investors IP Global commissioned an online survey of 6 000 adults in five countries - the UK, South Africa, the United Arab Emirates (UAE), Singapore and Hong Kong.
The survey revealed that the proportion of individuals with money invested in assets in these five major global markets ranges from 78% in Hong Kong to just 32% in Britain.
In South Africa, just over half (55%) of those surveyed have investments.
Investors favour “real”assets during periods of
economic uncertainty, now with a desire to
diversify internationally
Foreign real estate rare for SA investorsSOURCE: IP GLOBAL
Hong Kong Singapore South Africa United KingdomU.A.E.
22
78 74 68 5532
2632
45 68
3 2
Overseasproperty
No investmentassets
Investmentassets
7 13 8
Pam Golding Properties Research 9
In South Africa, property is the most popular asset class, with 28% of those surveyed invested in the domestic property market. This was followed by eq-uities (25%), foreign exchange products (8%) and commodities (8%). Just 3% of the South Africans surveyed are invested in property abroad - no doubt the result of repeated bouts of Rand weakness, which has priced poten-tial investors out of many offshore property markets.
Not only do investors favour “real” assets during times of heightened econom-ic uncertainty, but there is also a desire to diversify into international markets, thereby providing a hedge against any unexpected local economic and politi-cal developments.
As a result of the desire to diversify into international markets, the survey looked at investors’ holdings of foreign properties. The UAE had the highest exposure to foreign property with 13% of those surveyed holding offshore real estate assets, while just 3% of South Africans and 2% of UK individuals are invested in foreign property.
In all five countries there was a clear preference for property investments in Australia and the UK. For South Africans, the UK was the most popular property investment destination, followed by America (34%) and Australia (29%).
The global preference among investors for property investments in countries like Japan, Australia and the UK is not surprising since all these countries are perceived as safe-haven markets, offering investors political stability, strong rule of law and ease of access. Real estate prices in these markets have also historically risen over the medium to long term.
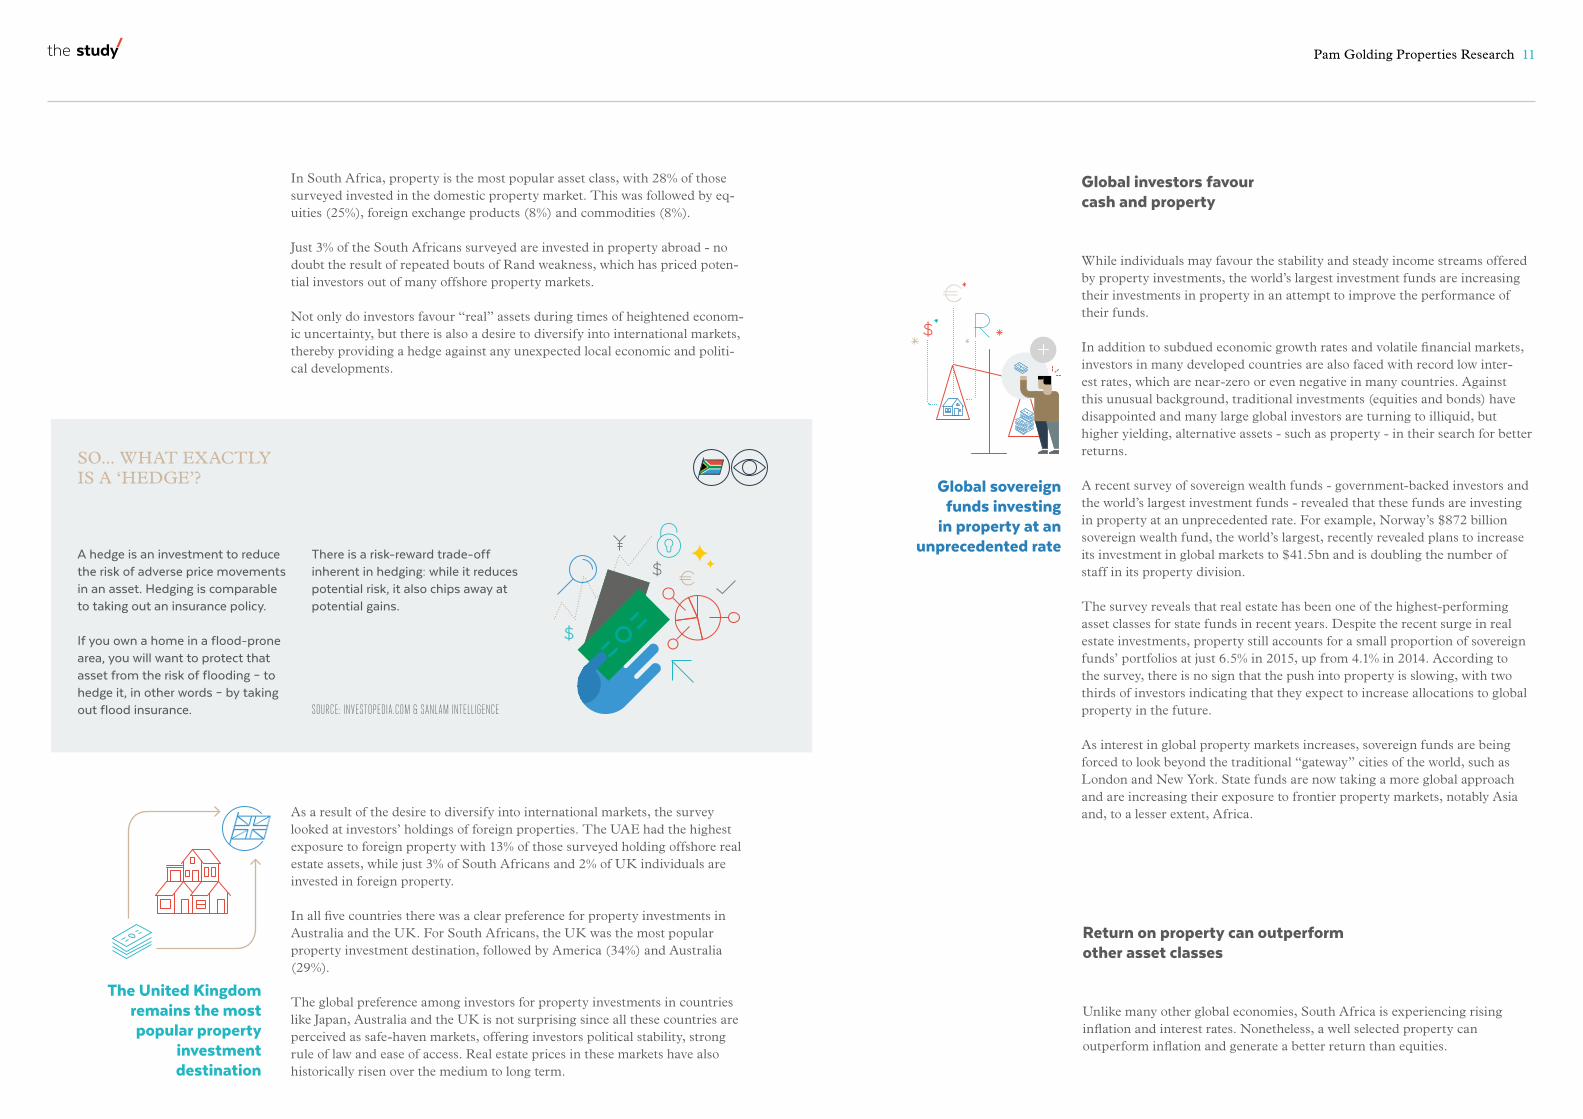
SO... WHAT EXACTLY IS A ‘HEDGE’?
A hedge is an investment to reduce the risk of adverse price movements in an asset. Hedging is comparable to taking out an insurance policy.
If you own a home in a flood-prone area, you will want to protect that asset from the risk of flooding – to hedge it, in other words – by taking out flood insurance.
There is a risk-reward trade-off inherent in hedging: while it reduces potential risk, it also chips away at potential gains.
SOURCE: INVESTOPEDIA.COM & SANLAM INTELLIGENCE
The United Kingdom remains the most popular property
investment destination
While individuals may favour the stability and steady income streams offered by property investments, the world’s largest investment funds are increasing their investments in property in an attempt to improve the performance of their funds.
In addition to subdued economic growth rates and volatile financial markets, investors in many developed countries are also faced with record low inter-est rates, which are near-zero or even negative in many countries. Against this unusual background, traditional investments (equities and bonds) have disappointed and many large global investors are turning to illiquid, but higher yielding, alternative assets - such as property - in their search for better returns.
A recent survey of sovereign wealth funds - government-backed investors and the world’s largest investment funds - revealed that these funds are investing in property at an unprecedented rate. For example, Norway’s $872 billion sovereign wealth fund, the world’s largest, recently revealed plans to increase its investment in global markets to $41.5bn and is doubling the number of staff in its property division.
The survey reveals that real estate has been one of the highest-performing asset classes for state funds in recent years. Despite the recent surge in real estate investments, property still accounts for a small proportion of sovereign funds’ portfolios at just 6.5% in 2015, up from 4.1% in 2014. According to the survey, there is no sign that the push into property is slowing, with two thirds of investors indicating that they expect to increase allocations to global property in the future.
As interest in global property markets increases, sovereign funds are being forced to look beyond the traditional “gateway” cities of the world, such as London and New York. State funds are now taking a more global approach and are increasing their exposure to frontier property markets, notably Asia and, to a lesser extent, Africa.
Global investors favour cash and property
Unlike many other global economies, South Africa is experiencing rising inflation and interest rates. Nonetheless, a well selected property can outperform inflation and generate a better return than equities.
Return on property can outperform other asset classes
Global sovereign funds investing
in property at an unprecedented rate
Pam Golding Properties Research 11
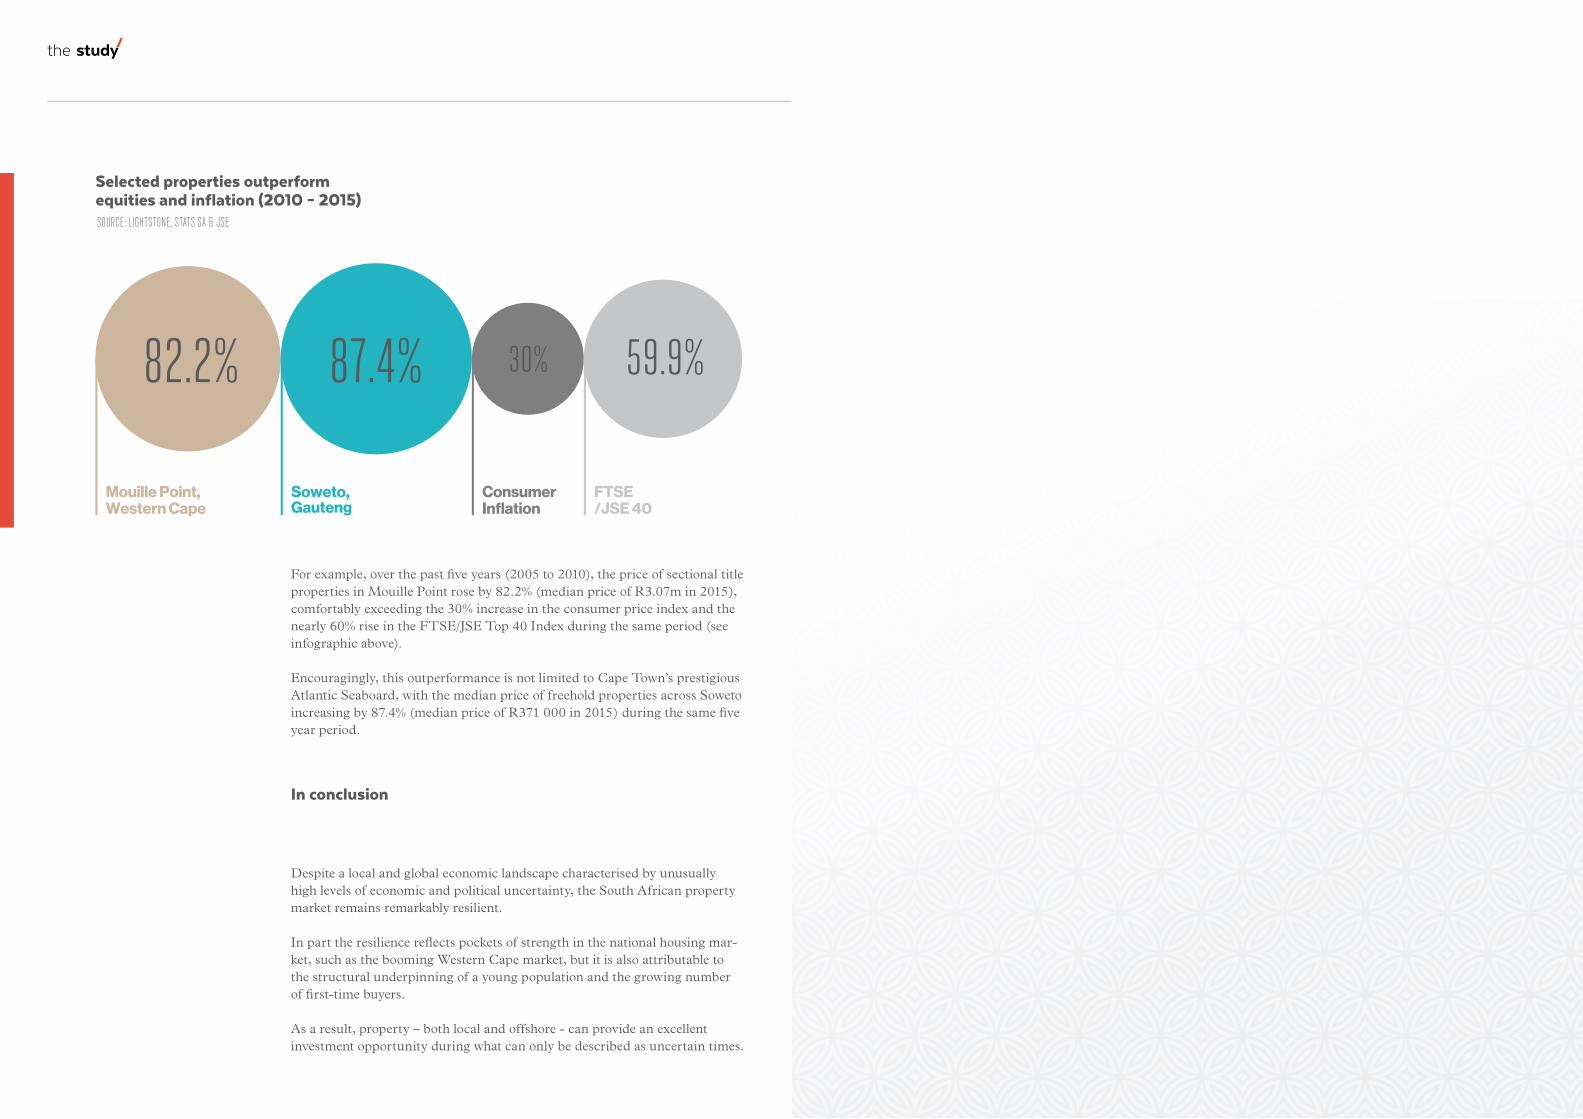
Selected properties outperformequities and inflation (2010 – 2015)SOURCE: LIGHTSTONE, STATS SA & JSE
For example, over the past five years (2005 to 2010), the price of sectional title properties in Mouille Point rose by 82.2% (median price of R3.07m in 2015), comfortably exceeding the 30% increase in the consumer price index and the nearly 60% rise in the FTSE/JSE Top 40 Index during the same period (see infographic above).
Encouragingly, this outperformance is not limited to Cape Town’s prestigious Atlantic Seaboard, with the median price of freehold properties across Soweto increasing by 87.4% (median price of R371 000 in 2015) during the same five year period.
Despite a local and global economic landscape characterised by unusually high levels of economic and political uncertainty, the South African property market remains remarkably resilient.
In part the resilience reflects pockets of strength in the national housing mar-ket, such as the booming Western Cape market, but it is also attributable to the structural underpinning of a young population and the growing number of first-time buyers.
As a result, property – both local and offshore - can provide an excellent investment opportunity during what can only be described as uncertain times.
In conclusion
Mouille Point,Western Cape
Soweto,Gauteng
ConsumerInflation
FTSE/JSE 40
pamgolding.co.za
Insights into the dynamics of the Residential Property Market