palm oil industry transformation: techno-ecological ... · •oil palm was favoured over rubber...
TRANSCRIPT

PALM OIL INDUSTRY TRANSFORMATION: TECHNO-ECOLOGICAL ECONOMIC
PERSPECTIVES
Presentation byTan Sri Datuk Dr. Yusof Basiron
Chief Executive Officer
MALAYSIAN PALM OIL COUNCIL (MPOC)

Presentation Outline
1. Importance of palm oil
2. Macro- economic Simulation Tool for Crop allocation
3. Transforming strategies involving supply & demand
4. Transforming through innovations
5. Ecological economics evolution
6. Future developments
7. Conclusions

• Leading export earner among the primary commodities
• Palm oil revenue in 2011 was 80.4 billion
• Accounts for 11% of export earnings for Malaysia
• Employs 600,000 people
• Developed rural townships
• Successful Felda Global ventures listing
1. Importance of palm oil

• Build a macro-econometric model for Malaysian rubber and oil palm sector (144 equations)
• Have an objective function such as Minimizing deviation from a target GDP, and other important variables, and subject the macro-econometric model as constraint equations
• Simulate to track future growth paths of important economic parameters as per optimal control approach
2. Macro-econometric Simulation Tool for Crop Allocation

Outcome of optimal control analysis
Simulation results:-
• Oil palm was favoured over rubber leading to dominance of oil palm cultivation in the 70s, 80s and 90s
• Simulation using data of 70s and 80s did show rubber becoming attractive again in late 90s and beyond
• Rubber price has increased from RM 3 to RM14 per kilo recently (increased > 4 times)
• In comparison, palm oil price increase was from RM 2 to RM 4/kg recently(2 times)
• Will palm oil price increase from RM 3/kilo now to RM 14/kilo in the near future to follow the rubber trend?
• Crop allocation is a function of price and business profit potential

• Palm oil revenue rising from RM 3 billion in 1980 to RM 80.4 billion in 2011, even though price only doubled
• Price stabilization strategy is able to support future remunerative price levels through:-i. replanting to remove excess supply
ii. burning as biofuel to increase demand
• Outcome: Economic boom in rural townships, cooking oil subsidy, poverty eradication, and widespread distribution of income, unlike other commodities, e.g. timber, petroleum
3. Transforming strategies involving supply and demand

i. Dietary manipulations of fatty acids in human “diet”
ii. Blending of palm and soya oils
iii. Humans taking this blend had improved human HDL/LDL cholesterol ratios
iv. Reduced cardiovascular risk
v. This fatty acid blend could replace trans-fats margarine & other solid fats
vi. Patent resulted in successful product commercialization
IMPACT: Palm oil imports in USA soared from 250,000 to >1 million tonnes during last 10 years
4. Transformation through innovationsSmart Balance
0
100
200
300
400
PALM RICE BRAN COCONUT CORN RAPE SOYABEAN SUNFLOWER
TO
CO
TR
IEN
OL
S C
ON
TE
NT
(m
g/k
g o
il)
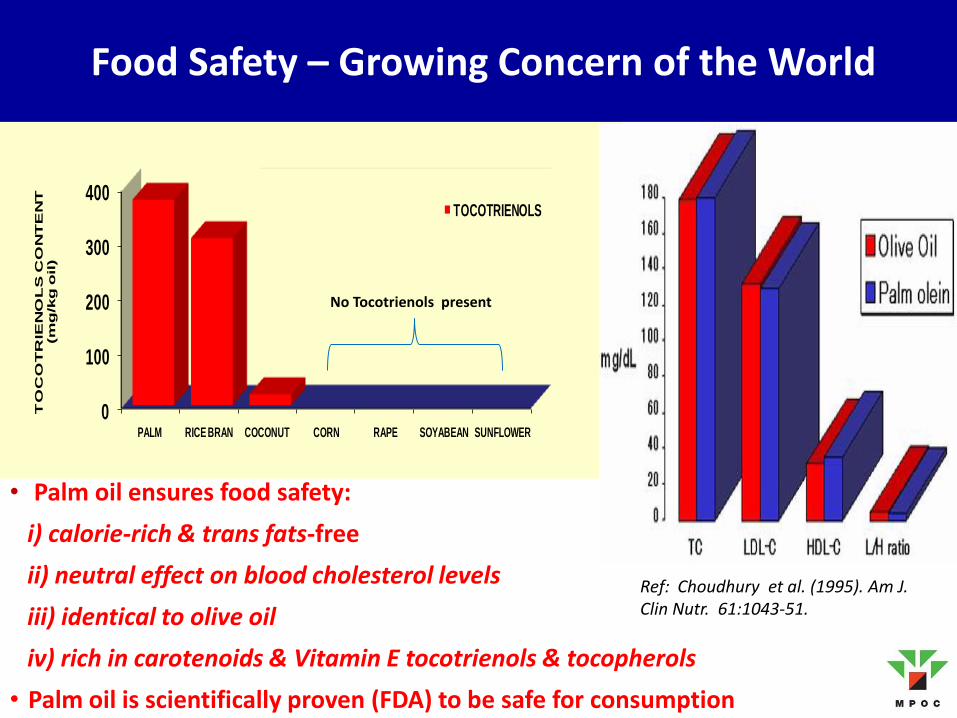
TOCOTRIENOLS
Ref: Choudhury et al. (1995). Am J. Clin Nutr. 61:1043-51.
Food Safety – Growing Concern of the World
• Palm oil ensures food safety:
i) calorie-rich & trans fats-free
ii) neutral effect on blood cholesterol levels
iii) identical to olive oil
iv) rich in carotenoids & Vitamin E tocotrienols & tocopherols
• Palm oil is scientifically proven (FDA) to be safe for consumption
No Tocotrienols present

• New technology of continuous milling system
• Investment in research yields large returns
• Reduce manpower requirements (labour shortage big issue )
• CBIP (Malaysian company) is big technology provider & brings in much revenue to country
Transformation through innovations: Milling process

• Limits to growth, potential price increase of palm oil by 3 times?
• Peak Oil Society, and depleting petroleum, creating fuel demand
• Emergence of biofuel demand, price increase effect
5. Ecological economics evolution
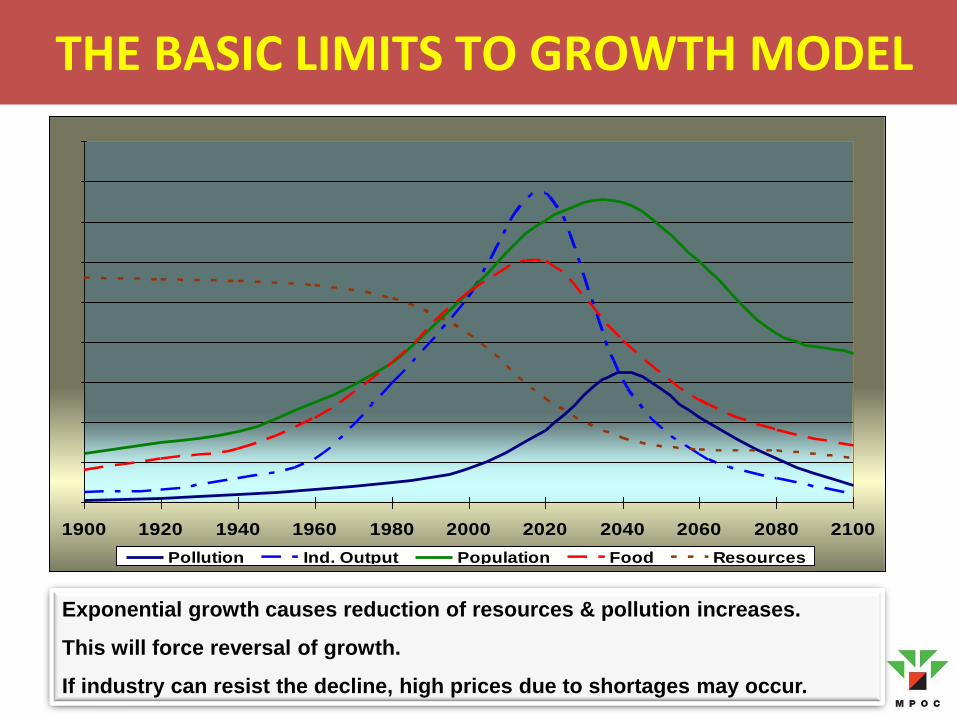
THE BASIC LIMITS TO GROWTH MODEL
1900 1920 1940 1960 1980 2000 2020 2040 2060 2080 2100
Pollution Ind. Output Population Food Resources
Exponential growth causes reduction of resources & pollution increases.
This will force reversal of growth.
If industry can resist the decline, high prices due to shortages may occur.


Food Price
Q1 Q2 Q3
Quantity of Food
SupplyD3
D2Demand
D1
P2
P1
ELASTIC AND INELASTIC FOOD SUPPLY
High price provides incentive to improve yield – leads to increased prices and increased production.
Highly elastic to less elastic supply
S T
U

Net Importing & Exporting Countries for Oils & Fats
CanadaOthers Taiwan Nigeria
South Korea South Africa
Turkey Japan
Bangladesh Iran
Egypt Pakistan
North AfricaIndia
EU-27 China PR
-15,000 -10,000 -5,000 0 5,000 10,000 15,000 20,000 25,000 30,000
Net Importers
Net Exporters
(x 1000
tonnes)
Source: Oil World
Saudi
Indonesia
MalaysiaArgentina
BrazilUkraine
Canada
Philippines
Russia
• Many countries have become net importers of oils & fats • Food price inflation should be avoided at all costs• Malaysia can provide solution by increasing yield of palm oil and
selling it at lowest possible prices.

Net Importing Countries of Oils & Fats
0
10000
20000
30000
40000
50000
60000
70000
2000 2002 2004 2006 2008 2010 2011
Net Importing Countries
Others Bangladesh Pakistan India EU 27 China
X1,000 MT
16
100000
120000
140000
160000
180000
200000
220000
240000
20
01
20
02
20
03
20
04
20
05
20
06
20
07
20
08
20
09
20
10
20
11
F
20
12
F
20
13
F
20
14
F
20
15
F
20
16
F
20
17
F
20
18
F
20
19
F
20
20
F
('0
00
MT)
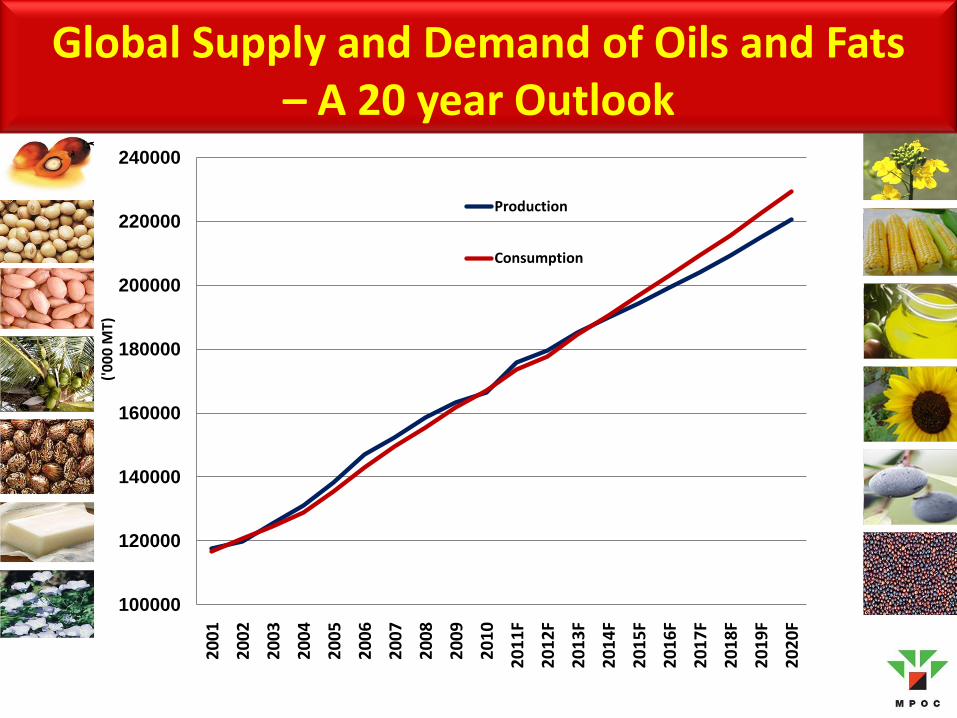
Production
Consumption
Global Supply and Demand of Oils and Fats – A 20 year Outlook

World’s growing dependence on palm oil will boost demand further into the future
0
5000
10000
15000
20000
25000
30000
35000
40000
45000
Palm Oil Soy, Rape, Sun Oils
X1,000 MT
Source: Oil World

Limited agricultural land versus population growth
• Population growing from 7 billion in 2011 to 9 billion in 2042, or 80 million people per year
• Oils and fats demand increasing by 6 million tonnesper year from a total of 180 million tonnes per year supply
• Need 0.6 million ha per year oil palm cultivation expansion, and 6 million ha per year soyabean cultivation expansion, assuming 50:50 share of supply to meet new demand

Year World’s population
(bil)
Arable land per capita
(x10-3km2)
Arable land per capita
(ha)
19221975200520302042
2.04.06.68.09.0
7.503.752.271.881.67
0.750.380.230.190.17
World’s population increasing Arable land resource decreasing
Arable Land Getting Scarcer
Source: Freeworld Academy & University of Michigan

Prices of vegetable oils trade higher relative to petroleum & they follow similar price trend
Source : James Fry (LMC International)

Source: World Bank - Food Price Watch – April 2011(http://www.worldbank.org/foodcrisis/foodpricewatch/april_2011.html)
• Global food prices remain high, partly due to increasing fuel prices, and the World Bank’s Food Price Index is around its 2008 peak.
• Since June 2010, an additional 44 million people fell below the $1.25 poverty line as a result of higher food prices
Figure 1 : World Bank Global Price Indices(nominal U.S. dollar prices, 2000 = 100)

OILS & FATS STOCKS USAGE RATIO2007 – 2012F
0
500
1,000
1,500
2,000
2,500
3,000
3,500
4,000
10.80%
11.00%
11.20%
11.40%
11.60%
11.80%
12.00%
12.20%
12.40%
12.60%
2007 2008 2009 2010 2011 2012F
('000 T)
Stock Usage Ratio CPO Price (RM)

• Forest conservation and development needs
• National commitment to forest conservation
• National Communication on Malaysia’s GHG balance submission to UNFCCC (nc2)
• Green protectionisms
Sustainability Considerations

0
10
20
30
40
50
60
70
% Forest
Average: 25.5% Average: 57%
Producing palm oil helps save forests in many developed and developing nations

Forest Sustainability: Developing countries forced by
ENGOs to sacrifice developments without compensation
Trends in deforestation in selected countries (1990-2010)
Country Forest area(‘000 ha)
Annual Change Rate (%)*
2000 2005 2010 2000-2005 2005-2010
Australia 154,920 153,920 149,300 -0.13 -0.61
Indonesia 99,409 97,857 94, 432 -0.31 -0.71
Argentina 31,861 30,599 29,400 -0.81 -0.80
Malaysia 21,591 20,890 20,456 -0.66 -0.42Note: * - ve percentage means deforestation
Source: FAO Global Forest Resources Assessment (2010)
• Malaysia would not deforest to produce more palm oil to feed additional 2.3 bil people
• Committed to Rio Summit pledge – to maintain at least 50% of total land area under forest

M t CO2
Carbon Footprint
Palm oil carbon foot print is only 0.0374% but made as a scapegoat
Sources of GHG emissions(CO2 equivalent)
Crop contribution to carbon stock loss (GHG emission)
Responses to Challenges Ahead

82 100*
167
147*
35.6 26.9
40.5 49
147
217
0
50
100
150
200
250
300
350
Forest
Palm Plantation
Palm Plantation
Forest
Total Co2
Removal by LULUCF249.8
Total Co2 Emission223.1
Total Co2 Emission292.9
Total Co2 Removal by LULUCF
247
Emission by LULUCF + Agriculture (Rice) Sectors
Emission by Others
Emission by EnergySector
MALAYSIAN GREENHOUSE GAS EMISSION AND REMOVAL
Land Use, Land Use Change and Forestry (LULUCF) is made up of Forestry and (Oil Palm) Plantation Sector
* Trend Estimate
CO2
MT
2000 2007

8,000 kmSoy Biodiesel
Sundiesel (BtL)
Rapeseed Biodiesel
Bioethanol
Jatropha Biodiesel
Biomethane
Palm Biodiesel
23,660 km
33,000 km
45,500 km
75,330 km
99,600 km
109,000 km
Yield per hectare
6,000 litre
4,980 litre
4,050 litre
2,500 litre
2,500 litre
1,300 litre
440 litre
Source: “Biofuels”, Fachagentur Nachwachsende Rohstoffe e.V. (FNR), 2006 ; Preusser (2008) and own data

• Corporate strategy driven, reinvestment strategies
• More overseas investments and partnerships
• More technological inputs for growth:i. increase yield & productivityii. improve sustainability
• Malaysian technological service providers
• NKEA focusing on downstream industry development
• Diversification into biomass industry
6. Future developments

Work towards the new CSR modelCorporate citizenship benefits to business & society
In future, companies will have to create social contract to work alongside (not in opposition) with NGOs and governments as co-protectors of environment and co-creators of wealth
Source: Googins et al (2007)

t/h
aHigh Land Productivity of Oil Palm
Productivity of oil palm is:
• 11x more thansoyabean
• 10x more than sunflower
• 7x more than rapeseed
• Only ½ of Oil Palm potential realized currently. When full potential realized: yields doubled
• x 20 more than soyabean
Oil palm’s highest productivity/ha of land
0
0.5
1
1.5
2
2.5
3
3.5
4
4.5
Soyabean Sunflower Rapeseed Palm Oil
Kernel Oil
Seed Oil

100% Pulverized EFB
(PEFB)
EFB Fibre + sawdust
(FEFB+SD) (50:50)
Pulverized EFB + sawdust
(PEFB+SD) ( 50:50)
Palm Biomass Briquettes
• Treated EFB can be used as a raw material for the production of palm based biomass briquettes
• As a substitute raw material for commercial sawdust briquette industry
• Made either from 100% palm biomass or mixed with sawdust


Production & Processing of palm oil – a sustainable process with minimal carbon footprint
• Almost all palm oil by-products can be used
i) EFBs as fibers, fuel, mulch
ii) Empty shell husks as fertilizer or to fortify concrete
iii) POME for electricity generation

• Tools are available for analyzing the economic contributions of the oil palm industry
• Oil palm undergoing transformation into a strategic commodity with high price potential
• Corporate investments will be global
• Diversification into biomass and technological services for new growth
7. Conclusions

THANK YOU
Visit my blog: http://www.ceopalmoil.com
