palm beach county, florida water utilities department
TRANSCRIPT

Palm Beach County, Florida Water Util ities Department
COMPREHENSIVE ANNUAL FINANCIAL REPORTFiscal Years Ended September 30, 2020 and 2019
Water Treatement Plant #3 Delray Beach, FL
An Enterprise Fund Department of the Palm Beach County, Florida Board of County Commissioners


PALM BEACH COUNTY, FLORIDA WATER UTILITIES DEPARTMENT
COMPREHENSIVE ANNUAL FINANCIAL REPORT
FISCAL YEARS ENDED SEPTEMBER 30, 2020 AND 2019
An Enterprise Fund Department of the Palm Beach County, Florida Board of County Commissioners
Finance and Accounting Section of the
Water Utilities Department of Palm Beach County


PALM BEACH COUNTY, FLORIDA WATER UTILITIES DEPARTMENT
COMPREHENSIVE ANNUAL FINANCIAL REPORT
Fiscal Years Ended September 30, 2020 and 2019
T A B L E O F C O N T E N T S
PAGE
Introductory Section Transmittal Letter ........................................................................................................................................ 1 Certificate of Achievement for Excellence in Financial Reporting ........................................................ 6 Principal Officials ......................................................................................................................................... 7 WUD Management Staff ............................................................................................................................. 8 County Organizational Structure .............................................................................................................. 9 Service Area and Major Facilities Map ................................................................................................... 10
Financial Section Independent Auditor's Report ................................................................................................................. 11 Management's Discussion and Analysis (required supplementary information) (unaudited) ...... 15 COMPARATIVE FINANCIAL STATEMENTS:
Statements of Net Position .................................................................................................................. 22 Statements of Revenues, Expenses, and Changes in Net Position ................................................ 24 Statements of Cash Flows.................................................................................................................... 25 Notes to Financial Statements .......................................................................................................... ..27
Required Supplementary Information (unaudited): Schedule of Proportionate Share of the Net Pension Liability and Contributions to Florida Retirement System Pension Plan…………………………………………………………………....50 Schedule of Proportionate Share of the Net Pension Liability and Contributions to Health
Insurance Subsidy Pension Plan………………………………………………….………………....51 Schedule of Changes in the Total Other Post Employment Benefits Liability and Related Ratios………….. ................................................................................................................................. 52
Supplementary Information: Budgetary Comparison Schedule - Revenues, Expenses (natural classification), and
Changes in Net Position .................................................................................................................. 54 Budgetary Comparison Schedule - Revenues, Expenses (functional classification), an
Changes in Net Position ................................................................................................................... 55
Statistical Section (Unaudited) Statistical Section Contents ....................................................................................................................... 57 Net Position by Component ..................................................................................................................... 61 Revenues, Expenses, and Changes in Net Position ............................................................................... 62 Operating Revenues by Source and Operating Expenses by Function .............................................. 64 Potable Water Sold by Customer Type ................................................................................................... 68


PALM BEACH COUNTY, FLORIDA WATER UTILITIES DEPARTMENT
COMPREHENSIVE ANNUAL FINANCIAL REPORT
Fiscal Years Ended September 30, 2020 and 2019
T A B L E O F C O N T E N T S (continued)
PAGE Ten Largest Customers .............................................................................................................................. 69 Average Residential Customer's Monthly Billing ................................................................................. 70 Residential Customer's Monthly Bill Comparison (selected utilities) ................................................ 71 Potable Water Dwelling Units Data ........................................................................................................ 72 Wastewater Dwelling Units Data ............................................................................................................ 73 Potable Water Meter Data ......................................................................................................................... 74 Customer Rate Schedules ......................................................................................................................... 76 Ratio of Outstanding Debt by Type ......................................................................................................... 90 Pledged-Revenue Coverage ..................................................................................................................... 91 Connection Fees and Expansion Percentages ........................................................................................ 92 Demographic and Economic Statistics .................................................................................................... 94 Principal Employers .................................................................................................................................. 95 Residential Building Permit Data ............................................................................................................ 96 Number of Positions by Function ............................................................................................................ 99 Operating and Capital Asset Statistics .................................................................................................. 100 Potable Water Variance Analysis ........................................................................................................... 104 Wastewater Treated ................................................................................................................................. 105
Compliance Report Independent Auditor's Report on Internal Control over Financial Reporting and on Compliance
and Other Matters Based on an Audit of the Financial Statements Performed in Accordance with Government Auditing Standards ................................................................................................... 107


Introductory Section


March 26, 2021 Honorable Dave Kerner, Mayor, and Members of the Palm Beach County Board of County Commissioners Verdenia C. Baker, County Administrator West Palm Beach, Florida Dear Ladies and Gentlemen: The Comprehensive Annual Financial Report (Annual Report) of the Palm Beach County Water Utilities Department (the Department) for the fiscal years ended September 30, 2020 and September 30, 2019, is hereby submitted. The Department is an enterprise fund of the Palm Beach County Board of County Commissioners (BCC). Responsibility for both the accuracy of the data and the completeness and fairness of the presentation, including all disclosures, rests with the Department. To the best of our knowledge and belief, the enclosed data is accurate in all material respects and is reported in a manner designed to present fairly the financial position, results of operations, and cash flows of the Department. All disclosures necessary to enable the reader to gain an understanding of the Department’s financial activities have been included. INDEPENDENT AUDITOR’S REPORT RSM US LLP, Certified Public Accountants, have issued an unmodified (“clean”) opinion on the Department’s financial statements for the fiscal years ended September 30, 2020 and September 30, 2019. The independent auditor’s report is located at the front of the financial section of this report. PROFILE The Water Utilities Department is an enterprise fund operation of the BCC. The Department provides potable water, wastewater, and reclaimed water services to approximately 597,000 people located within approximately 1,300 square miles of the primarily unincorporated area of the County. In addition to serving unincorporated areas, the Department provides services directly to the residents and businesses of the Village of Royal Palm Beach, the City of Greenacres, and the Town of Haverhill. Through interlocal agreements, the Department also provides services directly to the Village of Palm Springs, the Town of Lake Clarke Shores, the Cities of Lake Worth, Boynton Beach, and Atlantis. The Cities of Belle Glade, Pahokee and South Bay are now directly served as well since the Department's May 1, 2013 absorption of the Glades Utility Authority (GUA). Palm Beach County is a political subdivision of the State of Florida and is governed by the State Constitution, general laws of the State of Florida, and the
Water Utilities Department Administration
P. O. Box 16097
West Palm Beach, FL 33416-6097
(561) 493-6000
Fax: (561) 493-6008
www.pbcwater.com ■
Palm Beach County Board of County Commissioners
Dave Kerner,
Mayor
Robert S. Weinroth, Vice Mayor
Maria G. Marino
Gregg K. Weiss
Maria Sachs
Melissa McKinlay
Mack Bernard
County Administrator
Verdenia C. Baker
“An Equal Opportunity Affirmative Action Employer”
2020 Comprehensive Annual Financial Report 1

County’s Charter. The legislative and governing body of the County is the seven-member BCC. In accordance with the County’s Charter, the Clerk & Comptroller is the Clerk of the BCC and is the official custodian of County funds and the accounting records of and for the Department. As an operating unit of the BCC, the Department reports directly to County Administration. An eleven-member Citizens’ Advisory Board provides guidance to the Department and to the BCC on rate and policy issues.
The Department applies the provisions of the Governmental Accounting Standards Board (GASB) Statement 34, “Basic Financial Statements – and Management’s Discussion and Analysis - for State and Local Governments.” GASB 34 requires that management’s discussion and analysis of the Department’s financial performance be included as an integral part of the financial statements. Your attention is directed to page 15 for this information.
FINANCIAL CONDITION
Palm Beach County is the third most populous county in the State of Florida. The real estate and construction industries comprise the mainstays of the County’s economic base. The Department’s service area continues to reflect primarily residential customers, plus some commercial and light industrial services. The COVID-19 worldwide pandemic contributed to a dramatic increase in the unemployment rate of 7.3% from 3.7% for 2020 and 2019 respectively. Significantly above the ten-year averages of 6.1% and 5.9%, and also contributed to a decreased growth rate in dwelling units for the Department’s service area to a rate of 1.0% and 1.2% for 2020 and 2019, respectively - slightly above the five-year averages of 0.91% and 0.90%. These factors, accompanied by inflation and water restrictions imposed by the South Florida Water Management District, have affected the Department financially.
To offset the impact of these factors, the Department has implemented several cost-cutting measures. Through these efforts and the implementation of rate indexing, cash reserves as of September 30, 2020 and 2019, were 178% and 140%, respectively, of annual operating expenses net of depreciation and amortization and exceeded the minimum benchmark of 25%. The Department’s aggressive turn-off policy continues to yield positive results as bad debt expense for 2020 and 2019 was 0.08% and 0.24%, respectively, compared with the five-year averages of 0.22% and
0.22% for 2020 and 2019, respectively. These numbers are well within industry standards. Expenses are expected to continue to be subject to upward pressure from increased fuel and electricity costs, and growth is expected to remain at current levels. These factors were considered when preparing the Department’s budget for fiscal year 2021. The budget forecasts that revenues will continue to be sufficient to fund operating expenses, debt service, a portion of the Department’s capital projects expenditures, and sufficient reserves.
MAJOR ACCOMPLISHMENTS & INITIATIVES
For Fiscal Year 2019 - 2020: The Department continued its commitment to becoming a Best in Class Utility through the continued implementation of five narrowly focused Strategic Objectives; Safety, CIP Program Management, Asset Management, Communication and Strategic Planning.
The Department’s many accomplishments over the past 24 months include:
The American Society of Civil EngineersFlorida Section named the Department’sWater Treatment Plant No. 8 Anion Exchangeits Project of the Year.
The Department was awarded the BestOverall Project in the Water/Wastewatercategory by the Design-Build Institute ofAmerica, Florida region.
All three major rating services re-affirmed theDepartment’s AAA bond rating.
The Department received four awards fromthe Florida Water Environment Association,including 2020 Collection System of the Year, theDavid W. York Reuse Award for the SouthernRegion Water Reclamation Facility and twoEarle B. Phelps Awards for outstandingwastewater treatment facilities for plants inPahokee and Belle Glade.
Utility Plant Operator I Marcos Marrero-Tamayo was named the 2020 OutstandingOperator by the Southeast DesaltingAssociation, an organization that includes allwater treatment plants in a 10-state region.
The WUD Geographic Information System(GIS) team was recognized as the ExemplarySystem of the Year by the Urban Information
2 Palm Beach County, Florida, Water Utilities Department

Systems Association for its “Enterprise GIS Portal Implementation” project.
Both the eastern and western service areasincurred no violations as evidenced by the2019 Annual Water Quality Reports.
Safety
The Department continues to improve the operating culture that highlights the safety for all employees and stakeholders through all tiers of the organization. Specifically, through an increased focus on training and identifying trends we regularly raise the safety bar effecting employee safety knowledge and responsibility for all employees. The Department has reduced total injuries by 3% and preventable vehicle accidents by 18% over the course of the last year. Since 2017 total injuries have been reduced by 25% and preventable vehicle accidents by 42%.
Current program highlights include:
Provided a one-day safety orientation trainingfor all new employees, which includesclassroom training, on-line learning and opendiscussion. Thirty-eight new employeesgraduated from the Department safetyprogram in 2020 a one-day safety orientationfor all new employees, which includesclassroom training, on-line learning and opendiscussion.
Continued Behavior Based Safety (BBS)Observations in support of our BBS program.Department personnel performed 418 BBSObservations in 2020.
Due to the COVID-19 pandemic, theDepartment did not perform the annualSafety audit of our water and wastewaterplants. These audits are attended by plantsupervisors, plant managers, and by RiskManagement. Once COVID-19 socialdistancing protocols are lifted, the annualsafety audits will be scheduled.
Produced 138 Lockout/Tagout (LOTO)procedures and 15 Job Hazard Analysis (JHA)forms were produced for the safety library atWTP #2. This equated to approximately 500valves and circuit breakers that wereidentified, isolated, verified and referenced inthe LOTO procedures. These documents willbe imported into Maximo, the Department’sasset management tool, which will
automatically provide them to plant technicians before maintenance activities start. The LOTO/JHA team will move to WTP08 next and prepare similar documents.
The Utility Safety Coordinator performed twounannounced safety audits in 2020.
Assisted the PBC Clerk of Court in testing thePeopleSoft on-line system for reportingemployee injuries and accidents.
For the years 2017-2020, detailed Injury andVehicle accident KPI data was imported intothe Department’s Tableau based PerformanceDashboard. These data fields are updatedmonthly. The graphical nature of Tableauallows supervisors, managers, directors andthe Utility Safety Coordinator to easily viewthe data identifying trends empowering themto tailor training for its best effect.
Program Management
The Department continues to implement Program Management to successfully deliver larger projects as the implementation of the $200 million Capital Improvement Plan (CIP) moves forward. Program Management allows the Department to direct groups of related projects in a coordinated way to obtain control and benefits that are not always available when managing projects on an individual basis. The Department is successfully increasing its annual capital expenditures, has seen marked improvement in the consistency and transparency of project delivery and is promoting staff development within the program. Department staff, in cooperation with the consultants that have been brought on to assist in the implementation of Program Management, have successfully implemented project packages.
During the past 12 months, the Department has:
Embarked on formulating an IntegratedUtility Master Plan to evaluate and determineexpansion and improvement needs for thewater, wastewater and reclaimed watersystems by examining each system’srequirements as an integrated system that willhelp guide utility decisions, budgetappropriations and project deliveryschedules.
Expanded program staff training andeducation to improve efficiency in theimplementation of the CIP, such as the
2020 Comprehensive Annual Financial Report 3

achievement of Project Management Professional certification by team members.
Improved the functionality of the CIP to allowinformation to be exported to SharePoint forproject and reporting purposes.
Procured a new program manager to continueimplementation of the CIP. Collaborated withFacilities Development & Operations (FDO) toformulate a new county-wide PPM regardingdesign-build services, in order to expedite thedelivery of larger projects
Successfully completed project packages ontime and within budget.
Asset Management
The Department continues to strive for the International Standard of ISO 55001 compliance and certification with continuous growth of our asset management program. The Department has implemented key artifacts of the ISO 55001 standard, such as Asset Management Policy, Strategic Asset Management Plan (SAMP), Business Process Modeling and Responsibilities, Accountability, Consulting, Inform (RACI) charts. These key artifacts help build the strong foundation needed to reach certification. By implementing these standards along with continuous development of Maximo Computerized Maintenance Management System (CMMS), Geographical Information System (GIS), Supervisory Control Alarming Data Acquisition (SCADA), Payroll Data (HRIS) and Business Intelligence software (Tableau), WUD can streamline maintenance using data-driven decision processes.
The framework that the Department is developing using ISO 55001 and data-driven decision-making will provide benefits to the Department, Palm Beach County and our customers by:
Setting strategic priorities that will align assetmanagement objectives with key performanceindicators.
Increase productivity and efficiency byreducing costs, managing risks and increasingreliability of assets.
Develop and retain organizational knowledgethrough competency and training.
Communication
The Department is committed to keeping all employees and stakeholders informed about all the developments and opportunities within the organization through various resources and scheduled events. The Public Information (PI) Services section is tasked with both internal and external communications. This includes building a robust social media campaign to enhance employee and community outreach. The PI team utilizes a number of tools in keeping constituents informed, including the WUD Journal, an employee magazine published quarterly, press releases and a variety of educational and promotional videos. The Department’s SharePoint site has been developed to be a one-stop resource for information, events and document sharing, while employee engagement events, such as “Harvest Fest” and the “WUD Olympics” are held on a semi-annual basis.
Future actions to implement this Objective include:
Enhanced document and content management through the SharePoint site to allow for ease in information access and exchange, as well as providing for increased efficiency in the production of work product, as errors will be minimized and there will not be a need to “reinvent the wheel” in the production of a variety of core Department documents and forms.
Expanded employee education and trainingwill provide for increased employeeengagement, as well as cross training that willresult in a more highly skilled and flexibleworkforce, resulting in the Departmenthaving the ability to respond to future needsand challenges more effectively.
Strategic Planning
The Department continues to strive to achieve its overarching Mission to provide the Best Water, Best Service and Best Environmental Stewardship through the further implementation of the latest five (5) year Strategic Sustainability Plan (SSP). The SSP identifies general overarching goals for the Department, which will be realized by implementing the “Circles of Excellence” Initiatives. The Initiatives include Workforce, Community, Environment, Infrastructure, Financial Responsibility, and Operational Excellence. Strategies and Key Performance Indicators (KPI) were subsequently assigned to the applicable Goals and
4 Palm Beach County, Florida, Water Utilities Department

Initiatives to enable the Department to make the necessary adjustments to map and measure progress and to develop an organizational culture that is focused on continuous improvement.
Future actions to implement this Objective include:
The development of individual performanceplans to incorporate into the larger scalestrategic planning process.
Implementation of the KPIs throughout theDepartment to further achieve the StrategicObjectives of the Department.
Annual assessment of the achievement of thestrategic plans and necessary adjustments toadaptively manage the Department in the faceof changing circumstances.
OTHER INFORMATION
Internal Control: In conformity with the internal control procedures established by the County, the Department is responsible for establishing and maintaining an internal control structure designed to ensure that the assets of the Department are protected from loss, theft, or misuse. Additionally, the Department’s internal controls ensure that adequate accounting data is compiled to allow for the preparation of the financial statements in conformity with accounting principles generally accepted in the United States of America. The internal control structure is designed to provide reasonable, but not absolute, assurance that these objectives are met. The concept of reasonable assurance recognizes that: (1) the cost of a control should not exceed the benefits likely to be derived; and (2) the valuation of costs and benefits requires estimates and judgment by management.
Budgetary Control: The Department’s budget is included in the County’s annual budget, which is prepared pursuant to Chapter 129, Florida Statutes, and represents the legal authority to levy taxes and expend funds for all County purposes. The Department’s budget is balanced, as required by Florida Statutes, with the inclusion of reappropriated beginning fund balances. Encumbrance accounting is applied during the year. Budgetary control is maintained in the County’s accounting system at the appropriation unit level. As part of the budget process, open encumbrances lapse at year-end and must be reappropriated in the following year and are, therefore, not reported as reserved fund balance at
year-end. Activities of the operating accounts (Revenue; Operations and Maintenance; Sinking Fund Accounts, including Bond Interest, Bond Principal, Bond Redemption, and Debt Service Reserve; Renewal and Replacement; Capital Improvement; and Connection Fee) required by covenants securing the Department’s indebtedness are included in the annual budget.
Award: The Government Finance Officers Association of the United States and Canada (GFOA) awarded a Certificate of Achievement for Excellence in Financial Reporting to Palm Beach County, Florida, Water Utilities Department for its Comprehensive Annual Financial Report (Annual Report) for the fiscal year ended September 30, 2019. This was the twenty-third consecutive year that the Department has achieved this prestigious award. In order to be awarded a Certificate of Achievement, a government must publish an easily readable and efficiently organized Annual Report. This Annual Report must satisfy both accounting principles generally accepted in the United States of America and applicable legal requirements.
A Certificate of Achievement is valid for a period of one year only. We believe that our current Annual Report continues to meet the Certificate of Achievement Program’s requirements, and we are submitting it to the GFOA to determine its eligibility for another certificate.
Acknowledgment: The preparation of the Annual Report was made possible by the dedicated services of the entire staff of the Finance and Accounting Section of the Finance and Administration Division. Each member of the Finance and Accounting Section has our sincere appreciation for the contributions made in the preparation of this report.
Very truly yours,
Jim Stiles Department Director
Kenny Rampersad Finance & Administration Director
2020 Comprehensive Annual Financial Report 5

Page 1 of 1ExportStreamingHandler.ashx
3/10/2021https://lf.gfoa.org/laserfiche/Viewer/Pdf/PrintPdfViewer.html?file=ExportStreamingHandler.ashx%3Frepo%3D...
6 Palm Beach County, Florida, Water Utilities Department
Government Finance Officers Association
Certificate of Achievement for Excellence
in Financial Reporting
Presented to
Palm Beach County, Florida Water Utilities Department
For its Comprehensive Annual Financial Report
For the Fiscal Year Ended
September 30, 2019
~ p. ~ Executive Director/CEO

PALM BEACH COUNTY, FLORIDAWATER UTILITIES DEPARTMENT PRINCIPAL OFFICIALS
Board of County CommissionersAs of September 30, 2020
Melissa McKinlayCommissioner
District 6
Hal R. ValecheCommissioner
District 1
Dave KernerMayor
District 3
Gregg K. WeissCommissioner
District 2
Mary Lou BergerCommissioner
District 5
Robert S. WeinrothVice Mayor
District 4
Mack BernardMayor
District 7
County AdministrationVerdenia C. Baker, County Administrator
Todd J. Bonlarron, Assistant County Administrator
Water Utilities DepartmentJim Stiles, Director
Water Utilities Advisory Board
Not Pictured: Arnold Katz, Clara Murvin, Beverly Scott.2020 Comprehensive Annual Financial Report 7

Water UtilitiesDirectorJim Stiles
Director F&AKenny Rampersad
Water UtilitiesDeputy DirectorAli Bayat, PE
WUD Human ResourcesManager
Wendy Mundell
Director Utility OperationsPollop
Phonpornwithoon, PE
Director Utility Customer Service Stephanie Marsh‐
Corinthian
Utilities Operations Manager
Craig Moyer
Utilities Operations Manager
Vincent Munn
Water Reclamation Plants O&M Manager
David Dalton
Utilities Operations Manager
Hector Rodriguez, PE
Laboratory ManagerStephanie Weder
Regulatory Compliance Manager
Bret Hammell, PE
Water Supply Policy & Legislation Manager
Vacant/HOLD
Director Utilities Engineering
Krystin Berntsen, PE
Administrative AssistantClaudia Coyne
Water UtilitiesAsst. Director F&AVacant/HOLD
Support Services Manager
Conrad Ailstock
Fiscal Manager IGuy Eggertsson
Manager Utility Customer Service
Ronneshia Williams
WR Customer Service Manager
Ivette Gibson
Public Information Services Manager
Shawn Reed
Utilities Asst. DirectorOperations & Maint.
John Acton
WUD MANAGEMENT STAFF
Project Manager (Plants)Vacant
Project Manager (Lines)Mark Ludwigson
Project Manager (Design)
Jackie Michels, PE
Chief CommunicatorMarla Smith
Information Technology Manger
Steven Rowley
Utility Chief Technology Officer
Alex Fleites
Director Utility MaintenanceJason Davis
Asset ManagerMelody Tungol
Utilities Maintenance Manager
Gerardo Castellano
Utilities Maintenance Manager
Anthony Armeli
Contract ManagerVictor Ortiz
- -
I I
- - - - - - -
- - - - - --
- - - -- -
- - -
-
8 Palm Beach C
ounty, Florida, Water U
tilities Departm
ent

Independent OfficialsInspector General - John Carey
Commission on EthicsMark Bannon - Executive Director
Palm Beach County Board of County Commissioners Organizational StructureElectorate
County AttorneyDenise Nieman
County AdministratorVerdenia C. Baker
LibraryDouglas Crane
Parks & RecreationEric Call
Elected Constitutional OfficersSheriff, State Attorney, Public Defender,Clerk & Comptroller, Property Appraiser,
Tax Collector, Supervisor of Elections
Equal Business OpportunityTonya Davis Johnson
Cooperative ExtensionRon Rice
Public AffairsLisa De La Rionda
Legislative AffairsRebecca DeLaRosaEnvironmental Resources Mgmt.
Deborah Drum
Tourist Development CouncilGlenn Jergensen
Medical ExaminerWendolyn Sneed
Treasure Coast RegionalPlanning CouncilThomas Lanahan
Solid Waste AuthorityDan Pellowitz
Board of County Commissioners Dave Kerner, Mayor
Robert S. Weinroth, Vice MayorHal R. Valeche, Gregg K. Weiss, Mary Lou Berger,
Melissa McKinlay, Mack Bernard
Water Resources ManagerJeremy McBryan
Criminal Justice Commission Regenia Herring
Business Development BoardKelly Smallridge
Assistant County AdministratorNancy Bolton
Solid line indicates a direct line of authority.
Dotted line indicates a partial lineof authority or funding.
Agencies with a relationship to the Board of County Commissioners
Legend
Water UtilitiesJames C. Stiles
Westgate/Belvedere Homes CRAElizee Michel
County departments, offices and agencies
Financial Management & BudgetSherry Brown
Palm Beach TransportationPlanning Agency
Nick Uhren
Florida Department of HealthPalm Beach CountyAlina Alonso, M.D.
Youth ServicesTammy Fields
Agencies with an administrative tie to Board of County Commissioners
CareerSource Palm Beach CountyJulia Dattolo, interim
Revised June 2020
Public SafetyStephanie Sejnoha
Palm TranClinton B. Forbes
Assistant County AdministratorTodd Bonlarron
Assistant County AdministratorDorritt Miller
Community RevitalizationHouston Tate
Housing & Economic SustainabilityJonathan B. Brown
Deputy County AdministratorJon Van Arnam
Housing Finance AuthorityDavid M. Brandt
Information Systems ServicesArchie Satchell
Human ResourcesWayne Condry
Fire RescueReginald Duren
Community ServicesJames Green
PurchasingKathy Scarlett
Equal OpportunityPamela Guerrier
Risk ManagementScott Marting
Engineering & Public WorksDavid L. Ricks
Planning, Zoning & BuildingRamsay Bulkeley
Internal AuditorJoe Bergeron
ResilienceMegan Houston
Assistant County AdministratorPatrick Rutter
AirportsLaura Beebe
Facilities Development & Operations Audrey Wolf
Court ProgramsBarbara Dawicke
Intergovernmental Affairs& Community Engagement
Ed Chase
2020 Comprehensive Annual Financial Report 9
2020 Com
prehensive Annual Financial Report 9

o
o
o
o
o
o
"
"
"
#*
_̂#*
_̂
#*_̂
#*
",\
,\
#*WTP 11
WRNWWTP
WRWWTP
Hillsboro Canal
West Palm Beach Canal
L-23 Canal
Miami Canal
L19 Canal
New River Canal
L-7 Can
al
L-40 Canal
L-8 Canal
L-10 Canal West Palm Beach Canal
L-15 Canal Hillsboro Canal
C-18 Canal
L-13 C
anal
M Canal
L-6 Ca
nal
L-21 Canal Bolles Canal L-16 Canal
LWDD
E-3
Cana
l
LAKE OKEECHOBEE
ATLANTICOCEAN
LOXAHATCHEEWILDLIFE REFUGE
SRWRFSROC
CUST.SVC
WTP9
WTP3
WTP2
WTP8
CROC
ECRWTF
F o r e s t H i l l B l v d
L a n t a n a R d
O k e e c h o b e e B l v d
S D
i xi e
Hw
y
Ki r
k R
d
H y p o l u x o R d
Bro
a dw
a y
S o u t h e r n B l v d
N M
i li t
a ry
T rl
SM
i lit
ary
Tr l
P u r d y L n
S J
og R
d
SC
ongr
ess
Ave
SO
live
Av e
S J
o g R
dL a k e W o r t h R d
Par
k er
Av e
M e l a l e u c a L n
N A
St
G a t o r B l v d
N o r t h l a k e B l v d
St a
t eR
o ad
15
P G A B l v d
Law
renc
eR
d
SO
cean
Blv
d
NW
2 nd
Ave
S U S H i g h w a y 2 7
NH
aver
h ill
Rd
US
High
w a y1
NO
c ean
B l vd
S S
tate
Roa
d 7
NJ o g
Rd
W I n d i a n t o w n R d
B e l v e d e r e R d
S u m m i t B l v d
O r a n g e B l v d
B o y n t o n B e a c h B l v d
H o o d R d
G u n C l u b R d
D o n a l d R o s s R d
4 5 t h S t
Oc e an
Dr
B e e L i n e H w y
C l i n t M o o r e R d
T e m p l e B l v d
Lyon
s R
d
Vill a
g e
Blv
d
NJ o
gR
d
I n d i a n t o w n R d
A t l a n t i c A ve
Lyo
nsR
d
Du d
a R
d
W Y a m a t o R d
S M a inS
t
NF
eder
alH
wy
S W 1 8 t h S t
C o u n t y R o a d 8 8 0
SO
c ea n
Bl v
d
L a k e I d a R d
U SH
igh
way
4 41
N
Cai
nB
lvd
Mi l
i ta r
y T r
l
S I
n te r
s ta t
e 9 5
G l a d e s R dN
Mil
itar
yT
rl
Alter n a t e
A 1 A
E M a i nS t
C o n n e r s H w y
Cre
s t wo
od
B lv d
N F
lori
das
Tpk
eS
Flor
idas
Tpk
e
W e l l i n g t onT r c e
P a l m e t t o P a r k R d
Hag
en R
anch
Rd
G o l f R d
St ate
Ro a d
715
N J og
Rd
M u c k C i t y R d
6 0 t h S t N
Lyon
sR
d
S t a t e R o a d 8 0
NU S
H i g h w a y 2 7
B r o w n s F a r m R d
NIn
ters
tate
9 5
Hat
ton
Hw
y
Broward County
Martin County
Hend
ry C
ount
y
J
Legend" Wastewater Treatment Plant" Water Reclamation Plant#* Water Treatment Plant_̂ Administration,\ Wetlands
Palm Beach County LimitsMandatory Reclaimed SAP.B.C.W.U.D. Service Area
PALM BEACH COUNTY, FLORIDAWATER UTILITIES DEPARTMENT
SERVICE AREA (SA) AND MAJOR FACILITIESSeptember 30, 2020
Date: 2/8/2021 Authored by: B.Kramer, Source: W:\GIS\Projects\.Other\ServiceArea\WUD-Full County-Financial (letter size).mxd
10 Palm Beach County, Florida, Water Utilities Department
10 Palm Beach C
ounty, Florida, Water U
tilities Departm
ent
Financial Section


Independent Auditor’s Report
To the Honorable Board of County Commissioners Palm Beach County, Florida Water Utilities Department Palm Beach County, Florida
Report on the Financial Statements We have audited the accompanying financial statements of the Palm Beach County, Florida Water Utilities Department (the Department) as of and for the years ended September 30, 2020 and 2019, and the related notes to the financial statements, which collectively comprise the Department’s basic financial statements as listed in the table of contents.
Management’s Responsibility for the Financial Statements Management is responsible for the preparation and fair presentation of these financial statements in accordance with accounting principles generally accepted in the United States of America; this includes the design, implementation and maintenance of internal control relevant to the preparation and fair presentation of financial statements that are free from material misstatement, whether due to fraud or error.
Auditor’s Responsibility Our responsibility is to express an opinion on these financial statements based on our audits. We conducted our audits in accordance with auditing standards generally accepted in the United States of America and the standards applicable to financial audits contained in Government Auditing Standards, issued by the Comptroller General of the United States. Those standards require that we plan and perform the audits to obtain reasonable assurance about whether the financial statements are free from material misstatement.
An audit involves performing procedures to obtain audit evidence about the amounts and disclosures in the financial statements. The procedures selected depend on the auditor’s judgment, including the assessment of the risks of material misstatement of the financial statements, whether due to fraud or error. In making those risk assessments, the auditor considers internal control relevant to the entity’s preparation and fair presentation of the financial statements in order to design audit procedures that are appropriate in the circumstances, but not for the purpose of expressing an opinion on the effectiveness of the entity’s internal control. Accordingly, we express no such opinion. An audit also includes evaluating the appropriateness of accounting policies used and the reasonableness of significant accounting estimates made by management, as well as evaluating the overall presentation of the financial statements.
We believe that the audit evidence we have obtained is sufficient and appropriate to provide a basis for our audit opinion.
Opinion In our opinion, the financial statements referred to above present fairly, in all material respects, the financial position of the Department as of September 30, 2020 and 2019, and the changes in its financial position and its cash flows for the years then ended in conformity with accounting principles generally accepted in the United States of America.
2020 Comprehensive Annual Financial Report 11

Emphasis of Matter As discussed in Note 1, the financial statements referred to above present only the Department and do not purport to, and do not, present fairly the financial position of Palm Beach County, Florida, as of September 30, 2020 and 2019, and the changes in its financial position and where applicable, its cash flows for the years then ended in conformity with accounting principles generally accepted in the United States of America. Our opinion is not modified with respect to this matter.
Other Matters
Required Supplementary Information Accounting principles generally accepted in the United States of America require that management’s discussion and analysis, the schedules of the proportionate share of net pension liability, schedules of contributions, schedule of changes in the Department’s total other postemployment benefits liability and related ratios, as listed in the table of contents, be presented to supplement the basic financial statements. Such information, although not a part of the basic financial statements, is required by the Governmental Accounting Standards Board who considers it to be an essential part of financial reporting for placing the basic financial statements in an appropriate operational, economic or historical context. We have applied certain limited procedures to the required supplementary information in accordance with auditing standards generally accepted in the United States of America, which consisted of inquiries of management about the methods of preparing the information and comparing the information for consistency with management’s responses to our inquiries, the basic financial statements and other knowledge we obtained during our audits of the basic financial statements. We do not express an opinion or provide any assurance on the information because the limited procedures do not provide us with evidence sufficient to express an opinion or provide any assurance.
Other Information Our audits were conducted for the purpose of forming an opinion on the financial statements that collectively comprise the Department’s basic financial statements. The introductory section, supplementary information contained in the financial section and the statistical section are presented for purposes of additional analysis and are not a required part of the basic financial statements.
Such information is the responsibility of management and was derived from and relates directly to the underlying accounting and other records used to prepare the basic financial statements. The supplementary information contained in the financial section has been subjected to the auditing procedures applied in the audits of the basic financial statements and certain additional procedures, including comparing and reconciling such information directly to the underlying accounting and other records used to prepare the basic financial statements or to the basic financial statements themselves, and other additional procedures in accordance with auditing standards generally accepted in the United States of America. In our opinion, the supplementary information contained in the financial section is fairly stated in all material respects in relation to the basic financial statements taken as a whole.
The introductory and statistical sections have not been subjected to the auditing procedures applied in the audit of the basic financial statements and, accordingly, we do not express an opinion or provide any assurance on them.
12 Palm Beach County, Florida, Water Utilities Department

Other Reporting Required by Government Auditing Standards In accordance with Government Auditing Standards, we have also issued our report dated March 26, 2021 on our consideration of the Department’s internal control over financial reporting and on our tests of its compliance with certain provisions of laws, regulations, contracts, grant agreements and other matters. The purpose of that report is solely to describe the scope of our testing of internal control over financial reporting and compliance and the results of that testing, and not to provide an opinion on the effectiveness of the Department’s internal control over financial reporting or on compliance. That report is an integral part of an audit performed in accordance with Government Auditing Standards in considering the Department’s internal control over financial reporting and compliance.
West Palm Beach, Florida March 26, 2021
2020 Comprehensive Annual Financial Report 13

BEST WATER, BESTSERVICE&
BESTENVIRONMEN
TALS
TEW
ARDS
HI
P.
14 Palm Beach County, Florida, Water Utilities Department

WATER UTILITIES DEPARTMENT OF PALM BEACH COUNTY, FLORIDA Management’s Discussion and Analysis (unaudited)
This section of the Department’s annual financial report presents our discussion and analysis of the Department’s financial performance during the fiscal years ended September 30, 2020 (FY 2020) and September 30, 2019 (FY 2019). Please read it in conjunction with the preceding transmittal letter and the financial statements that follow.
FINANCIAL HIGHLIGHTS
The Department’s net position increased by $64.8 million, or 5.0%, during FY 2020 and increased by $45.5 million, or 3.6%, during FY 2019.
Long-term debt (net of the current portion) decreased by $7.6 million, or 4.8%, in FY 2020 compared to a decrease of $7.6 million, or 4.6%, in FY 2019.
Operating revenues in FY 2020 totaled $217.9 million, an increase of $13.0 million, or 6.3%, compared with $204.9 million in FY 2019, an increase of $7.7 million, or 3.9% from the previous year. FY 2020 included the effect of rate indexing and a .97% increase in the customer base. FY 2019 included the effect of rate indexing and a 1.2% increase in the customer base.
Operating expenses before depreciation and amortization and equity interest in net loss of joint venture, totaled $143.0 million, a decrease of $15.2 million, or 9.6%, in FY 2020 compared to $158.2 million, for an increase of $31.2 million, or 24.6%, for FY 2019.
Non-operating income decreased by $2.1 million, or 45.7%, in FY 2020 compared to a FY 2019 increase of $3.5 million, or 318.2%.
The Department showed net income before contributions, transfers and special items of $26.3 million for FY 2020, an increase of $24.1 million, or 1,095.5%, and showed net income before contributions of $2.2 million for FY 2019, a decrease of $22.0 million, or 90.9%.
FINANCIAL STATEMENTS OVERVIEW
Financial Reporting Entity – The Water Utilities Department is an enterprise fund operation of the
Palm Beach County Board of County Commissioners (BCC). As such, the Department’s financial operations are maintained on the full accrual basis of accounting: revenues are recognized when earned, and expenses are recognized when incurred. The Department provides potable water, wastewater, and reclaimed water services to approximately 597,000 people located within approximately 1,300 square miles of the primarily unincorporated area of the County. In addition to serving unincorporated areas, the Department provides services directly to the residents and businesses of the Village of Royal Palm Beach, the City of Greenacres, and the Town of Haverhill. Through inter-local agreements, the Department also provides services to the Village of Palm Springs and the Cities of Boynton Beach, and Atlantis. The Cities of Belle Glade, Pahokee and South Bay are now served directly as well, since the Department's May 1, 2013 absorption of the Glades Utility Authority.
Palm Beach County is a political subdivision of the State of Florida and is governed by the State Constitution, general laws of the State of Florida, and the County’s Charter. The legislative and governing body of the County is the seven-member BCC. In accordance with the County’s Charter, the Clerk & Comptroller is the Clerk of the BCC and is the official custodian of County funds and the accounting records of and for the Department. As an operating unit of the BCC, the Department reports directly to County Administration. An eleven-member Citizens’ Advisory Board provides guidance to the Department and to the BCC on rate and policy issues.
Financial Statement Structure – In addition to the preceding report of the County’s independent certified public accountants, the annual financial statements consist of three segments:
Management’s Discussion and Analysis, which provides explanations for and analyses of the Department’s financial activities based upon currently known facts, conditions, and decisions of the Department’s management. While primarily focused on current year results compared with prior years, this discussion also addresses certain long-term issues, which may, in management’s opinion, impact the Department’s financial performance.
2020 Comprehensive Annual Financial Report 15

Basic Financial Statements depict the Department’s financial position as of September 30, 2020 and 2019, along with earnings performance and cash flow information. The accompanying notes explain some of the financial statement data and provide information that is more detailed.
Supplementary Information, presents the following:
The Department’s share of the Florida Retirement System Pension Plan liability and schedule of contributions to said plan.
The Department’s share of the Health Insurance Subsidy Pension Plan liability and schedule of contributions to said plan.
Schedule of Changes in the Total Other Post-Employment Benefits Liability and Related Ratios, which compares the Department’s results of operations with the original and final budgetary goals.
FINANCIAL OPERATIONS OF THE DEPARTMENT
Net Position: The Department’s net position increased by $64.8 million, or 5.0%, for the fiscal year ended September 30, 2020, compared to a 3.6%, or $45.5 million increase in the prior year. An increase in capital assets of $26.0 million was the major component of the increase in FY 2020. An increase of capital assets of $24.8 million was the major component of the increase in FY 2019.
Table 1 presents the Department’s net position (dollars in millions) for the fiscal years ended
September 30, 2020, 2019, and 2018. Completed projects of $50.5 million, plus an increase in construction in progress of $4.7 million and, less depreciation and amortization of $51.2 million were the major components of the increase in net capital assets in FY 2020. Completed projects of $39.4 million, plus an increase in construction in progress of $15.8 million, less depreciation and amortization of $49.1 million, were the major components of the increase in net capital assets in FY 2019. Construction projects totaling $50.5 million were completed in FY 2020, which represented a 28.0% increase from the FY 2019 total of $39.4 million.
Long-term debt (net of the current portion) decreased by $7.6 million, or 4.8%, in FY 2020 compared to a $7.6 million, or 4.6% decrease, in the previous year. The decrease in both years was attributable to principal repayments.
The Department’s operating revenues totaled $217.9 million in FY 2020 and $204.9 million in FY 2019, which represented increases of 6.3% and 3.9%, respectively, for the years. FY 2020 included the effect of rate indexing and a .97% increase in the customer base. FY 2019 included the effect of rate indexing and a 1.2% increase in the customer base.
Operating expenses before depreciation and amortization and equity interest in net gain of joint venture were $143.0 million and $158.2 million for the years ended FY 2020 and FY 2019, respectively. These represented a decrease of 9.6% in FY 2020 and an increase of 24.6% in FY 2019. The primary reasons for the increase are shown in Table 2.
Table 1 – Summary of Net Position – (dollars in millions)
2020
2019
% Change
2018
% Change
Current and other assets $417.7 $379.1 10.2 $360.1 5.3 Capital assets, net Total assets
1,154.3 1,572.0
1,128.3 1,507.4
2.3 4.3
1,103.5 1,463.6
2.2 3.0
Deferred outflows of resources 21.3 20.3 4.9 22.5 -9.8 Long-term net revenue bonds outstanding 146.7 154.6 -5.1 162.3 -4.7 Current portion of revenue bonds 5.0 3.4 47.1 6.3 -46.0 Other liabilities 73.5 65.5 12.2 58.0 -12.9 Total liabilities 225.2 223.5 0.1 226.6 -1.4 Deferred inflows of resources 2.0 2.9 -31.0 3.7 -21.6 Net position: Net investment in capital assets 1,030.8 995.7 3.5 949.2 4.9
Restricted 6.1 6.5 -6.2 6.3 3.2 Unrestricted 329.2 299.1 10.1 300.3 -0.4
Total net position $1,366.1 $1,301.3 5.0 $1,255.8 3.6
*Restatement due to implementation of GASB Nos. 68, 71 & 75.
16 Palm Beach County, Florida, Water Utilities Department

Table 2 – Operating Expense Changes (dollars in millions)
FY 2020 Changes: Meter installation materials Chemicals All other accounts net decrease Total operating expense change for FY 2020 FY 2019 Changes: Meter installation materials Maintenance of buildings, plants and pipelines due to replacement of assets All other accounts net decrease Total operating expense change for FY 2019
-$20.0 3.4 1.4
-$15.2
$16.5 4.4
10.3 $31.2
A comparative summary of changes in net position for the years ended September 30, 2020, 2019, and 2018 (dollars in millions) is presented in Table 3.
Table 3 – Change in Net Position (dollars in millions)
Operating revenues
2020
2019
% Change
2018
% Change
Charges for utility service
$213.3
$199.8
6.8
$191.7
4.2
Other operating revenues Total operating revenues
4.6
217.9
5.1
204.9
-9.8
6.3
5.5
197.2
-7.3
3.9
Operating expenses before depreciation and amortization and equity interest in net loss of joint venture
143.0
158.2
-9.6
127.0
24.6
Depreciation and amortization and equity interest in net loss of joint venture 51.2 49.1 4.3 47.1 4.2 Total operating expenses 194.2 207.3 -6.3 174.1 19.1
Net operating income (loss) 23.7 -2.4 1,087.5 23.1 -110.4 Nonoperating revenues (expenses)
Investment income 5.2 8.2 -36.6 5.3 54.7 Interest expense -2.6 -4.1 -36.6 -4.8 -14.6 Engineering fees 0.8 1.0 -20.0 0.9 11.1 Engineering expenses -0.8 -0.9 -11.1 -0.9 0.0 Other 0.0 0.4 -100.0 0.6 -33.3 Total non-operating revenues (expenses)
2.6
4.6
-43.5
1.1
318.2
Income before capital contributions, transfers from County
26.3
2.2
1,095.5
24.2
-90.9
Capital contributions 38.3 41.4 -7.5 33.0 25.5
Transfers from primary government 0.3 2.1 -85.7 0.0 100.0
Transfers to primary government 0.0 -0.2 -100.0 -0.1 100.0 Change in net position Beginning net position as previously reported Restatement for GASB Statement #75 Implementation Beginning net position as restated Net position, ending
64.8
1,301.3
0.00
1,301.3
$1,366.1
45.5
1,255.8
0.00
1,255.8
$1,301.3
42.4
3.6
0.0
3.6
5.0
57.1
1,199.8
-1.1
1,198.7
$1,255.8
-20.3
4.7
-100.0
4.8
3.6
*Restatement due to implementation of GASB Nos. 68, 71 & 75.
2020 Comprehensive Annual Financial Report 17

CAPITAL ASSETS AND DEBT ADMINISTRATION Capital Assets: At September 30, 2020 and September 30, 2019, the Department had $1,154.3 million and $1,128.3 million, respectively, invested in a wide range of capital assets, including water treatment plants, water reclamation facilities, pipelines, and two regional operations centers to serve the 1,300 square mile service area. As Table 4 shows, FY 2020 represents a $26.0 million, or 2.3%, increase over the prior year (dollars are in millions, net of accumulated depreciation and amortization). FY 2019 amounts increased by $24.7 million, or 2.2%, from the previous year. Major capital asset additions for the two years are shown in Table 5. For more detailed information on capital assets, please see Note 5.
The Department’s fiscal year 2021 capital budget anticipates spending $201.4 million, an increase of $4.5 million, or 2.3%, from the previous year’s budget of $196.9 million. Major projects include:
Improvements to Southern Region Water Reclamation Facility ($31.1 million):
Lift station rehabilitations ($26.3 million); Wellfield Expansion and Rehabilitations
($21.7 million) These projects will be financed using existing funds, cash generated by operations, and connection fees received from developers.
Table 4 – Change in Capital Assets Net of Accumulated Depreciation
and Amortization (dollars in millions)
2020
2019
% Change
2018
% Change
Utility plants and pipelines $951.3 $924.7 2.9 $912.5 1.3
Buildings 82.5 86.1 -4.2 87.0 -1.0
Equipment and vehicles 27.7 29.4 -5.8 31.7 -7.3
Land 15.6 15.6 0.0 15.6 0.0
Easements 1.7 1.7 0.0 1.7 0.0
Construction in progress 75.5 70.8 6.6 55.0 28.7
Total $1,154.3 $1,128.3 2.3 $1,103.5 2.2
*Restatement due to implementation of GASB Nos. 68, 71 & 75.
Table 5 – Major Capital Asset Additions and Deletions (dollars in millions) FY 2020 Additions:
Water Main Improvements $10.3
Collection System Rehabilitation $8.0
FY 2020 Deletions:
None $0.0
FY 2019 Additions:
Improvements to Water Treatment Plant No. 11 $3.2
Sewer Rehabilitation Century Village and Westgate $2.9
FY 2019 Deletions:
None $0.0
Debt Administration: As shown in Table 6, the Department’s long-term debt (net of the current portion) was $150.2 million on September 30, 2020 a decrease of $7.6 million, or 4.8%. The balance was $157.8 million on September 30, 2019, a decrease of $7.6 million, or 4.6%
from the previous year’s figure of $165.4 million. More detailed information on the Department’s revenue bonds payable is presented in Note 6 to the financial statements.
18 Palm Beach County, Florida, Water Utilities Department

Table 6 – Change in Long-Term Debt (dollars in millions)
2020
2019
% Change
2018
% Change
Revenue bonds (backed by net revenues) $133.5 $144.1 -7.4 $149.8 -3.8
Notes payable 6.3 6.9 -8.7 7.5 -8.0
Plus unamortized bond premium 12.5 10.2 22.5 11.4 -10.5
Net revenue bonds 152.3 161.2 -5.5 168.7 -4.4
Compensated absences 3.7 3.4 8.8 3.3 3.0
Total long-term debt 156.0 164.6 -5.2 172.0 -4.3
Current portion of long-term debt:
Revenue bonds 4.9 5.9 -16.9 5.7 3.5
Notes payable 0.6 0.6 0.0 0.6 0.0
Compensated absences Total current portion of long-term debt
0.3 5.8
0.3 6.8
0.0 --14.7
0.3 6.6
0.0 3.0
Long-term debt (net of current portion) $150.2 $157.8 -4.8 $165.4 -4.6
Since inception of the utility system in 1969, the Department has issued revenue bonds to finance capital improvements. The revenue bonds have interest rates ranging from 2.50% to 5.00% and are payable through FY 2040. All issues are on parity as to their lien on net revenues and connection fees of the utility system. In conjunction with the issuance of the Series 2014 Water and Sewer Revenue Refunding Bonds, Series 2009 Water and Sewer Revenue Bonds and the Series 2008 Water and Sewer Refunding Bonds, Fitch Ratings, Standard & Poor’s, and Moody’s Investors Service rated theses issues and all outstanding bonds of the Department as AAA, AAA, and Aaa, respectively. The Department is obligated by a rate covenant to establish and maintain rates that are sufficient to cover debt service requirements. The rate covenant requires that rates and fees must always provide net revenues that, together with a specified percentage of connection fees, are adequate to pay at least one hundred twenty-five percent (1.25x) of the annual debt service requirement for the bonds. Additionally, the net revenues together with the connection fees must be sufficient to make all payments required by the bond resolution. This requirement was exceeded by the 7.82x and 5.39x calculations for FY 2020 and FY 2019, respectively.
ECONOMIC FACTORS AND NEXT YEAR’S BUDGET AND RATES Palm Beach County is the third most populous county in the State of Florida. Growth in dwelling units for the Department’s service area over the last five years has averaged 0.90. The real estate and construction industries comprise the mainstays of the County’s economic base. The Department’s service area continues to reflect primarily residential customers, plus some commercial and light industrial services. A continued increase in population is projected through “build-out,” which is expected to occur by approximately 2025. By 2025, the Department will operate at least six regional water plants with an estimated 130 million gallons per day (mgd) capacity. For wastewater services, the Department will own a projected 24 mgd capacity in the East Central Regional Wastewater Treatment Plant and will operate the 35 mgd capacity in the Southern Region Water Reclamation Facility, which will be able to provide approximately 22 mgd of reclaimed water. These factors, along with inflation, water restrictions imposed by the South Florida Water Management District and the current state of the real estate market, were considered when preparing the Department’s budget for fiscal 2021. The budget forecasts operating revenues of $221.7 million, or 6.8%, above the final 2020 budget of $207.5 million. Net revenues will be used to fund debt service and a portion of the Department’s capital projects expenditures.
2020 Comprehensive Annual Financial Report 19

Expenses will continue to be subjected to upward pressure from increased operating costs and the expansion of facilities. Amounts anticipated in fiscal 2021 for operating expenses, excluding depreciation and amortization and equity interest in net loss of joint venture, are $175.8 million, a 5.6% decrease from the final 2020 budget of $186.3 million.
CONTACTING THE DEPARTMENT’S FINANCIAL MANAGEMENT This financial report is designed to provide our customers, investors, and creditors with an overview of the Department’s finances and to demonstrate the Department’s accountability for the monies it receives. If you have questions about this report or require additional financial information, please contact us at the address on the preceding transmittal letter.
20 Palm Beach County, Florida, Water Utilities Department

COMPARATIVE FINANCIAL STATEMENTS
2020 Comprehensive Annual Financial Report 21

PALM BEACH COUNTY, FLORIDAWATER UTILITIES DEPARTMENTSTATEMENTS OF NET POSITION
September 30, 2020 and 2019
ASSETS AND DEFERRED OUTFLOWS OF RESOURCES2020 2019
CURRENT ASSETS:
Cash and cash equivalents 286,201,621$ 251,144,200$
Restricted cash and cash equivalents 13,417,583 14,412,626
Accounts receivable (less allowance for doubtful accounts of
$4,447,400 and $4,298,700 for 2020 and 2019, respectively) 22,794,162 20,504,759
Accrued interest receivable 300,323 368,830
Special assessments and notes receivable, current portion 996,573 974,448
Due from other County funds 248,728 249,652
Due from other governments 1,008,143 1,860,558
Prepaid expenses 435,111 396,202
Inventories 11,200,985 8,664,955
Total current assets 336,603,229 298,576,230
NONCURRENT ASSETS:
Restricted cash and cash equivalents 10,889,525 11,263,679
Special assessments and notes receivable 7,923,360 9,100,434
Investment in joint ventures 62,283,529 60,223,178
Capital assets: Utility plants and pipelines in service 1,671,101,629 1,604,115,119
Buildings 141,872,792 141,872,792
Equipment 94,385,080 91,268,242
Land 15,626,971 15,626,971
Easements 1,678,030 1,678,030
Total capital assets 1,924,664,502 1,854,561,154
Less accumulated depreciation and amortization (845,841,439) (797,107,510) Subtotal 1,078,823,063 1,057,453,644 Construction in progress 75,502,941 70,823,870
Capital assets, net 1,154,326,004 1,128,277,514
Total noncurrent assets 1,235,422,418 1,208,864,805
TOTAL ASSETS 1,572,025,647 1,507,441,035
DEFERRED OUTFLOWS OF RESOURCES:
Deferred charge on bond refunding 5,345,724 6,028,828
Goodwill 3,867,050 4,084,005
Pensions 11,801,757 10,186,515 Other post-employment benefits 299,505 74,666
TOTAL DEFERRED OUTFLOWS OF RESOURCES 21,314,036$ 20,374,014$
TOTAL ASSETS AND DEFERRED OUTFLOWS OF RESOURCES 1,593,339,683$ 1,527,815,049$
The accompanying notes to the financial statements are an integral part of these statements22 Palm Beach County, Florida, Water Utilities Department

PALM BEACH COUNTY, FLORIDAWATER UTILITIES DEPARTMENTSTATEMENTS OF NET POSITION
September 30, 2020 and 2019
LIABILITIES, DEFERRED INFLOWS OF RESOURCES AND NET POSITION2020 2019
CURRENT LIABILITIES: Vouchers payable and accrued liabilities 16,562,297$ 14,579,630$ Due to other governments 1,188,302 1,116,455 Due to other County funds 1,301,912 1,105,113 Compensated absences 321,000 279,000
Due to other component units 73,727 81,180 Other current liabilities 16,848 14,184
Subtotal current liabilities 19,464,086 17,175,562
CURRENT LIABILITIES PAYABLE FROM RESTRICTED ASSETS: Revenue bonds payable, current portion 5,542,202 6,520,109 Customer deposits 4,970,212 5,478,030 Accrued interest payable 2,905,170 3,397,465
Subtotal current liabilities payable from restricted assets 13,417,584 15,395,604
Total current liabilities 32,881,670 32,571,166
NONCURRENT LIABILITIES: Revenue bonds payable, net of unamortized discount and premium 146,725,766 154,620,852 Net pension liability 40,977,970 32,242,014 Compensated absences 3,360,906 3,087,535 Total other post-employment benefits liability 1,281,415 1,027,869 Total noncurrent liabilities 192,346,057 190,978,270
TOTAL LIABILITIES 225,227,727 223,549,436
DEFERRED INFLOWS OF RESOURCES: Pensions 935,824 2,728,598 Other post-employment benefits 25,692 26,589 Deferred bond refunding gain 796,348 - Other 234,948 183,875 TOTAL DEFERRED INFLOWS OF RESOURCES 1,992,812 2,939,062
NET POSITION: Net investment in capital assets 1,010,890,840 995,683,477 Restricted for debt service 5,116,331 5,537,130 Restricted for other purposes 1,000,000 1,000,000 Unrestricted 349,111,973 299,105,944
TOTAL NET POSITION 1,366,119,144 1,301,326,551
TOTAL LIABILITIES, DEFERRED INFLOWS OF
RESOURCES AND NET POSITION 1,593,339,683$ 1,527,815,049$
The accompanying notes to the financial statements are an integral part of these statements2020 Comprehensive Annual Financial Report 23

PALM BEACH COUNTY, FLORIDAWATER UTILITIES DEPARTMENT
STATEMENTS OF REVENUES, EXPENSES, AND CHANGES IN NET POSITIONFor the Fiscal Years Ended September 30, 2020 and 2019
2020 2019
OPERATING REVENUES:
Charges for services 213,330,647$ 199,847,203$
Other operating revenue 4,646,171 5,126,768
Total operating revenues 217,976,818 204,973,971
OPERATING EXPENSES:
Depreciation and amortization 51,977,357 51,452,772
Personal services 50,243,028 47,183,602
Maintenance 34,064,968 33,035,064
Supplies 18,573,921 36,099,431
Contractual services 19,483,677 19,420,747
Purchased water and wastewater treatment 10,041,954 11,116,014
Utilities 8,001,217 8,393,125
Equity interest in net gain of joint venture (810,705) (2,351,641)
Miscellaneous 2,635,515 2,978,452
Total operating expenses 194,210,932 207,327,566
OPERATING INCOME (LOSS) 23,765,886 (2,353,595)
NONOPERATING REVENUES (EXPENSES):
Investment income 5,244,563 8,168,413
Interest expense (2,597,287) (4,074,054)
Engineering fees 843,502 1,021,237
Engineering expenses (893,199) (949,642)
Other (24,828) 372,157
Total nonoperating revenues 2,572,751 4,538,111
INCOME BEFORE CAPITAL CONTRIBUTIONS
AND TRANSFERS 26,338,637 2,184,516
Transfers from other County Funds 287,226 2,114,024
Transfers to other County Funds (136,471) (172,495)
Capital contributions received 38,303,201 41,374,174
CHANGE IN NET POSITION 64,792,593 45,500,219
NET POSITION, BEGINNING OF PERIOD 1,301,326,551 1,255,826,332
NET POSITION, END OF PERIOD 1,366,119,144$ 1,301,326,551$
The accompanying notes to the financial statements are an integral part of these statements.
24 Palm Beach County, Florida, Water Utilities Department

PALM BEACH COUNTY, FLORIDAWATER UTILITIES DEPARTMENTSTATEMENTS OF CASH FLOWS
For the Fiscal Years Ended September 30, 2020 and 2019
2020 2019CASH FLOWS FROM OPERATING ACTIVITIES: Cash receipts: Cash received from customers 211,859,159$ 200,496,594$ Other operating receipts 4,550,440 4,719,470 Total cash receipts 216,409,599 205,216,064 Cash disbursements: Payments to employees (36,336,858) (35,042,116) Payments to other County funds (27,589,313) (27,579,914) Payments to suppliers of goods and services (76,762,647) (91,250,509) Total cash disbursements (140,688,818) (153,872,539) Net cash provided by operating activities 75,720,781 51,343,525
CASH FLOWS FROM NONCAPITAL FINANCING ACTIVITIES: Cash contributed to joint ventures (2,961,095) (2,874,849) Transfers from other County Funds 287,226 1,876,158 Transfers to other County Funds (136,471) (172,495) Net cash used in non-capital financing activities (2,810,340) (1,171,186)
CASH FLOWS FROM CAPITAL AND RELATED FINANCING ACTIVITIES: Principal paid on refunded revenue bonds (48,755,000) - Proceeds on issuance of revenue refunding bonds 48,753,674 - Construction and acquisition of capital assets (54,259,267) (58,489,315) Capital contributed by developers and customers 21,921,318 21,588,699 Principal paid on revenue bond maturities (6,516,631) (6,255,452) Interest paid on revenue bonds (6,117,617) (7,024,875) Cash contributed by other governments 991,721 3,798,309 Interest paid on refunded revenue bonds (374,355) - Bond issuance costs paid (328,982) - Proceeds on sale of surplus capital assets 151,452 92,366 Bond paying agent fees paid (1,600) (2,700)
Net cash used in capital and related financing activities (44,535,287) (46,292,968)
CASH FLOWS FROM INVESTING ACTIVITIES: Interest and gains or losses on investments 5,313,070 8,215,199
Net increase in cash and cash equivalents 33,688,224 12,094,570
Cash and cash equivalents at beginning of period 276,820,505 264,725,935
Cash and cash equivalents at end of period 310,508,729$ 276,820,505$
Displayed on statements of net position as: Cash and cash equivalents 286,201,621$ 251,144,200$ Restricted cash and cash equivalents 24,307,108 25,676,305
Total per statements of net position 310,508,729$ 276,820,505$
The accompanying notes to the financial statements are an integral part of these statements.
2020 Comprehensive Annual Financial Report 25
PALM BEACH COUNTY, FLORIDAWATER UTILITIES DEPARTMENTSTATEMENTS OF CASH FLOWS
For the Fiscal Years Ended September 30, 2020 and 2019
2020 2019
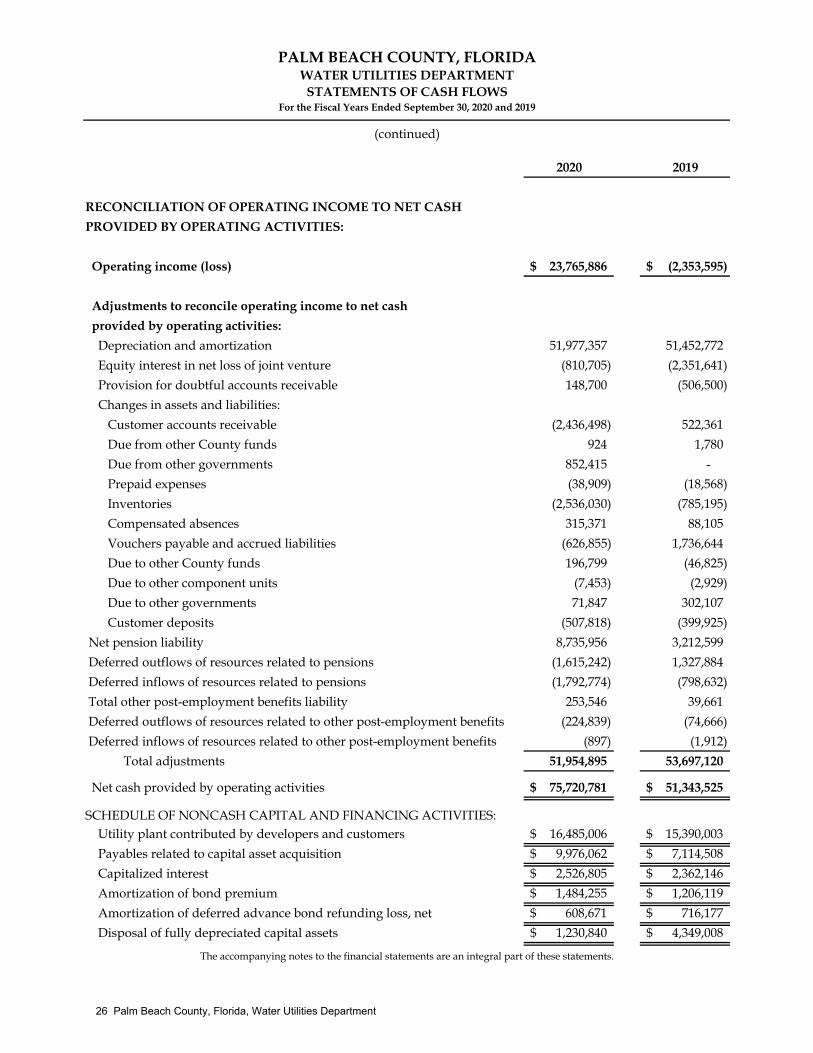
RECONCILIATION OF OPERATING INCOME TO NET CASH
PROVIDED BY OPERATING ACTIVITIES:
Operating income (loss) 23,765,886$ (2,353,595)$
Adjustments to reconcile operating income to net cash
provided by operating activities:
Depreciation and amortization 51,977,357 51,452,772
Equity interest in net loss of joint venture (810,705) (2,351,641)
Provision for doubtful accounts receivable 148,700 (506,500)
Changes in assets and liabilities:
Customer accounts receivable (2,436,498) 522,361
Due from other County funds 924 1,780
Due from other governments 852,415 -
Prepaid expenses (38,909) (18,568)
Inventories (2,536,030) (785,195)
Compensated absences 315,371 88,105
Vouchers payable and accrued liabilities (626,855) 1,736,644
Due to other County funds 196,799 (46,825)
Due to other component units (7,453) (2,929)
Due to other governments 71,847 302,107
Customer deposits (507,818) (399,925)
Net pension liability 8,735,956 3,212,599
Deferred outflows of resources related to pensions (1,615,242) 1,327,884
Deferred inflows of resources related to pensions (1,792,774) (798,632)
Total other post-employment benefits liability 253,546 39,661
Deferred outflows of resources related to other post-employment benefits (224,839) (74,666)
Deferred inflows of resources related to other post-employment benefits (897) (1,912)
Total adjustments 51,954,895 53,697,120
Net cash provided by operating activities 75,720,781$ 51,343,525$
SCHEDULE OF NONCASH CAPITAL AND FINANCING ACTIVITIES: Utility plant contributed by developers and customers 16,485,006$ 15,390,003$
Payables related to capital asset acquisition 9,976,062$ 7,114,508$
Capitalized interest 2,526,805$ 2,362,146$
Amortization of bond premium 1,484,255$ 1,206,119$
Amortization of deferred advance bond refunding loss, net 608,671$ 716,177$
Disposal of fully depreciated capital assets 1,230,840$ 4,349,008$
(continued)
The accompanying notes to the financial statements are an integral part of these statements.
26 Palm Beach County, Florida, Water Utilities Department

PALM BEACH COUNTY, FLORIDA WATER UTILITIES DEPARTMENT
NOTES TO FINANCIAL STATEMENTS For the Fiscal Years Ended September 30, 2020 and 2019
1. GENERAL
Description – Palm Beach County, Florida (County) is a chartered political subdivision of the State of Florida and is authorized by the power of self-government by the Constitution of the State of Florida and Florida Statutes. The Board of County Commissioners (BCC) is the legislative and governing body of the County. Pursuant to the general laws of Florida, the County owns the Water Utilities Department of Palm Beach County (Department). The financial statements only present the Department and are not intended to present fairly the financial position of Palm Beach County, Florida, and the changes in its financial position and cash flows, in conformity with accounting principles generally accepted in the United States of America (GAAP).
Basis of Presentation – The Department operates as an enterprise fund of the County. An enterprise fund is used to account for the financing of services to the general public where all or most of the costs involved are paid in the form of charges by users of such services.
2. SUMMARY OF SIGNIFICANT ACCOUNTING POLICIES
The following is a summary of significant accounting policies followed by the Department:
Basis of Accounting – The Department utilizes the accrual basis of accounting in accordance with GAAP. The financial statements are presented using the economic resources measurement focus.
Budget Approval – The BCC approves the Department’s annual budget as part of the formal budget adoption process pursuant to Chapter 129, Florida Statutes. The budget is adopted on a basis consistent with GAAP, and budgetary controls for appropriations are established at the appropriation unit level. Activities for the operating accounts required by bond covenants securing the Department’s indebtedness are included in the annual budget.
Use of Estimates – The preparation of financial statements in conformity with GAAP requires management to make estimates and assumptions which affect the reported amounts of assets, deferred outflows of resources, liabilities and deferred inflows of resources and disclosure of contingent assets and liabilities at the date of the financial statements and the reported amounts of revenues and expenses during the reporting period. Actual results could differ from those estimates.
Classification of Revenues and Expenses – Operating revenues and expenses are those which result from providing water and wastewater services. Nonoperating revenues and expenses include financing, investing, and other activities not directly related to the provision of water and wastewater services.
Revenue Recognition - All water and wastewater revenues are recognized when the related services are provided. Special assessment contributed capital is recognized when the project has final acceptance by the BCC’s Contract Review Committee and, for projects whose final assessed amount is less than the original assessed amount, BCC approval of the amended amount. Grants from other governmental agencies for the acquisition of capital assets are recorded as capital contributions when all applicable eligibility requirements have been met. Connection fees are charged to new service customers and are required to be used for capital acquisition purposes; these fees are accounted for as capital contributions when service is provided.
Cash and Cash Equivalents – The Department considers all highly liquid investments with maturities of three months or less when purchased as well as its proportionate share of the County’s investment pool to be cash equivalents for purposes of the statements of net position and the statements of cash flows.
2020 Comprehensive Annual Financial Report 27

Accounts Receivable – Billings to the Department’s customers are based on metered consumption, which is determined at various dates during each month. Estimated unbilled consumption at month-end is recognized as revenue and recorded as accounts receivable. The allowance for doubtful accounts is determined by multiplying the accounts receivable balance at fiscal year-end by the average bad debt rate for the last five years and adjusting for current economic conditions. This results in adjusting the receivables to their net realizable value. Special Assessments Receivable – A non-current special assessment receivable is recorded for contributed capital resulting from special assessment projects. Recognition of the contributed capital is described in the revenue recognition section of Note 2. A portion of the balance is reclassified as a current special assessment receivable. This current portion is estimated based on the actual tax billing determined by the Clerk & Comptroller and billed by the Tax Collector. No allowance is recorded because liens are recorded against the assessed property. Inventories – Inventories consist primarily of material and supplies and are stated at the lower of cost or market determined on a first-in, first-out basis. Restricted Assets and Restricted Net Position – Assets are restricted in accordance with provisions of the bond resolutions of the BCC authorizing the issuance of the Series 2019, 2015 and 2013 Revenue Bonds, along with other applicable obligations. The restricted component of net position represents restricted assets reduced by liabilities related to those assets. Capital Assets – Capital assets are stated at cost less accumulated depreciation and amortization, except contributed assets which are recorded at acquisition value on the date of contribution. Expenditures of $25,000 or more for additions and improvements and $1,000 for equipment are capitalized. Expenditures for maintenance, repairs, and minor improvements are charged to expense as incurred. Depreciation of tangible capital assets is computed on the straight-line method over the estimated useful lives of the assets, which are as follows:
Buildings 15-40 years Utility plants in service 7-50 years Equipment 3-25 years
Impairment of Long-Lived Assets – Long-lived assets are evaluated for impairment whenever events or changes in circumstances indicate the carrying amount of long-lived asset(s) may not be recoverable. The carrying amount is not considered recoverable if it exceeds the sum of the undiscounted cash flows expected to result from the long-lived asset(s) use and eventual disposition. An impairment loss, if any, is measured as the amount by which the carrying amount of said long-lived asset(s) exceeds its fair value. Management has determined that no long-lived assets were impaired as of September 30, 2020. Deferred Outflows/Inflows of Resources – In addition to assets, the Statement of Net Position includes a separate section for deferred outflows of resources, which represents a consumption of net position applicable to a future period and will not be recognized as an outflow (expense) until that time. Deferred outflows relate primarily to 1) the difference in the carrying value of refunded debt and its reacquisition price, which amount is deferred and amortized over the shorter of the life of the refunded or refunding debt, 2) pension and other post-employment (OPEB) related items including differences between expected and actual investment earnings and experience, changes in the Department’s proportionate share of contributions and contributions subsequent to the measurement date, and 3) goodwill, which represents the difference between the acquisition price and the fair value of utility systems purchased. The Department has two items of goodwill which are amortized as follows:
The goodwill resulting from the acquisition of the Village of Royal Palm Beach’s Utility System is amortized over 30 years, which represents the period the bonds issued to fund the acquisition will be outstanding.
28 Palm Beach County, Florida, Water Utilities Department

The goodwill resulting from the acquisition of the Indian Trail Improvement District Utility System is amortized over 40 years.
In addition to liabilities, the Statement of Net Position includes a separate section for deferred inflows of resources, which represents an acquisition of net position applicable to a future period and will not be recognized as an inflow (revenue) until that time. Deferred inflows relate primarily to pension and OPEB related items including differences between expected and actual investment earnings and experience and changes in the Department’s proportionate share of contributions. Compensated Absences – Accumulated unpaid vacation and sick leave benefits are accrued as a liability and charged to expense at the time the employees perform the services which give rise to the benefits. Interest – Interest costs are expensed or capitalized as required by GASB No. 62. The amount of interest cost to be capitalized for qualifying assets is intended to be the portion of the interest costs incurred during the asset’s acquisition periods which theoretically could have been avoided if the outlays for the assets had not been made. Net Position – The financial statements utilized a net position presentation. Net position is categorized as: Net Investment in Capital Assets, Restricted and Unrestricted. Net Investment in Capital Assets consists of capital assets, net of accumulated depreciation and reduced by the outstanding balance of any debt attributable to the acquisition, construction or improvement of those assets. Restricted net position consists of constraints placed on the use of net position by external restrictions imposed by creditors (such as through debt covenants), grantors, contributors, or laws or regulations of other governments or constraints imposed by law through constitutional provisions or enabling legislation. Unrestricted net position consists of net position which does not meet the definition of Net Investment in Capital Assets or Restricted Net Position. Use of Restricted Resources – When both restricted and unrestricted resources are available for use, it is the Department’s policy to use restricted resources first, then unrestricted resources as they are needed. 3. CASH AND INVESTMENTS Cash and investments consist of the following at September 30, 2020 and 2019:
September 30, 2020 County Internal Investment Pool $302,694,182 Cash with Fiscal Agent 7,806,247 Petty cash 8,300 Total $310,508,729
September 30, 2019
County Internal Investment Pool $268,661,039 Cash with fiscal agent 8,150,166 Petty cash 9,300 Total $276,820,505
The Department participates in the County’s pooled cash system so as to maximize earnings and facilitate cash management. The Department’s share of the County’s investment pool is 14% and 13%, as of September 30, 2020 and 2019, respectively. The County’s pooled cash fund is a highly liquid investment pool of approximately $2.17 billion and $2.04 billion as of September 30, 2020 and 2019, respectively, of which approximately 14% and 13%, respectively, are invested in U. S. Government and Agency obligations. The County’s investment policy for this pool requires that all securities be insured or registered in the name of the County and held by a third-party custodial institution, with capital and surplus stock of at least $500 million and a separate custody account at the Federal Reserve Bank that is restricted for the safekeeping of County-owned securities. Almost all remaining amounts at September 30, 2020 and 2019 were invested in money markets and certificates of deposit. The equity in the County pooled cash system is
2020 Comprehensive Annual Financial Report 29

available to the Department on a demand basis. See the County’s Comprehensive Annual Financial Report (Annual Report) for disclosures relating to its investment policy interest rate risk, credit risk, custodial credit risk and concentration of credit risk. The County’s Annual Report may be viewed on-line at: http://mypalmbeachclerk.com/annual-report
or may be ordered from: Palm Beach County Clerk & Comptroller • Attn: Financial Reporting • 301 North
Olive Avenue • West Palm Beach, Florida 33401 • (561) 355-2912 4. INVESTMENT IN JOINT VENTURES East Central Regional Wastewater Facilities The County, on behalf of the Department, participates in a joint interlocal agreement (Agreement) with four municipalities whereby they consolidated separate agreements into a single unified agreement to establish rules and procedures for the operation and management of the existing East Central Regional Wastewater Facilities (ECR). ECR became a separate legal entity created for the purpose of providing wastewater treatment and disposal services to the five participating entities (Entities). The Agreement establishes the duties and responsibilities among the Entities for the operation of ECR. Key provisions of the Agreement include:
The initial term of the Agreement is thirty years with an option to renew for an additional thirty years based upon mutual consent of the Entities.
The Agreement can be terminated only with unanimous mutual consent of the Entities.
An Entity may withdraw from participation in the Agreement; however, the Entity will forfeit its interest
and allocation in ECR and will still be required to meet its obligations under the Agreement. In the event the ECR is sold or disposed of, proceeds of the sale or disposition shall be prorated among the
entities, based on the reserve capacity allocation in effect as of the date of sale or disposition. As of September 30, 2020, and 2019, the Department had a 34.29% interest in ECR for both fiscal years.
The Agreement provides for the establishment of a Board (Board) to administer ECR. The Board is
comprised of one representative from each participating Entity.
The City of West Palm Beach (City) is designated to administer and operate ECR efficiently and economically for the benefit of the Entities. To that end, the City retains legal title to ECR property, provides all personnel resources required for operation and administration of ECR, and assumes responsibility for all employee benefits, risk management, and other costs. In exchange for such services, ECR pays the City an administrative fee.
A budget is adopted annually by the Board. Annual expenditures are covered by the wastewater flow
charge, which is charged to each Entity based on usage. Under accounting principles generally accepted in the United States of America, the Department is required to account for this investment using the equity method. Accordingly, the Department recorded its initial investment at cost and annually records its proportionate share of ECR’s income or loss, contributions made, and distributions received. The financial obligations of the Entities include the following:
ECR allocates to the Entities the costs associated with the operation and maintenance of the treatment plant based on each Entity’s proportionate share of total wastewater flow into the plant. The Department’s totals of such costs charged to expense were approximately $7,556,500 and $8,686,100 for the fiscal years ended September 30, 2020 and 2019, respectively.
30 Palm Beach County, Florida, Water Utilities Department

The Entities are required to make annual deposits to a Renewal and Replacement Fund to finance improvements to ECR. The annual deposits of approximately $2.6 million will continue until the amount on deposit equals 10% of the Department’s proportionate share of ECR’s replacement value which was estimated to be $285 million as of September 30, 2019. The total of such costs was $2,719,624 and $2,640,411 for the fiscal years ended September 30, 2020 and 2019, respectively. The amounts on deposit were $10,063,899 and $9,937,467 for the fiscal years ended September 30, 2019 and 2018, respectively.
Florida Power and Light (FPL), ECR and the Department entered into agreements to construct a 27 million gallons per day reclaimed water facility (Reclaimed Water Project). The Reclaimed Water Project was financed with debt issued by the Department (see Note 6) while a portion of the assets are located on ECR property, who operates the reclaimed water facility. The Department maintains and operates the distribution system and FPL reimburses the Department for all costs associated with operating and maintaining the distribution system in addition to administrative costs. The total reclaimed water facility operating costs for the fiscal years ended September 30, 2020 and 2019, respectively, were $2,361,000 and $2,220,700.
In fiscal year 2014 the Department was required to make annual deposits to a Renewal and Replacement Fund to finance improvements to the Reclaimed Water Project. The annual deposits of approximately $0.2 million will continue until the amount on deposit equals 10% of the facility’s replacement value. As of September 30, 2020, and 2019, respectively, the Department’s investment in the Reclaimed Water Project was $14.3 million and $13.7 million.
For the fiscal years ended September 30, 2020 and 2019, respectively, the Department’s total payments to ECR for all the transactions described above were $12.9 million and $13.8 million respectively.
The following table is a brief summary of the financial position of the ECR as of September 30, 2019, based on the audited financial statements:
Total assets and deferred outflows $348,958,840
Total net position $161,950,480
Invested in capital, net of related debt $117,429,785
Unrestricted net position $5,317,706
Increase in net position $29,189,484
September 30, 2020 amounts are expected to approximate the above figures. As of September 30, 2020, and 2019, respectively, the Department’s investment in the ECR was $59.4 million and $57.0 million, respectively. Separate financial statements for ECR may be obtained at the following address: East Central Regional Wastewater Facilities • City of West Palm Beach • P.O. Box 3506 • West Palm Beach, FL 33402 Biosolids Processing and Recycling Facility On September 23, 2003, the Board of County Commissioners, on behalf of the Water Utilities Department, entered into an interlocal agreement (Agreement) with the Solid Waste Authority (SWA) to fund a portion of the cost to design, build, and operate a Biosolids Processing and Recycling Facility (BPF). Amendments to the agreement were approved May 3, 2005, July 11, 2006 and July 16, 2013. The BPF processes certain wastewater treatment residuals (biosolids) and is necessary to comply with increasingly stringent environmental regulations that have significantly decreased the number of land application sites available. Bulk land application was the previous method of disposing of the biosolids.
2020 Comprehensive Annual Financial Report 31
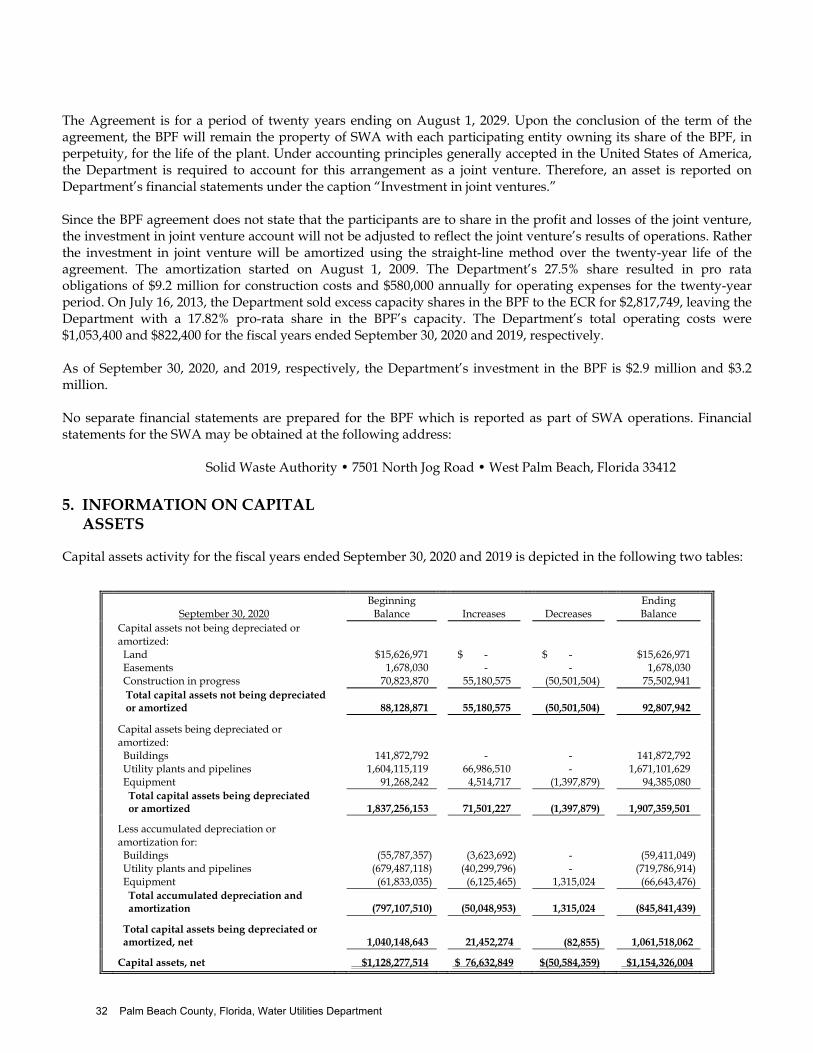
The Agreement is for a period of twenty years ending on August 1, 2029. Upon the conclusion of the term of the agreement, the BPF will remain the property of SWA with each participating entity owning its share of the BPF, in perpetuity, for the life of the plant. Under accounting principles generally accepted in the United States of America, the Department is required to account for this arrangement as a joint venture. Therefore, an asset is reported on Department’s financial statements under the caption “Investment in joint ventures.” Since the BPF agreement does not state that the participants are to share in the profit and losses of the joint venture, the investment in joint venture account will not be adjusted to reflect the joint venture’s results of operations. Rather the investment in joint venture will be amortized using the straight-line method over the twenty-year life of the agreement. The amortization started on August 1, 2009. The Department’s 27.5% share resulted in pro rata obligations of $9.2 million for construction costs and $580,000 annually for operating expenses for the twenty-year period. On July 16, 2013, the Department sold excess capacity shares in the BPF to the ECR for $2,817,749, leaving the Department with a 17.82% pro-rata share in the BPF’s capacity. The Department’s total operating costs were $1,053,400 and $822,400 for the fiscal years ended September 30, 2020 and 2019, respectively. As of September 30, 2020, and 2019, respectively, the Department’s investment in the BPF is $2.9 million and $3.2 million. No separate financial statements are prepared for the BPF which is reported as part of SWA operations. Financial statements for the SWA may be obtained at the following address:
Solid Waste Authority • 7501 North Jog Road • West Palm Beach, Florida 33412 5. INFORMATION ON CAPITAL ASSETS Capital assets activity for the fiscal years ended September 30, 2020 and 2019 is depicted in the following two tables:
September 30, 2020
Beginning Balance
Increases
Decreases
Ending Balance
Capital assets not being depreciated or amortized:
Land $15,626,971 $ - $ - $15,626,971 Easements 1,678,030 - - 1,678,030 Construction in progress 70,823,870 55,180,575 (50,501,504) 75,502,941 Total capital assets not being depreciated
or amortized
88,128,871
55,180,575
(50,501,504)
92,807,942
Capital assets being depreciated or amortized:
Buildings 141,872,792 - - 141,872,792 Utility plants and pipelines 1,604,115,119 66,986,510 - 1,671,101,629 Equipment 91,268,242 4,514,717 (1,397,879) 94,385,080 Total capital assets being depreciated
or amortized
1,837,256,153
71,501,227
(1,397,879)
1,907,359,501
Less accumulated depreciation or amortization for:
Buildings (55,787,357) (3,623,692) - (59,411,049) Utility plants and pipelines (679,487,118) (40,299,796) - (719,786,914) Equipment (61,833,035) (6,125,465) 1,315,024 (66,643,476) Total accumulated depreciation and
amortization
(797,107,510)
(50,048,953)
1,315,024
(845,841,439)
Total capital assets being depreciated or
amortized, net
1,040,148,643
21,452,274
(82,855)
1,061,518,062
Capital assets, net $1,128,277,514 $ 76,632,849 $(50,584,359) $1,154,326,004
32 Palm Beach County, Florida, Water Utilities Department
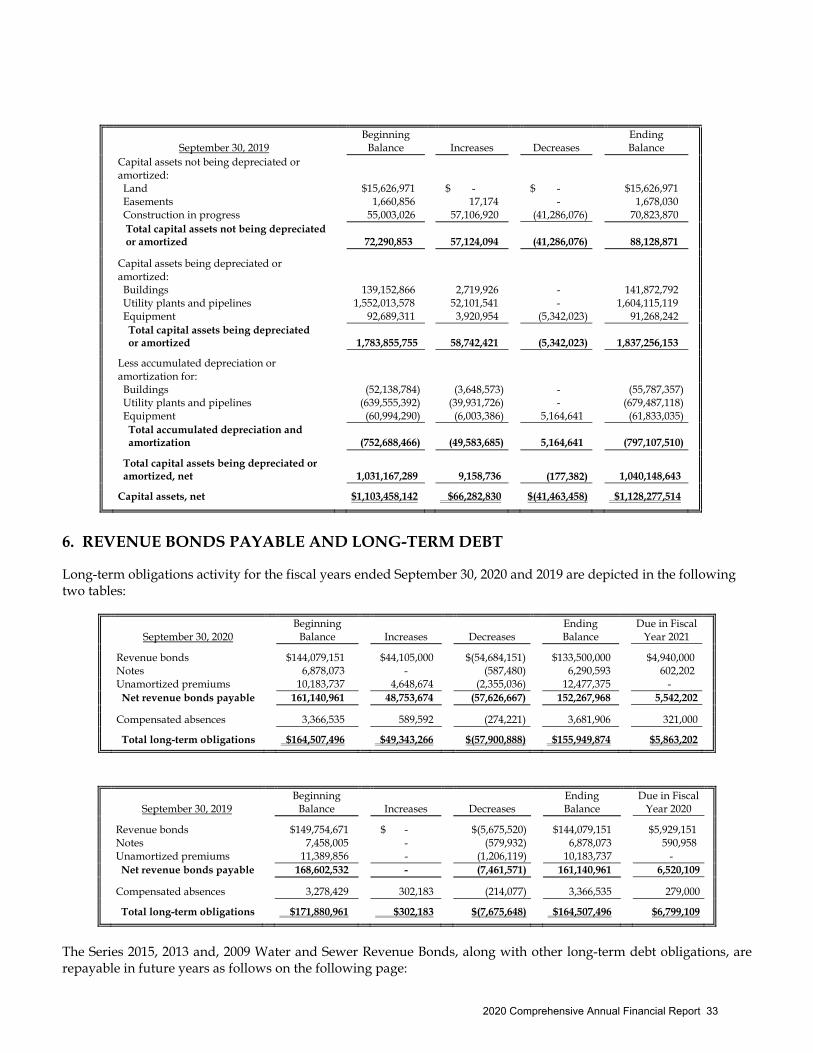
September 30, 2019 Beginning
Balance
Increases
Decreases Ending
Balance
Capital assets not being depreciated or amortized:
Land $15,626,971 $ - $ - $15,626,971 Easements 1,660,856 17,174 - 1,678,030 Construction in progress 55,003,026 57,106,920 (41,286,076) 70,823,870 Total capital assets not being depreciated
or amortized
72,290,853
57,124,094
(41,286,076)
88,128,871
Capital assets being depreciated or amortized:
Buildings 139,152,866 2,719,926 - 141,872,792 Utility plants and pipelines 1,552,013,578 52,101,541 - 1,604,115,119 Equipment 92,689,311 3,920,954 (5,342,023) 91,268,242 Total capital assets being depreciated
or amortized
1,783,855,755
58,742,421
(5,342,023)
1,837,256,153
Less accumulated depreciation or amortization for:
Buildings (52,138,784) (3,648,573) - (55,787,357) Utility plants and pipelines (639,555,392) (39,931,726) - (679,487,118) Equipment (60,994,290) (6,003,386) 5,164,641 (61,833,035) Total accumulated depreciation and
amortization
(752,688,466)
(49,583,685)
5,164,641
(797,107,510)
Total capital assets being depreciated or
amortized, net
1,031,167,289
9,158,736
(177,382)
1,040,148,643
Capital assets, net $1,103,458,142 $66,282,830 $(41,463,458) $1,128,277,514
6. REVENUE BONDS PAYABLE AND LONG-TERM DEBT Long-term obligations activity for the fiscal years ended September 30, 2020 and 2019 are depicted in the following two tables:
September 30, 2020
Beginning Balance
Increases
Decreases
Ending Balance
Due in Fiscal Year 2021
Revenue bonds $144,079,151 $44,105,000 $(54,684,151) $133,500,000 $4,940,000 Notes 6,878,073 - (587,480) 6,290,593 602,202 Unamortized premiums 10,183,737 4,648,674 (2,355,036) 12,477,375 - Net revenue bonds payable 161,140,961 48,753,674 (57,626,667) 152,267,968 5,542,202
Compensated absences 3,366,535 589,592 (274,221) 3,681,906 321,000
Total long-term obligations $164,507,496 $49,343,266 $(57,900,888) $155,949,874 $5,863,202
September 30, 2019
Beginning Balance
Increases
Decreases
Ending Balance
Due in Fiscal Year 2020
Revenue bonds $149,754,671 $ - $(5,675,520) $144,079,151 $5,929,151 Notes 7,458,005 - (579,932) 6,878,073 590,958 Unamortized premiums 11,389,856 - (1,206,119) 10,183,737 - Net revenue bonds payable 168,602,532 - (7,461,571) 161,140,961 6,520,109
Compensated absences 3,278,429 302,183 (214,077) 3,366,535 279,000
Total long-term obligations $171,880,961 $302,183 $(7,675,648) $164,507,496 $6,799,109
The Series 2015, 2013 and, 2009 Water and Sewer Revenue Bonds, along with other long-term debt obligations, are repayable in future years as follows on the following page:
2020 Comprehensive Annual Financial Report 33

Year (s) Ending September 30 Principal Interest
2021 $5,542,202 $5,730,719 2022 5,788,669 5,484,375
2023 6,025,366 5,245,005
2024 6,272,297 4,985,650
2025 6,559,463 4,694,607
2026-2030 37,010,794 18,431,253
2031-2035 44,566,802 9,031,349
2036-2040 24,570,000 1,431,511
2041 3,455,000 51,825
Total $139,790,593 $55,086,294
The bond issues enable the Department to call various maturities of the debt at specified premiums of up to 2% of the principal balance. The Water and Sewer Revenue Bonds are collateralized by a first lien on the Department’s net revenues and connection fees as defined in the bonds’ resolutions (Resolutions). The Department is required to establish rates and fees sufficient to provide net revenues and connection fees which are at least 125% of the annual debt service requirements. The Water and Sewer Revenue Bond Resolutions established certain accounts and determined the order in which revenue is to be deposited into these accounts. The purpose of the accounts, in order of priority of monthly revenue transfers, is as follows:
Revenue: deposit all revenue. Operations & Maintenance: pay operating expenses. Sinking Fund Accounts:
Bond Interest Account: fund the next semi-annual interest payment on all outstanding serial and term bonds.
Bond Principal Account: fund the next annual principal payment on all outstanding serial bonds.
Bond Redemption Account: fund the next annual principal payment on all outstanding term bonds.
Debt Service Reserve Account: deposit one-twelfth of the amount equal to the maximum annual debt service requirement on the bonds in any succeeding year, but insurance may be used, up to the maximum annual debt service amount, for transfer to the bond interest, bond principal, or bond redemption accounts, if necessary.
Renewal and Replacement: deposit one-twelfth of 5% of the preceding year’s gross revenue for extensions, improvements, additions, or the replacement of capital assets until the amount on deposit equals $1,000,000. Capital Improvement: deposit remaining revenue for use in any manner provided by law. Connection Fee: deposit all connection fees received, fund any deficiency in the sinking fund accounts or subordinated indebtedness, pay costs of constructing extensions to the Water and Sewer System, or use for any other lawful purpose.
The Department’s long-term revenue bonds payable as of September 30, 2020 and 2019 are illustrated in the table on the following page:
34 Palm Beach County, Florida, Water Utilities Department

REVENUE BONDS AND NOTES
September 30 2020 2019
$68,115,000 Series 2009 Water & Sewer Revenue Bonds refunded on November 26, 2019.
$ -
50,270,000
$9,385,488 Wells Fargo Loan paid on April 1, 2020. - 1,134,151
$72,430,000 Series 2013 Water & Sewer Revenue Refunding Bonds due in annual installments of $3,280,000 to $6,330,000 through October 1, 2033, with interest from 4.00% to 5.00% payable semiannually on October 1 and April 1.
66,010,000
69,290,000
$26,930,000 Series 2015 Water & Sewer Revenue Refunding Bonds due in annual installments of $7,535,000 to $8,080,000 through October 1, 2036, with interest from 3.125% to 4.00% payable semiannually on October 1 and April 1.
23,385,000
23,385,000
$44,105,000 Series 2019 Water & Sewer Revenue Refunding Bonds due in annual installments of $1,495,000 to $2,985,000 through October 1, 2036, with interest from 2.5% to 5.00% payable semiannually on October 1 and April 1.
44,105,000
-
Various State Revolving Fund notes payable 6,290,593 6,878,073
Total debt 139,790,593 150,957,224
Less current portion of long-term debt (5,542,202) (6,520,109)
Plus unamortized premium 12,477,375 10,183,737
Total noncurrent portion $146,725,766 $154,620,852
7. PLEDGED REVENUES The Department has pledged future water and wastewater system revenues, net of specified operating expenses, to repay $140 million in water and sewer system revenue bonds issued between February 27, 2013 and November 26, 2019 and notes assumed with the absorption of the GUA on May 1, 2013. Proceeds from the bonds provided financing for the addition, improvement, and expansion of the utility system facilities, infrastructure, and equipment. The bonds and notes are payable solely from the utility system net revenues and are payable through October 1, 2040. Net revenues are defined as gross revenues remaining after deducting operating expenses, with operating revenues including all income except the following excluded items: third party reimbursements, connection fees (see next paragraph), special assessments, gain on disposal of capital assets, and grants. Operating expenses exclude interest expense, depreciation and amortization, equity interest in net loss of joint venture, and loss on disposal of capital assets. Connection fees included are the lesser of total connection fees collected during the fiscal year or the percentage of debt service for the fiscal year attributable to expansion of the utility system. Total principal and interest remaining to be paid on the bonds and notes is $194.9 million with annual requirements ranging from $0.1 million in fiscal years 2039 and 2040 to $11.3 million in fiscal years 2021 and 2022. Annual principal and interest payments on these debts are expected to require less than 25% of projected future net revenues and connection fees. Principal and interest paid for the current year and utility system net revenues and connection fees were $12.3 million and $101.5 million, respectively.
2020 Comprehensive Annual Financial Report 35

8. ADVANCE REFUNDING OF DEBT On November 26, 2019 the Department issued $44,105,000 Series 2019 Water and Sewer Revenue Refunding Bonds for the purpose of current refunding the remaining $48,755,000 of Series 2009 Water and Sewer Revenue Bonds outstanding. The Series 2009 bonds were called for redemption effective November 26, 2019. Outstanding principal and accrued interest up to the redemption date was paid to the bondholders on this date through a fiscal agent. As a result, the Department recognized an accounting gain of $870,781 and realized an economic gain (net present value of cash flow savings) of $12,505,536. 9. COMMITMENTS The Department has entered into construction contracts with remaining commitments totaling approximately $59,375,000 and $58,331,000 as of September 30, 2020 and 2019, respectively. 10. RETIREMENT PLANS The Department provides retirement benefits to its employees through the Florida Retirement System (System), a contributory, cost-sharing, multiple-employer, public employee retirement system. All employees are covered by the System. There are three plans, as described below, within the System. All of the Department’s employees are eligible to participate in the System, and substantially all are covered by the System.
Plan Descriptions: Florida Retirement System (FRS) Pension Plan and Retiree Health Insurance Subsidy (HIS) Program are cost-sharing, multiple-employer defined benefit plans administered by the Florida Department of Management Services, Division of Retirement. The FRS Pension Plan provides retirement and disability benefits, annual cost of living adjustments, and death benefits to plan members and beneficiaries. These benefits are established by Chapter 121, Florida Statutes, and may only be amended by the Florida Legislature. The HIS Program benefit is a monthly payment to assist retirees of the State-administered retirement systems in paying their health insurance costs. The HIS Program was established under Section 112.363, Florida Statutes, and may be amended by the Florida Legislature at any time. A comprehensive annual financial report including financial information and required supplementary information on both plans is publicly available on the Florida Department of Management Services website (http://www.dms.myflorida.com)
Florida Retirement System Investment Plan (Investment Plan) is a defined contribution plan the Department contributes to for its eligible employees who elect to participate in the Investment Plan in lieu of the FRS Pension Plan. As provided in Section 121.4501, Florida Statutes, eligible FRS members may elect to participate in the Investment Plan in lieu of the FRS defined-benefit plan. Department employees participating in the DROP are not eligible to participate in the Investment Plan. Employer and employee contributions, including amounts contributed to individual members’ accounts, are defined by law, but the ultimate benefit depends in part on the performance of the investment funds. Benefit terms, including contribution requirements, for the Investment Plan are established and may be amended by the Florida Legislature. The Investment Plan is funded with the same employer and employee contribution rates which are based on salary and membership class (Regular Class, Elected County Officers, etc.) as the FRS Pension Plan. Contributions are directed to individual member accounts, and the individual members allocate contributions and account balances among various approved investment choices. The Investment Plan is administered by the State Board of Administration (SBA) and is reported in the SBA’s annual financial statements and in the State of Florida’s comprehensive annual financial report. Financial information on this plan is available on the web at http://www.sbafla.com/. Pension Expense/Expenditures:
The Department’s aggregate pension expense/expenditures for all plans amounted to $5,327,940 for the fiscal year
36 Palm Beach County, Florida, Water Utilities Department

ended September 30, 2020. The Department’s aggregate net pension liability for all plans was $40,977,970, with balances of deferred outflows of resources related to pensions of $11,801,757 and deferred inflows of resources related to pensions of $935,824 as of September 30, 2020. Florida Retirement System (FRS) Pension Plan Benefits Provided The Florida Retirement System was created on December 1, 1970. Members enrolled in the FRS and actively employed on July 1, 2001, or first enrolled between July 1, 2001 and June 30, 2011, will be vested, or eligible to receive future benefits after 6 years of creditable service. Participants first enrolled on or after July 1, 2011 will be vested, or eligible to receive future benefits after 8 years of creditable service. Retirement, disability, and death benefits are based on age, average final compensation and years-of-service credit. For members initially enrolled in the FRS before July 1, 2011, average final compensation is the average of the five highest fiscal years of salary earned during covered employment. For members initially enrolled in the FRS on or after July 1, 2011, average final compensation is the average of the eight highest fiscal years of salary earned during covered employment. Members are eligible for normal retirement when they have met the minimum requirements established by their membership class. For members initially enrolled in the FRS before July 1, 2011, Regular Class members are eligible for normal retirement if they are vested and age 62 or if they have 30 years of creditable service regardless of age. For members initially enrolled in the FRS on or after July 1, 2011, Regular Class members are eligible for normal retirement if they are vested and age 65 or if they have 33 years of creditable service regardless of age. Early retirement may be taken any time after vesting. However, there is a 5% reduction of benefits for each year prior to normal retirement age or date. The percentage level of employees’ payroll contribution rates is determined using the frozen entry age actuarial cost method. Beginning July 1, 1998, the FRS implemented the Deferred Retirement Option Program (DROP), which is a program within the FRS Pension Plan that allows members to retire without terminating their employment for up to five years while their retirement benefits accumulate and earn interest compounded monthly at a stated effective annual rate. For members who entered DROP prior to July 1, 2011, the rate is 6.5%. For members who enter DROP on or after July 1, 2011, the rate is 1.3%. Members may participate in DROP when they are vested and have reached their normal retirement date. When the DROP period ends, members must terminate employment, whereupon members will receive their accumulated DROP benefits and begin receiving their monthly retirement benefit. The FRS was amended in 2000 to provide a defined contribution plan alternative to the defined benefit plan for FRS members effective July 1, 2002. This integrated defined contribution plan is known as the FRS Investment Plan, which is described later in this note. Contributions The following membership classes and contribution rates, which apply to both the FRS Pension Plan and the FRS Investment Plan, were in effect at September 30, 2020:
Membership Class Regular Special Risk State Attorney/Public Defender County, City, Special District Elected Officers Special Risk Administrative Support Senior Management Deferred Retirement Option Program
Employee Contribution
Rate
3.00% 3.00% 3.00% 3.00% 3.00% 3.00%
N/A
Employer Contribution
Rate*
6.75% 23.76% 54.31% 47.10% 36.87%
23.69% 12.94%
2020 Comprehensive Annual Financial Report 37

The following membership classes and contribution rates, which apply to both the FRS Pension Plan and the FRS Investment Plan, were in effect at September 30, 2019:
Membership Class Regular Special Risk State Attorney/Public Defender County, City, Special District Elected Officers Special Risk Administrative Support Senior Management Deferred Retirement Option Program
Employee Contribution
Rate
3.00% 3.00% 3.00% 3.00% 3.00% 3.00%
N/A
Employer Contribution
Rate*
8.47% 25.48% 56.03% 48.32% 38.59%
25.41% 14.60%
*Employer contribution rates in the above table include a 1.66% contribution for the Retiree Health Insurance Subsidy Program. The Department’s employer contributions to the FRS Pension Plan totaled $3.2 million and employee contributions totaled $1.0 million for the fiscal year ended September 30, 2020. The Department contributed 100 percent of its statutorily required contributions for the current and preceding two years. Net Pension Liability, Deferrals, and Pension Expenses At September 30, 2020 the Department reported a liability of $33.8 million for its proportionate share of the FRS Pension Plan’s net pension liability, which was measured as of June 30, 2020. The total pension liability used to calculate the net liability was determined by an actuarial valuation as of July 1, 2020. The Department’s proportionate share of the net pension liability was based on the Department’s 2019-20 fiscal year contributions relative to the 2019-20 fiscal year contributions of all participating members. At June 30, 2020 the Department’s proportionate share was 0.078% which was an increase of 0.003 from its proportionate share measured as of June 30, 2019. For the fiscal year ended September 30, 2020 the Department recognized pension expense of $5.1 million related to the FRS Pension Plan. In addition, the Department reported deferred outflows of resources and deferred inflows of resources related to pensions from the following sources:
Description
Deferred Inflows of Resources
Deferred Outflows of Resources
Differences between expected and actual experience
$-
$1,294,951
Change of assumptions - 6,125,290
Net difference between projected and actual earnings on Pension Plan investments
-
2,014,594
Changes in proportion and differences between Department Pension Plan contributions and proportionate share of contributions
376,439
453,505
Department Pension Plan contributions subsequent to the measurement date
-
669,750
Total
$376,439
$10,558,090
The Department’s contributions to the FRS Pension Plan subsequent to the measurement date will be recognized as a reduction of the net pension liability in the fiscal year ended September 30, 2021. Other amounts reported as deferred outflows and inflows of resources related to the Pension Plan will be recognized in pension expense as follows:
38 Palm Beach County, Florida, Water Utilities Department

Fiscal Year Ending September 30 Amount 2021 $2,019,138
2022 3,045,667
2023 2,539,424
2024 1,525,403
2025 408,932
Thereafter
(26,663)
Total $9,511,901
For the fiscal year ended September 30, 2019 the Department recognized pension expense of $6.1 million related to the FRS Pension Plan. In addition, the Department reported deferred outflows of resources and deferred inflows of resources related to pensions from the following sources:
Description
Deferred Inflows of Resources
Deferred Outflows of Resources
Differences between expected and actual experience
$16,050
$1,533,943
Change of assumptions - 6,642,448
Net difference between projected and actual earnings on Pension Plan investments
1,430,816
-
Changes in proportion and differences between Department Pension Plan contributions and proportionate share of contributions
579,817
398,766
Department Pension Plan contributions subsequent to the measurement date
-
591,160
Total $2,026,683 $9,166,317
The Department’s contributions to the FRS Pension Plan subsequent to the measurement date will be recognized as a reduction of the net pension liability in the fiscal year ended September 30, 2020. Other amounts reported as deferred outflows and inflows of resources related to the Pension Plan will be recognized in pension expense as follows:
Fiscal Year Ending September 30 Amount 2020 $2,361,949
2021 755,647
2022 1,779,207
2023 1,273,315
2024 298,104
Thereafter
80,305
Total $6,548,527
Actuarial Assumptions
The total pension liability in the June 30, 2020 actuarial valuation was determined using the following actuarial assumptions applied to all periods included in the measurement:
Inflation: 2.4 percent
Investment Rate of Return: 6.8 percent, net of plan investment expense
Salary Increases: 3.25% average, including inflation
Mortality: was calculated using the PUB 2010 with Projection Scale MP 2018, with adjustments for member category and sex projected generationally.
2020 Comprehensive Annual Financial Report 39

The total pension liability in the June 30, 2019 actuarial valuation was determined using the following actuarial assumptions applied to all periods included in the measurement:
Inflation: 2.6 percent
Investment Rate of Return: 6.9 percent, net of plan investment expense
Salary Increases: 3.25% average, including inflation
Mortality: was calculated using the PUB-2010 with Projection Scale MP-2018, with adjustments for member category and sex projected generationally.
The actuarial assumptions used in the June 30, 2020 and 2019 valuations were based on the results of an actuarial experience study for the period July 1, 2013 through June 30, 2018. The long-term expected rate of return on Pension Plan investments was not based on historical returns but instead is based on a forward-looking capital market economic model. The allocation policy’s description of each asset class was used to map the target allocation to the asset classes shown below. Each asset class assumption is based on a consistent set of underlying assumptions and includes an adjustment for the inflation assumption. The target allocation and best estimates of arithmetic and geometric real rates of return for each major asset class are summarized in the following table:
Asset Class
Target Allocation (1)
Annual
Arithmetic Return
Compound Annual
(Geometric) Return
Standard Deviation
Cash 1.0% 2.2% 2.2% 1.2% Fixed income 19.0% 3.0% 2.9% 3.5% Global equity 54.2% 8.0% 6.7% 17.1% Real estate (property) 10.3% 6.4% 5.8% 11.7% Private equity 11.1% 10.8% 8.1% 25.7%
Strategic investments 4.4% 5.5% 5.3% 6.9%
Total 100%
Assumed inflation – mean 2.4% 1.7%
Note 1: As outlined in the Pension Plan’s investment policy
Discount Rate – The discount rate used to measure the total pension liability was 6.8% The Pension Plan’s fiduciary net position was projected to be available to make all the projected future benefit payments of current active and inactive employees. Therefore, the discount rate for calculating the total pension liability is equal to the long-term expected rate of return. Sensitivity to Changes in the Discount Rate – The following represents the Department’s proportionate share of the net pension liability calculated using the 6.8% discount rate as well as what the Department’s proportionate share would be if it were calculated using a discount rate one percentage point lower (5.8%) or one percentage point higher (7.8%) than the current rate:
2020 Discount Rates
1% decrease (5.8%)
Current 6.8% Discount Rate
1% increase (7.8%)
Department’s proportionate share of the net pension liability
$54,029,501
$33,835,434
$16,969,261
40 Palm Beach County, Florida, Water Utilities Department

2019 Discount Rates
1% decrease (5.9%)
Current 6.9% Discount Rate
1% increase (7.9%)
Department’s proportionate share of the net pension liability
$44,706,610
$25,861,898
$10,123,376
Pension Plan Fiduciary Net Position – Detailed information regarding the Pension Plan’s fiduciary net position is available in the separately issued FRS Pension Plan and Other State-Administered Systems Comprehensive Annual Financial Report. Retiree Health Insurance Subsidy (HIS) Program: Benefits Provided – For the fiscal year ended September 30, 2019, eligible retirees and beneficiaries received a monthly payment of $5 for each year of creditable service completed at the time of retirement, with a minimum HIS payment of $30 and a maximum HIS payment of $150 per month. To be eligible to receive an HIS Plan benefit, a retiree under State-administered retirement system must provide proof of health insurance coverage, which may include Medicare.
Contributions – The HIS Program is funded by required contributions from participating employers as set by the Florida Legislature. Employer contributions are a percentage of gross compensation for all active Pension Plan members. For the fiscal year ended September 30, 2020 the contribution rate was 1.66% of total Pension Plan contributions. The Department contributed 100% of its statutorily required contributions for the current and preceding three years. The HIS Program contributions are deposited in a separate trust fund from which payments are authorized. The HIS Program benefits are not guaranteed and are subject to annual legislative appropriation. In the event the legislative appropriation or available funds fail to provide full subsidy benefits to all participants, benefits may be reduced or cancelled.
The Department’s employer contributions to the HIS Program totaled $52,710 for the fiscal year ended September 30, 2020. The Department contributed 100 percent of its statutorily required contributions for the current and preceding two years.
Net Pension Liability, Deferrals and Pension Expense At September 30, 2020 the Department reported a liability of $7.1 million for its proportionate share of the HIS Program’s net pension liability, which was measured as of June 30, 2020. The total pension liability used to calculate the net liability was determined by an actuarial valuation as of July 1, 2020. The Department’s proportionate share of the net pension liability was based on the Department’s fiscal year 2019-20 fiscal year contributions relative to the 2019-20 fiscal year contributions of all participating members for the same period. At June 30, 2020 the Department’s proportionate share was 0.058%, which was an increase of 0.001 from its proportionate share measured as of June 30, 2019.
For the fiscal year ended September 30, 2020, the Department recognized pension expense of $259,524 related to the HIS Program. In addition, the Department reported deferred outflows of resources and deferred inflows of resources related to the HIS Program from the following sources:
2020 Comprehensive Annual Financial Report 41

Description
Deferred Inflows of Resources
Deferred Outflows of Resources
Differences between expected and actual experience
$5,510
$292,173
Change of assumptions 415,311 768,026
Changes in proportion and differences between Department Pension Plan contributions and proportionate share of contributions
138,564
96,906
Net difference between projected and actual Earnings on Pension Plan investments
-
5,703
Department Pension Plan contributions subsequent to the measurement date
-
80,860
Total $559,385 $1,243,668
The Department’s contributions to the HIS Program subsequent to the measurement date and will be recognized as a reduction of the net pension liability in the fiscal year ending September 30, 2021. Other amounts reported as deferred outflows and inflows of resources related to the HIS Program will be recognized in pension expense as follows:
Fiscal Year Ending September 30 Amount 2021 $163,537
2022 132,209
2023 41,614
2024 65,827
2025 103,993
Thereafter 96,243
Total $603,423
At September 30, 2019 the Department reported a liability of $6.4 million for its proportionate share of the HIS Program’s net pension liability, which was measured as of June 30, 2019. The total pension liability used to calculate the net liability was determined by an actuarial valuation as of July 1, 2019. The Department’s proportionate share of the net pension liability was based on the Department’s fiscal year 2018-19 fiscal year contributions relative to the 2018-19 fiscal year contributions of all participating members for the same period. At June 30, 2019 the Department’s proportionate share was 0.057%, which was a decrease of 0.001 from its proportionate share measured as of June 30, 2018.
For the fiscal year ended September 30, 2019, the Department recognized pension expense of $469,761 related to the HIS Program. In addition, the Department reported deferred outflows of resources and deferred inflows of resources related to the HIS Program from the following sources:
Description
Deferred Inflows of Resources
Deferred Outflows of Resources
Differences between expected and actual experience
$7,812
$77,494
Change of assumptions 521,459 738,757
Changes in proportion and differences between Department Pension Plan contributions and proportionate share of contributions
172,644
123,714
Net difference between projected and actual Earnings on Pension Plan investments
-
4,117
Department Pension Plan contributions subsequent to the measurement date
-
76,116
Total $701,915 $1,020,198
42 Palm Beach County, Florida, Water Utilities Department

The Department’s contributions to the HIS Program subsequent to the measurement date and will be recognized as a reduction of the net pension liability in the fiscal year ending September 30, 2020. Other amounts reported as deferred outflows and inflows of resources related to the HIS Program will be recognized in pension expense as follows:
Fiscal Year Ending September 30 Amount 2020 $104,482
2021 86,503
2022 55,934
2023 (32,396)
2024 (8,735)
Thereafter 36,368
Total $242,156
Actuarial Assumptions The total pension liability in the June 30, 2020 actuarial valuation was determined using the following actuarial assumptions applied to all periods included in the measurement:
Inflation: 2.40 percent.
Municipal Bond Rate: 2.21 percent.
Salary Increases: 3.25 percent, average, including inflation.
Mortality: was calculated using the PUB-2010 with Projection Scale MP-2018, with adjustments for member category and sex projected generationally.
The total pension liability in the June 30, 2019 actuarial valuation was determined using the following actuarial assumptions applied to all periods included in the measurement:
Inflation: 2.60 percent.
Municipal Bond Rate: 3.50 percent.
Salary Increases: 3.25 percent, average, including inflation.
Mortality: was calculated using the PUB-2010 with Projection Scale MP-2018, with adjustments for member category and sex projected generationally.
The actuarial assumptions used in the June 30, 2020 and 2019 valuations were based on certain results of an actuarial experience study of the FRS for the period July 1, 2013 through June 30, 2018. Discount Rate – The discount rate used to measure the total pension liability was 2.21%. In general, the discount rate for calculating the total pension liability is equal to the single rate equivalent of discounting at the long-term expected rate of return for benefit payments prior to the projected depletion date. Because the HIS benefit is essentially funded on a pay-as-you-go basis, the depletion date is considered to be immediate, and the single equivalent discount rate is equal to the municipal bond rate selected by the HIS Program sponsor. The Bond Buyer General Obligation 20-Bond Municipal Bond Index was adopted as the applicable municipal bond index. Sensitivity to Changes in the Discount Rate – The following tables represents the Department’s proportionate share of the net pension liability as well as what the Department’s proportionate share of the net pension liability would be if it were calculated using a discount rate one percentage point lower or one percentage point higher than the current rate:
2020 Comprehensive Annual Financial Report 43

2020 Discount Rates
1% decrease (1.21%)
Current 2.21% Discount Rate
1% increase (3.21%)
Department’s proportionate share of the net pension liability
$8,256,453
$7,142,536
$6,230,798
2019 Discount Rates
1% decrease (2.50%)
Current 3.50% Discount Rate
1% increase (4.50%)
Department’s proportionate share of the net pension liability
$7,283,229
$6,350,116
$5,627,924
Florida Retirement System Investment Plan Vesting Provisions: For all membership classes, employees are immediately vested in their own contributions and are vested after one year of service for employer contributions and investment earnings. If an accumulated benefit obligation for service credit originally earned under the FRS Pension Plan is transferred to the Investment Plan, the member must have the years of service required for FRS Pension Plan vesting (including the service credit represented by the transferred funds) to be vested for these funds and the earnings on the funds. Nonvested employer contributions are placed in a suspense account for up to five years. If the employee returns to FRS-covered employment within the five-year period, the employee will regain control over their account. If the employee does not return within the five-year period, the employee will forfeit the accumulated account balance. Costs of administering the Investment Plan, including the FRS Financial Guidance Program, are funded through an employer contribution of 0.04% of payroll, which is included in the FRS contribution rates, and by forfeited benefits of Investment Plan members. For the fiscal year ended September 30, 2020, the information for the amount of forfeitures was unavailable from the SBA; however, management believes that these amounts, if any, would be immaterial to the Department. After termination and applying to receive benefits, the member may rollover vested funds to another qualified plan, structure a periodic payment under the Investment Plan, receive a lump-sum distribution, leave the funds invested for future distribution, or any combination of these options. Disability coverage is provided; the member may either transfer the account balance to the FRS Pension Plan when approved for disability retirement to receive guaranteed lifetime monthly benefits under the FRS Pension Plan, or remain in the Investment Plan and rely upon that account balance for retirement income. The Department’s employer contributions to the Investment Plan totaled $0.2 million for the fiscal year ended September 30, 2020. 11. OTHER POST-EMPLOYMENT BENEFITS (OPEB) In addition to the retirement plans, the Department provides a defined benefit health care OPEB plan, which provides medical benefits to all eligible retired employees and their dependents. OPEB Expense/Expenditures: The Department’s share of OPEB expense/expenditures was $88,931 for the fiscal year ended September 30, 2020. The Department’s total OPEB liability was $1,281,415, with deferred outflows of resources related to OPEB of $299,505 and deferred inflows of resources related to OPEB of $25,692 as of September 30, 2020. For the fiscal year ended September 30, 2019 the Department’s share of OPEB expense/expenditures was $81,157. The Department’s OPEB liability was $1,027,869, with deferred outflows of resources related to OPEB of $74,666 and deferred inflows of resources related to OPEB of $26,589 as of September 30, 2019.
44 Palm Beach County, Florida, Water Utilities Department

Plan Description - The plan is a single-employer plan administered by the County. The authority to establish and amend the benefit terms and financing requirements is granted to the County Board. The Department, as an entity of the County, is required by Florida Statute 112.0801 to allow its retirees (and eligible dependents) to continue participation in the group insurance plan. No assets are accumulated in a trust which meets the criteria in Paragraph 4 of GASB Statement No. 75. Additionally, there are no legal documents referencing a trust. The healthcare benefits OPEB plan does not issue a separate stand-alone financial report. Benefits Provided - Retirees of the healthcare benefit OPEB plan must be offered the same coverage as is offered to active employees at a premium cost no more than the premium cost applicable for active employees, resulting in an implicit subsidy. Employees Covered by Benefit Terms As of September 30, 2020, the following employees were covered by the benefit terms:
Retirees and beneficiaries
12
Active members 517
Total 529
As of September 30, 2019, the following employees were covered by the benefit terms:
Retirees and beneficiaries
10
Active members 539
Total 549
Total OPEB Liability – The total healthcare OPEB liability of $1,281,415 was measured as of September 30, 2020. The liability measured in the September 30, 2020 actuarial valuation was determined using the following actuarial assumptions and other inputs applied to all periods included in the measurement, unless otherwise specified:
Actuarial valuation date 9/30/2020
Inflation rate 3.0%
Projected annual salary increase
3.5%
Discount rate 2.21%
Initial healthcare inflation rate
6.0%
Ultimate healthcare inflation rate (3 years out)
4.5%
The discount rate was based on the Bond Buyer 20-Bond GO index. Mortality rates were based on the PUB 2010 generational table with MP-2019 generational scale and applied on a gender-specific basis. No formal experience study was performed; however, the actuarial assumptions used in the valuation were consistent with the Florida Retirement System.
2020 Comprehensive Annual Financial Report 45

Changes in Total OPEB Liability - The following table illustrates changes in the Department’s portion of the forgoing for the fiscal years ended September 30, 2020 and 2019:
Description
2020
2019
Balances, beginning of year $1,027,869 $988,208
Changes for the year:
Service cost 51,282 58,942 Interest cost 37,572 67,172 Differences between expected and actual experience 137,523 - Changes in assumptions or other inputs 185,801 131,483 Benefit payments (158,632) (217,936) Net changes 253,546 39,661
Total $1,281,415 $1,027,869
Sensitivity of the Total OPEB Liability to Changes in the Discount Rate – The following tables present the Department’s share of the total OPEB liability as well as what that liability would be if it were calculated using a discount rate 1 percent lower or 1 percent higher than the current discount rate:
2020 Discount Rates
1% decrease (1.21%)
Current 2.21% Discount Rate
1% increase (3.21%)
Total OPEB liability $1,371,129 $1,281,415 $1,204,543
2019 Discount Rates
1% decrease (1.66%)
Current 2.66% Discount Rate
1% increase (3.66%)
Total OPEB liability $1,034,354 $1,027,869 $981,044
Sensitivity of the Total OPEB Liability to Changes in Healthcare Cost Trend Rates – The following table presents the Department’s share of the total OPEB liability as well as what that liability would be if it were calculated using healthcare cost trend rates 1 percent lower or 1 percent higher than the assumed trend rate:
2020 Healthcare Cost Trend Rates
1% decrease 5.0% decreasing to 3.5% over 3
years
Current Rate 6.0% decreasing to 4.5% over 3
years
1% increase 7.0% decreasing to 5.5% over 3
years
Total OPEB Liability $1,166,100 $1,281,415 $1,422,386
2019 Healthcare Cost Trend Rates
1% decrease 5.5% decreasing to 3.5% over 4
years
Current Rate 6.5% decreasing to 4.5% over 4
years
1% increase 7.5% decreasing to 5.5% over 4
years
Total OPEB Liability $915,751 $1,027,869 $1,171,845
46 Palm Beach County, Florida, Water Utilities Department

OPEB Expense, Deferred Outflows of Resources and Deferred Inflows of Resources Related to OPEB - For the fiscal years ended September 30, 2020 and September 30, 2019 the healthcare OPEB plan recognized OPEB expense of $88,931 and $81,157, respectively. At September 30, 2020 the plan reported deferred outflows of resources and deferred inflows of resources related to OPEB from the following:
September 30, 2020
Description
Deferred Outflows
of Resources
Deferred Inflows of
Resources
Differences between expected & actual experience $96,462 Change of assumptions/inputs 203,043 $(25,692)
Total $299,505 $(25,692)
September 30, 2019
Description
Deferred Outflows
of Resources
Deferred Inflows of
Resources
Change of assumptions/inputs $74,666 $(26,589)
Amounts reported as deferred outflows of resources and deferred inflows of resources related to the healthcare OPEB plan will be recognized in OPEB expense as follows:
Fiscal Year Ending September 30 Amount
2021 $21,720
2022 21,720
2023 21,720
2024 21,720
2025 21,720
Thereafter 165,213
Total $273,813
12. INTEREST COSTS
Total interest costs incurred by the Department were $5,999,343 and $6,926,142, of which $2,526,805 and $2,362,146 were capitalized as part of capital assets, for the fiscal years ended September 30, 2020 and 2019, respectively. 13. RELATED PARTY TRANSACTIONS The County allocated to the Department certain support department costs which include legal, administrative, fiscal, purchasing, personnel, internal audit, data processing, and communication costs. The Department is also charged for the costs of services provided by the County’s Fleet Management, Casualty Self-Insurance, Employee Health Insurance, and Workers’ Compensation Internal Service Funds. The total of such costs charged to expense for the fiscal years ended September 30, 2020 and 2019, was approximately $27,715,000 and $27,180,000, respectively. The Department covers risk of loss from fire, theft, natural disasters, and damage to assets, in excess of $200,000 per person or $300,000 per occurrence, with commercial insurance purchased through the County’s Risk Management Fund, with the coverage specifically designated for the Department’s facilities. In none of the last three fiscal years have settlements pertaining to the Department’s property exceeded insurance coverage. Liability claims risk from torts, errors of omission, negligence, and the aforementioned causes (below the specified limits) is covered by the Department’s participation in the County’s Casualty Self-Insurance Fund (a public entity risk pool in which all County departments, excluding the Sheriff, participate). Premiums are based on estimates of
2020 Comprehensive Annual Financial Report 47

the amounts needed to pay prior year claims, current year claims, and claims incurred but not reported. Settlements pertaining to the Department have not exceeded coverage limits in any of the past three years. The Department’s risk for injuries to employees is covered 100% under the County’s self-insured Workers’ Compensation Fund. Premiums and participation are the same as for the Casualty Self-Insurance Fund.
The Department provides health insurance to its employees through the County’s self-insured policy. All County departments participate, with premiums determined on the same premise as above. Settled claims have not exceeded coverage in any of the last three years.
14. CONTINGENCIES
The Federal Emergency Management Agency (FEMA) reimbursed the Department certain costs related to Hurricanes Frances and Wilma in fiscal years 2005 and 2006, respectively. Subsequent audits of these reimbursements determined up to $2,626,448 of the reimbursement was for costs FEMA disallowed. The County is appealing the decision and, due to uncertainty regarding the amount, if any, which will be actually repaid, has not recognized a liability in the financial statements.
The Department is also involved in various lawsuits arising from the ordinary course of operations. Although the outcome of these matters is not presently determinable, it is the opinion of Department management, based on consultation with legal counsel, that the outcome of these matters will not materially affect the financial position of the Department.
In December 2019, a novel strain of coronavirus surfaced in Wuhan, China, and has spread throughout the globe, with resulting business and social disruption. The coronavirus was declared a Public Health Emergency of International Concern by the World Health Organization on January 30, 2020. Due to the pandemic, the Department suspended the billing of OGI Fees and Late Fees from April 2020 to August 2020, for a total of $387,000 and $734,000, respectively. The operations and business results of the County have been and continue to be significantly affected by decreased sales tax collections due to the shuttering of many businesses deemed non-essential. The extent of these effects on governmental activity, business activity and investment results going forward depend on future developments and the success of mitigation and treatment efforts. The primary effects on the Department are 1) increased bad debt expense, 2) decreased investment income and 3) expenditures for personal protective equipment.
15. DEFERRED COMPENSATION
The Department participates in the County’s Deferred Compensation Plan. The County offers its employees a deferred compensation plan created in accordance with Internal Revenue Code Section 457. The plan, available to all County employees, permits them to defer a portion of their salary until future years. The deferred compensation is not available to employees until termination, retirement, death, or certain unforeseen emergencies.
All amounts of compensation deferred under the plan, all property and rights purchased with those amounts, and all income attributable to those amounts, property or rights, are (until paid or made available to the employee or other beneficiary) held in trust for the exclusive benefit of the plan participants and their beneficiaries.
16. SUBSEQUENT EVENTS
On October 27, 2020 the Department issued $59,375,000 Series 2020 Water and Sewer Revenue Refunding Bonds for the purpose of advance refunding $51,325,000 of Series 2013 Water & Sewer Revenue Refunding Bonds maturing on or after October 1, 2024. The Department place into irrevocable trust funds sufficient to pay interest on said bonds and redeem on those bonds on the October 1, 2023 call date. As a result, the Department recognized an accounting loss of $4,833,851 but realized an economic gain (net present value of cash flow savings) of $7,708,533.
The Department’s management evaluated subsequent events through March 26, 2021, the date the financial statements were available to be issued and has determined that no additional material events have occurred which would require disclosure.
48 Palm Beach County, Florida, Water Utilities Department

REQUIRED SUPPLEMENTARY INFORMATION (unaudited)
2020 Comprehensive Annual Financial Report 49

PALM BEACH COUNTY, FLORIDAWATER UTILITIES DEPARTMENT
FLORIDA RETIREMENT SYSTEM PENSION PLAN (FRS)For the Last Ten Fiscal Years*
Schedule of Proportionate Share of Net Pensions Liability
2020 2019 2018 2017 2016 2015 2014
Department's proportion of the FRS net pension liability 0.078% 0.075% 0.076% 0.081% 0.079% 0.078% 0.079%
Department's proportionate share of the FRS net pension liability 33,835,434$ 25,861,898$ 22,915,248$ 23,906,665$ 19,919,085$ 10,030,459$ 4,847,927$ Department's covered payroll 32,012,003$ 31,262,882$ 31,009,120$ 31,394,359$ 31,953,486$ 29,503,880$ 28,927,640$ Department's proportionate share of the FRS net pension liability as a percentage of its covered payroll 105.7% 82.7% 73.9% 76.1% 62.3% 34.0% 16.8% FRS Plan fiduciary net position as a percentage of the total pension liability 78.85% 82.61% 84.26% 83.89% 84.88% 92.00% 96.09%
NOTE: The amounts presented for each fiscal year were determined as of June 30th. The schedule is presented to illustrate the requirements of GASB Statement No. 68. Currently, only data for fiscal years 2014 through 2020 is available.
Schedule of Contributions to Florida Retirement System Pension Plan
2020 2019 2018 2017 2016 2015 2014
Contractually required FRS contribution 3,122,589$ 2,804,807$ 2,595,181$ 2,479,881$ 2,383,065$ 2,260,802$ 2,159,631$
FRS contributions in relation to the contractually required contribution 3,122,589$ 2,804,807$ 2,595,181$ 2,479,881$ 2,383,065$ 2,260,802$ 2,159,631$
FRS contribution deficiency (excess) -$ -$ -$ -$ -$ -$ -$ Department's covered payroll 32,918,741$ 31,984,496$ 30,579,222$ 30,596,525$ 30,413,366$ 29,254,317$ 28,937,668$
FRS contributions as a percentage of covered payroll 9.5% 8.8% 8.5% 8.1% 7.8% 7.7% 7.5% NOTE: The schedule is presented to illustrate the requirements of GASB Statement No. 68 as of September 30th. Currently only data for 2014 through 2020 is available.
(REQUIRED SUPPLEMENTARY INFORMATION)
(unaudited)
50 Palm Beach County, Florida, Water Utilities Department

PALM BEACH COUNTY, FLORIDAWATER UTILITIES DEPARTMENT
HEALTH INSURANCE SUBSIDY PENSION PLAN (HIS)For the Last Ten Fiscal Years
Schedule of Proportionate Share of Net Pensions Liability
2020 2019 2018 2017 2016 2015 2014
Department's proportion of the 0.058% 0.057% 0.058% 0.060% 0.060% 0.061% 0.061% HIS net pension liability
Department's proportionate share of the 7,142,536$ 6,350,116$ 6,114,168$ 6,441,337$ 6,870,208$ 6,165,853$ $ 5,730,171 HIS net pension liability 32,012,003$ 31,262,882$ 31,009,120$ 31,394,359$ 31,953,486$ 29,503,880$ $ 28,927,640 Department's covered payroll Department's proportionate share of the HIS net pension liability as a 22.3% 20.3% 19.7% 20.5% 21.5% 20.9% 19.8% percentage of its covered payroll HIS Plan fiduciary net position as a 3.00% 2.63% 2.15% 1.64% 0.97% 0.99% 0.99% percentage of the total pension liability
NOTE: The amounts presented for each fiscal year were determined as of June 30th. The schedule is presented to illustrate the requirements of GASB Statement No. 68. Currently, only data for fiscal years 2014 through 2020 is available.
Schedule of Contributions to Health Insurance Subsidy Pension Plan
2020 2019 2018 2017 2016 2015 2014
Contractually required HIS contribution 52,710$ 47,346$ 43,807$ 41,861$ 40,227$ 28,850$ 27,559$
HIS contributions in relation to the contractually required contribution 52,710$ 47,346$ 43,807$ 41,861$ 40,227$ 28,850$ 27,559$
HIS contribution deficiency (excess) -$ -$ -$ -$ -$ -$ -$ Department's covered payroll 32,918,741$ 31,984,496$ 30,579,222$ 30,596,525$ 30,413,366$ 29,254,317$ 28,934,668$
HIS contributions as a percentage of covered payroll 0.16% 0.15% 0.14% 0.14% 0.13% 0.10% 0.10% NOTE: The schedule is presented to illustrate the requirements of GASB Statement No. 68 as of September 30th. Currently only data for 2014 through 2020 is available.
(REQUIRED SUPPLEMENTARY INFORMATION)
(unaudited)
2020 Comprehensive Annual Financial Report 51

PALM BEACH COUNTY, FLORIDAWATER UTILITIES DEPARTMENT
SCHEDULE OF CHANGES IN THE TOTAL OPEB LIABILITY AND RELATED RATIOS COUNTY HEALTH-CARE OPEB PLAN
Last Ten Fiscal Years
2020 2019 2018
Total OPEB liability - beginning 1,027,869$ 988,208$ 1,064,296$ Service cost 51,282 58,942 46,378 Interest cost 37,572 67,172 59,065 Differences between expected and actual experience 137,523 - - Change of assumptions 185,801 131,482 (41,803) Benefit payments, including refunds of member contributions (158,632) (217,935) (139,728) Net change in total OPEB liability 253,546 39,661 (76,088) Total OPEB liability - ending 1,281,415$ 1,027,869$ 988,208$
Covered employee payroll 32,918,741$ 31,984,496$ 30,579,222$
Total OPEB liability as a percentage of covered employee payroll 3.9% 3.2% 3.2%
Changes of assumptions: Changes of assumptions and other inputs reflect the effects of changes inthe discount rate each period. The following are the discount rates used in each period:
2020 2.21%2019 2.66%2018 4.24%
Notes to Schedule: (1) GASB Statement No. 75, "Accounting and Financial Reporting for Postemployment Benefits Other Than Pensions", was implemented in fiscal year 2018 requiring ten-year trend data. Additional years will be displayed as the data becomes available. (2) Amounts are as of September 30 of each year. (3) Currently only data for 2018 through 2020 is available.
(REQUIRED SUPPLEMENTARY INFORMATION)
(unaudited)
52 Palm Beach County, Florida, Water Utilities Department

SUPPLEMENTARY INFORMATION
2020 Comprehensive Annual Financial Report 53

PALM BEACH COUNTY, FLORIDAWATER UTILITIES DEPARTMENT
BUDGETARY COMPARISON SCHEDULEREVENUES, EXPENSES (natural classification), AND CHANGES IN NET POSITION
For the Fiscal Year Ended September 30, 2020
Original Current ActualBudget Budget Results Variance %
OPERATING REVENUES: Charges for services 202,177,000$ 202,177,000$ 213,330,647$ 11,153,647$ 6% Other operating revenue 4,945,350 4,945,350 4,646,171 (299,179) -6% Total operating revenues 207,122,350 207,122,350 217,976,818 10,854,468 5%
OPERATING EXPENSES: Depreciation and amortization 51,974,274 51,974,274 51,977,357 (3,083) 0% Personal services 49,165,063 49,165,063 50,243,028 (1,077,965) -2% Maintenance 52,934,013 52,934,008 34,064,968 18,869,040 36% Supplies 28,591,597 28,591,597 18,573,921 10,017,676 35% Contractual services 23,262,105 23,262,105 19,483,677 3,778,428 16% Purchased water and wastewater treatment 12,934,000 12,934,000 10,041,954 2,892,046 22% Utilities 9,997,571 9,997,571 8,001,217 1,996,354 20% Equity interest in net gain of joint venture (810,705) (810,705) (810,705) - 0% Miscellaneous 2,796,552 2,796,552 2,635,515 161,037 6% Total operating expenses 230,844,470 230,844,465 194,210,932 36,633,533 16%
OPERATING INCOME (LOSS) (23,722,120) (23,722,115) 23,765,886 47,488,001 200%
NONOPERATING REVENUES (EXPENSES): Investment income 5,653,421 5,653,421 5,244,563 (408,858) -7% Interest expense (3,590,695) (2,945,250) (2,597,287) 347,963 12% Engineering fees 926,000 926,000 843,502 (82,498) -9% Engineering expenses (1,077,000) (1,077,000) (893,199) 183,801 17%
Other 355,000 (9,764) (24,828) (15,064) -154%
Total nonoperating revenues 2,266,726 2,547,407 2,572,751 25,344 1%
INCOME (LOSS) BEFORE CAPITAL CONTRIBUTIONS AND TRANSFERS (21,455,394) (21,174,708) 26,338,637 47,513,345 224%
Transfers from other County Funds 287,226 287,226 287,226 - 0%Transfers to other County Funds (140,156) (140,156) (136,471) 3,685 3%Capital contributions received, net 41,861,000 41,861,000 38,303,201 (3,557,799) -8%
CHANGE IN NET POSITION 20,552,676$ 20,833,362$ 64,792,593$ 43,959,231$ 211%
(Supplementary Information)
54 Palm Beach County, Florida, water Utilities Department

PALM BEACH COUNTY, FLORIDAWATER UTILITIES DEPARTMENT
BUDGETARY COMPARISON SCHEDULEREVENUES, EXPENSES (functional classification), AND CHANGES IN NET POSITION
For the Fiscal Year Ended September 30, 2020
CurrentBudget Actual Variance %
OPERATING REVENUES: Water - base facility 48,313,000$ 50,795,275$ 2,482,275$ 5% Water - commodity 47,724,000 51,832,077 4,108,077 9% Water - contractual 2,364,000 3,299,395 935,395 40% Wastewater - base facility 54,043,000 55,606,189 1,563,189 3% Wastewater - commodity 36,991,000 38,817,569 1,826,569 5% Wastewater - contractual 1,485,000 2,354,769 869,769 59% Reclaimed water - retail 2,095,000 2,480,906 385,906 18% Reclaimed water - bulk 8,156,000 7,190,842 (965,158) -12% Customer account charge 1,006,000 953,625 (52,375) -5% Other operating revenue 4,945,350 4,646,171 (299,179) -6% Total operating revenues 207,122,350 217,976,818 10,854,468 5%
OPERATING EXPENSES: Water treatment 46,896,970 35,355,918 11,541,052 25% Water distribution 19,967,292 13,718,985 6,248,307 31% Wastewater treatment 24,296,287 18,061,667 6,234,620 26% Wastewater collection 24,750,809 21,572,385 3,178,424 13% Purchased water and wastewater treatment 12,934,000 10,041,954 2,892,046 22% Customer accounts 16,895,260 10,983,701 5,911,559 35% Administrative and general 33,940,278 33,309,670 630,608 2% Total operating expenses 179,680,896 143,044,280 36,636,616 20%
Operating income before depreciation, amortization and equity interest in net gain of joint venture 27,441,454 74,932,538 47,491,084 173% Depreciation and amortization 51,974,274 51,977,357 (3,083) 0% Equity interest in net gain of joint venture (810,705) (810,705) - 0%OPERATING INCOME (LOSS) (23,722,115) 23,765,886 47,488,001 200%
NONOPERATING REVENUES (EXPENSES): Investment income 5,653,421 5,244,563 (408,858) -7% Interest expense (2,945,250) (2,597,287) 347,963 12% Engineering fees 926,000 843,502 (82,498) -9% Engineering expenses (1,077,000) (893,199) 183,801 17% Other (9,764) (24,828) (15,064) -154% Total nonoperating revenues (expenses) 2,547,407 2,572,751 25,344 1%
INCOME (LOSS) BEFORE CAPITAL CONTRIBUTIONS AND TRANSFERS (21,174,708) 26,338,637 47,513,345 224%
Transfers from County 287,226 287,226 - 0%Transfers to other County Funds (140,156) (136,471) 3,685 3%Capital contributions received, net 41,861,000 38,303,201 (3,557,799) -8%
CHANGE IN NET POSITION 20,833,362 64,792,593 43,959,231 211%
CONNECTION FEES INCLUDED IN CAPITAL CONTRIBUTIONS 9,934,000 13,677,103 3,743,103 38%
(Supplementary Information)
2020 Comprehensive Annual Financial Report 55

BEST WATER, BESTSERVICE&
BESTENVIRONMEN
TALS
TEW
ARDS
HI
P.
56 Palm Beach County, Florida, Water Utilities Department

Statistical Section


S T A T I S T I C A L S E C T I O N
This part of the Palm Beach County Water Utility Department’s Comprehensive Annual Financial Report presents detailed information as a context for understanding what the information in the financial statements, note disclosures, and required supplementary information says about the Department’s overall financial health.
Contents PAGE
Financial Trends 59
These schedules contain trend information to help the reader understand how the Department’s financial performance and well-being have changed over time.
Revenue Capacity 67
These schedules contain information to help the reader assess the factors affecting the Department’s ability to generate water and wastewater revenues.
Debt Capacity 89
These schedules present information to help the reader assess the affordability of the Department’s current levels of outstanding debt and the Department’s ability to issue additional debt in the future.
Demographic and Economic Information 93
These schedules offer demographic and economic indicators to help the reader understand the environment within which the Department’s financial activities take place and to help make comparisons over time.
Operating Information 97
These schedules contain information about the Department’s operations and resources to help the reader understand how the Department’s financial information relates to the services the Department provides and the activities it performs.
Sources: Unless otherwise noted, the information in these schedules is derived from the Comprehensive Annual Financial Reports for the relevant year or other Department records
2020 Comprehensive Annual Financial Report 57

BEST WATER, BESTSERVICE&
BESTENVIRONMEN
TALS
TEW
ARDS
HI
P.
58 Palm Beach County, Florida, Water Utilities Department

FINANCIAL TRENDS INFORMATION
2020 Comprehensive Annual Financial Report 59

BEST WATER, BESTSERVICE&
BESTENVIRONMEN
TALS
TEW
ARDS
HI
P.
60 Palm Beach County, Florida, Water Utilities Department

PALM BEACH COUNTY, FLORIDAWATER UTILITIES DEPARTMENT
SCHEDULE OF NET POSITION BY COMPONENTLast Ten Fiscal Years
(in thousands) 2020 2019 2018 2017 2016 2015 2014* 2013* 2012 2011
Net investment
in capital assets $1,030,843 $995,683 $949,168 $914,690 $867,526 $831,039 $791,649 $786,867 $703,494 $703,855
Restricted 6,116 6,537 6,302 9,503 8,693 8,353 8,568 9,230 7,965 9,543
Unrestricted 329,160 299,106 300,356 275,576 281,149 268,684 266,513 228,713 229,394 193,519
TOTAL NET POSITION $1,366,119 $1,301,326 $1,255,826 $1,199,769 $1,157,368 $1,108,076 $1,066,730 $1,024,810 $940,853 $906,917
* Amounts restated per GASB 68 & 71.
$0
$100
$200
$300
$400
$500
$600
$700
$800
$900
$1,000
$1,100
$1,200
$1,300
$1,400
$1,500
2011 2012 2013 2014 2015 2016 2017 2018 2019 2020
MIL
LIO
NS
FISCAL YEAR
NET POSITIONNet investment in capital assets Restricted Unrestricted
2020 Comprehensive Annual Financial Report 61

PALM BEACH COUNTY, FLORIDAWATER UTILITIES DEPARTMENT
SCHEDULE OF REVENUES, EXPENSES, AND CHANGES IN NET POSITION (000's)Last Ten Fiscal Years
2020 2019 2018
OPERATING REVENUES:Charges for services $213,331 $199,847 $191,700Other operating revenue 4,646 5,127 5,508 Total operating revenues 217,977 204,974 197,208
OPERATING EXPENSES:Depreciation and amortization 51,977 51,453 50,035 Personal services 50,243 47,184 42,958 Maintenance 34,065 33,035 24,869 Contractual services 19,484 19,421 18,030 Supplies 18,574 36,099 19,406 Purchased water and wastewater treatment 10,042 11,116 11,257 Utilities 8,001 8,393 8,279 Miscellaneous 2,636 2,978 2,230 Equity interest in net (income) loss of joint venture (811) (2,352) (2,996) Total operating expenses 194,211 207,327 174,068
OPERATING INCOME (LOSS) 23,766 (2,353) 23,140
NONOPERATING REVENUES (EXPENSES):Investment income 5,245 8,168 5,263 Engineering fees 843 1,021 885 Other (25) 372 615 Guaranteed revenue - - 6,129 Engineering expenses (893) (949) (848) Interest expense (2,597) (4,074) (4,804) Total nonoperating revenues (expenses) 2,573 4,538 7,240
Income (loss) before capital contributions, transfers,special item and prior period adjustment 26,339 2,185 30,380
Capital contributions received 38,303 41,374 26,917 Transfers from other County funds 287 2,114 - Transfers to other County funds (136) (173) (144) Contributions to other governments - - - Special item - Contribution from Absorption of Glades Utility Authority - - - Special item - Contribution of cash and capital assets
to Glades Utility Authority - - - Prior period adjustment: Implementation of GASB Statements 68 & 71 - - -
CHANGE IN NET POSITION 64,793 45,500 57,153
BEGINNING NET POSITION AS PREVIOUSLY REPORTED 1,301,326 1,255,826 1,199,769
Restatement for GASB Statement #75 implementation - - (1,096)
BEGINNING NET POSITION AS RESTATED 1,301,326 1,255,826 1,198,673
NET POSITION, END OF PERIOD 1,366,119 1,301,326 1,255,826
* Amounts restated per GASB 68 &71.
62 Palm Beach County, Florida, Water Utilities Department

2017 2016 2015 2014* 2013* 2012 2011
$187,624 $180,796 $170,471 $164,001 $156,772 $148,391 $146,5235,416 5,418 6,332 5,939 5,625 5,379 5,039
193,040 186,214 176,803 169,940 162,397 153,770 151,562
47,247 44,676 42,385 41,244 40,723 39,717 40,213 43,619 41,774 37,543 36,692 37,178 35,491 36,276 32,057 29,659 24,990 26,440 22,769 18,550 20,081 18,851 17,728 16,679 15,132 15,199 16,979 13,775 18,925 15,398 15,067 14,507 13,332 14,237 13,807
9,173 9,295 10,317 6,989 6,514 5,696 5,032 8,632 8,029 8,155 8,180 8,071 8,613 9,366 2,183 2,391 2,445 2,371 1,684 981 1,254
(1,768) (1,127) (193) 925 2,449 1,008 1,077 178,919 167,823 157,388 152,480 147,919 141,272 140,881
14,121 18,391 19,415 17,460 14,478 12,498 10,681
4,730 3,850 3,682 3,518 507 5,398 6,179 1,076 950 952 634 643 482 270
473 727 2,736 3,180 (90) 3,508 1,094 5,062 7,532 7,603 4,422 4,109 4,010 2,529 (448) (660) (578) (628) (589) (583) (613)
(5,441) (5,337) (6,075) (7,029) (7,787) (8,457) (6,859) 5,452 7,062 8,320 4,097 (3,207) 4,358 2,600
19,573 25,453 27,735 21,557 11,271 16,856 13,281
22,939 23,950 26,223 19,084 28,385 18,251 11,158 - - - 1,383 1,789 2,521 72
(111) (111) (12,612) (71) - - - - - - (34) - - - - - - 1 63,928 - -
- - - - - (3,572) (4,046) - - - - (19,874) - -
42,401 49,292 41,346 41,920 85,499 34,056 20,465
1,157,368 1,108,076 1,066,730 1,024,810 939,311 905,255 884,790
- - - - - - -
1,157,368 1,108,076 1,066,730 1,024,810 939,311 905,255 884,790
$1,199,769 $1,157,368 1,108,076 1,066,730 1,024,810 939,311 905,255
2020 Comprehensive Annual Financial Report 63

PALM BEACH COUNTY, FLORIDAWATER UTILITIES DEPARTMENT
OPERATING REVENUES BY SOURCE AND OPERATING EXPENSES BY FUNCTION (000's)Last Ten Fiscal Years
2020 2019 2018
OPERATING REVENUES BY SOURCE:
Charges for services:Water - base facility $50,795 $48,281 $46,774Water - commodity 51,832 47,272 45,023 Water - contractual 3,299 2,494 2,022 Wastewater - base facility 55,606 52,832 51,257 Wastewater - commodity 38,818 36,063 34,645 Wastewater - contractual 2,355 1,691 1,430 Reclaimed water - retail 2,481 2,361 1,803 Reclaimed water - bulk 7,191 7,910 7,789 Customer account charge 954 943 957 Water and wastewater - public authorities - - -
213,331 199,847 191,700
Other operating revenue:Meter sales 782 855 774 Service charges 649 1,115 1,232 Industrial pretreatment 1,242 1,173 1,063 Miscellaneous 1,973 1,984 2,439 Other operating revenue 4,646 5,127 5,508
Total operating revenues $217,977 $204,974 $197,208
OPERATING EXPENSES BY FUNCTION:
Water treatment $35,356 $30,229 $30,828Water distribution 13,719 23,879 14,307 Wastewater treatment 18,062 17,073 15,699 Wastewater collection 21,572 20,163 18,189 Purchased water and wastewater treatment 10,042 11,116 10,641 Purchased reclaimed water - - - Water and wastewater - public authorities - - - Customer accounts 10,984 24,846 10,930 Administrative and general 33,310 30,920 26,435 Operating expenses before
depreciation and amortization andequity interest in net (income) loss of joint venture 143,045 158,226 127,029
Depreciation and amortization 51,977 51,453 50,035 Equity interest in net (income) loss of joint venture (811) (2,352) (2,996) Total operating expenses $194,211 $207,327 $174,068
64 Palm Beach County, Florida, Water Utilities Department

2017 2016 2015 2014 2013 2012 2011
$44,954 $43,722 $41,876 $40,462 $36,987 $33,627 $32,03345,529 43,302 42,321 39,681 35,868 33,023 34,595
1,523 2,268 1,811 2,772 3,767 3,423 4,255 49,301 47,954 46,019 44,573 41,015 37,782 35,988 34,177 32,137 31,266 29,788 27,271 25,151 24,567
972 1,012 877 748 726 708 874 2,121 1,863 1,823 1,589 1,583 1,546 - 8,112 7,598 3,546 3,457 3,379 2,901 -
935 940 932 931 923 931 917 - - - - 5,253 9,299 9,795
187,624 180,796 170,471 164,001 156,772 148,391 143,024
599 727 602 660 566 491 414 1,232 1,272 1,324 1,466 1,520 1,558 1,492 1,007 950 1,031 1,077 1,118 1,044 1,053 2,578 2,469 3,375 2,736 2,421 2,286 5,579 5,416 5,418 6,332 5,939 5,625 5,379 8,538
$193,040 $186,214 $176,803 $169,940 $162,397 $153,770 $151,562
$37,443 $34,589 $31,395 $33,332 $28,000 $26,870 $28,21413,314 11,168 10,131 9,393 8,531 8,080 7,540 16,875 17,553 16,087 15,863 11,689 12,158 13,118 18,606 18,049 16,304 16,077 13,932 12,369 11,882
9,059 8,864 9,882 6,556 6,514 5,721 3,367 - - - - - - 1,203 - - - - 10,561 9,311 9,795
10,757 8,649 8,844 7,424 5,825 6,279 6,095 27,386 25,402 22,553 21,666 19,695 19,760 18,377
133,440 124,274 115,196 110,311 104,747 100,548 99,59147,247 44,676 42,385 41,244 40,723 39,717 40,213 (1,768) (1,127) (193) 925 2,449 1,008 1,077
$178,919 $167,823 $157,388 $152,480 $147,919 $141,273 $140,881
2020 Comprehensive Annual Financial Report 65

BEST WATER, BESTSERVICE&
BESTENVIRONMEN
TALS
TEW
ARDS
HI
P.
66 Palm Beach County, Florida, Water Utilities Department
REVENUE CAPACITY INFORMATION
2020 Comprehensive Annual Financial Report 67
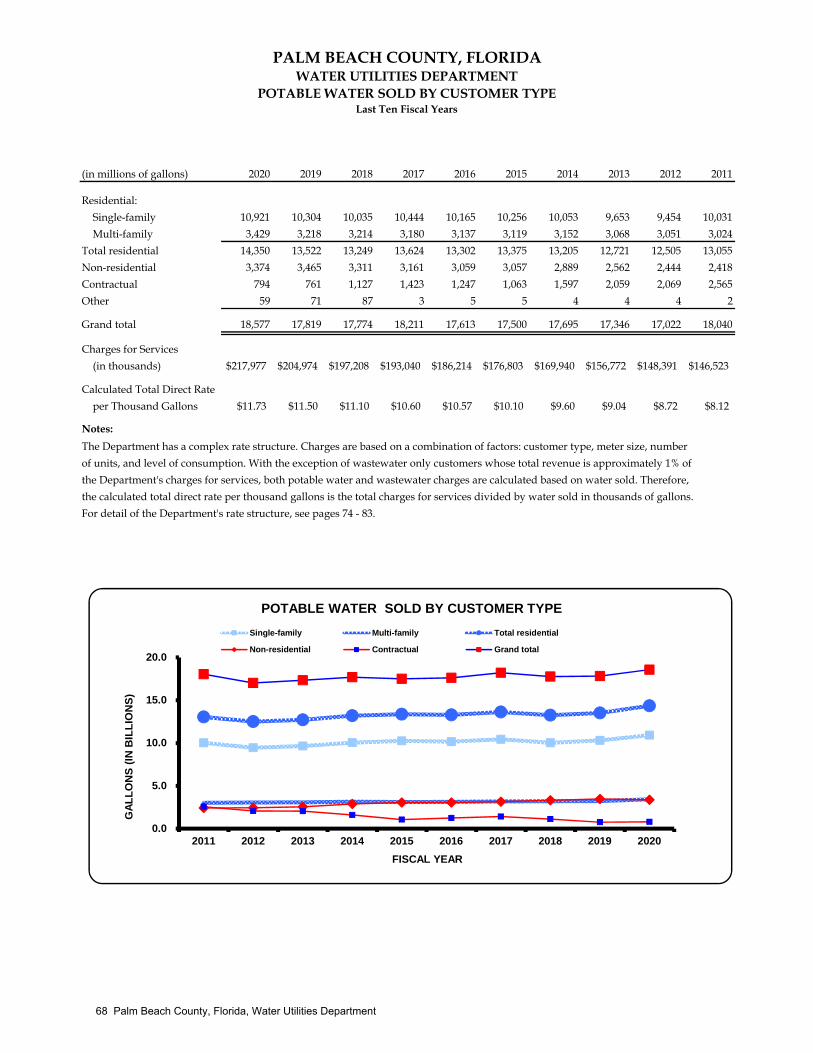
PALM BEACH COUNTY, FLORIDAWATER UTILITIES DEPARTMENT
POTABLE WATER SOLD BY CUSTOMER TYPELast Ten Fiscal Years
(in millions of gallons) 2020 2019 2018 2017 2016 2015 2014 2013 2012 2011
Residential:
Single-family 10,921 10,304 10,035 10,444 10,165 10,256 10,053 9,653 9,454 10,031
Multi-family 3,429 3,218 3,214 3,180 3,137 3,119 3,152 3,068 3,051 3,024
Total residential 14,350 13,522 13,249 13,624 13,302 13,375 13,205 12,721 12,505 13,055
Non-residential 3,374 3,465 3,311 3,161 3,059 3,057 2,889 2,562 2,444 2,418
Contractual 794 761 1,127 1,423 1,247 1,063 1,597 2,059 2,069 2,565
Other 59 71 87 3 5 5 4 4 4 2
Grand total 18,577 17,819 17,774 18,211 17,613 17,500 17,695 17,346 17,022 18,040
Charges for Services
(in thousands) $217,977 $204,974 $197,208 $193,040 $186,214 $176,803 $169,940 $156,772 $148,391 $146,523
Calculated Total Direct Rate
per Thousand Gallons $11.73 $11.50 $11.10 $10.60 $10.57 $10.10 $9.60 $9.04 $8.72 $8.12
Notes:
The Department has a complex rate structure. Charges are based on a combination of factors: customer type, meter size, number
of units, and level of consumption. With the exception of wastewater only customers whose total revenue is approximately 1% of
the Department's charges for services, both potable water and wastewater charges are calculated based on water sold. Therefore,
the calculated total direct rate per thousand gallons is the total charges for services divided by water sold in thousands of gallons.
For detail of the Department's rate structure, see pages 74 - 83.
0.0
5.0
10.0
15.0
20.0
2011 2012 2013 2014 2015 2016 2017 2018 2019 2020
GA
LL
ON
S (
IN B
ILL
ION
S)
FISCAL YEAR
POTABLE WATER SOLD BY CUSTOMER TYPE
Single-family Multi-family Total residential
Non-residential Contractual Grand total
68 Palm Beach County, Florida, Water Utilities Department

PALM BEACH COUNTY, FLORIDAWATER UTILITIES DEPARTMENT
TEN LARGEST CUSTOMERSFiscal Years Ended September 30, 2020 and 2011 (Nine Years Ago)
Operating OperatingRevenues Revenues
CUSTOMER (in thousands) Rank % (in thousands) Rank %
Florida Power & Light Company $5,268 1 2.42 $8,041 2 5.30 Century Village West Condominiums 2,558 2 1.17 1,987 3 1.31 School District of Palm Beach County 2,423 3 1.11 1,353 4 0.89 Seacoast Utility Authority 1,757 4 0.81 - - -GEO Group, Inc. 1,173 5 0.54 - - -MHC Lake Worth Village LLC 761 6 0.35 - - -Palm Beach County Sheriff's Office 636 7 0.29 745 7 0.49 Fountains Condo Oper Inc. 571 8 0.26 420 10 0.28 Casa Del Monte LLC 552 9 0.25 467 9 0.31 St. Andrews of Palm Beach 532 10 0.24 - - -Glades Utility Authority* - - - 9,795 1 6.46 City of Boynton Beach Interconnect - - - 1,211 5 0.80 City of Lake Worth Interconnect - - - 825 6 0.54 Hometown Lake Worth LLC - - - 471 8 0.31
Subtotal (10 largest) 16,231 7.44 25,315 16.69
Balance from other customers 201,746 92.56 126,422 83.31
Grand totals $217,977 100.00 $151,737 100.00
Source: Department's records
Note:*On May 1, 2013 the Department absorbed the Glades Utility Authority (GUA) which comprised the Citiesof Belle Glade, Pahokee and South Bay. Thus, explaining why the GUA went from the Department's largestcustomer in 2011, to not being on the list in 2020.
2020 2011
2020 Comprehensive Annual Financial Report 69

PALM BEACH COUNTY, FLORIDAWATER UTILITIES DEPARTMENT
AVERAGE RESIDENTIAL CUSTOMER'S MONTHLY BILLINGLast Ten Fiscal Years
FISCAL YEAR
BASE FACILITY FEE
COMMODITY FEE* TOTAL FEE
% CHANGE
2020 $31.40 $38.16 $69.56 2.4%2019 30.67 37.27 67.94 2.6%2018 29.89 36.31 66.20 2.9%2017 29.05 35.29 64.34 3.1%2016 28.18 34.23 62.41 3.9%2015 27.10 32.94 60.04 2.9%2014 26.36 32.01 58.37 3.8%2013 25.40 30.82 56.22 4.9%2012 24.23 29.36 53.59 4.2%2011 23.24 28.17 51.41 5.7%
Notes: An average customer is defined as single-family with a 5/8 x 3/4" meter, having combined potablewater and wastewater service, and using 7,500 gallons each month.
* Since the Department calculates the portion of the bill based on usage (commodity fee) in incrementsof thousands of gallons of water, the commodity fee is calculated for 7,000 gallons.
70 Palm Beach County, Florida, Water Utilities Department

PALM BEACH COUNTY, FLORIDAWATER UTILITIES DEPARTMENT
RESIDENTIAL CUSTOMER'S MONTHLY BILL COMPARISON For Selected Utilities
Source: Utility survey
Notes:Customer's monthly billed includes all fees charged monthly with commodity fee based on usage of 5,000 gallons.
Glades Utility Authority (GUA): On May 1, 2013 the Department absorbed the GUA which comprised the Cities of Belle Glade, Pahokee and South Bay.
$47.39
$51.35
$51.74
$54.61
$54.61
$56.97
$62.96
$63.35
$63.63
$66.61
$67.21
$69.65
$71.74
$75.13
$75.29
$77.16
$84.51
$84.51
$20 $30 $40 $50 $60 $70 $80 $90 $100
Miami-Dade
Boynton Beach
Jupiter/Loxahatchee
Palm Beach County
Royal Palm Beach
Delray Beach
Wellington
Atlantis
Seacoast
Riviera Beach
Lantana
Browad County
GUA
Boca Raton
Palm Springs
Lake Worth
West Palm Beach
Town of Palm Beach
MONTHLY BILL
UT
ILIT
Y
RESIDENTIAL CUSTOMER'S MONTHLY BILL (5,000 gallons)
2020 Comprehensive Annual Financial Report 71
-I I_ I I=
I .I .I I I I~
I I I I

PALM BEACH COUNTY, FLORIDAWATER UTILITIES DEPARTMENT
POTABLE WATER DWELLING UNITS DATALast Ten Fiscal Years
Single Family Multi-Family Non-Residential (2)
Count
% of Annual
Total Count
% of Annual
Total Count
% of Annual
TotalAnnual
Total
2020 156,172 61.54% 89,668 35.33% 7,939 3.13% 253,779
2019 154,485 61.47% 88,998 35.41% 7,831 3.12% 251,314
2018 152,909 61.60% 87,599 35.29% 7,737 3.11% 248,245
2017 151,452 61.69% 86,457 35.21% 7,603 3.10% 245,512
2016 150,442 61.46% 86,837 35.47% 7,510 3.07% 244,789
2015 149,080 61.47% 85,971 35.45% 7,486 3.08% 242,537
2014 147,915 61.47% 85,369 35.48% 7,358 3.05% 240,642
2013 (3) 146,410 61.34% 84,927 35.58% 7,335 3.08% 238,672
2012 137,131 60.64% 82,748 36.59% 6,249 2.77% 226,128
2011 136,019 60.54% 82,492 36.72% 6,170 2.74% 224,681
Notes:(1) The Department measures growth as the change in the number of potable water units served.(2) Non-residential does not include contractual/wholesale.(3) On May 1, 2013, the Department absorbed the Glades Utility Authority. The 10,900 potable water
units acquired are not included in the fiscal year growth rate %.
Source: Department's Records
Fiscal Year
# OF DWELLING UNITS BY DWELLING TYPE
224,681 226,128
238,672 240,642 242,537 244,789 245,512 248,245 251,314
253,779
0.42
%
0.64
%
0.73
%
0.84
%
0.78
%
0.93
%
0.30
% 1.11
%
1.24
%
0.98
%
0.00%
1.00%
2.00%
3.00%
4.00%
5.00%
6.00%
7.00%
8.00%
9.00%
10.00%
130,000140,000150,000160,000170,000180,000190,000200,000210,000220,000230,000240,000250,000260,000
2011 2012 2013 2014 2015 2016 2017 2018 2019 2020
GR
OW
TH
RA
TE
net
of
acq
uis
itio
ns
DW
EL
LIN
G U
NIT
S
FISCAL YEAR
TOTAL POTABLE WATER DWELLING UNITS AS OF SEPTEMBER 30/GROWTH RATE FOR FISCAL YEAR
Dwelling Units Growth Rate (1)
72 Palm Beach County, Florida, Water Utilities Department
. . - ' . --.. - ' . - - -.. - -' . . . - -
• I ' . .. I 0 .. ' . . .
.. I 0
. . ' . . . ' . . . -- - - -- - :::w:::- - -' . .. - - - -- - -- - - - - - -- - - - - - -

PALM BEACH COUNTY, FLORIDAWATER UTILITIES DEPARTMENT
WASTEWATER DWELLING UNITS DATALast Ten Fiscal Years
Single Family Multi-Family Non-Residential (1)
Count
% of Annual
Total Count
% of Annual
Total Count
% of Annual
TotalAnnual
Total
2020 139,570 59.86% 87,095 37.35% 6,507 2.79% 233,172
2019 138,019 59.77% 86,457 37.44% 6,452 2.79% 230,928
2018 136,547 59.89% 85,072 37.32% 6,361 2.79% 227,980
2017 135,193 59.97% 83,937 37.24% 6,293 2.79% 225,423
2016 134,228 59.71% 84,337 37.52% 6,238 2.77% 224,803
2015 132,981 59.73% 83,485 37.49% 6,191 2.78% 222,657
2014 131,820 59.70% 82,860 37.53% 6,127 2.77% 220,807
2013 (2) 130,419 59.56% 82,430 37.64% 6,138 2.80% 218,987
2012 122,268 58.81% 80,450 38.69% 5,194 2.50% 207,912
2011 121,327 58.69% 80,204 38.80% 5,177 2.51% 206,708
Notes:(1) Non-residential does not include contractual/wholesale.(2) On May 1, 2013, the Department absorbed the Glades Utility Authority. The 9,515 units
acquired are not included in the fiscal year growth rate %.
Source: Department's Records
Fiscal Year
# OF DWELLING UNITS BY DWELLING TYPE
206,708 207,912
218,987 220,807 222,657 224,803 225,423 227,980 230,928 233,172
0.39
%
0.58
%
0.75
%
0.83
%
0.84
%
0.96
%
0.28
% 1.13
%
1.29
%
0.97
%
0.00%
1.00%
2.00%
3.00%
4.00%
5.00%
6.00%
7.00%
8.00%
9.00%
10.00%
120,000
130,000
140,000
150,000
160,000
170,000
180,000
190,000
200,000
210,000
220,000
230,000
240,000
2011 2012 2013 2014 2015 2016 2017 2018 2019 2020
PE
R C
EN
T C
HA
NG
En
et o
f ac
qu
isit
ion
s
DW
EL
LIN
G U
NIT
S
FISCAL YEAR
TOTAL WASTEWATER DWELLING UNITS AS OF SEPTEMBER 30/PERCENT CHANGE FOR FISCAL YEAR
Dwelling Units Per Cent Change
2020 Comprehensive Annual Financial Report 73
-. . .. -.. ,.... ,.... .. - --.. - - .. . . - - .
0 I
.. 11
I I 11
• I 11
0 I .. 0 I
11 .. --- - - -• I - - -~ at;:- • .. - - --- . - . . . . . .
- - - - - - -

PALM BEACH COUNTY, FLORIDAWATER UTILITIES DEPARTMENTPOTABLE WATER METER DATA
Last Ten Fiscal Years
Single Family Multi-Family Non-Residential (1)
Count
% of Annual
Total Count
% of Annual
Total Count
% of Annual
Total Count
% of Annual
TotalAnnual
Total
2020 156,116 79.38% 32,623 16.59% 7,911 4.02% 24 0.01% 196,674
2019 154,429 79.28% 32,525 16.70% 7,802 4.01% 23 0.01% 194,779
2018 152,852 79.23% 32,336 16.76% 7,708 4.00% 24 0.01% 192,920
2017 151,395 79.19% 32,174 16.83% 7,582 3.97% 24 0.01% 191,175
2016 150,385 79.14% 32,118 16.90% 7,491 3.94% 25 0.02% 190,019
2015 149,023 79.10% 31,893 16.93% 7,464 3.96% 28 0.01% 188,408
2014 147,858 79.10% 31,677 16.94% 7,358 3.94% 30 0.02% 186,923
2013 (2) 146,384 78.99% 31,546 17.02% 7,355 3.97% 28 0.02% 185,313
2012 137,131 78.93% 30,335 17.46% 6,249 3.60% 26 0.01% 173,741
2011 136,019 78.86% 30,273 17.54% 6,170 3.58% 26 0.02% 172,488
Notes:(1) Non-residential does not include contractual/wholesale.(2) On May 1, 2013, the Department absorbed the Glades Utility Authority. The 10,900 potable water
meters acquired are included in these figures.
Source: Department's Records
Fiscal Year
# OF METERS BY DWELLING TYPE
Contractual/
Wholesale (1)
172,488
173,741 185,313
186,923
188,408
190,019
191,175
192,920
194,779
196,674
130,000
140,000
150,000
160,000
170,000
180,000
190,000
200,000
2011 2012 2013 2014 2015 2016 2017 2018 2019 2020
ME
TE
RS
FISCAL YEAR
TOTAL POTABLE WATER METERS AS OF SEPTEMBER 30
74 Palm Beach County, Florida, Water Utilities Department
r
• ■ ■ ■ ■ ■
-.. --/ ■

CUSTOMER RATE SCHEDULES
2020 Comprehensive Annual Financial Report 75

PALM BEACH COUNTY, FLORIDAWATER UTILITIES DEPARTMENT
MONTHLY RESIDENTIAL POTABLE WATER AND WASTEWATER RATES(Not Including the Western Region Service Area)
Last Ten Fiscal Years
2020 2019 2018
CUSTOMER ACCOUNT FEE (per meter)Multi-Family accounts only 2.50$ 2.50$ 2.50$ All accounts n/a n/a n/a
POTABLE WATER RATESBase Facility Fee
Single-Family (per meter)5/8" x 3/4" 14.80$ 14.46$ 14.09$ 1" 36.14$ 35.30$ 34.40$ 1 1/2 " 54.04$ 52.78$ 51.44$ 2" 112.67$ 110.05$ 107.25$
Multi-Family (per dwelling unit) 11.03$ 10.77$ 10.50$ Commodity Fee per thousand gallons
Single-Family per meter; Multi-Family per dwelling unit0-4 1.49$ 1.46$ 1.42$ 5-10 3.30$ 3.22$ 3.14$ 11-25 8.31$ 8.12$ 7.91$ Over 25 10.34$ 10.10$ 9.84$
WASTEWATER RATESBase Facility Fee
Single-Family (per meter)5/8" x 3/4" 16.60$ 16.21$ 15.80$ 1" 48.99$ 47.85$ 46.63$ 1 1/2 " 75.22$ 73.47$ 71.60$ 2" 164.49$ 160.66$ 156.57$
Multi-Family (per dwelling unit)Commodity Fee per thousand gallons water
Single-Family per meter; Multi-Family per dwelling unit0-4 2.02$ 1.97$ 1.92$ 5-10 4.74$ 4.63$ 4.51$
Notes:Rate changes must be approved by the Palm Beach County, Florida, Board of County Commissioners.
These rates do not apply to approximately 10% of the Department's customers in the service areasacquired through the purchase of the Village of Royal Palm Beach's Utility System (for FYs 2007 to FY 2016)and the absorption of the Glades Utility Authority (GUA). Effective October 1, 2016, the FY 2017 rates applyto the customers in the Royal Palm Beach service area.
Rates effective with billings on October 1 of fiscal year unless otherwise indicated.
The GUA, now known as the Western Region, was absorbed by the Department on May 1, 2013.
76 Palm Beach County, Florida, Water Utilities Department

2017 2016 2015 2014 2013 2012 2011
2.50$ 2.50$ 2.50$ 2.50$ 2.50$ 2.50$ 2.50$ n/a n/a n/a n/a n/a n/a n/a
13.69$ 13.28$ 12.77$ 12.42$ 11.97$ 11.42$ 10.95$ 33.43$ 32.44$ 31.20$ 30.34$ 29.23$ 27.88$ 26.74$ 49.99$ 48.51$ 46.66$ 45.38$ 43.72$ 41.70$ 40.00$
104.23$ 101.14$ 97.29$ 94.61$ 91.15$ 86.94$ 83.39$ 10.20$ 9.90$ 9.52$ 9.26$ 8.92$ 8.51$ 8.16$
1.38$ 1.34$ 1.29$ 1.25$ 1.20$ 1.14$ 1.09$ 3.05$ 2.96$ 2.85$ 2.77$ 2.67$ 2.55$ 2.45$ 7.69$ 7.46$ 7.18$ 6.98$ 6.72$ 6.41$ 6.15$ 9.56$ 9.28$ 8.93$ 8.68$ 8.36$ 7.97$ 7.64$
15.36$ 14.90$ 14.33$ 13.94$ 13.43$ 12.81$ 12.29$ 45.32$ 43.97$ 42.29$ 41.13$ 39.62$ 37.79$ 36.25$ 69.59$ 67.52$ 64.95$ 63.16$ 60.85$ 58.04$ 55.67$
152.17$ 147.65$ 142.02$ 138.11$ 133.05$ 126.90$ 121.71$ 13.94$ 13.43$ 12.81$ 12.29$
1.87$ 1.81$ 1.74$ 1.69$ 1.63$ 1.55$ 1.49$ 4.38$ 4.25$ 4.09$ 3.98$ 3.83$ 3.65$ 3.50$
2020 Comprehensive Annual Financial Report 77

PALM BEACH COUNTY, FLORIDAWATER UTILITIES DEPARTMENT
MONTHLY RESIDENTIAL FIRE LINE AND RECLAIMED WATER RATES(Not Including the Western Region Service Area)
Last Ten Fiscal Years
2020 (1) 2019 (1) 2018 (1)
CUSTOMER ACCOUNT FEE (per meter)Multi-Family accounts only n/a n/a n/aAll accounts n/a n/a n/a
FIRE LINE RATESBase Facility Fee per size of backflow device
2" 16.45$ 16.07$ 15.66$ 3" 30.98$ 30.26$ 29.49$ 4" 51.62$ 50.42$ 49.14$ 6" 103.23$ 100.83$ 98.26$ 8" and above 165.20$ 161.35$ 157.24$
RECLAIMED WATER RATESBase Facility Fee
Single-Family (per meter)5/8" x 3/4" 7.23$ 7.06$ 6.88$ 5/8" x 3/4" (connection fee paid) 3.54$ 3.46$ 3.37$ 1" n/a n/a n/a1 1/2 " n/a n/a n/a2" n/a n/a n/a
Multi-Family (per dwelling unit) n/a n/a n/aCommodity Fee per thousand gallons 0.31$ 0.30$ 0.29$ Fixed Commodity Fee (meter size)
All others see non-residential rates
Notes:Rate changes must be approved by the Palm Beach County, Florida, Board of County Commissioners.
These rates do not apply to approximately 10% of the Department's customers in the service areasacquired through the purchase of the Village of Royal Palm Beach's Utility System (for FYs 2007 to FY 2016)and the absorption of the Glades Utility Authority (GUA). Effective October 1, 2016, the FY 2017 rates applyto the customers in the Royal Palm Beach service area.
Rates effective with billings on October 1 of fiscal year unless otherwise indicated(1) A 20% discount applies to Reclaimed Water rates for lake delivery services.
The GUA, now known as the Western Region, was absorbed by the Department on May 1, 2013.
78 Palm Beach County, Florida, Water Utilities Department

2017 (1) 2016 (1) 2015 (1) 2014 (1) 2013 (1) 2012 (1) 2011 (1)
n/a n/a n/a n/a n/a n/a 2.50$ n/a n/a n/a n/a n/a n/a n/a
15.22$ 14.77$ 14.21$ 13.82$ 13.31$ 12.69$ 12.17$ 28.66$ 27.81$ 26.75$ 26.01$ 25.06$ 23.90$ 22.92$ 47.76$ 46.34$ 44.57$ 43.34$ 41.75$ 39.82$ 38.19$ 95.50$ 92.66$ 89.13$ 86.68$ 83.51$ 79.65$ 76.39$
152.82$ 148.28$ 142.63$ 138.70$ 133.62$ 127.44$ 122.23$
6.69$ 6.49$ 6.24$ 6.07$ 6.26$ 5.97$ $5.353.28$ 3.18$ 3.06$ 2.98$ 3.08$ 2.94$ $2.63
n/a n/a n/a n/a n/a n/a n/an/a n/a n/a n/a n/a n/a n/an/a n/a n/a n/a n/a n/a n/an/a n/a n/a n/a n/a n/a n/a
0.28$ 0.27$ 0.26$ 0.25$ 0.24$ 0.23$ 0.22$
2020 Comprehensive Annual Financial Report 79

PALM BEACH COUNTY, FLORIDAWATER UTILITIES DEPARTMENT
MONTHLY NON-RESIDENTIAL POTABLE WATER AND WASTEWATER RATES(Not Including the Western Region Service Area)
Last Ten Fiscal Years
2020 2019 2018
CUSTOMER ACCOUNT FEE (per meter) n/a n/a n/a
POTABLE WATER RATESBase Facility Fee
5/8" x 3/4" 27.82$ 27.17$ 26.48$ 1" 94.74$ 92.53$ 90.18$ 1 1/2 " 150.73$ 147.22$ 143.47$ 2" 255.71$ 249.76$ 243.40$ 3" 677.39$ 661.62$ 644.78$ 4" 1,044.85$ 1,020.52$ 994.55$ 6" and larger based on projected water usage
Commodity Fee per thousand gallons5/8" x 3/4"
0-14 1.73$ 1.69$ 1.65$ Over 14 4.74$ 4.63$ 4.51$
1"0-57 1.73$ 1.69$ 1.65$ Over 57 4.74$ 4.63$ 4.51$
1 1/2 "0-94 1.73$ 1.69$ 1.65$ Over 94 4.74$ 4.63$ 4.51$
2"0-138 1.73$ 1.69$ 1.65$ Over 138 4.74$ 4.63$ 4.51$
3"0-557 1.73$ 1.69$ 1.65$ Over 557 4.74$ 4.63$ 4.51$
4"0-675 1.73$ 1.69$ 1.65$ Over 675 4.74$ 4.63$ 4.51$
6" and aboveAll usage 1.73$ 1.69$ 1.65$ 0-675 n/a n/a n/aOver 675 n/a n/a n/a
Notes:Rate changes must be approved by the Palm Beach County, Florida, Board of County Commissioners.
These rates do not apply to approximately 10% of the Department's customers in the service areasacquired through the purchase of the Village of Royal Palm Beach's Utility System (for FYs 2007 to FY 2016)and the absorption of the Glades Utility Authority (GUA). Effective October 1, 2016, the FY 2017 rates applyto the customers in the Royal Palm Beach service area.
Rates effective with billings on October 1 of fiscal year unless otherwise indicated
The GUA, now known as the Western Region, was absorbed by the Department on May 1, 2013.
80 Palm Beach County, Florida, Water Utilities Department

2017 2016 2015 2014 2013 2012 2011
n/a n/a n/a n/a n/a n/a n/a
25.74$ 24.98$ 24.03$ 23.37$ 22.51$ 21.47$ 20.59$ 87.64$ 85.04$ 81.80$ 79.55$ 76.64$ 73.10$ 70.11$
139.44$ 135.30$ 130.14$ 126.56$ 121.93$ 116.29$ 111.54$ 236.56$ 229.54$ 220.79$ 214.71$ 206.85$ 197.29$ 189.23$ 626.65$ 608.05$ 584.88$ 568.78$ 547.96$ 522.62$ 501.26$ 966.58$ 937.88$ 902.14$ 877.31$ 845.19$ 806.11$ 773.16$
1.60$ 1.55$ 1.49$ 1.45$ 1.40$ 1.34$ 1.29$ 4.38$ 4.25$ 4.09$ 3.98$ 3.83$ 3.65$ 3.50$
1.60$ 1.55$ 1.49$ 1.45$ 1.40$ 1.34$ 1.29$ 4.38$ 4.25$ 4.09$ 3.98$ 3.83$ 3.65$ 3.50$
1.60$ 1.55$ 1.49$ 1.45$ 1.40$ 1.34$ 1.29$ 4.38$ 4.25$ 4.09$ 3.98$ 3.83$ 3.65$ 3.50$
1.60$ 1.55$ 1.49$ 1.45$ 1.40$ 1.34$ 1.29$ 4.38$ 4.25$ 4.09$ 3.98$ 3.83$ 3.65$ 3.50$
1.60$ 1.55$ 1.49$ 1.45$ 1.40$ 1.34$ 1.29$ 4.38$ 4.25$ 4.09$ 3.98$ 3.83$ 3.65$ 3.50$
1.60$ 1.55$ 1.49$ 1.45$ 1.40$ 1.34$ 1.29$ 4.38$ 4.25$ 4.09$ 3.98$ 3.83$ 3.65$ 3.50$
1.60$ 1.55$ 1.49$ 1.45$ 1.40$ 1.34$ 1.29$ n/a n/a n/a n/a n/a n/a n/an/a n/a n/a n/a n/a n/a n/a
2020 Comprehensive Annual Financial Report 81

PALM BEACH COUNTY, FLORIDAWATER UTILITIES DEPARTMENT
MONTHLY NON-RESIDENTIAL POTABLE WATER AND WASTEWATER RATES(Not Including the Western Region Service Area)
Last Ten Fiscal Years
2020 2019 2018
WASTEWATER RATESBase Facility Fee
5/8" x 3/4" 34.99$ 34.18$ 33.31$ 1" 133.86$ 130.74$ 127.41$ 1 1/2 " 218.71$ 213.62$ 208.18$ 2" 391.94$ 382.81$ 373.07$ 3" 1,006.10$ 982.67$ 957.66$ 4" 1,539.75$ 1,503.90$ 1,465.63$ 6" and larger based on projected water usage
Commodity Fee per thousand gallons water - all metered usage 2.34$ 2.29$ 2.23$
Notes:Rate changes must be approved by the Palm Beach County, Florida, Board of County Commissioners.
These rates do not apply to approximately 10% of the Department's customers in the service areasacquired through the purchase of the Village of Royal Palm Beach's Utility System (for FYs 2007 to FY 2016)and the absorption of the Glades Utility Authority (GUA). Effective October 1, 2016, the FY 2017 rates applyto the customers in the Royal Palm Beach service area.
Rates effective with billings on October 1 of fiscal year unless otherwise indicated
The GUA, now known as the Western Region, was absorbed by the Department on May 1, 2013.
82 Palm Beach County, Florida, Water Utilities Department
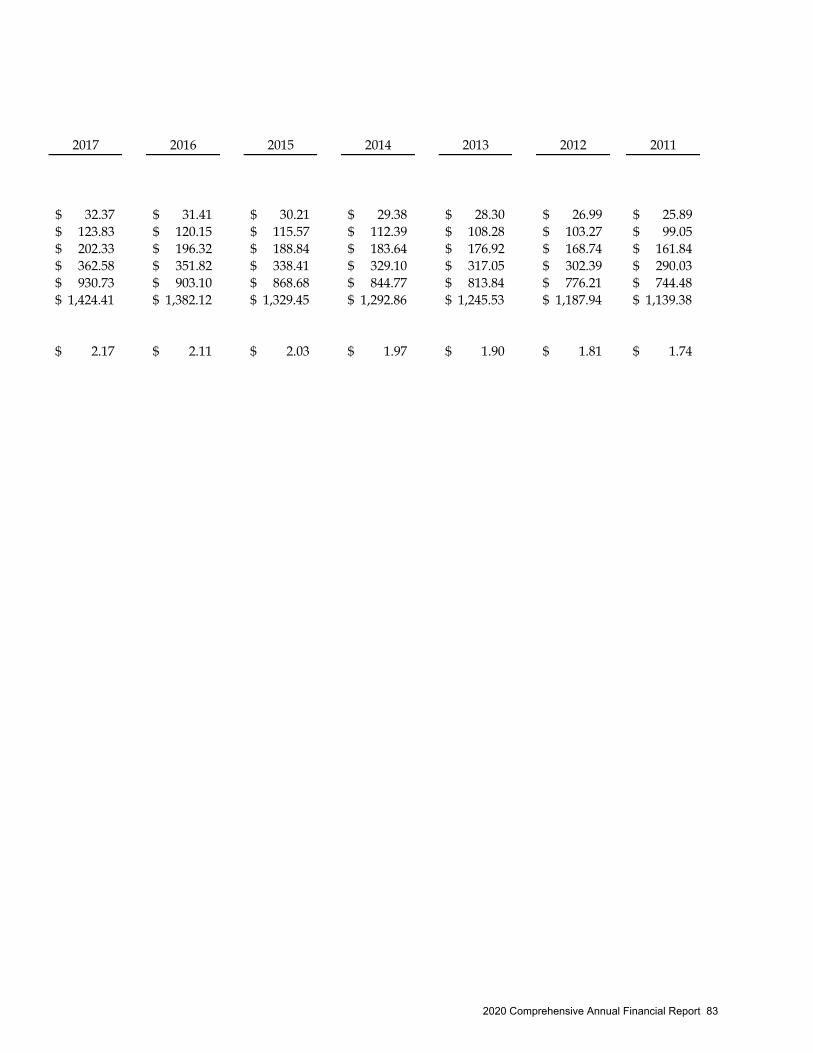
2017 2016 2015 2014 2013 2012 2011
32.37$ 31.41$ 30.21$ 29.38$ 28.30$ 26.99$ 25.89$ 123.83$ 120.15$ 115.57$ 112.39$ 108.28$ 103.27$ 99.05$ 202.33$ 196.32$ 188.84$ 183.64$ 176.92$ 168.74$ 161.84$ 362.58$ 351.82$ 338.41$ 329.10$ 317.05$ 302.39$ 290.03$ 930.73$ 903.10$ 868.68$ 844.77$ 813.84$ 776.21$ 744.48$
1,424.41$ 1,382.12$ 1,329.45$ 1,292.86$ 1,245.53$ 1,187.94$ 1,139.38$
2.17$ 2.11$ 2.03$ 1.97$ 1.90$ 1.81$ 1.74$
2020 Comprehensive Annual Financial Report 83

PALM BEACH COUNTY, FLORIDAWATER UTILITIES DEPARTMENT
MONTHLY NON-RESIDENTIAL FIRE LINE AND RECLAIMED WATER RATES(Not Including the Western Region Service Area)
Last Ten Fiscal Years
2020 2019 2018
CUSTOMER ACCOUNT FEE(per meter) n/a n/a n/a
FIRE LINE RATESBase Facility Fee per size of backflow device
2" 16.45$ 16.07$ 15.66$ 3" 30.98$ 30.26$ 29.49$ 4" 51.62$ 50.42$ 49.14$ 6" 103.23$ 100.83$ 98.26$ 8" 165.20$ 161.35$ 157.24$
Commodity Fee per thousand gallons: see non-residential commodity rates on page 78.
Notes:Rate changes must be approved by the Palm Beach County, Florida, Board of County Commissioners.
These rates do not apply to approximately 10% of the Department's customers in the service areasacquired through the purchase of the Village of Royal Palm Beach's Utility System (for FYs 2007 to FY 2016)and the absorption of the Glades Utility Authority (GUA). Effective October 1, 2016, the FY 2017 rates applyto the customers in the Royal Palm Beach service area.
Rates effective with billings on October 1 of fiscal year unless otherwise indicated.
The GUA, now known as the Western Region, was absorbed by the Department on May 1, 2013.
84 Palm Beach County, Florida, Water Utilities Department

2017 2016 2015 2014 2013 2012 2011
n/a n/a n/a n/a n/a n/a n/a
15.22$ 14.77$ 14.21$ 13.82$ 13.31$ 12.69$ 12.17$ 28.66$ 27.81$ 26.25$ 26.01$ 25.06$ 23.90$ 22.92$ 47.76$ 46.34$ 44.57$ 43.34$ 41.75$ 39.82$ 38.19$ 95.50$ 92.66$ 89.13$ 86.68$ 83.51$ 79.65$ 76.39$
152.82$ 148.28$ 142.63$ 138.70$ 133.62$ 127.44$ 122.23$
2020 Comprehensive Annual Financial Report 85

PALM BEACH COUNTY, FLORIDAWATER UTILITIES DEPARTMENT
MONTHLY NON-RESIDENTIAL FIRE LINE AND RECLAIMED WATER RATES(Not Including the Western Region Service Area)
Last Ten Fiscal Years
2020 (1) 2019 (1) 2018 (1)
CUSTOMER ACCOUNT FEE(per meter) n/a n/a n/a
RECLAIMED WATER RATESBase Facility Fee
5/8" x 3/4" 7.73$ 7.55$ 7.36$ 5/8" x 3/4" (connection fee paid) 3.80$ 3.71$ 3.62$ 1" 41.27$ 40.31$ 39.28$ 1" (connection fee paid) 20.30$ 19.83$ 19.33$ 1 1/2 " 103.23$ 100.83$ 98.26$ 1 1/2 " (connection fee paid) 50.80$ 49.62$ 48.36$ 2" 221.94$ 216.77$ 211.25$ 2" (connection fee paid) 109.21$ 106.67$ 103.96$ 3" 485.20$ 473.90$ 461.84$ 3" (connection fee paid) 238.76$ 233.20$ 227.27$ 4" 1,326.54$ 1,295.65$ 1,262.68$ 4" (connection fee paid) 652.79$ 637.59$ 621.36$ 6" 2,833.74$ 2,767.76$ 2,697.32$ 6" (connection fee paid) 1,394.47$ 1,362.00$ 1,327.34$ 8" 5,037.74$ 4,920.44$ 4,795.22$ 8" (connection fee paid) 2,479.04$ 2,421.32$ 2,359.70$ 10" 7,845.64$ 7,662.96$ 7,467.95$ 10" (connection fee paid) 3,860.80$ 3,770.90$ 3,674.94$
Commodity Fee per thousand gallons 0.31$ 0.30$ 0.29$
Notes:Rate changes must be approved by the Palm Beach County, Florida, Board of County Commissioners.
These rates do not apply to approximately 10% of the Department's customers in the service areasacquired through the purchase of the Village of Royal Palm Beach's Utility System (for FYs 2007 to FY 2016)and the absorption of the Glades Utility Authority (GUA). Effective October 1, 2016, the FY 2017 rates applyto the customers in the Royal Palm Beach service area.
Rates effective with billings on October 1 of fiscal year unless otherwise indicated:(1) A 20% discount applies to Reclaimed Water rates for lake delivery services.
The GUA, now known as the Western Region, was absorbed by the Department on May 1, 2013.
86 Palm Beach County, Florida, Water Utilities Department

2017 (1) 2016 (1) 2015 (1) 2014 (1) 2013 (1) 2012 (1) 2011 (1)
n/a n/a n/a n/a n/a n/a n/a
7.15$ 6.94$ 6.68$ 6.50$ 6.26$ 5.97$ 5.73$ 3.52$ 3.42$ 3.29$ 3.20$ 3.08$ 2.94$ 2.82$
38.18$ 37.05$ 35.64$ 34.66$ 33.39$ 31.85$ 30.55$ 18.79$ 18.23$ 17.54$ 17.06$ 16.44$ 15.68$ 15.04$ 95.50$ 92.66$ 89.13$ 86.68$ 83.51$ 79.65$ 76.39$ 47.00$ 45.60$ 43.86$ 42.65$ 41.09$ 39.19$ 37.59$
205.31$ 199.21$ 191.62$ 186.35$ 179.53$ 171.23$ 164.23$ 101.04$ 98.04$ 94.30$ 91.70$ 88.34$ 84.26$ 80.82$ 448.85$ 435.52$ 418.92$ 407.39$ 392.48$ 374.33$ 359.03$ 220.88$ 214.32$ 206.15$ 200.48$ 193.14$ 184.21$ 176.68$
1,227.17$ 1,190.74$ 1,145.36$ 1,113.84$ 1,073.06$ 1,023.44$ 981.60$ 603.89$ 585.96$ 563.63$ 548.12$ 528.05$ 503.63$ 483.04$
2,621.47$ 2,543.64$ 2,446.70$ 2,379.36$ 2,292.25$ 2,186.26$ 2,096.89$ 1,290.01$ 1,251.71$ 1,204.01$ 1,170.87$ 1,128.01$ 1,075.85$ 1,031.87$ 4,660.37$ 4,522.01$ 4,349.67$ 4,229.96$ 4,075.11$ 3,886.68$ 3,727.80$ 2,293.34$ 2,225.26$ 2,140.45$ 2,081.54$ 2,005.34$ 1,912.62$ 1,834.44$ 7,257.94$ 7,042.47$ 6,774.07$ 6,587.64$ 6,346.47$ 6,053.02$ 5,805.59$ 3,571.60$ 3,465.57$ 3,333.49$ 3,241.75$ 3,123.07$ 2,978.66$ 2,856.90$
0.28$ 0.27$ 0.26$ 0.25$ 0.24$ 0.23$ 0.22$
2020 Comprehensive Annual Financial Report 87

PALM BEACH COUNTY, FLORIDAWATER UTILITIES DEPARTMENT
MONTHLY RESIDENTIAL & NON-RESIDENTIAL RATESWestern Region Service Area
Next Four Fiscal Years
RESIDENTIAL 2019 - 2022
POTABLE WATER RATES Base Facility Fee Single-Family (per meter) $18.64 Commodity Fee per 1,000 Gallons Single-Family (per meter)
0-3,000 gallons $1.504,000-6,000 $4.677,000-12,000 $5.8013,000-15,000 $5.80Over 15,000 $7.50
WASTEWATER RATES Base Facility Fee Single-Family (per meter) $19.26 Commodity Fee per 1,000 Gallons Single-Family (per meter)
0-10 $4.00greater than 10 n/a
NON-RESIDENTIAL
POTABLE WATER RATES Base Facility Fee 5/8" $18.64 1" $59.06 1 1/2" $96.71 2" $227.75 3" $757.07 4" $2,317.17
>4" Case by CaseCommodity Fee per 1,000 Gallons $4.67
WASTEWATER RATES Base Facility Fee 5/8" $19.26 1" $61.00 1 1/2" $99.88 2" $235.23 3" $781.94 4" $2,393.29
>4" Case by CaseCommodity Fee per 1,000 Gallons $4.00
FIRELINE Base Facility Fee 2" $8.00 3" $15.00 4" $25.00 6" $50.00
>8" $80.00
The Glades Utility Authority's (GUA), now known as the Western Region, was absorbed on May 1, 2013. For customers in the service area that had been served by the GUA, rates will remain the same for 8 years. At which time, the rates will be raisedor lowered to equal the County's rates plus 7%.
Potable Water: 11,368 Wastewater: 10,075At September 30, 2020, the Department had the following numbers of customers to whom this rate schedule applies:
88 Palm Beach County, Florida, Water Utilities Department

DEBT CAPACITY INFORMATION
2020 Comprehensive Annual Financial Report 89

PALM BEACH COUNTY, FLORIDAWATER UTILITIES DEPARTMENT
RATIO OF OUTSTANDING DEBT BY TYPELast Ten Fiscal Years
Water & Sewer Pro Rata Share of Debt perRevenue Bonds Joint Venture Debt Total Debt Customer
2020 $152,267,968 $ - (1) $152,267,968 $6002019 161,140,961 - (1) 161,140,961 6412018 168,602,532 - (1) 168,602,532 6792017 179,408,076 - (1) 179,408,076 7312016 189,374,522 - (1) 189,374,522 7742015 198,976,869 - (1) 198,976,869 8202014 206,986,215 - (1) 206,986,215 8602013 216,573,017 - (1) 216,573,017 9072012 188,550,000 1,261,946 (1) 189,811,946 8392011 196,593,000 1,405,216 197,998,216 881
Notes:Although neither the State of Florida nor Palm Beach County set a legal debt limit, the bondcovenants stipulate that the Department may issue debt as long as certain conditions are met.The major criterion is that the Department establishes rates and fees sufficient to provide netrevenues and connection fees that are at least 1.25 times the annual debt service requirements.Number of customers is defined as the number of potable water dwelling units served.See page 70 for customer data.
(1) On September 14, 2012, the ECR paid in full the remaining balance of the 20 year revolving loans.
$198 $190
$217 $207 $199
$189 $179
$169 $161 $152
$881 $839
$907 $860
$820 $774
$731 $679
$641 $600
$0
$100
$200
$300
$400
$500
$600
$700
$800
$900
$1,000
$1,100
$1,200
$0
$50
$100
$150
$200
$250
$300
$350
2011 2012 2013 2014 2015 2016 2017 2018 2019 2020
DE
BT
PE
R C
US
TO
ME
R
TO
TA
L D
EB
T(I
N M
ILL
ION
S)
FISCAL YEAR
DEBT
Total Debt Debt per Customer
90 Palm Beach County, Florida, Water Utilities Department

PALM BEACH COUNTY, FLORIDAWATER UTILITIES DEPARTMENTPLEDGED-REVENUE COVERAGE
Last Ten Fiscal Years
Available for Debt Service Debt Service Requirements Coverage Ratio
Fiscal Year EndedSept 30
Operating Revenues
Operating
Expenses (1)
Nonoperating Revenues
(Expenses) (2) Net Revenues
Connection
Fees (3)
NetRevenues & Connection
Fees Principal InterestTotal Debt
Service
Excluding Connection
Fees
Including Connection
Fees
2020 $217,976,818 $143,044,280 $12,890,566 $87,823,104 $8,764,242 $96,587,346 $6,344,327 $5,999,676 $12,344,003 7.11x 7.82x2019 204,973,971 158,226,435 16,083,547 62,831,083 9,524,019 72,355,102 6,487,969 6,926,142 13,414,111 4.68 5.392018 197,208,287 127,029,860 11,664,831 81,843,258 9,132,437 90,975,695 6,352,142 7,177,394 13,529,536 6.05 6.722017 193,040,161 133,440,305 10,565,010 70,164,866 8,970,138 79,135,004 9,938,514 7,597,348 17,535,862 4.00 4.512016 186,213,992 124,274,303 11,936,492 73,876,181 10,530,256 84,406,437 8,675,180 7,972,045 16,647,225 4.44 5.072015 176,803,449 116,443,238 14,514,826 74,875,037 8,271,112 83,146,149 8,166,052 8,464,578 16,630,630 4.50 5.002014 169,940,052 111,815,585 11,053,141 69,177,608 7,902,936 77,080,544 7,630,891 8,938,050 16,568,941 4.18 4.652013 162,397,200 104,747,391 8,132,428 65,782,237 7,659,599 73,441,836 7,386,929 9,071,030 16,457,959 4.00 4.462012 153,770,117 100,798,052 9,598,962 62,571,027 7,394,115 69,965,142 6,465,000 9,263,137 15,728,137 3.98 4.452011 151,561,873 99,590,580 7,659,951 59,631,244 4,667,389 64,298,633 10,035,500 9,863,098 19,898,598 3.00 3.23
Notes:(1) Operating expenses exclude depreciation and amortization and equity interest in net (income) loss of joint venture.(2) Nonoperating revenues (expenses) exclude interest on debt, gain or loss on disposal of fixed assets, and grants.(3) Represents the lesser of the expansion percentage (see page 83) times the debt service in a given fiscal year or the connection fees in that year.
0.0
1.0
2.0
3.0
4.0
5.0
6.0
7.0
8.0
2011 2012 2013 2014 2015 2016 2017 2018 2019 2020
CO
VE
RA
GE
RA
TIO
FISCAL YEAR
PLEDGED-REVENUE COVERAGE
Including Connection Fees Excluding Connection Fees Required-2020 Com
prehensive Annual Financial Report 91

PALM BEACH COUNTY, FLORIDAWATER UTILITIES DEPARTMENT
CONNECTION FEES & EXPANSION PERCENTAGESLast Ten Fiscal Years
$7.4 $7.7 $7.9
$8.3
$10.5
$9.0 $9.1 $9.5
$8.8
$4.7
$7.4 $7.7 $7.9
$8.3
$10.5
$9.0 $9.1 $9.5
$8.8
$4
$5
$6
$7
$8
$9
$10
$11
$12
2011 2012 2013 2014 2015 2016 2017 2018 2019 2020
DO
LL
AR
S (
IN M
ILL
ION
S)
FISCAL YEAR
CONNECTION FEES
Available for Debt Service Total
$4.7
63% 63%
68% 68% 69%68% 68% 68%
71% 71%
40%
45%
50%
55%
60%
65%
70%
75%
80%
2011 2012 2013 2014 2015 2016 2017 2018 2019 2020
EX
PA
NS
ION
%
FISCAL YEAR
EXPANSION PERCENTAGESPercentage of total bond proceeds that is
attributable to capital projects constructed to serve future customers.
92 Palm Beach County, Florida, Water Utilities Department

DEMOGRAPHIC AND ECONOMIC INFORMATION
2020 Comprehensive Annual Financial Report 93
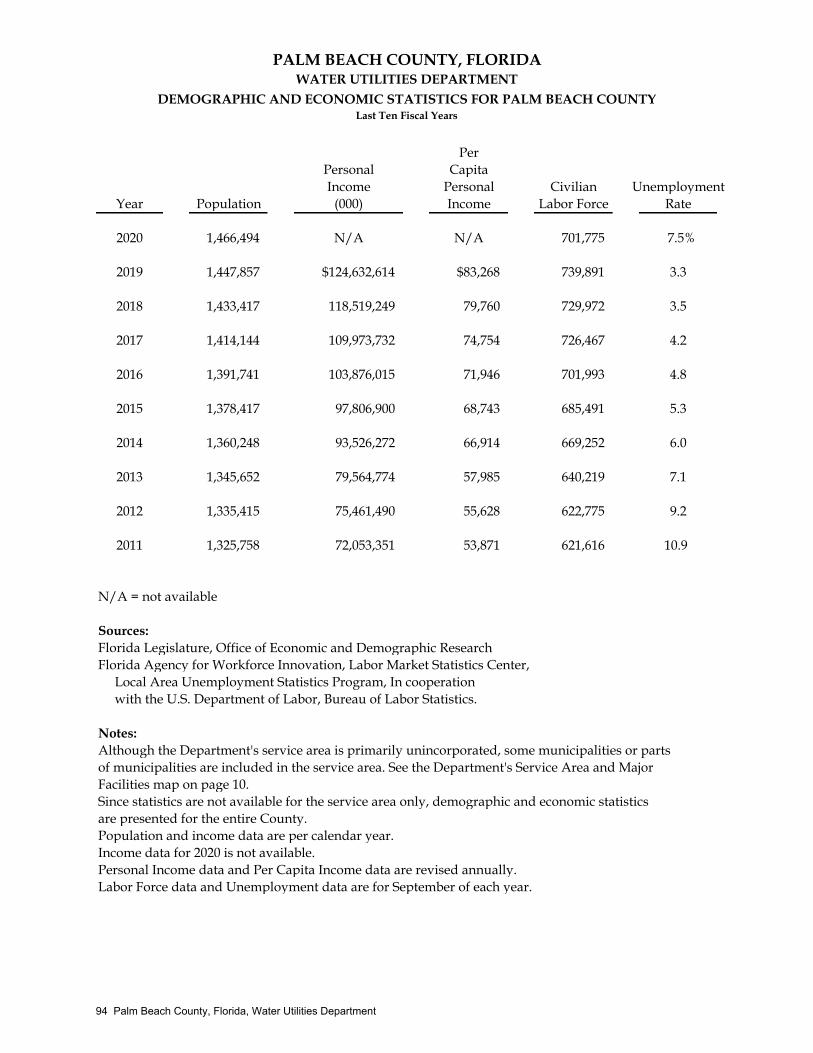
PALM BEACH COUNTY, FLORIDAWATER UTILITIES DEPARTMENT
DEMOGRAPHIC AND ECONOMIC STATISTICS FOR PALM BEACH COUNTYLast Ten Fiscal Years
PerPersonal CapitaIncome Personal Civilian Unemployment
Year Population (000) Income Labor Force Rate
2020 1,466,494 N/A N/A 701,775 7.5%
2019 1,447,857 $124,632,614 $83,268 739,891 3.3
2018 1,433,417 118,519,249 79,760 729,972 3.5
2017 1,414,144 109,973,732 74,754 726,467 4.2
2016 1,391,741 103,876,015 71,946 701,993 4.8
2015 1,378,417 97,806,900 68,743 685,491 5.3
2014 1,360,248 93,526,272 66,914 669,252 6.0
2013 1,345,652 79,564,774 57,985 640,219 7.1
2012 1,335,415 75,461,490 55,628 622,775 9.2
2011 1,325,758 72,053,351 53,871 621,616 10.9
N/A = not available
Sources:Florida Legislature, Office of Economic and Demographic ResearchFlorida Agency for Workforce Innovation, Labor Market Statistics Center, Local Area Unemployment Statistics Program, In cooperation with the U.S. Department of Labor, Bureau of Labor Statistics.
Notes:Although the Department's service area is primarily unincorporated, some municipalities or partsof municipalities are included in the service area. See the Department's Service Area and MajorFacilities map on page 10.Since statistics are not available for the service area only, demographic and economic statisticsare presented for the entire County.Population and income data are per calendar year.Income data for 2020 is not available.Personal Income data and Per Capita Income data are revised annually.Labor Force data and Unemployment data are for September of each year.
94 Palm Beach County, Florida, Water Utilities Department

PALM BEACH COUNTY, FLORIDAWATER UTILITIES DEPARTMENT
PRINCIPAL EMPLOYERS IN PALM BEACH COUNTYCurrent Year and Nine Years Ago
EMPLOYER Employees Rank % Employees Rank %
Palm Beach County School District 22,049 1 3.14 21,495 1 3.46Palm Beach County Government 11,652 2 1.66 11,381 2 1.83Tenet Healthcare Corp 6,505 3 0.93 6,100 5 0.98NextEra Energy (Florida Power & Light) 4,807 4 0.68 3,632 6 0.58Florida Atlantic University 2,898 5 0.41 2,706 9 0.44Hospital Corporation of America (HCA) 2,806 6 0.40 2,714 8 0.44Boca Raton Regional Hospital 2,800 7 0.40 - - -Veterans Health Administration 2,700 8 0.38 - - -The Breakers 2,300 9 0.33 - - -Bethesda Hospital East/West 2,282 10 0.33 2,391 10 0.38State Government - - - 9,200 3 1.48Federal Government - - - 6,200 4 1.00Wackenhut Corporation (G4S) - - - 3,000 7 0.48
Total 60,799 8.66 68,819 11.07
Balance from other employers 641,268 91.34 552,852 88.93
Grand totals 702,067 100.00 621,671 100.00
Source: Business Development Board of Palm Beach County
Notes:
Although the Department's service area is primarily unincorporated, some municipalities or partsof municipalities are included in the service area. See the Department's Service Area and MajorFacilities map on page 10.Since statistics are not available for the service area only, demographic and economic statisticsare presented for the entire County.
2020 2011
2020 Comprehensive Annual Financial Report 95

PALM BEACH COUNTY, FLORIDAWATER UTILITIES DEPARTMENT
RESIDENTIAL BUILDING PERMIT DATA FOR PALM BEACH COUNTYUnincorporated and Incorporated Areas
Last Ten Years
NUMBER OF UNITS:Unincorporated Incorporated Total
Single Family Multi-Family Single Family Multi-Family Single Family Multi-Family
2019 1,843 888 1,342 1,554 3,185 2,4422018 1,720 112 1,284 1,784 3,004 1,8962017 1,733 391 946 1,610 2,679 2,0012016 1,258 733 1,102 2,026 2,360 2,7592015 1,756 260 1,033 1,306 2,789 1,5662014 1,299 443 1,134 1,084 2,433 1,5272013 1,241 497 1,354 1,959 2,595 2,4562012 1,022 252 966 1,940 1,988 2,1922011 609 2 663 39 1,272 412010 568 93 417 172 985 265
Totals 13,049 3,671 10,241 13,474 23,290 17,145
VALUE (in millions):Unincorporated Incorporated Total
Single Family Multi-Family Single Family Multi-Family Single Family Multi-Family
2019 $697 $110 $610 $165 $1,307 $2752018 589 21 519 174 1,108 195 2017 588 60 458 281 1,046 3412016 430 132 440 278 870 4102015 564 38 349 170 913 2082014 477 57 433 178 910 2352013 480 63 448 179 928 2422012 385 36 319 168 704 2042011 201 0 269 7 470 72010 184 9 156 13 340 22
Totals $4,595 $526 $4,001 $1,613 $8,596 $2,139
Source: Palm Beach County Planning, Zoning and Building Department
Notes:
Data for calendar year.Although the Department's service area is primarily unincorporated, some municipalities or parts of municipalities are included
in the service area. See the Department's Service Area and Major Facilities map on page 10.
Since statistics are not available for the service area only, residential building permit data is presented for the entire County.
75%
79%
47%
44%
25%
21%
53%
56%
0% 10% 20% 30% 40% 50% 60% 70% 80% 90%
Multi-Family $ Value
Multi-Family # of Units
Single-Family $ Value
Single-Family # of Units
COMPARATIVE RATIOS
Unincorporated Incorporated
96 Palm Beach County, Florida, Water Utilities Department
0 •

OPERATING INFORMATION
2020 Comprehensive Annual Financial Report 97

BEST WATER, BESTSERVICE&
BESTENVIRONMEN
TALS
TEW
ARDS
HI
P.
98 Palm Bech County, Florida, Water Utilities Department
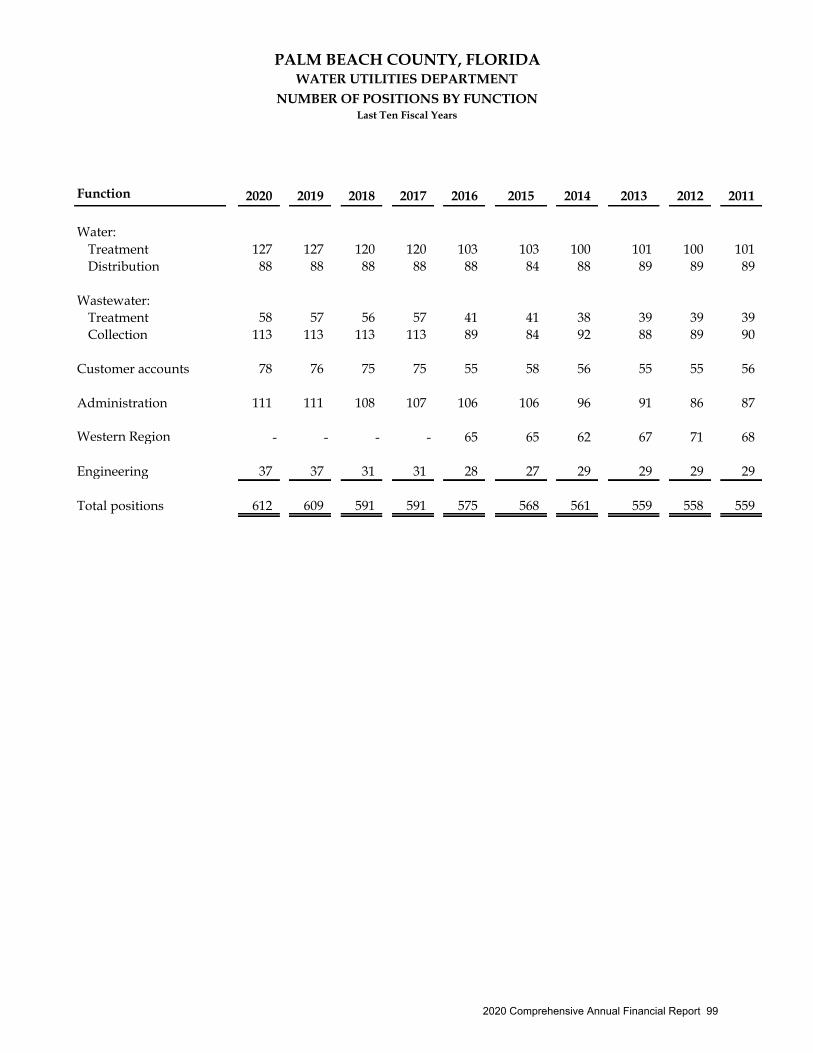
PALM BEACH COUNTY, FLORIDAWATER UTILITIES DEPARTMENT
NUMBER OF POSITIONS BY FUNCTIONLast Ten Fiscal Years
Function 2020 2019 2018 2017 2016 2015 2014 2013 2012 2011
Water:Treatment 127 127 120 120 103 103 100 101 100 101Distribution 88 88 88 88 88 84 88 89 89 89
Wastewater:Treatment 58 57 56 57 41 41 38 39 39 39Collection 113 113 113 113 89 84 92 88 89 90
Customer accounts 78 76 75 75 55 58 56 55 55 56
Administration 111 111 108 107 106 106 96 91 86 87
Western Region - - - - 65 65 62 67 71 68
Engineering 37 37 31 31 28 27 29 29 29 29
Total positions 612 609 591 591 575 568 561 559 558 559
2020 Comprehensive Annual Financial Report 99

PALM BEACH COUNTY, FLORIDAWATER UTILITIES DEPARTMENT
OPERATING AND CAPITAL ASSET STATISTICSLast Ten Fiscal Years
2020 2019 2018*
INCREASE IN SERVICES:Potable water meters 1,894 1,860 1,745Potable water dwelling units 2,465 3,069 2,733Wastewater dwelling units 2,244 2,948 2,557
WATER SUPPLY, TREATMENT, AND DISTRIBUTION SYSTEMS:
RAW WATER WELLS:Total Well Capacity (MGD) 151.06 151.06 151.06Combined permitted Yearly Withdrawal (MG) 35,194 35,194 35,194Combined permitted Maximum Daily Withdrawal (MGD) 140.33 140.33 140.33
TREATMENT PLANTS:Average finished water (MGD) 59.91 58.84 60.00Primary plants 5 5 5Combined permitted treatment capacity (MGD) 113.28 113.28 0.00
Plant 2 (West Lake Worth) 16.40 16.40 16.40Plant 3 (West Delray) 30.00 30.00 30.00Plant 8 (West Palm Beach) 30.00 30.00 30.00Plant 9 (West Boca Raton) 26.88 26.88 26.88Plant 10 (Royal Palm Beach) - - - Plant 11 (Western Region) 10.00 10.00 10.00
DISTRIBUTION SYSTEM:Miles of pipe 2,497 2,504 2,520Storage tanks and repump stations 14 14 18Repump stations 1 1 - Emergency interconnects 23 21 26Bulk meters 9 9 - Fire hydrants 19,740 19,363 19,119Valves 39,231 38,393 37,909Air relief valves 738 688 795
N/A = not available
Notes:When the Glades Utility Authority (GUA) was absorbed on May 1, 2013, Plant 11 was reactivated,which was previously contributed to the GUA on October 1, 2009.The 2013 increase in services includes the following from the GUA absorption: 10,224 potable water meters; 10,900 potable water dwelling units; and 9,515 wastewater dwelling units.Plant 10 was contributed to Royal Palm Beach on July 16, 2013 and is no longer owned by the Department.See pages 70 - 72 and 102 - 103 for additional operating statistics.* Amounts restated due to reorganization of reporting categories.
100 Palm Beach County, Florida, Water Utilities Department

2017* 2016* 2015* 2014* 2013* 2012* 2011*
1,157 1,614 1,487 1,610 11,572 1,253 935723 2,252 1,868 1,970 12,544 1,447 936620 2,146 1,850 1,820 11,075 1,204 799
151.06 151.06 113.28 107.00 103.00 109.00 102.0035,194 35,194 35,194 35,194 35,194 38,792 33,284140.33 140.33 140.33 140.33 139.02 106.28 137.39
60.39 61.32 59.32 58.82 52.04 53.01 53.785 5 5 5 5 5 5
113.28 113.28 113.28 113.28 113.28 104.28 104.3816.40 16.40 16.40 16.40 16.40 14.40 14.5030.00 30.00 30.00 30.00 30.00 30.00 30.0030.00 30.00 30.00 30.00 30.00 30.00 30.0026.88 26.88 26.88 26.88 26.88 26.88 26.88
- - - - - 3.00 3.0010.00 10.00 10.00 10.00 10.00 - -
2,437 2,417 2,407 2,385 2,364 2,152 2,14118 19 16 17 17 17 17
- - - - - - - 26 26 26 26 24 21 20
- - - - - - - 18,635 18,287 18,155 17,839 17,593 16,582 16,353
(continued)
2020 Comprehensive Annual Financial Report 101

PALM BEACH COUNTY, FLORIDAWATER UTILITIES DEPARTMENT
OPERATING AND CAPITAL ASSET STATISTICSLast Ten Fiscal Years
(continued) 2020 2019 2018*
WASTEWATER COLLECTION AND TREATMENT SYSTEMS:
TREATMENT PLANTS:Combined maximum 3-month average (MGD) 34.58 35.20 37.56Combined annual average wastewater treated (MGD) 34.81 31.79 35.14Primary wastewater plants 4 4 4Combined permitted treatment capacity mgd 67.20 67.20 67.20
Southern Region Water Reclamation Facility 35.00 35.00 35.00Department's share @ East Central Regional
Wastewater Facilities 24.50 24.50 24.50Western Region WWTP, Belle Glade 6.50 6.50 6.50Western Region North WWTP, Pahokee 1.20 1.20 1.20
COLLECTION SYSTEM:Miles of gravity wastewater line 1,329 1,307 1,290Pump/Lift Stations 1,080 1,054 1,020Repump Stations 6 6 - Miles of force main 617 606 604Valves 4,440 4,180 4,120Air relief valves 861 839 795Manholes 34,021 33,453 32,996
EFFLUENT DISPOSAL:Deep injection wells 8 8 8
RECLAIMED WATER:Combined annual average reclaimed water (MGD) 29.75 30.64 22.97Combined permitted for reclaimed water (MGD) 52.00 52.00 52.00Wetlands combined permitted capacity (MGD) 5.00 5.00 5.00Combined wetlands (MGD) 1.55 2.40 1.74
Green Cay Wetlands (MGD) 0.72 0.87 0.64Wakodahatchee Wetlands (MGD) 0.87 1.53 1.10
Central Region Reclamation Facility Capacity (MGD) 3.00 3.00 3.00 Central Region Reclamation Facility (MGD) 0.37 0.74 0.19
Miles of pipe 69 68 66Flush hydrants 113 113 111Valves 599 579 555Air relief valves 40 113 112Vacuum relief valves 78 24 24Repump Stations 1 1 - Bulk Meters 3 3 -
N/A = not available
Notes:The Glades Utility Authority was absorbed on May 1, 2013.See pages 70 - 72 and 102 - 103 for additional operating statistics.* Amounts restated due to reorganization of reporting categories.
102 Palm Beach County, Florida, Water Utilities Department

2017* 2016* 2015* 2014* 2013* 2012* 2011*
36.04 36.04 45.30 46.98 42.30 43.87 45.4536.09 36.09 39.59 41.41 38.46 38.81 42.77
4 4 4 4 3 2 267.20 67.20 67.20 66.70 66.70 59.00 58.5035.00 35.00 35.00 35.00 35.00 35.00 35.00
24.50 24.50 24.50 24.00 24.00 24.00 23.506.50 6.50 6.50 6.50 6.50 - - 1.20 1.20 1.20 1.20 1.20 - -
1,273 1,262 1,256 1,248 1,238 1,165 1,1571,006 987 899 893 886 803 768
- - - - - - - 598 594 595 589 588 532 530
4,007 3,847 3,805 3,608 3,541 3,383 3,335780 766 763 752 746 726 721
32,558 31,877 31,714 31,443 31,132 29,457 29,246
8 7 7 7 7 6 5
28.11 30.29 28.13 28.75 8.90 9.71 14.2252.00 52.00 52.00 52.00 60.00 22.00 22.00
5.00 5.00 3.53 3.18 2.72 1.92 2.632.42 2.50 - - - - -0.67 0.94 0.94 0.82 0.66 0.67 0.930.83 0.96 0.96 0.79 0.83 0.63 0.903.00 3.00 1.63 1.57 1.23 0.62 0.800.92 0.60
63 62 61 60 57 55 55109 109 107 101 101 99 99537 522 511 482 477 471 467111 108 106 100 100 98 99
2020 Comprehensive Annual Financial Report 103

PALM BEACH COUNTY, FLORIDAWATER UTILITIES DEPARTMENT
POTABLE WATER VARIANCE ANALYSISLast Ten Fiscal Years
(in million gallons) 2020 2019 2018 2017 2016 2015 2014 2013 (3) 2012 2011
Pumped 24,997 24,182 25,125 27,814 26,349 24,563 24,495 22,340 20,672 21,538
Treated (1) 21,928 21,487 22,290 24,673 23,434 21,586 21,447 19,824 18,845 19,690
Available (2) 20,136 19,667 20,173 20,953 20,943 19,843 20,476 18,991 18,139 18,909
Sold 18,683 17,819 17,774 18,211 17,654 17,500 17,695 17,346 17,022 18,040
Unaccounted for water 1,453 1,848 2,399 2,742 3,289 2,343 2,781 1,645 1,117 869
"Unaccounted for water"
as a percentage of
treated water 6.6% 8.6% 10.8% 11.1% 14.0% 10.9% 13.0% 8.3% 5.9% 4.4%
Notes:(1) The variance between Pumped and Treated is accounted for by water used within the water plants.(2) The variance between Treated and Available is accounted for by water used system-wide for purposes such as hydrant flushing and lift station and wastewater plant use.(3) On May 1, 2013, the Department absorbed the Glades Utility Authority (GUA). The percentage includes the GUA data.
0
5
10
15
20
25
30
2011 2012 2013 (3) 2014 2015 2016 2017 2018 2019 2020
GA
LL
ON
S (
IN B
ILL
ION
S)
FISCAL YEAR
POTABLE WATER
Pumped Treated Available Sold Unaccounted for water
104 Palm Beach County, Florida, Water Utilities Department

PALM BEACH COUNTY, FLORIDAWATER UTILITIES DEPARTMENT
WASTEWATER TREATEDLast Ten Fiscal Years
(in million gallons) 2020 2019 2018 2017 2016 2015 2014 2013 (2) 2012 2011
Department plants 8,009 7,545 7,954 7,910 8,860 9,702 9,807 9,180 8,615 7,820
ECR (1) 5,028 4,394 5,163 4,968 5,161 4,666 5,175 5,653 5,499 4,949
Total Treated 13,037 11,939 13,117 12,878 14,021 14,368 14,982 14,833 14,114 12,769
Daily Average 35.6 32.7 35.9 35.3 38.3 39.4 41.0 40.6 38.6 35.0
Notes:(1) Per an Interlocal Agreement, at September 30, 2010 Palm Beach County owns 34.29% of the capacity at the East Central Regional Wastewater Facilities (ECR) operated by the City of West Palm Beach.(2) On May 1, 2013, the Department absorbed the Glades Utility Authority (GUA). The amount treated includes GUA data.
0
5
10
15
20
2011 2012 2013 (2) 2014 2015 2016 2017 2018 2019 2020
GA
LL
ON
S (
IN B
ILL
ION
S)
FISCAL YEAR
WASTEWATER
Wastewater Treated Water Sold
2020 Comprehensive Annual Financial Report 105

BEST WATER, BESTSERVICE&
BESTENVIRONMEN
TALS
TEW
ARDS
HI
P.
106 Palm Beach County, Florida, Water Utilities Department

Compliance Report


Report on Internal Control Over Financial Reporting and on Compliance and Other Matters Based
on an Audit of the Financial Statements Performed in Accordance with Government Auditing Standards
Independent Auditor’s Report
The Honorable Board of County Commissioners Palm Beach County, Florida Water Utilities Department Palm Beach County, Florida
We have audited in accordance with the auditing standards generally accepted in the United States of America and the standards applicable to financial audits contained in Government Auditing Standards issued by the Comptroller General of the United States, the accompanying statement of net position of the Palm Beach County, Florida Water Utilities Department (the Department) as of September 30, 2020, and the related statements of revenues, expenses and changes in net position and cash flows for the year then ended, and have issued our report thereon dated March 26, 2021, which contained an unmodified opinion on the financial statements.
Internal Control Over Financial Reporting In planning and performing our audit of the financial statements, we considered the Department’s internal control over financial reporting (internal control) as a basis for designing audit procedures that are appropriate in the circumstances for the purpose of expressing our opinion on the financial statements, but not for the purpose of expressing an opinion on the effectiveness of the Department’s internal control. Accordingly, we do not express an opinion on the effectiveness of the Department’s internal control.
A deficiency in internal control exists when the design or operation of a control does not allow management or employees, in the normal course of performing their assigned functions, to prevent, or detect and correct, misstatements on a timely basis. A material weakness is a deficiency, or a combination of deficiencies, in internal control, such that there is a reasonable possibility that a material misstatement of the entity’s financial statements will not be prevented, or detected and corrected on a timely basis. A significant deficiency is a deficiency, or a combination of deficiencies, in internal control that is less severe than a material weakness, yet important enough to merit attention by those charged with governance.
Our consideration of internal control was for the limited purpose described in the first paragraph of this section and was not designed to identify all deficiencies in internal control that might be material weaknesses or significant deficiencies. Given these limitations, during our audit, we did not identify any deficiencies in internal control that we consider to be material weaknesses. However, material weaknesses may exist that have not been identified.
2020 Comprehensive Annual Financial Report 107
Compliance and Other Matters As part of obtaining reasonable assurance about whether the Department’s financial statements are free from material misstatement, we performed tests of its compliance with certain provisions of laws, regulations, contracts and grant agreements, noncompliance with which could have a direct and material effect on the financial statements. However, providing an opinion on compliance with those provisions was not an objective of our audit, and accordingly, we do not express such an opinion. The results of our tests disclosed no instances of noncompliance or other matters that are required to be reported under Government Auditing Standards.
Purpose of This Report The purpose of this report is solely to describe the scope of our testing of internal control and compliance and the results of that testing, and not to provide an opinion on the effectiveness of the Department’s internal control or on compliance. This report is an integral part of an audit performed in accordance with Government Auditing Standards in considering the Department’s internal control and compliance. Accordingly, this communication is not suitable for any other purpose.
West Palm Beach, Florida March 26, 2021
108 Palm Beach County, Florida, Water Utilities Department


8100 Forest Hill Boulevard
West Palm Beach, FL 33413
(561) 493-6000
pbcwater.com
Palm Beach County Water Utilities DepartmentA Department of the Palm Beach County Board of County Commissioners
BEST WATER, BEST SERVICE & BEST ENVIRONMENTAL STEWARDSHIP.
Pair of Northern Shovelers, Wakodahatchee WetlandsPhoto by Richard Rivers