paleoclimate review sanpisa sritrairat january 26, 2007
TRANSCRIPT

Paleoclimate ReviewPaleoclimate Review
Sanpisa SritrairatSanpisa Sritrairat
January 26, 2007January 26, 2007

Topics to be coveredTopics to be covered
Important climatic states of the earthImportant climatic states of the earth
EvidencesEvidences
Why did “climate change”?Why did “climate change”?
Paleo-ClimatePaleo-Climate
Climate is the Climate is the mean statemean state of the of the environment, long-term average of daily environment, long-term average of daily variationsvariations
““Climate change” depends on the Climate change” depends on the resolution of the proxies and the length of resolution of the proxies and the length of the “mean state” in considerationthe “mean state” in consideration
Climate Change EventsClimate Change Events
Tectonic scale (Millions of years ago)Tectonic scale (Millions of years ago)
Orbital Scale, when Milankovich Orbital Scale, when Milankovich
started showing up (3 Ma)started showing up (3 Ma)
Deglacial and Millennial ScaleDeglacial and Millennial Scale
Historical climate changesHistorical climate changes
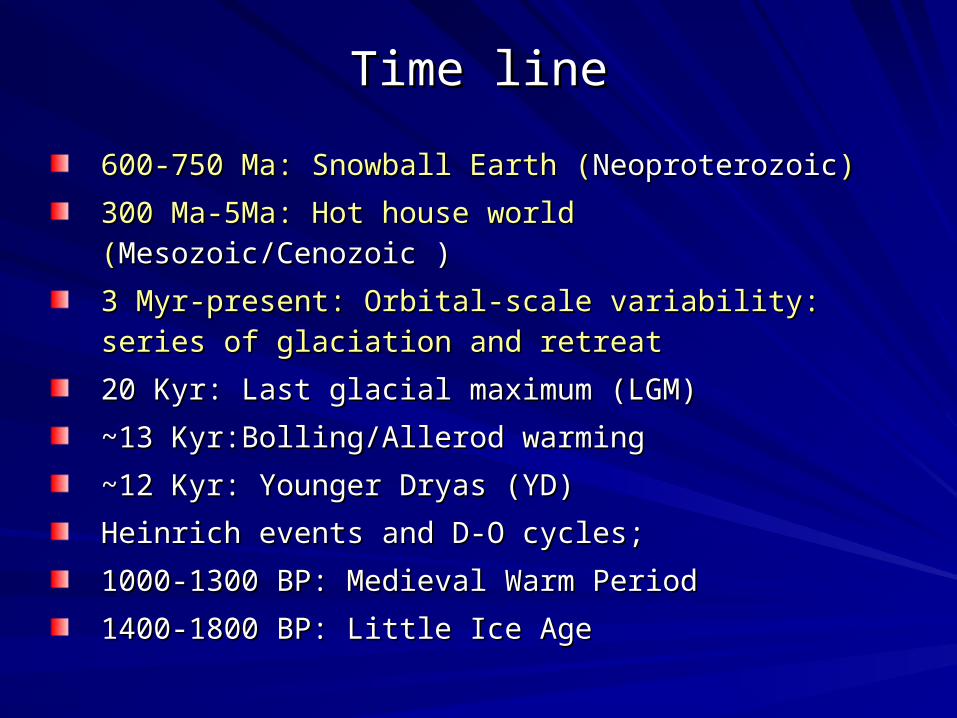
Time lineTime line
600-750 Ma: Snowball Earth (600-750 Ma: Snowball Earth (NeoproterozoicNeoproterozoic))
300 Ma-5Ma:300 Ma-5Ma: Hot house world ( Hot house world (Mesozoic/Cenozoic )Mesozoic/Cenozoic )
3 Myr-present: Orbital-scale variability: series of 3 Myr-present: Orbital-scale variability: series of glaciation and retreatglaciation and retreat
20 Kyr: Last glacial maximum (LGM) 20 Kyr: Last glacial maximum (LGM)
~13 Kyr:Bolling/Allerod warming ~13 Kyr:Bolling/Allerod warming
~12 Kyr: Younger Dryas (YD)~12 Kyr: Younger Dryas (YD)
Heinrich events and D-O cyclesHeinrich events and D-O cycles;;
1000-1300 BP: Medieval Warm Period1000-1300 BP: Medieval Warm Period
1400-1800 BP: Little Ice Age1400-1800 BP: Little Ice Age

How to study paleoclimate? How to study paleoclimate?
MarineMarineOcean sediment cores (more regional)Ocean sediment cores (more regional)
Terrestrial (more local)Terrestrial (more local)Lakes and wetlands coresLakes and wetlands coresTree ring/Coral (growth response)Tree ring/Coral (growth response)Ice coresIce coresSpeleothemSpeleothemIce coresIce coresSedimentary rocks/uplifted sedimentsSedimentary rocks/uplifted sediments

Proxies: Lithology, sediment compositionProxies: Lithology, sediment composition
Black:Black:
– high organic, anoxic, high productivityhigh organic, anoxic, high productivity
Sharp pebbles, unsorted: Sharp pebbles, unsorted:
– Glacial depositGlacial deposit
High silica: upwelling, high productivityHigh silica: upwelling, high productivity
Terrigenous: high weathering, river flowTerrigenous: high weathering, river flow
Calcareous: Warm, high productivityCalcareous: Warm, high productivity
Tephra: volcanic eruptionTephra: volcanic eruption

Proxies: plant and animal remainsProxies: plant and animal remains
Pollens, foramsPollens, forams
Molecular techniques (transformation of molecules at Molecular techniques (transformation of molecules at
a specific condition, or specific remains of group of a specific condition, or specific remains of group of
living organism).i.e. alkenones, ligninliving organism).i.e. alkenones, lignin
Each species has a specific range of habitat (precip, Each species has a specific range of habitat (precip,
T, soil type, nutrients, salinity)T, soil type, nutrients, salinity)
i.e. found foram in freshwater wetland cores: must have been i.e. found foram in freshwater wetland cores: must have been
saltier, Tropic pollen in the arctic = warmersaltier, Tropic pollen in the arctic = warmer

Proxies:Stable IsotopesProxies:Stable Isotopes
If relative ratios of the selected pair changes If relative ratios of the selected pair changes
systematically according to climatic systematically according to climatic
parameters (T, precip, pH, etc)parameters (T, precip, pH, etc)
Mg/Ca: TMg/Ca: T
δδ1313C: ocean circulation, productivity, C cycleC: ocean circulation, productivity, C cycle
δδ1818O:Temperature/Salinity/Sea levelO:Temperature/Salinity/Sea level
– More ice on land: ocean More ice on land: ocean δδ1818O becomes heavier O becomes heavier

Rayleigh Distillation (Precipiation Fraction)

ChronologyChronology
RadiometricRadiometric
– C-14, U/Th, Ar/Ar, etc.C-14, U/Th, Ar/Ar, etc.
PaleomagneticPaleomagnetic
Wiggle match (cross dated): matching the Wiggle match (cross dated): matching the
same featuressame features

Understanding the Past ClimateUnderstanding the Past Climate
Many explanation are theoretical without Many explanation are theoretical without
consensusconsensus
A lot of underlying hypothesis has to do A lot of underlying hypothesis has to do
with the equilibrium of earth cycling with the equilibrium of earth cycling
process: weathering, precipitationprocess: weathering, precipitation
Think in term of feedbacksThink in term of feedbacks
Snowball Earth (~600-700 Ma)Snowball Earth (~600-700 Ma)EvidencesEvidences
Glacial deposits sandwiched between “cap Glacial deposits sandwiched between “cap
carbornates” every continents (including those at carbornates” every continents (including those at
paleo-equator)paleo-equator)
Banded iron in the glacial deposit Banded iron in the glacial deposit anoxia (ice- anoxia (ice-
covered ocean can’t circulate Ocovered ocean can’t circulate O22 down.) down.)
Several paleomagnetic reversals within each Several paleomagnetic reversals within each
glacial layer glacial layer millions of years millions of yearshttp://www-eps.harvard.edu/people/faculty/hoffman/snowball_paper.html


Cycles of cold/hot periodCycles of cold/hot period
http://www-eps.harvard.edu/people/faculty/hoffman/Snowball-fig5.pdf
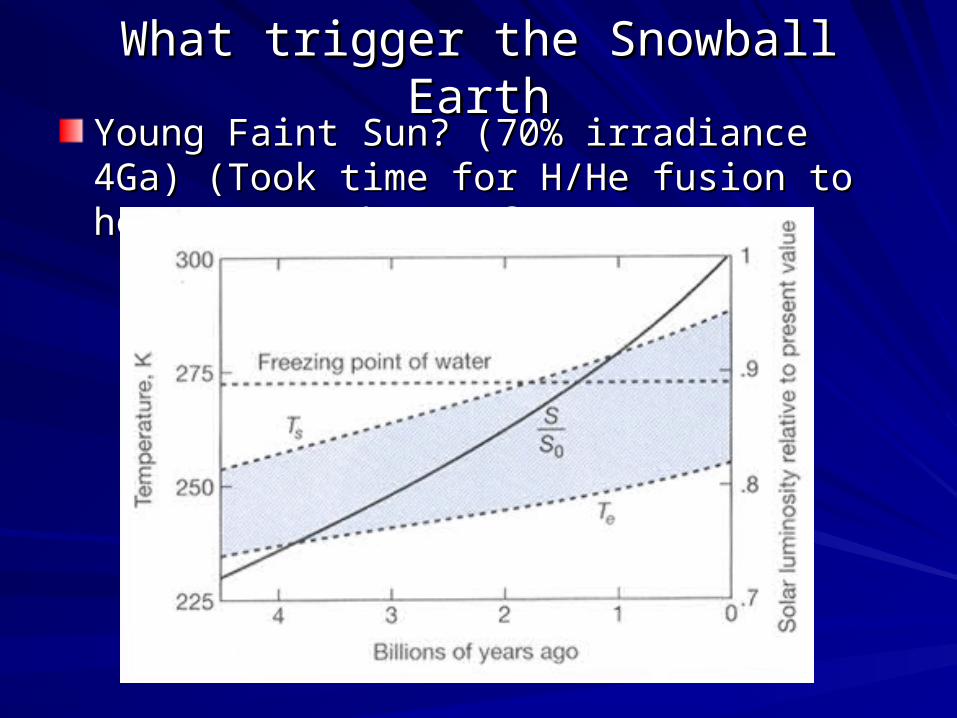
What trigger the Snowball EarthWhat trigger the Snowball EarthYoung Faint Sun? (70% irradiance 4Ga) (Took Young Faint Sun? (70% irradiance 4Ga) (Took time for H/He fusion to heat up to the surface)time for H/He fusion to heat up to the surface)

Faint Young Sun ParadoxFaint Young Sun Paradox
The Sun's luminosity has increased through geologic time due to a nuclear reaction The Sun's luminosity has increased through geologic time due to a nuclear reaction in the Sun's interior that fuses nuclei of hydrogen together to form helium. This in the Sun's interior that fuses nuclei of hydrogen together to form helium. This nuclear reaction has caused the Sun to expand and become brighter. nuclear reaction has caused the Sun to expand and become brighter. Consequently, the early Sun shone 25-30% less brightly than it does today.Consequently, the early Sun shone 25-30% less brightly than it does today.
This raises a paradox. At such a low solar luminosity, we would expect all water in This raises a paradox. At such a low solar luminosity, we would expect all water in Earth to have been frozen. Yet, sedimentary rocks provide evidence of running Earth to have been frozen. Yet, sedimentary rocks provide evidence of running water at least 4 billion years ago. Some mechanism must have kept Earth warm. water at least 4 billion years ago. Some mechanism must have kept Earth warm. Yet, wouldn't the same mechanism cause the Earth to be intolerably hot today?Yet, wouldn't the same mechanism cause the Earth to be intolerably hot today?
It has been hypothesized that the solution to the faint young sun problem It has been hypothesized that the solution to the faint young sun problem is that is that outgassingoutgassing from volcanoes was high due to vigorous seafloor from volcanoes was high due to vigorous seafloor spreading. At the same time, weathering was very low due to a dearth of spreading. At the same time, weathering was very low due to a dearth of continents. Thus, atmospheric CO2 was much higher than today, continents. Thus, atmospheric CO2 was much higher than today, providing a healthy greenhouse effect to keep the early Earth warm.providing a healthy greenhouse effect to keep the early Earth warm.

High obliquity hypothesis?High obliquity hypothesis?
May be from May be from asteroid that hit asteroid that hit the earth and the earth and made the moonmade the moon
But..But..
Very high Very high seasonality seasonality variability in the variability in the tropictropic

Land mass distributionLand mass distribution
Higher tropical albedo (Land albedo > ocean) Higher tropical albedo (Land albedo > ocean)

Hot House WorldHot House World (300-5 Ma) Mesozoic/Cenozoic)(300-5 Ma) Mesozoic/Cenozoic)
Thermal max: 55 Ma (Cenozoic)Thermal max: 55 Ma (Cenozoic)
Clues: Clues: – Marine T proxiesMarine T proxies– Tropical plants fossils, Tropical plants fossils, alligator, & alligator, & pollens up pollens up
in the arcticin the arctic– Organic-rich deposit (anoxia)Organic-rich deposit (anoxia)– Much lighter in Much lighter in δδ1818O O (-40‰ vs. 0 of ocean, and vs. (-40‰ vs. 0 of ocean, and vs.
-25 ‰ if melt all ice now. Must have additional T -25 ‰ if melt all ice now. Must have additional T effects.)effects.)
– No glaciomarine depositNo glaciomarine deposit

Causes of the hot house?Causes of the hot house?
Tectonic block circum polar current Tectonic block circum polar current can’t form arctic ice sheet?can’t form arctic ice sheet?
Can’t form deep water since there is no Can’t form deep water since there is no strong T gradient (est. 12ºC vs. ~0 now)strong T gradient (est. 12ºC vs. ~0 now)
CHCH44 Clathrate release>> positive Clathrate release>> positive
greenhouse feedbackgreenhouse feedback– supported by lighter δsupported by lighter δ1313CC

BLAG hypothesisBLAG hypothesis
Rate of plate movement influences global climate by Rate of plate movement influences global climate by controlling atmospheric COcontrolling atmospheric CO22 concentrations concentrations
Support: faster seafloor spreading rate 100 Ma than nowSupport: faster seafloor spreading rate 100 Ma than now
Weathering: CaSiO3 + CO2 --> CaCO3 + SiO2
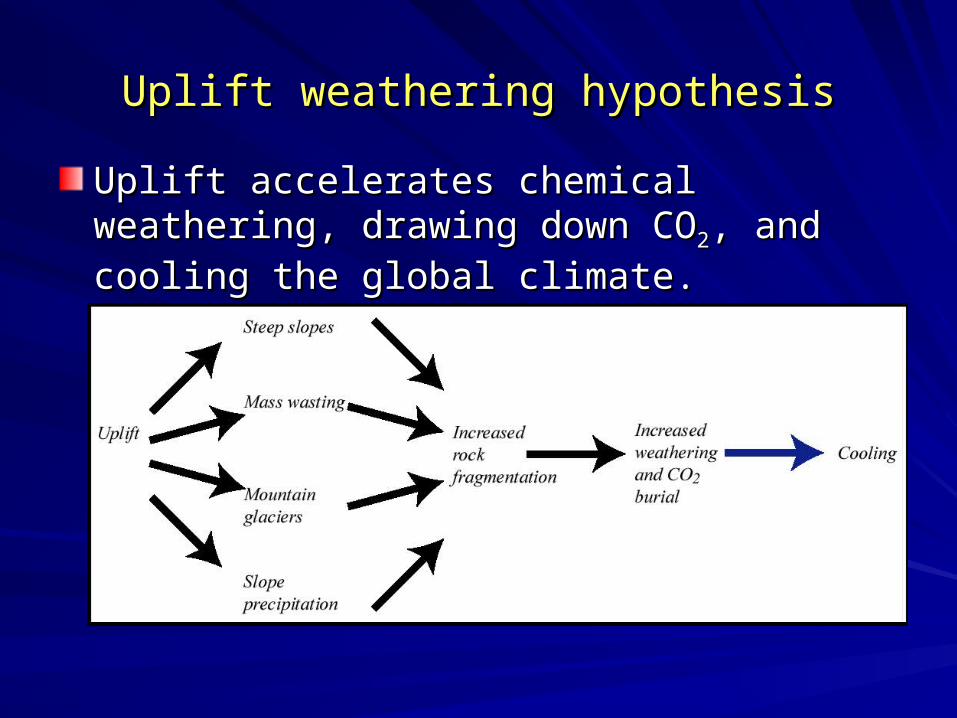
Uplift weathering hypothesisUplift weathering hypothesis
Uplift accelerates chemical weathering, Uplift accelerates chemical weathering, drawing down COdrawing down CO22, and cooling the global , and cooling the global climate.climate.

Support of the Uplift HypothesisSupport of the Uplift Hypothesis
Tibetan Paleau Tibetan Paleau (also high monsoon strength which (also high monsoon strength which
encourages weathering),encourages weathering), Colorado Paleau, the Andes Colorado Paleau, the Andes uplifted about that time.uplifted about that time.
High 87/86 Sr ratio = higher weatheringHigh 87/86 Sr ratio = higher weathering

Factors that control chemical Factors that control chemical weatheringweathering
1. Temperature- chemical weathering increases 1. Temperature- chemical weathering increases with increased temperatureswith increased temperatures
2. Precipitation- increased precipitation raises the 2. Precipitation- increased precipitation raises the level of groundwater in soils, promoting the level of groundwater in soils, promoting the production of carbonic acidproduction of carbonic acid
3. Vegetation- plants extract CO2 from the 3. Vegetation- plants extract CO2 from the atmosphere and deliver it to soils, where it atmosphere and deliver it to soils, where it combines with groundwater to make carbonic combines with groundwater to make carbonic acidacid

Long-term carbon cycleLong-term carbon cycleCarbon added to atmosphere through metamorphic Carbon added to atmosphere through metamorphic outgassing and outgassing of volcanoes and mid-ocean ridgesoutgassing and outgassing of volcanoes and mid-ocean ridges
Hydrolysis-weathering of silicate minerals in continental crust:Hydrolysis-weathering of silicate minerals in continental crust:CaSiO3 + H2CO3 >> CaCO3 + SiO2 + H2OCaSiO3 + H2CO3 >> CaCO3 + SiO2 + H2O
The products of continental weathering are transported to the The products of continental weathering are transported to the oceans by rivers, where they are used to make CaCO3 and oceans by rivers, where they are used to make CaCO3 and SiO2 shells of marine organisms. When these organisms die, SiO2 shells of marine organisms. When these organisms die, many of them are deposited and buried on the seafloor. The many of them are deposited and buried on the seafloor. The carbon cycle is completed upon subduction and melting of carbon cycle is completed upon subduction and melting of these sediments. The melt may rise as magma, providing these sediments. The melt may rise as magma, providing volcanoes and MORs with a source of recycled CO2.volcanoes and MORs with a source of recycled CO2.
Important flows of carbon on 100,000 year time scales
Long-term carbon cycleLong-term carbon cycle
Chemical weathering can also occur through a process called Chemical weathering can also occur through a process called dissolution, the chemical weathering of carbonate sediments dissolution, the chemical weathering of carbonate sediments (CaCO3) (limestone, for example). Dissolution can be described by (CaCO3) (limestone, for example). Dissolution can be described by the following reaction:the following reaction:
CaCO3 + H2CO3 >> CaCO3 + H2O + CO2CaCO3 + H2CO3 >> CaCO3 + H2O + CO2
Note, however, that the net removal of atmospheric CO2 is 0. CO2 Note, however, that the net removal of atmospheric CO2 is 0. CO2 is taken from the atmosphere to make carbonic acid, but is is taken from the atmosphere to make carbonic acid, but is released to the atmosphere during the creating of CaCO3 shells. released to the atmosphere during the creating of CaCO3 shells.

Summary: influence of plate tectonics on Summary: influence of plate tectonics on climateclimate
1. Location of continents1. Location of continents
2. Mountain building- alters atmospheric flow2. Mountain building- alters atmospheric flow
3. Open/close ocean gateways3. Open/close ocean gateways
4. Sea-level change- modifies ratio of land to ocean4. Sea-level change- modifies ratio of land to ocean
5. Altering weathering rates- linked to concentration 5. Altering weathering rates- linked to concentration
of COof CO22 in atmosphere in atmosphere
6. Altering rates of outgassing- linked to 6. Altering rates of outgassing- linked to
concentration of COconcentration of CO22 in atmosphere in atmosphere
Ice house world: Ice house world: (Eocene onset, 34Ma-(Eocene onset, 34Ma-present)present)
Started to have polar ice capStarted to have polar ice cap
– 35 Ma: Australian Gateway: initial Antarctic 35 Ma: Australian Gateway: initial Antarctic
glaciationglaciation
– 15 Ma: Drake Passage opened: more 15 Ma: Drake Passage opened: more
Antarctic glaciationAntarctic glaciation
Current glaciation cycles: 3 Ma-presentCurrent glaciation cycles: 3 Ma-present

What caused the onset?What caused the onset?
Cane: NW drift of Halmahera (N. Australian) block Cane: NW drift of Halmahera (N. Australian) block
PAC and form warm pool before 3 Ma (permanent El PAC and form warm pool before 3 Ma (permanent El
nino)?nino)?
Characteristic of this period: Insolation variability Characteristic of this period: Insolation variability
hypothesishypothesisSummer insolationSummer insolation controls North controls North
Hemisphere ice sheet growthHemisphere ice sheet growth. Ice growth occurs . Ice growth occurs
during times when summer insolation is low in high during times when summer insolation is low in high
northern latitude. northern latitude.

Orbital forcing: Milankovitch TheoryOrbital forcing: Milankovitch Theory
Obliquity: Obliquity: 41, 000 41, 000 yr cycleyr cycle
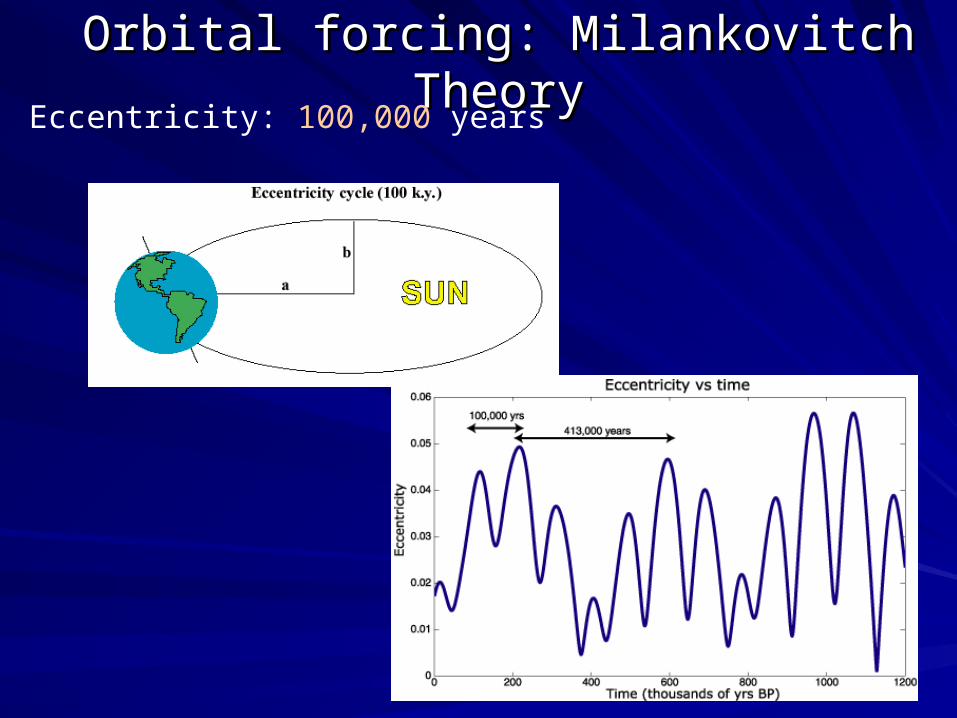
Orbital forcing: Milankovitch TheoryOrbital forcing: Milankovitch TheoryEccentricity: 100,000 years

Orbital forcing: Milankovitch TheoryOrbital forcing: Milankovitch TheoryPrecession: 19,000-23,000 years
The major axis of each planet's elliptical orbit also precesses within its orbital plane, in response to perturbations in the form of the changing gravitational forces exerted by other planets. This is called perihelion precession.
It is generally understood that the gravitational pulls of the sun and the moon cause the precession of the equinoxes on Earth which operate on cycles of 23,000 and 19,000 years.

Orbital scale insolation changeOrbital scale insolation change
Strong 23 ky Strong 23 ky (precession) and 40 (precession) and 40 k cycles (Obliquity)k cycles (Obliquity)
100 ky cycle is not 100 ky cycle is not obviousobvious

Northern Hemisphere Ice sheet HistoryNorthern Hemisphere Ice sheet History
41 and 23 kyr 41 and 23 kyr cycles from ~.7-3 cycles from ~.7-3 MaMa
But why 100 ky But why 100 ky cycles dominate cycles dominate climate records of climate records of the last 700 ky?the last 700 ky?
Orbital monsoon hypothesisOrbital monsoon hypothesis
Changing seasonal insolation will change the strength of the Changing seasonal insolation will change the strength of the monsoons. Stronger summer radiation will strengthen the monsoons. Stronger summer radiation will strengthen the summer monsoon. Weaker winter radiation will strengthen the summer monsoon. Weaker winter radiation will strengthen the winter monsoon. It turns out that the African monsoon is very winter monsoon. It turns out that the African monsoon is very sensitive to insolation variations. sensitive to insolation variations.
The African monsoon is responsible for precipitation over The African monsoon is responsible for precipitation over northern Africa. Today, the summer solstice occurs at aphelion. northern Africa. Today, the summer solstice occurs at aphelion. So, the summer insolation is near its minimum. As a So, the summer insolation is near its minimum. As a consequence, northern Africa consequence, northern Africa summer monsoon summer monsoon is is weakweak. .
Although the strength of the winter monsoon also varies, it has Although the strength of the winter monsoon also varies, it has less impact on the African environment because the winter less impact on the African environment because the winter monsoon has little affect on precipitation over Africa. monsoon has little affect on precipitation over Africa.

Evidence for an orbitally-controlled monsoonEvidence for an orbitally-controlled monsoon
1. Lake levels across North Africa2. Mediterranean circulation and deposition of marine sediments3. Freshwater diatoms (small plant plankton) in the tropical Atlantic4. Upwelling in the equatorial Atlantic
Relationship between summer radiation and African monsoon (from Earth's Climate Past and Future by W.F. Ruddiman).
Millenial Scale Climate Millenial Scale Climate ChangeChange
Last glacial maximum (LGM): ~21kyaLast glacial maximum (LGM): ~21kya
Bolling/Allerod warming-> Younger Bolling/Allerod warming-> Younger Dryas cooling:~13-11.9kyaDryas cooling:~13-11.9kya
Heinrich eventsHeinrich events
Dansgaard-Oeschger eventsDansgaard-Oeschger events

Last glacial maximum (~20 Ky)Last glacial maximum (~20 Ky)
Cold, dry and windy Cold, dry and windy
Continent-sized ice sheets (Laurentide ice Continent-sized ice sheets (Laurentide ice
sheet over North America)sheet over North America)
110m lower sea level than present110m lower sea level than present

Tropical debate over LGM coolingTropical debate over LGM cooling
Small tropical cooling (~2°C ) : CLIMAP Small tropical cooling (~2°C ) : CLIMAP reconstruction based on the changes in planktic reconstruction based on the changes in planktic fauna and flora in the low-latitude oceans. Other fauna and flora in the low-latitude oceans. Other evidences: biochemical composition of plankton evidences: biochemical composition of plankton shells (double bonds of alkenones), shells (double bonds of alkenones), δδ1818O O measurements on the CaCOmeasurements on the CaCO33 shells of plankton shells of plankton..
Large tropical cooling (~5°C ): Mountain glacial Large tropical cooling (~5°C ): Mountain glacial ice line change, noble gases dissolved in glacial-ice line change, noble gases dissolved in glacial-age groundwater.age groundwater.GCMs can only get level of ice sheet and tropical GCMs can only get level of ice sheet and tropical glacier growth with ~5ºC shift in tropical glacier growth with ~5ºC shift in tropical temperaturetemperature
Abrupt Abrupt climate changeclimate change
Heinrich events: ice-rafted debris & Heinrich events: ice-rafted debris & terrigenous material found in deep-terrigenous material found in deep-sea cores, corresponding to sea cores, corresponding to Greenland ice core low Greenland ice core low δδ1818O. O. Dansgaard-Oeschger cycle: A series Dansgaard-Oeschger cycle: A series of warm-cold oscillation punctuated of warm-cold oscillation punctuated the last glaciation from 15 to 110 Kyr the last glaciation from 15 to 110 Kyr BP. The D-O cycles have been BP. The D-O cycles have been marked by abrupt terminations, and marked by abrupt terminations, and often by abrupt onsets.often by abrupt onsets.

Heinrich and D-O eventsHeinrich and D-O events

Antarctic Record v. Antarctic Record v. GreenlandGreenland
An absence of D-O events in Antarctica


Younger DryasYounger Dryas
Younger DryasYounger Dryas
The Younger Dryas was first detected from layers in The Younger Dryas was first detected from layers in
north European bog peat, and named for the north European bog peat, and named for the
alpine/tundra plant alpine/tundra plant Dryas octopetalaDryas octopetala..
It was a brief (approximately 1300 +/- 70year [1]) cold It was a brief (approximately 1300 +/- 70year [1]) cold
climate period following the Bölling/Allerød interstadial climate period following the Bölling/Allerød interstadial
at the end of the Pleistocene, and preceding the at the end of the Pleistocene, and preceding the
Preboreal of the early Holocene. Preboreal of the early Holocene.
It is dated approximately 12,900-11,500 BP It is dated approximately 12,900-11,500 BP
calibrated, or 11,000-10,000 BP uncalibrated, but calibrated, or 11,000-10,000 BP uncalibrated, but
dating is difficult because it occurs during a dating is difficult because it occurs during a
radiocarbon plateauradiocarbon plateau
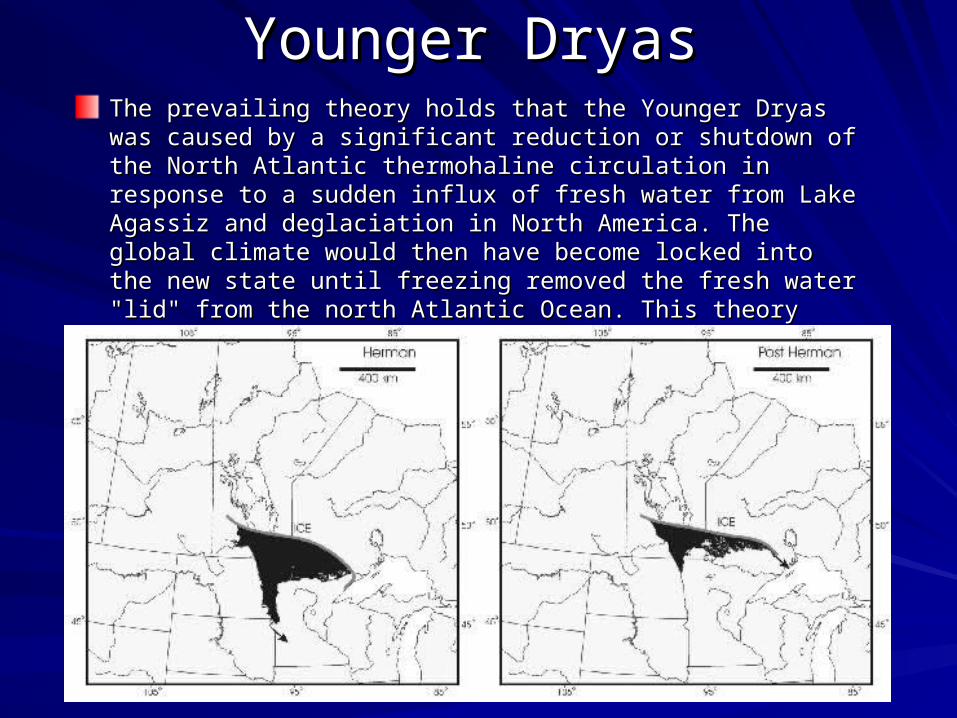
Younger DryasYounger DryasThe prevailing theory holds that the Younger Dryas was The prevailing theory holds that the Younger Dryas was caused by a significant reduction or shutdown of the North caused by a significant reduction or shutdown of the North Atlantic thermohaline circulation in response to a sudden Atlantic thermohaline circulation in response to a sudden influx of fresh water from Lake Agassiz and deglaciation in influx of fresh water from Lake Agassiz and deglaciation in North America. The global climate would then have become North America. The global climate would then have become locked into the new state until freezing removed the fresh locked into the new state until freezing removed the fresh water "lid" from the north Atlantic Ocean. This theory does not water "lid" from the north Atlantic Ocean. This theory does not explain why South America cooled first.explain why South America cooled first.

Younger DryasYounger DryasA problem with this hypothesis is the timing of meltwater pulses that are A problem with this hypothesis is the timing of meltwater pulses that are supposed to have triggered the THC shutdown: it was found that a supposed to have triggered the THC shutdown: it was found that a second meltwater pulse, albeit slightly smaller than the first one, second meltwater pulse, albeit slightly smaller than the first one, occurred at the end of the YD (Fairbanks, 1989): why didn't it also occurred at the end of the YD (Fairbanks, 1989): why didn't it also trigger a similar chain of consequences in the climate system?trigger a similar chain of consequences in the climate system?
An alternate explanation (Clement et al., 2001) invokes the abrupt An alternate explanation (Clement et al., 2001) invokes the abrupt cessation in the El Nino -Southern Oscillation in response to changes in cessation in the El Nino -Southern Oscillation in response to changes in the orbital parameters of the Earth, although how such a change would the orbital parameters of the Earth, although how such a change would impact regions away from the Tropics remains to be explained.impact regions away from the Tropics remains to be explained.
For further discussion, see: Broecker, WS., Does the trigger for abrupt For further discussion, see: Broecker, WS., Does the trigger for abrupt climate change reside in the oceans or in the atmosphere? Science 300 climate change reside in the oceans or in the atmosphere? Science 300 (5625): 1519-1522 JUN 6 2003.(5625): 1519-1522 JUN 6 2003.

Medieval WarmingMedieval Warming
10th century-14th century in Europe; 10th century-14th century in Europe; May recent finding in North AmericaMay recent finding in North America
Coincided with a peak in solar Coincided with a peak in solar activityactivity

Little Ice AgeLittle Ice AgeA period of cooling from approx. 14th-19th A period of cooling from approx. 14th-19th century, occurs after the medieval century, occurs after the medieval warming, though there seems to be little warming, though there seems to be little global agreement on the timing. global agreement on the timing.
Most evidence in Europe and north AmericaMost evidence in Europe and north America
Hypotheses of the cause include decreased Hypotheses of the cause include decreased sunspot activity (Maunder minimum) and sunspot activity (Maunder minimum) and increased volcanic activity, others claim it increased volcanic activity, others claim it had to do with a decrease in population had to do with a decrease in population resulting from the black death and thus a resulting from the black death and thus a decrease in agricultural activitydecrease in agricultural activity
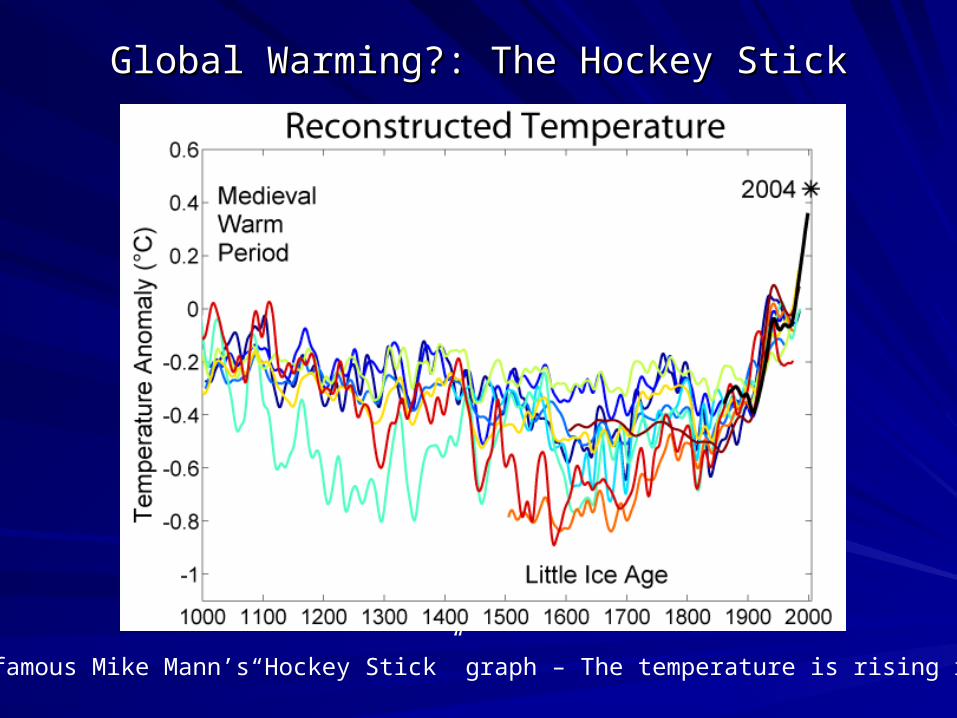
Global Warming?: The Hockey StickGlobal Warming?: The Hockey Stick
The infamous Mike Mann’s“Hockey Stick” graph – The temperature is rising rapidly
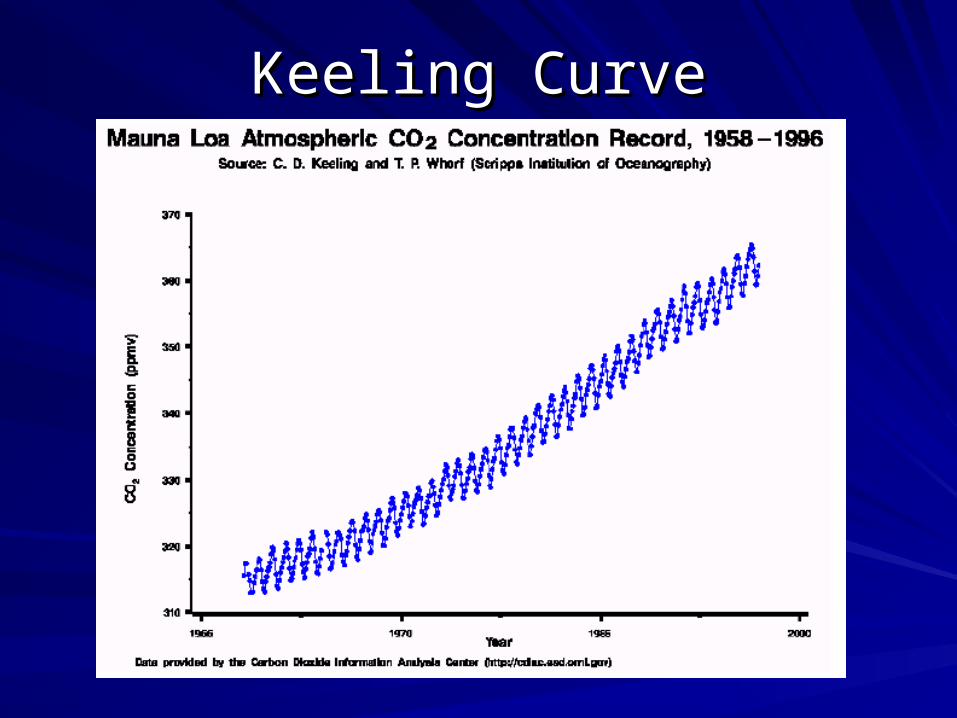
Keeling CurveKeeling Curve


Greenland Ice Core

Coral Reef HypothesisCoral Reef Hypothesis– More reef production when sea level rises More reef production when sea level rises
(warm), increases CO(warm), increases CO2 2 : Positive feedback: Positive feedback
– CaCa2+2+ + 2HCO + 2HCO3 3 CaCOCaCO33 + + COCO22
Fe-fertilization: increased dust during Fe-fertilization: increased dust during glaciation may increase productivity and glaciation may increase productivity and drawdown COdrawdown CO22
BiosphereBiosphere
Why COWhy CO22 increased during interglacials (and increased during interglacials (and
why drop at glacial max.)why drop at glacial max.)
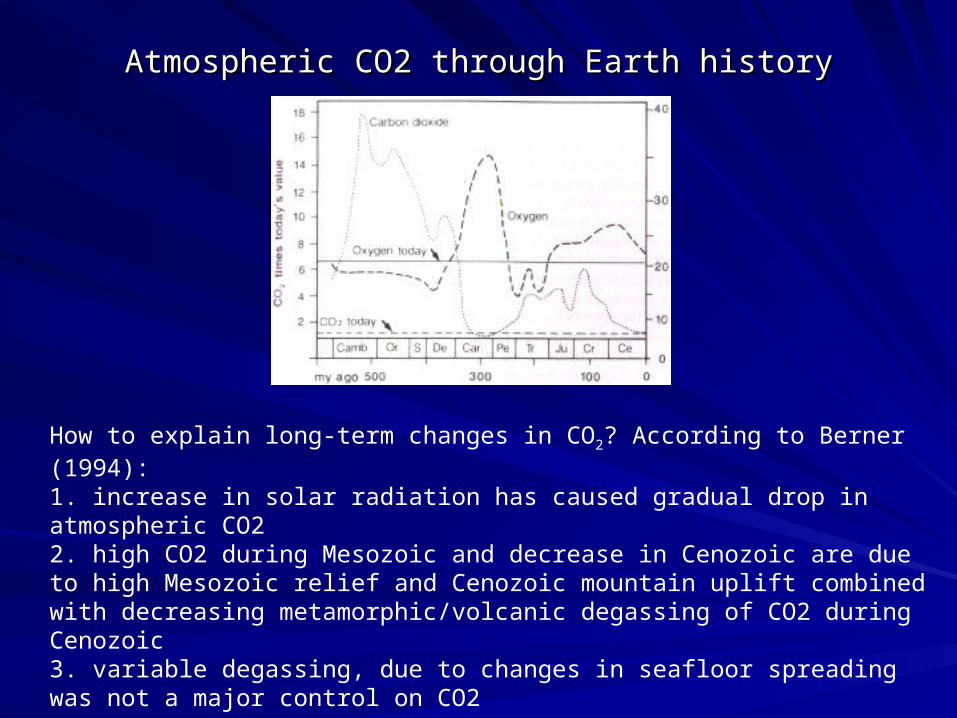
Atmospheric CO2 through Earth historyAtmospheric CO2 through Earth history
How to explain long-term changes in CO2? According to Berner (1994):1. increase in solar radiation has caused gradual drop in atmospheric CO22. high CO2 during Mesozoic and decrease in Cenozoic are due to high Mesozoic relief and Cenozoic mountain uplift combined with decreasing metamorphic/volcanic degassing of CO2 during Cenozoic3. variable degassing, due to changes in seafloor spreading was not a major control on CO2