palaeontologia electronica - palaeo-electronica.org · palaeo-electronica.org 3 counted towards the...
TRANSCRIPT

Palaeontologia Electronica http://palaeo-electronica.org
The distribution of agglutinated foraminifera in NW European seas: Baseline data for the interpretation of fossil assemblages
John W. Murray and Elisabeth Alve
ABSTRACT
Assemblages composed entirely of agglutinated foraminifera occur in a restrictedrange of modern environments: where carbonate dissolution is prevalent, e.g.,marshes, deep shelves or ocean depths below the carbonate compensation depth.Fossil agglutinated assemblages undoubtedly come from a wider range of environ-ments than these modern analogues. Natural post-depositional or diagenetic dissolu-tion of carbonate foraminiferal tests in original dead assemblages (ODAs) leads to theformation of residual agglutinated assemblages. Simulating this process experimen-tally by treating modern ODAs with dilute acid gives rise to acid-treated assemblages(ATAs). This paper provides a synthesis of previous work on 261 samples and providesnew data on a further 87 samples. Investigated environments range from marginalmarine marshes and estuaries through fjord and shelf seas to deep sea. The pattern ofspecies diversity in ATAs follows the same pattern as that for ODAs and living assem-blages: there is a progressive increase in diversity from marginal marine to deep sea.Because agglutinated foraminifera are normally only a small component of ODAs, theATAs provide a much more reliable guide to species and generic distributions.Although the faunal distribution patterns are well defined in terms of broad environ-ment, it has proved difficult to account for individual distributions using the availabledata on abiotic environmental factors. In NW European seas, Miliammina is confined tointertidal to shallow subtidal marginal marine environments but elsewhere it is commonon deep shelves (e.g., off Antarctica). In summary where evolution can not explain theabsence of calcareous taxa, ATAs fill the no-analogue gap and provide baseline datathat can be used to interpret the ecology of fossil agglutinated assemblages.
John W. Murray. School of Ocean and Earth Science, National Oceanography Centre, European Way, Southampton SO14 3ZH, England. [email protected] Alve. Department of Geosciences, University of Oslo, P.O. Box 1047 Blindern, 0316 Oslo, Norway. [email protected]
KEY WORDS: carbonate dissolution; taphonomy; experiments; palaeoecological interpretation; speciesdiversity
PE Article Number: 14.2.14ACopyright: Palaeontological Association July 2011Submission: 29 July 2010. Acceptance: 8 April 2011
Murray, John W. and Alve, Elisabeth 2011. The distribution of agglutinated foraminifera in NW European seas: Baseline data for the interpretation of fossil assemblages. Palaeontologia Electronica Vol. 14, Issue 2; 14A:41p; palaeo-electronica.org/2011_2/248/index.html

MURRAY AND ALVE: AGGLUTINATED FORAMINIFERA
INTRODUCTION
The palaeoecological interpretation of fossilassemblages of agglutinated foraminifera isdependent on comparison with modern analogues.However, modern living and dead assemblageswith exclusively organo- and ferro-agglutinatedwalls (Banner et al. 1991) are found only in envi-ronments where the water is under-saturated incarbonate. In the modern world such conditionsoccur especially on high intertidal marshes and inthe deep sea below the calcite compensationdepth but also occasionally in fjords (Loch Etive,Scotland, Murray et al. 2003) and on deep conti-nental shelves (Larsen shelf, Antarctica, Murrayand Pudsey 2004). However, it is unlikely that allfossil agglutinated assemblages come from thislimited range of modern analogues. This raises twopossibilities regarding fossil agglutinated assem-blages. Alternative 1: they lived in or were predom-inant in a wider range of environments than atpresent (i.e., discrepancy induced by evolution andchanging climate and palaeogeography, e.g., Nagyet al. 2010). Alternative 2: that some of them aresecondary assemblages derived from originalassemblages that included calcareous forms (assuggested by Scott et al. 1983). The primary aim ofthis paper is to fill the no-analogue gap in moderndata by exploring the second alternative. This, inturn, should shed light on the first alternative.
A simple way to approach this problem is tosimulate the natural processes of carbonate disso-lution by experimentally dissolving original deadassemblages (ODAs) to obtain residual acid-treated assemblages (ATAs) from a wide range ofmodern environments. Our studies to date haveshown that ATAs retain a considerable amount ofecological information (see Table 1 for source ref-erences and references with ecological informa-tion). A further advantage of studying ATAs is toprovide much more reliable data on the distributionof agglutinated species; the latter are commonlyheavily outnumbered by calcareous forms inODAs, and consequently it is difficult to obtain astatistically reliable sample. We use dead ratherthan living assemblages because the present studyis not ecologically process-oriented. The assem-blages living at the site at the time of collection areinfluenced by patchiness and seasonality whereasthe time-averaged dead assemblages, eventhough they may include exotic forms, reflect lon-ger-term conditions and the potential fossil assem-blages. The data for agglutinated foraminifera inthis paper are based on >63 μm size fraction for allenvironments except deep sea where >125 μm
was used. These cutoffs should be borne in mind ifthe size fraction used for fossil material is greaterthan the reference information presented hereespecially for species diversity and species abun-dance.
This study is the first to synthesise the distri-bution of agglutinated taxa in environments rangingfrom intertidal, through shelf seas, to deep sea forthe NE Atlantic margin. It includes data on 87 newsamples together with data from work previouslycompleted. In addition, the aims of this study are:
• To establish patterns of species diversityfor ATAs with respect to major environ-ments.
• To compare these ATA species diversitypatterns with the ODAs and also with livepatterns (summarised in Murray 2006).
• To determine the distribution of taxa withrespect to broad environments; to deter-mine ecological controls.
• To determine the role of local transport inmodifying agglutinated assemblages.
MATERIAL AND METHODS
Altogether 348 samples are considered (Table1). The majority (261) are from our previous stud-ies (Figure 1). In addition, there are 55 new sam-ples from southern England temperate brackishestuaries with bordering marshes (Christchurchand Poole Harbours, Beaulieu, Exe and Hambleestuaries), 25 from Norwegian fjords (shallow, 35-150 m: outer Lyngdalsfjord, Frierfjord, and Kragerøbasin and outer Oslofjord; deeper than 400 m: Sør-fjord, Hardangerfjord), four from the Skagerrak andthree from the continental shelf Muck and Stantondeeps off Scotland (shelf deeps). All samples, rep-resenting the surface 1 or 2 cm of sediment, werestained with rose Bengal. In each case the >63µmliving (stained), ODA and ATAs have been studiedseparately. The aim of acid treatment is to make iteasier to pick sufficient agglutinated tests byremoving the calcareous forms. The ATAs wereprepared by dissolution in dilute acetic acid (pH2.0-2.5). In the case of the deep fjord samples, theODAs were rich in agglutinated tests so acid treat-ment was not necessary as sufficient tests couldreadily be picked. For consistency with the ODAdata, ATA assemblages comprise dead tests only.
Tubular tests were not counted because theyfragment during sampling and processing and giveunreliable numbers. In some cases the multiloculartest readily breaks into fragments (e.g., Reophaxmoniliformis, Hormosinella guttifer) so only thoseindividuals with three or more chambers were
2
PALAEO-ELECTRONICA.ORG
counted towards the ATAs (following the practise ofMurray and Alve 1999a).
Environmental data have been compiled fromthe sources listed in Table 1. In addition, the seafloor flux of organic matter has been calculated forshelf seas and the deep sea (see below). For shelfseas, all samples are from beneath areas of sum-mer thermocline except for four samples from thesouthern North Sea (#3445, #3446, #3454,#3456). Fjords commonly have an estuarine watercirculation but are distinguished from e.g., Britishestuaries by their silled basins, water stratificationand sometimes by the presence of low oxygen oranoxic bottom waters. The examples here are allfrom oxic bottom water conditions.
Non-metric Multi-dimensional Scaling (MDS),principal component analysis, and species diver-sity calculations have been performed using Primerv.6.1.6 (Clarke and Gorley 2006). The MDS tech-nique plots samples in two-dimensional space‘such that the relative distances apart of all pointsare in the same rank order as the relative dissimi-larities (or distances) of the samples, as measuredby some appropriate resemblance matrix calcu-lated on the (possibly transformed) data matrix.’(Clarke and Gorley 2006, p. 75). For MDS the fau-nal data were transformed using square root andresemblances calculated using the Bray Curtismethod. For the multivariate analysis (principalcomponent analysis and MDS) of the abiotic fac-
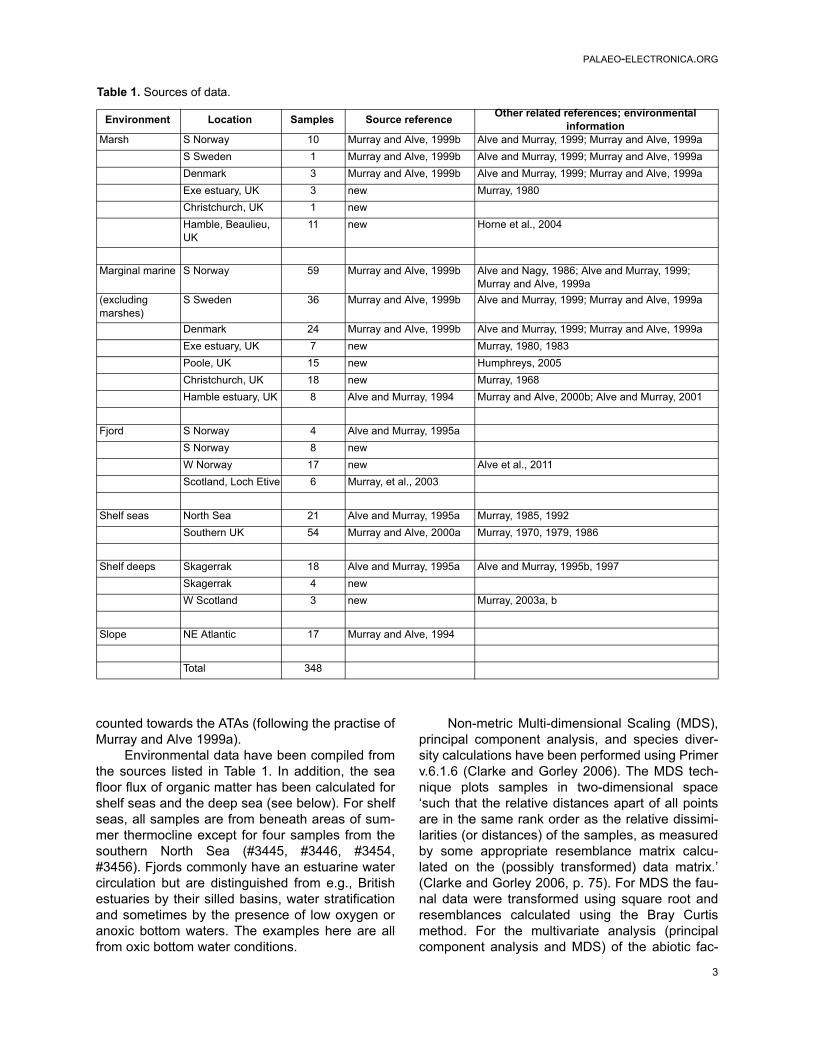
Table 1. Sources of data.
Environment Location Samples Source referenceOther related references; environmental
informationMarsh S Norway 10 Murray and Alve, 1999b Alve and Murray, 1999; Murray and Alve, 1999a
S Sweden 1 Murray and Alve, 1999b Alve and Murray, 1999; Murray and Alve, 1999a
Denmark 3 Murray and Alve, 1999b Alve and Murray, 1999; Murray and Alve, 1999a
Exe estuary, UK 3 new Murray, 1980
Christchurch, UK 1 new
Hamble, Beaulieu, UK
11 new Horne et al., 2004
Marginal marine S Norway 59 Murray and Alve, 1999b Alve and Nagy, 1986; Alve and Murray, 1999; Murray and Alve, 1999a
(excluding marshes)
S Sweden 36 Murray and Alve, 1999b Alve and Murray, 1999; Murray and Alve, 1999a
Denmark 24 Murray and Alve, 1999b Alve and Murray, 1999; Murray and Alve, 1999a
Exe estuary, UK 7 new Murray, 1980, 1983
Poole, UK 15 new Humphreys, 2005
Christchurch, UK 18 new Murray, 1968
Hamble estuary, UK 8 Alve and Murray, 1994 Murray and Alve, 2000b; Alve and Murray, 2001
Fjord S Norway 4 Alve and Murray, 1995a
S Norway 8 new
W Norway 17 new Alve et al., 2011
Scotland, Loch Etive 6 Murray, et al., 2003
Shelf seas North Sea 21 Alve and Murray, 1995a Murray, 1985, 1992
Southern UK 54 Murray and Alve, 2000a Murray, 1970, 1979, 1986
Shelf deeps Skagerrak 18 Alve and Murray, 1995a Alve and Murray, 1995b, 1997
Skagerrak 4 new
W Scotland 3 new Murray, 2003a, b
Slope NE Atlantic 17 Murray and Alve, 1994
Total 348
3

MURRAY AND ALVE: AGGLUTINATED FORAMINIFERA
tors plus sea floor organic flux the data were norm-alised prior to analysis. Species diversities havebeen calculated using Fisher alpha (Fisher et al.1943 and the information function, H(S) (=H’(ln)),(Shannon 1948; Hayek and Buzas 1997).
Figure 1 was prepared from www.aquar-ius.ifm-geomar.de. Coloured images of specieswere taken using AxioVision Release 4.7.2 at theNatural History Museum, London. For each speci-men, successive images were taken at differentfocal depths from the highest level downwards.These images were then merged using Auto-Mon-tage 4.0 to give the sharpest image. The systemworks best on larger individuals, and it is difficult toachieve really sharp images of very small individu-als. However, the results are images that show thenatural colour and texture of the tests (although afew, such as Miliammina fusca, which was previ-ously coated in gold, look more yellow than nor-
mal). The figures were compiled using AdobePhotoshop CS4. Some images show specimensstained with rose Bengal but such individuals werenot included in the assemblage counts (based ondead only).
Sea Floor Organic Flux
Data on the average sea surface primary pro-duction per day are now available from satelliteimagery (NEODASS) and from these data theannual rate is readily calculated. Primary produc-tion by plankton in the surface waters of the oceanand marginal seas is consumed by organisms asfood or by bacterial decay during its descentthrough the water column. The amount of organiccarbon that reaches the sea floor is termed the seafloor organic flux (Kaminski et al. 1999). In a clas-sic study of the relationships between primary andexport production, Berger et al. (1988) discussedprevious attempts to quantify the downward flux of
R
12
3
4
5
K
A
BC
DE F
G
H
I
J
L
MN
0
P
Q
S
TU
V
FIGURE 1. Map of the study area with localities. A. Hardangerfjord, B. Lyngdalsfjord, C. Isefærfjord; Kvastadkilen;Dype Holla, Lyngør; Tøkersfjord, Lyngør; Hasdalen; Kilsfjord, D. Kragerøfjord, E. Tjøme; Borre; Horten; Sandebukta,F. Bunnefjord; Hunnebotn, G. Hålkedalskilen; Tjärnö; Finnsbobukten; Gullmarsvik; Hafstensfjord, H. Kungsbackafjord,I. Jonstorp, J. Kildehuse; Kalundborg, K. Vejle Fjord; Havhuse (Kalø Vig); Vosnæs Pynt, (Kalø Vig), L. Løgstør; Val-sted; Frederikshavn, M. Skagerrak, N. Forties, O. Ekofisk, P. Southern North Sea, Q. Hamble; Beaulieu; Christchurch;Poole; Exe, R. Channel, S. Celtic Sea, T. Loch Etive, U. Muck and Stanton Deeps, Scotland, V. NE Atlantic (only par-tially shown - see Murray and Alve 1994 for details).
4

PALAEO-ELECTRONICA.ORG
organic material and proposed various equationsfor its calculation at different water depths. Theyalso concluded that the coastal regions of theoceans and sub-polar regions account for 50% ofthe total production and more than 80% of the fluxof organic material to the sea floor. Altenbach et al.(1999) used Berger et al. equation 12 in their cal-culations of flux rates (F) for the eastern AtlanticOcean. The factors are water depth in m (labelled zby Berger and D by Altenbach) and annual primaryproduction (PP) as g Corg m-2 yr-1. Equation 12 is:
F(D)=9PP/D + 0.7PP/D0.5. An alternative equation(11) for shallower waters is J(z)=6.3*PP/z0.8. How-ever, the results differ by only 2-3% for waterdepths down to 200 m so, in the present study,equation 12 has been used throughout to calculatethe Corg flux to the sea floor at investigated sites. Incoastal areas the presence of suspended sedimentcauses the determination of PP to be less accurateso satellite data for these areas (A-L, Figure 1)have not been included. An example of this isfound in Tilstone et al. (2005).
Data on average daily sea surface primaryproduction are available for the years 1998 to2005. For the shelf sea areas away from the influ-ence of suspended sediment there is remarkablylittle variation in the pattern of values from one yearto another. The 2005 data were used for this study.Rather than calculate the values for each precisedata point a general value has been taken for eachmain area, shelf sea (M-V, Figure 1: North Sea For-ties and Ekofisk, Skagerrak, outer Celtic Sea, Scot-land shelf deeps all 146 g Corg m-2 yr-1; central
Celtic Sea 219 g Corg m-2 yr-1) and for the deep sea
(73 g Corg m-2 yr-1). However, for each sample thesea floor organic flux has been determined accord-ing to water depth using equation 12 as notedabove. This general approach to determining seafloor organic flux is justified because the foramin-iferal data represent an average of decades of for-aminiferal accumulation so there is no point inmaking comparisons with a precise value based ona single observation of the sampling spot.
Although the primary production of coastalareas cannot be reliably determined due to themasking effects of suspended sediment, in suchareas the main food source for benthic foraminiferais likely to be the benthic flora of diatoms, bacteriaand cyanobacteria together with organic detritusderived from marine or terrestrial plants or degra-dation products. Whereas in shelf seas and deepsea areas the most variable environmental param-eter is likely to be the sea floor organic flux, in shal-
low waters there is greater variation in abioticfactors such as temperature, salinity and energyfrom waves and/or water currents.
Taxonomy
Where necessary we have revised the taxon-omy of our previous studies. Type material wasexamined in the Natural History Museum, London,and reference examples of ‘Labrospira jeffreysii’(Williamson) and Trochamminella bullata Höglundwere provided from the Höglund Collection in Aar-hus University, Denmark. Altogether, there are 92named aggulinated species. Notes on individualtaxa are given in the taxonomic list.
RESULTS
The entire data set including both previouslypublished and new samples are in Appendix 1 and2.
Species Diversity
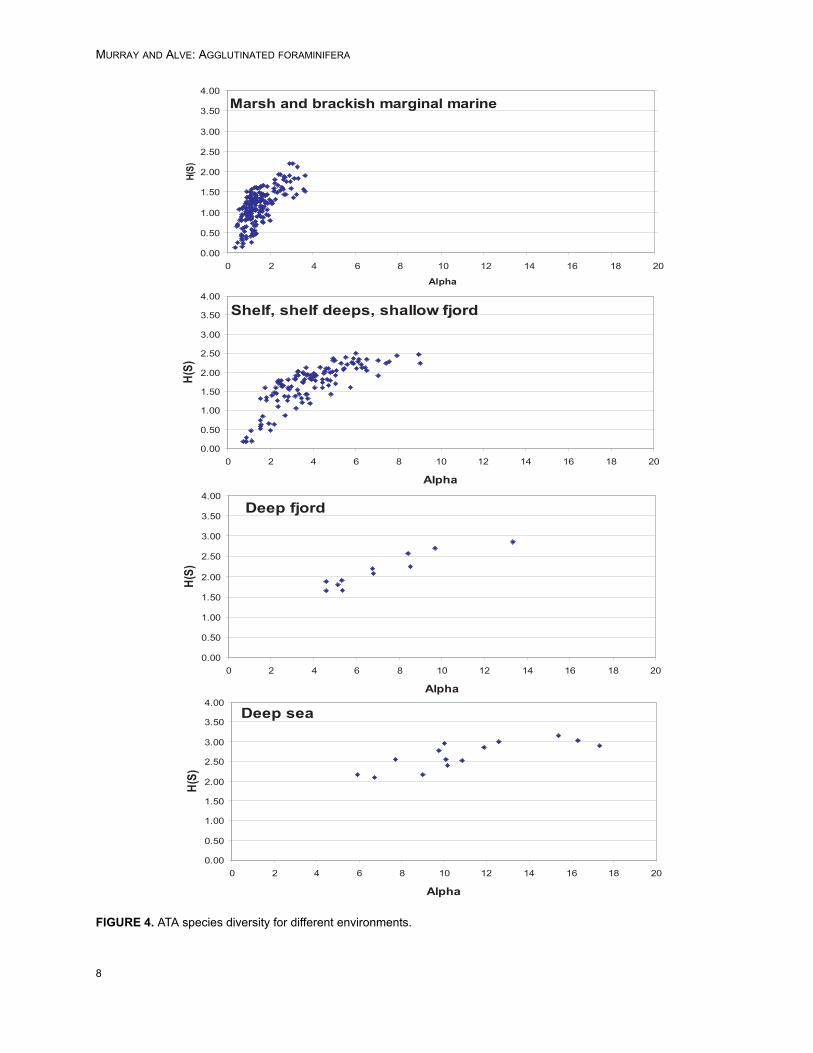
Plots of Fisher alpha against H(S) are similarfor ATAs and ODAs although the range is some-what extended for the latter (Figure 2). There is asignificant positive linear correlation between theATAs and ODAs for both diversity indices but thecorrelation is stronger for Fisher alpha (R2 = 0.778)than for the information function (R2 = 0.485, Fig-ure 3). There is a progression from low diversity inmarsh and marginal marine, through shelf seas,shallow fjord, shelf deeps and Skagerrak, deepfjord >500 m and deep sea (Figure 4). See Table 2for the distribution of diversity values for each envi-ronment together with the mean and standard devi-ation. Overall, there is an increase in diversity withwater depth: deeper than 500 m alpha is >5.Deeper than100 m H(S) rarely goes below 1.0.
Non-metric Multi-dimensional Scaling (MDS)
Samples that plot close together have similarfaunal composition; those that plot far apart are dif-ferent. Because the faunas of marginal marinemarshes and estuaries are fundamentally distinctfrom those of the shelves, we have presented MDSof these data as separate plots (Figures 5, 6).
Marsh and estuary. When individual geographicareas are plotted separately there is varyingdegree of overlap (indicating local differences) ofthe estuaries (Exe, Christchurch, Poole, Hamble inEngland; shallow waters around Oslofjord, Katte-gat and Skagerrak in Norway, Denmark and Swe-den) and relatively little overlap with the field formarshes. The overall picture becomes even
5

MURRAY AND ALVE: AGGLUTINATED FORAMINIFERA
clearer when the data are plotted as marsh (M),estuary <3 m deep (E) and >3m deep (E*) (Figure5). This is a reflection of the fact that many of themarsh taxa are confined to marsh habitats.
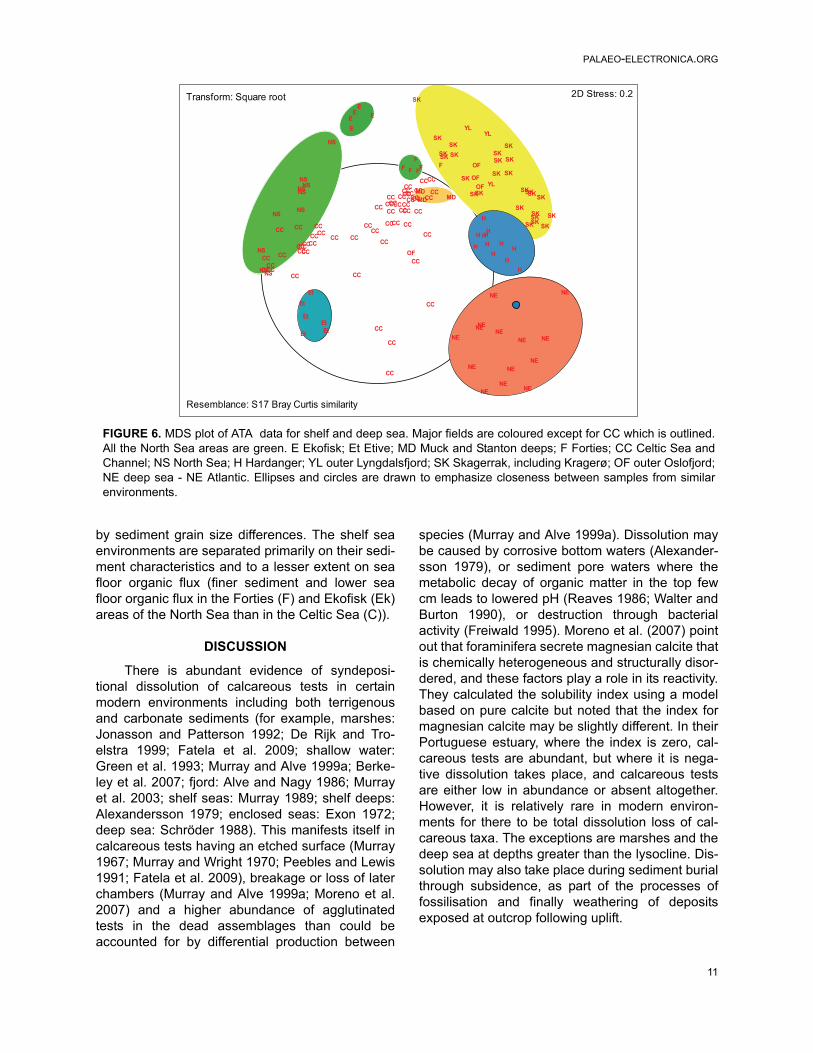
Shelf seas to deep sea (Figure 6). Overall, theATA faunal composition of the main study areasare reasonably distinct although there is someoverlap with the Channel/Celtic Sea (CC), thesouthern North Sea (NS) and the Scottish shelfdeeps (MD). The Skagerrak field (SK) includesouter Oslofjord (OF) and outer Lyngdalsfjord (YL).Loch Etive (Et) is more closely similar to the UKshelf seas than the deep Hardangerfjord (H). Thelatter lies between SK and the deep sea (NE) withone sample overlapping the latter.
Depth Distributions of Species
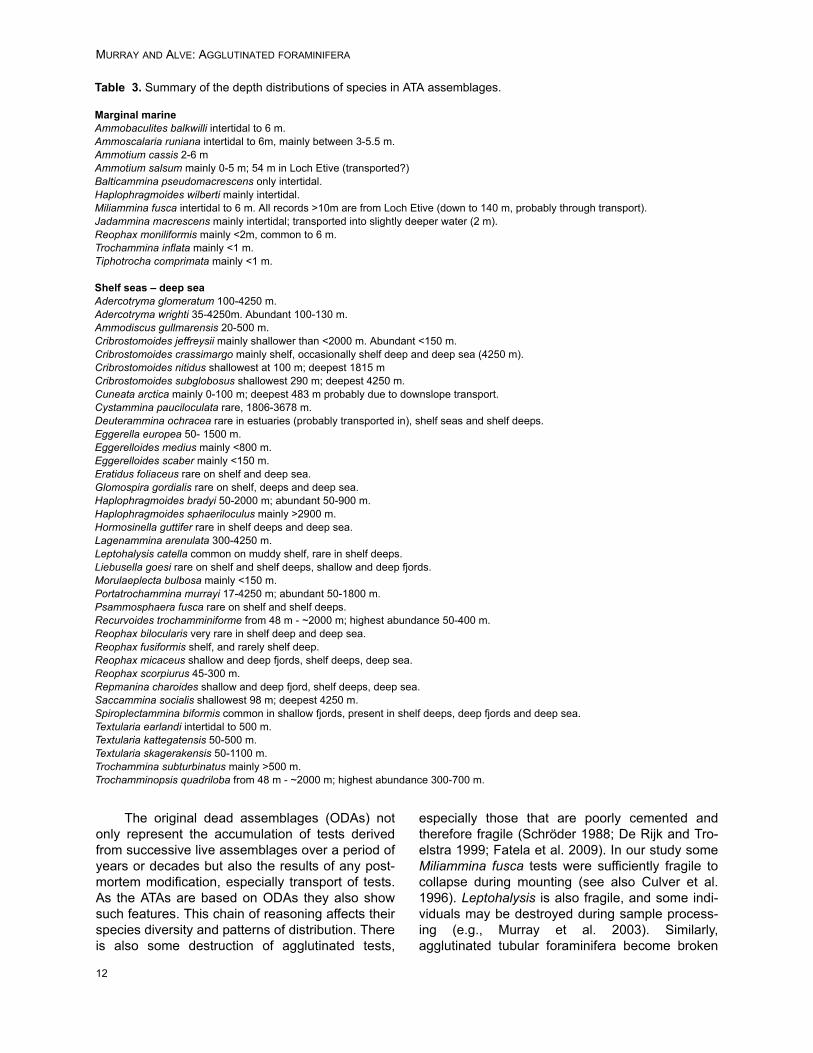
Because our data set extends from intertidalto deep sea (4250 m) we have been able to deter-mine the depth distributions of species (ranges)within those extremes. These are summarised inTable 3. There is a progressive change in faunalcomposition with increasing depth but there are noobvious depth-related boundaries. However, thereare some differences in relative abundance in thevarious environments. For instance, Adercotrymawrighti reaches abundances of nearly 60% on shelfseas at depths of 100-130 m whereas in Hardan-gerfjord and the deep sea it never exceeds 16%.
Distribution by Environment and Geography
The distribution patterns are presented byenvironment (Figure 7, species; Figure 8, genera)
Diversity ATA
0.0
0.5
1.0
1.5
2.0
2.5
3.0
3.5
4.0
0 5 10 15 20 25 30 35 40
Alpha
H(S)
Diversity ODA
0.0
0.5
1.0
1.5
2.0
2.5
3.0
3.5
4.0
0 5 10 15 20 25 30 35 40
Alpha
H(S)
FIGURE 2. Species diversity of ATAs and ODAs.
6

PALAEO-ELECTRONICA.ORG
and by geography (Figure 9). The shallow waterareas (<6 m) around Oslofjord, Skagerrak and Kat-tegat are treated as marginal marine (estuarine)here as they are brackish.
There is a clear progression of species frommarsh to deep sea (Figure 7.2). Typical marsh spe-cies such as Jadammina macrescens and Troc-hammina inflata also occur in adjacent non-
vegetated intertidal flats. Likewise, some intertidaltaxa are present in low abundance on marshes.The faunas of shelf seas, shelf deeps and shallowfjord (Etive) have much in common. Those of thedeep Hardangerfjord overlap the shelf seas anddeep seas. The pattern for genera is somewhat dif-ferent (Figure 8) because some span a broadspectrum of environments (e.g., Haplophrag-
alpha
R² = 0.778 0
5
10
15
20
25
30
35
40
0 5 10 15 20 ATA
ODA
n=348
H(S)
R² = 0.485
0.0
0.5
1.0
1.5
2.0
2.5
3.0
3.5
4.0
0.0 0.5 1.0 1.5 2.0 2.5 3.0 3.5 4.0
ATA
ODA
n=348
FIGURE 3. Correlation of alpha and correlation of H(S) for ATAs and ODAs.
7
MURRAY AND ALVE: AGGLUTINATED FORAMINIFERA
8
Marsh and brackish marginal marine
0.00
0.50
1.00
1.50
2.00
2.50
3.00
3.50
4.00
0 2 4 6 8 10 12 14 16 18 20
Alpha
H(S)
Shelf, shelf deeps, shallow fjord
0.00
0.50
1.00
1.50
2.00
2.50
3.00
3.50
4.00
0 2 4 6 8 10 12 14 16 18 20
Alpha
H(S)
Deep fjord
0.00
0.50
1.00
1.50
2.00
2.50
3.00
3.50
4.00
0 2 4 6 8 10 12 14 16 18 20
Alpha
H(S)
Deep sea
0.00
0.50
1.00
1.50
2.00
2.50
3.00
3.50
4.00
0 2 4 6 8 10 12 14 16 18 20
Alpha
H(S)
FIGURE 4. ATA species diversity for different environments.

PALAEO-ELECTRONICA.ORG
moides, Reophax, Cribrostomoides, Adercotryma,Eggerelloides, Portatrochammina). Superimposedon the environmental controls on distribution thereis also a geographical component. Although most
species are found throughout the geographicrange of their environment (Figure 9) some aremore restricted. For instance, the marsh speciesTiphotrocha comprimata is confined to Norway and
Values >10%
>500 mFisher Brackish Lagoons, Fjord Shelf Shelf Deep Deep alpha marsh estuaries seas deeps fjord sean 29 167 18 75 25 8 16mean 1.03 1.51 4.71 3.22 5.30 8.01 11.186st. dev. 0.53 0.69 2.13 1.38 1.49 2.64 3.25
% % % % % % %<1 66 18 51.1-2.0 24 64 6 162.1-3.0 10 13 33 233.1-4.0 5 6 29 244.1-5.0 11 17 245.1-6.0 17 6 20 25 66.1-7.0 11 3 16 25 67.1-8.0 6 1 128.1-9.0 1 25 69.1-10.0 6 12 1810.1-11.0 1811.1-12.0 612.1-13.0 1813.1-14.0 1214.1-15.015.1-16.0 616.1-17.0 617.1-18.0 6
>500 mInformation Brackish Lagoons, Fjord Shelf Shelf Deep Deep function marsh estuaries seas deeps fjord sean 29 167 18 75 25 8 16mean 1.00 1.18 1.83 1.50 2.03 2.28 2.66st. dev. 0.37 0.41 0.54 0.56 0.34 0.41 0.43
% % % % % % %<0.50 14 8 90.51-1.0 21 23 6 91.01-1.50 65 48 28 16 161.51-2.0 19 11 56 12 252.01-2.5 2 50 9 72 38 252.51-3.0 6 38 623.01-3.5 12
Alpha for live assemblages *mean 1.1 1.7 2.4 8.6 7.6 12.3st. dev. 0.7 1 1.9 4.9 1.92 6.2H(S) for live assemblages *mean 1.10 1.08 1.39 2.37 2.30 2.68st. dev. 0.49 0.47 0.58 0.63 0.38 0.64
Marginal marine
Marginal marine
Table 2. Summary of diversity values for ATAs. The comparative data on living assemblages are from Murray (2006,Table 8.1) and * Alve et al. 2011.
9

MURRAY AND ALVE: AGGLUTINATED FORAMINIFERA
Balticammina pseudomacrescens has yet to befound in the marshes of Sweden and Denmark.Ammotium cassis is absent from Britain. Liebusellagoesi is rare in shelf seas and most abundant indeeper water (Norwegian fjords, Skagerrak andshelf deeps off Scotland) but not on the continentalslope.
Controls on Distribution Patterns
As many data as possible have been gath-ered on environmental parameters. This includesour own measurements made at the time of sam-pling and data from the literature (Appendix 1 and2). Unfortunately, there is not a complete environ-mental data set for every sample. Data on maxi-mum bottom water temperatures are morecomplete than those on minimum values and this istrue also for salinity. As noted above, the sea floororganic flux is calculated from satellite imagery inthose areas away from the coast where suspendedsediment is minimal or absent. Nevertheless, someuseful conclusions can be drawn about the rela-tionships between environmental parameters andthe foraminiferal assemblages.
Principal component analysis and MDS plotsof marsh and shallow water environments (Appen-
dix 1, marginal marine; Figures 10, 11) show alarge scatter of points with marsh samples occupy-ing a distinct field which slightly overlaps that of therest of the samples and which seems primarilydetermined by water depth. Otherwise, there areno clear correlations between different geographicareas and the environmental variables.
For shelf seas, down to about 300 m, the Corg
shows a wide range of 8-38 g Corg m-2 yr-1 whichnarrows to 6-23 and 2.7-5.2, respectively, for shelfdeeps and deep fjord, and to 0.9-2.1 g Corg m-2 yr-
1 in the deep sea (Figure 12). There is a positivelinear correlation between water depth and maxi-mum temperature (R2 = 0.5051) and hencebetween sea floor organic flux and maximum tem-perature (R2 = 0.5819), and a weak positive corre-lation between sea floor organic flux and sedimentgrain size (R2 = 0.2953). Multivariate analysis ofthe abiotic factors plus sea floor organic flux showsa clear pattern (Figure 13). The vectors for theenvironmental parameters on the PCA plot showthat the primary control on the deep sea (D),Skagerrak (SK) and Hardangerfjord (H) is a combi-nation of water depth and maximum temperature.These areas are also separated from one another
Transform: Square root
Resemblance: S17 Bray Curtis similarity
MM
M M
M
M M
M
MM
MM
MM
M
MM
MM
M
MM
M
M
M
M
MM
M E
E
E
E*
E*E*
EEE
E*
E*E*
E
E*
E
EE
EEE*E*E*E*
EEE
EE EE E*E*
E*E*
E EEE
EE*
E E
E
E E
E*
E*E
E
E
E*
EE
E
E
E
EE
E
E
E
EE
EEEE*E*E*
E EEE
EEE E
EE
E
E*E*
EE
EEEEEE
EE E
E
E
EE
E*
E*
EE
E EEE
E* E*E* E*
E
EE*
E
E*E* E*
EEE
E
E
E
EE
E
E
E
E
E
E
E
E
E
E
EE
E
E
E
E
E
EE E
EE
E
E
E
EEE
E
E*
E*
EEE
E
E
E
EE
EE*
E* E*
2D Stress: 0.2
FIGURE 5. MDS plot of ATA data for marginal marine environments. M = marsh (green ellipse), E = estuary 0-3 mdeep (uncoloured ellipse), E* = estuary >3 m deep (yellow ellipse). Ellipses are drawn to emphasize closenessbetween samples from similar environments.
10
PALAEO-ELECTRONICA.ORG
by sediment grain size differences. The shelf seaenvironments are separated primarily on their sedi-ment characteristics and to a lesser extent on seafloor organic flux (finer sediment and lower seafloor organic flux in the Forties (F) and Ekofisk (Ek)areas of the North Sea than in the Celtic Sea (C)).
DISCUSSION
There is abundant evidence of syndeposi-tional dissolution of calcareous tests in certainmodern environments including both terrigenousand carbonate sediments (for example, marshes:Jonasson and Patterson 1992; De Rijk and Tro-elstra 1999; Fatela et al. 2009; shallow water:Green et al. 1993; Murray and Alve 1999a; Berke-ley et al. 2007; fjord: Alve and Nagy 1986; Murrayet al. 2003; shelf seas: Murray 1989; shelf deeps:Alexandersson 1979; enclosed seas: Exon 1972;deep sea: Schröder 1988). This manifests itself incalcareous tests having an etched surface (Murray1967; Murray and Wright 1970; Peebles and Lewis1991; Fatela et al. 2009), breakage or loss of laterchambers (Murray and Alve 1999a; Moreno et al.2007) and a higher abundance of agglutinatedtests in the dead assemblages than could beaccounted for by differential production between
species (Murray and Alve 1999a). Dissolution maybe caused by corrosive bottom waters (Alexander-sson 1979), or sediment pore waters where themetabolic decay of organic matter in the top fewcm leads to lowered pH (Reaves 1986; Walter andBurton 1990), or destruction through bacterialactivity (Freiwald 1995). Moreno et al. (2007) pointout that foraminifera secrete magnesian calcite thatis chemically heterogeneous and structurally disor-dered, and these factors play a role in its reactivity.They calculated the solubility index using a modelbased on pure calcite but noted that the index formagnesian calcite may be slightly different. In theirPortuguese estuary, where the index is zero, cal-careous tests are abundant, but where it is nega-tive dissolution takes place, and calcareous testsare either low in abundance or absent altogether.However, it is relatively rare in modern environ-ments for there to be total dissolution loss of cal-careous taxa. The exceptions are marshes and thedeep sea at depths greater than the lysocline. Dis-solution may also take place during sediment burialthrough subsidence, as part of the processes offossilisation and finally weathering of depositsexposed at outcrop following uplift.
Transform: Square root
Resemblance: S17 Bray Curtis similarity
EtEt
Et
Et
Et
Et
YL
YL
YL
H
HHHH
H
H
H
HH
H
H
H
OF
OF
OF
OF
SK
SK
SKSK
NS
NS
NSNS
NS
NS
NS
NS
NSNS
F FFF
F
F
E
EE EE
CC
CC
CC
CC CC
CC
CCCCCC
CC
CC
CC
CCCC
CC
CC
CCCC
CCCC
CC
CC
CCCC
CC
CC
CC
CC
CC
CC
CC
CC
CC
CC
CC
CCCCCC CC
CCCC
CC
CC
CCCCCC
CC
CC
CC
CCCC
CC
CCCC
MDMD MD
SKSK
SK
SK
SK
SK
SK
SK
SK
SKSK
SK
SK
SK
SK
SK
SK
SK
SK
SK
SK
SK
NE
NE
NE
NE
NE NE
CC
NE
NE
NE
NE
NE
NENE NE
2D Stress: 0.2
FIGURE 6. MDS plot of ATA data for shelf and deep sea. Major fields are coloured except for CC which is outlined.All the North Sea areas are green. E Ekofisk; Et Etive; MD Muck and Stanton deeps; F Forties; CC Celtic Sea andChannel; NS North Sea; H Hardanger; YL outer Lyngdalsfjord; SK Skagerrak, including Kragerø; OF outer Oslofjord;NE deep sea - NE Atlantic. Ellipses and circles are drawn to emphasize closeness between samples from similarenvironments.
11
MURRAY AND ALVE: AGGLUTINATED FORAMINIFERA
The original dead assemblages (ODAs) notonly represent the accumulation of tests derivedfrom successive live assemblages over a period ofyears or decades but also the results of any post-mortem modification, especially transport of tests.As the ATAs are based on ODAs they also showsuch features. This chain of reasoning affects theirspecies diversity and patterns of distribution. Thereis also some destruction of agglutinated tests,
especially those that are poorly cemented andtherefore fragile (Schröder 1988; De Rijk and Tro-elstra 1999; Fatela et al. 2009). In our study someMiliammina fusca tests were sufficiently fragile tocollapse during mounting (see also Culver et al.1996). Leptohalysis is also fragile, and some indi-viduals may be destroyed during sample process-ing (e.g., Murray et al. 2003). Similarly,agglutinated tubular foraminifera become broken
Table 3. Summary of the depth distributions of species in ATA assemblages.
Marginal marineAmmobaculites balkwilli intertidal to 6 m.Ammoscalaria runiana intertidal to 6m, mainly between 3-5.5 m.Ammotium cassis 2-6 mAmmotium salsum mainly 0-5 m; 54 m in Loch Etive (transported?)Balticammina pseudomacrescens only intertidal.Haplophragmoides wilberti mainly intertidal.Miliammina fusca intertidal to 6 m. All records >10m are from Loch Etive (down to 140 m, probably through transport). Jadammina macrescens mainly intertidal; transported into slightly deeper water (2 m).Reophax moniliformis mainly <2m, common to 6 m.Trochammina inflata mainly <1 m.Tiphotrocha comprimata mainly <1 m.
Shelf seas – deep seaAdercotryma glomeratum 100-4250 m.Adercotryma wrighti 35-4250m. Abundant 100-130 m.Ammodiscus gullmarensis 20-500 m.Cribrostomoides jeffreysii mainly shallower than <2000 m. Abundant <150 m.Cribrostomoides crassimargo mainly shelf, occasionally shelf deep and deep sea (4250 m).Cribrostomoides nitidus shallowest at 100 m; deepest 1815 mCribrostomoides subglobosus shallowest 290 m; deepest 4250 m.Cuneata arctica mainly 0-100 m; deepest 483 m probably due to downslope transport.Cystammina pauciloculata rare, 1806-3678 m.Deuterammina ochracea rare in estuaries (probably transported in), shelf seas and shelf deeps.Eggerella europea 50- 1500 m.Eggerelloides medius mainly <800 m.Eggerelloides scaber mainly <150 m. Eratidus foliaceus rare on shelf and deep sea. Glomospira gordialis rare on shelf, deeps and deep sea.Haplophragmoides bradyi 50-2000 m; abundant 50-900 m.Haplophragmoides sphaeriloculus mainly >2900 m.Hormosinella guttifer rare in shelf deeps and deep sea.Lagenammina arenulata 300-4250 m.Leptohalysis catella common on muddy shelf, rare in shelf deeps.Liebusella goesi rare on shelf and shelf deeps, shallow and deep fjords.Morulaeplecta bulbosa mainly <150 m.Portatrochammina murrayi 17-4250 m; abundant 50-1800 m.Psammosphaera fusca rare on shelf and shelf deeps.Recurvoides trochamminiforme from 48 m - ~2000 m; highest abundance 50-400 m.Reophax bilocularis very rare in shelf deep and deep sea.Reophax fusiformis shelf, and rarely shelf deep.Reophax micaceus shallow and deep fjords, shelf deeps, deep sea.Reophax scorpiurus 45-300 m.Repmanina charoides shallow and deep fjord, shelf deeps, deep sea.Saccammina socialis shallowest 98 m; deepest 4250 m.Spiroplectammina biformis common in shallow fjords, present in shelf deeps, deep fjords and deep sea.Textularia earlandi intertidal to 500 m.Textularia kattegatensis 50-500 m.Textularia skagerakensis 50-1100 m.Trochammina subturbinatus mainly >500 m.Trochamminopsis quadriloba from 48 m - ~2000 m; highest abundance 300-700 m.
12

PALAEO-ELECTRONICA.ORG
during sample collection and processing; we havetherefore excluded them from assemblage counts.In arctic fjords, shelf seas and deep sea, earlydiagenesis destroys many agglutinated tests (Bar-mawidjaja et al. 1992; Majewski and Zajączkowski2007; Hald and Steinsund 1996; Wollenburg andKuhnt 2000). According to Schröder (1988)Reophax scorpiurus is considered to have low fos-silisation potential while Hormosinella distans,Eratidus foliaceus, Psammosphaera fusca, Glomo-spira gordialis, Ammolagena clavata, Karreriellaapicularis, Nodellum membranaceum, Ammobacu-lites filiformis, Haplophragmoides sphaeriloculus,Cribrostomoides subglobosus and Adercotrymaglomeratum show progressively greater preserva-tion potential. However, Kuhnt et al. (2000) dis-agreed with Schröder’s conclusions as theyconsider habitat preference to be equal in impor-tance to wall structure. They point out that manyCretaceous and Palaeogene deep-sea aggluti-nated assemblages are formed of small infaunaltaxa. Increased preservation in coastal settingswhere relatively high sediment accumulation ratescause rapid burial below the redox cline in the sed-iment seem to promote preservation of aggluti-nated forms as it slows down organic matterdegradation (discussion in e.g., Alve 1996; Berke-ley et al. 2007).
Species Diversity
Our first study showed that deep sea ATAs,like the ODAs from which they were drawn, havehigh diversity (Murray and Alve 1994). Our subse-quent studies in a wide range of environmentshave confirmed that ATAs provide much informa-tion on species diversity even when only a fewagglutinated individuals are recorded in the ODA.The progressive increase in species diversity ofATAs from low in marginal marine environments tohigh in the deep sea (Figure 2, Table 2) is compa-rable with that both of ODAs (Figure 2) and livingassemblages (see Murray 2006, figure 8.4.). Ofcourse, the fields differ to some degree and therange of species diversity in ODAs is greater notonly than that of the ATAs but also that of the livingassemblages from which they were drawn. Theconsequences are apparent from the statistics: themeans and standard deviations of alpha and H(S)are comparable (Table 2, N.B. shelf deeps wereincluded with shelves by Murray 2006).
Modern calcareous forms have three basicwall structures: calc-agglutinated, porcelaneous,hyaline. We pose the question: do any of the cal-careous groups mimic the diversity pattern of the
whole assemblages? It is unlikely that this wouldbe true of calc-agglutinated or porcelaneous formsas both are restricted to a limited range of environ-ments, the former to normal marine shelf seas andupper bathyal, and the latter mainly to shallowwater normal marine or hypersaline environments– elsewhere they are rare. Since the majority oftaxa in most modern environments have hyalinewalls (Murray 2006) it follows that they are highlylikely to mimic the diversity of the whole assem-blage.
These observations are important from apractical point of view. If the non-calcareous agglu-tinated and hyaline components of an assemblageboth individually mimic the diversity of the wholeassemblage then a study carried out on just one orthe other subset in fossil material should suffice togive enough diversity information to help determinethe original environment.
Distribution Patterns
Unlike calcareous foraminifera, agglutinatedforms occupy the full range of brackish/marine/hypersaline environments, from almost supratidalto the deepest ocean. However, with the exceptionof marshes, agglutinated foraminifera are minorelements of most modern foraminiferal assem-blages. The limited literature giving details ofagglutinated species ecology is summarised in theTaxonomic notes and comments on species ecol-ogy listed below.
In this study, the MDS plots show the similari-ties and differences between the various environ-ments. Because marshes have a distinct faunathey are readily separated from the adjacent non-vegetated flats (Figure 5). For subtidal areas, thelimited overlap of the North Sea with the Channel/Celtic Sea shows these areas to be faunally dis-tinct (Figure 6), perhaps partly due to finer sedi-ment and lower organic flux in the Forties andEkofisk areas of the North Sea than in the CelticSea. Likewise, Loch Etive has little in common withthe Norwegian fjords (Lyngsdalsfjord, Oslofjord orHardangerfjord). The deeps on the Scottish shelfand the Skagerrak are quite similar and there is aprogression from the Skagerrak to Hardangerfjordto the deep sea, which partly reflects increasingwater depth. Also, the Skagerrak and Hardangerf-jord have finer (muddy) substrates than the deepsea (which although muddy contain sand-sizeplanktonic foraminiferal tests). The environmentalparameters we have available are not comprehen-sive enough to explain the faunal differences werecord between the investigated areas. However,
13

MURRAY AND ALVE: AGGLUTINATED FORAMINIFERA
14
Mar
sh
Inte
rtida
l-sub
tidal
Fjo
rd
Shel
f sea
s
Shel
f dee
ps
Deep
fjor
d
Deep
sea
Adercotryma glomeratum xAdercotryma wrightiAmmobaculites balkwilli (x)Ammoscalaria runiana (x) xAmmotium cassisAmmotium salsum xBalticammina pseudomacrescensCribrostomoides x xCribrostomoides crassimargo x xCribrostomoides jeffreysii x x xCuneata arctica (x) xCystammina pauciloculataDeuterammina (L.) ochracea xEggerella europea x x x xEggerelloides medius xEggerelloides scaber (x)Eratidus foliaceus xGlomospira gordialisHaplophragmoides bradyi x xHaplphragmoides sphaeriloculusHaplophragmoides wilbertiHormosinella guttifer x xJadammina macrescensLagenammina arenulata xLeptohalysis catella x xLiebusella goësi x xMiliammina fusca xPortatrochammina murrayi xPsammosphaera fusca xRecurvoides trochamminiforme xReophax bilocularisReophax fusiformisReophax micaceus xReophax moniliformisRepmanina charoides xSaccammina socialis xSpiroplectammina biformis xTextularia earlandi (x) x x xTiphotrocha comprimata (x)Trochammina inflataTrochammina subturbinatusTrochamminopsis quadriloba x
shelf breakmarg. mar.
FIGURE 7. Distribution of ATA taxa by environment, 1. Species arranged alphabetically by genus, 2. Species in orderof occurrence. Red and orange = >10%; x = <10%. (x) indicates tests interpreted to be transported.

PALAEO-ELECTRONICA.ORG
15
Mar
sh
Inte
rtida
l-sub
tidal
Fjo
rd
Shel
f sea
s
Shel
f dee
ps
Deep
fjor
d
Deep
sea
Balticammina pseudomacrescensHaplophragmoides wilbertiJadammina macrescensTiphotrocha comprimata (x)Trochammina inflataMiliammina fusca xReophax moniliformisTextularia earlandi (x) x x xAmmobaculites balkwilli (x)Ammoscalaria runiana (x) xAmmotium salsum xEggerelloides scaber (x)Ammotium cassisCribrostomoides x xCribrostomoides jeffreysii x x xDeuterammina (L.) ochracea xCuneata arctica (x) xEggerella europea x x x xEggerelloides medius xLiebusella goësi x xPortatrochammina murrayi xRecurvoides trochamminiforme xReophax micaceus xAdercotryma glomeratum xAdercotryma wrightiSpiroplectammina biformis xHaplophragmoides bradyi x xLeptohalysis catella x xTrochamminopsis quadriloba xCribrostomoides crassimargo x xEratidus foliaceus xReophax fusiformisHormosinella guttifer x xLagenammina arenulata xPsammosphaera fusca xRepmanina charoides xSaccammina socialis xCystammina pauciloculataGlomospira gordialisHaplphragmoides sphaeriloculusReophax bilocularisTrochammina subturbinatus
shelf breakmarg. mar.
FIGURE 7 (continued). (Part 2.)

MURRAY AND ALVE: AGGLUTINATED FORAMINIFERA
the relationship with broad environments is veryclear (Figures 7, 8). Overall, the data show thateven if only the agglutinated components of theassemblages from these areas are considered,their composition reflects differences in environ-mental characteristics.
The distributions of species and genera fail toreveal any clear depth-related boundaries but thereis a progression in faunal change with increasingwater depth from shore to deep sea (Figures 7-9).A similar environmental distribution of agglutinatedforaminifera exists on the NW Atlantic margin(Schafer et al. 1981).
Mar
sh
Inte
rtida
l-sub
tidal
Fjor
d
Shelf
Shelf
Bas
in
Deep
fjord
Deep
sea
Adercotryma Ammobaculites x Ammodiscus x x x Ammoscalaria x x x x x Ammotium x x Balticammina Cribrostomoides Cuneata x x Cystammina Deuterammina (Lepidodeuterammina) x Eggerella x x x x Eggerelloides Eratidus x Glomospira x x x x Haplophragmoides x Hormosinella x x Jadammina Lagenammina Leptohalysis x Liebusella x x Miliammina x Morulaeplecta x Portatrochammina x Psammosphaera x x x Recurvoides x Reophax Repmanina x Saccammina x Textularia x x x x Tiphotrocha x Trochammina Trochamminopsis x
shelf break
FIGURE 8. Distribution of ATA genera by environment, 1. Arranged alphabetically, 2. In order of occurrence. Redand orange =>10%; x = <10%. (x) indicates tests interpreted to be transported.
16

PALAEO-ELECTRONICA.ORG
Figure 14 compares live distributions for thestudy area (based on Murray 2006, and webappendix tables 192-196 therein) with thosedescribed here for the main species in the ATAs. Itshould be noted that the relative abundance ofagglutinated species is often low in live assem-blages where they may be heavily outnumbered bycalcareous forms. This partly accounts for the dif-ferences between live and ATA for fjord, shelf seas,
shelf deeps and deep fjord. Misidentifications mayalso widen the range of certain species (it is e.g.,not likely that Eggerelloides scaber or Trocham-mina inflata live in the deep sea). It is immediatelyapparent that there is some localised transport ofmarsh taxa into adjacent intertidal flats (e.g., Jad-ammina macrescens), to a smaller extent, trans-port from intertidal flats onto marshes (e.g.,Textularia earlandi), and downslope transport of
Mar
sh
Inte
rtida
l-sub
tidal
Fjor
d
Shelf
Shelf
Bas
in
Deep
fjord
Deep
sea
Balticammina Haplophragmoides x Jadammina Miliammina x Reophax Tiphotrocha x Trochammina Ammobaculites x Ammoscalaria x x x x x Ammotium x x Textularia x x x x Cribrostomoides Deuterammina (Lepidodeuterammina) x Cuneata x x Psammosphaera x x x Glomospira x x x x Morulaeplecta x Adercotryma Ammodiscus x x x Eggerella x x x x Eggerelloides Leptohalysis x Liebusella x x Portatrochammina x Recurvoides x Trochamminopsis x Eratidus x Hormosinella x x Repmanina x Saccammina x Lagenammina Cystammina
shelf break
FIGURE 8 (continued). (Part 2.)
17

MURRAY AND ALVE: AGGLUTINATED FORAMINIFERA
shelf taxa (Table 3). Cribrostomoides jeffreysii andDeuterammina (L.) ochracea are common in inter-tidal and fjord ATAs. The former has recently beenrecorded live along the Norwegian Skagerrak coast(Alve, unpublished data), otherwise they are yetnot recorded living in the present study environ-ments.
Balticammina pseudomacrescens, Haplo-phragmoides wilberti, Jadammina macrescens andTrochammina inflata are cosmopolitan speciesrestricted to marshes (Murray 2006). In tidal areasthese species show distinctive patterns of distribu-
tion that are controlled mainly by elevation but alsoby salinity (see Patterson 1990; De Rijk 1995). Themarshes around the Skagerrak, Oslofjord and Kat-tegat are essentially non-tidal with water levelchanges due primarily to barometric pressure andwind stress. The difference in elevation betweenthe marsh front and the landward limit is often onlya few tens of cm. Balticammina pseudomacre-scens occurs only on the landward and higherparts of the marsh with a cover of dry leaf litter indi-cating infrequent flooding (Murray and Alve1999a). These marshes are very reliable indicators
deepmarsh shelf seas fjord
Nor
way
Sw
eden
Den
mar
k
Eng
land
Nor
way
Sw
eden
Den
mar
k
Eng
land
Nor
way
Sco
tland
Nor
th S
ea
Cha
nnel
Cel
tic S
ea
W S
cotla
nd
Ska
gerr
ak
Har
dang
erfjo
rd
Balticammina pseudomacrescens Haplophragmoides wilberti x x Jadammina macrescens Tiphotrocha comprimata x Trochammina inflata x x x Miliammina fusca x x Reophax moniliformis x x Ammobaculites balkwilli x x Ammotium salsum x x x x Eggerelloides scaber x x x x Cuneata arctica x x x Cribrostomoides x Ammoscalaria runiana x x x Textularia earlandi x x x x x x Ammotium cassis Cribrostomoides jeffreysii x x x Deuterammina (L.) ochracea x x x x x Eggerella europea x x x x x x x Eggerelloides medius Liebusella goësi x x x x Portatrochammina murrayi x Recurvoides trochamminiforme x x Reophax micaceus Adercotryma glomeratum x Spiroplectammina biformis x Haplophragmoides bradyi x x Leptohalysis catella x x Cribrostomoides crassimargo x x Reophax fusiformis x x Adercotryma wrighti x Eratidus foliaceus x x Hormosinella guttifer x x Cystammina pauciloculata x
shelf break
inter-subtidal fjord shelf
deeps marginal marine
FIGURE 9. Geographic distribution of ATA taxa. Red and orange = >10%; x = <10%.
18

PALAEO-ELECTRONICA.ORG
of the upper limit of sea level and probably also ofsalinity (Alve and Murray 1999a).
Although Miliammina fusca has a restricteddistribution in our study area being confined tomarsh, intertidal and to a lesser extent in shallowfjord (Figure 7) the genus Miliammina is also com-mon in deep shelf sea environments off Antarctica(Murray and Pudsey 2004). Based on DNA analy-sis and wall structure, Habura et al. (2005) con-clude that Miliammina fusca is descended from acalcareous miliolid. The wall structure is consid-ered not to be typical of agglutinated taxa. How-ever, from an ecological perspective it behaves likean agglutinated form.
Ammotium cassis is absent from Britainbecause of the absence of suitable non-tidal envi-
ronments. Eggerella europea has not previouslybeen reported living in the study area but recentdata show it is common subtidally along the Nor-wegian Skagerrak coast (Alve, unpublished data).There are difficulties in distinguishing betweenReophax fusiformis and R. micaceus, and thisprobably accounts for the disparity between the liveand ATA distributions. The total (live plus dead)assemblages of Baffin Island fjords range in depthfrom ~215 to 708 m. They are ice covered for up to10 months per year, and the bottom sediment is>85% silt plus clay. Textularia earlandi is dominantin fjords north of Lat. 68°N while Spiroplectamminabiformis, Adercotryma glomeratum (which mayreally be A. wrighti as their illustrations show onlythree chambers) and Cuneata arctica dominate in
-4 -2 0 2 4PC1
-4
-2
0
2
4
PC
2
M
MMM
MMMMMM
M
M
MM
MMM M
M
M MMMMMMMMM
NN
N
N
N
N
NN
N
N
N
N
N
N
NNN
NNN
N
N
N
NNNN
NN
N
N
N
NN
NNNN
N
N
NN
N N
N
N
N
N
NN
N
NNN
N
N
N
N
N
NS
S
S
S
S
S
SS
S
S
SS
SSS
SSS
S
S
S
S
SSS
SSSS
S
S
SS
S
S
DD
D
D
D
DDDDD
D
D
D
D
D
D
D
D
D
D
D
DDD
E E
EE
E
EEEE
E EEE
EEEE E
EEEEEE
EEE
E
EEE
E
EE
EE
EEEEEEEEE
E
E
EWater depth (m)
Sediment
Temperature maximum
Salinity maximum
FIGURE 10. Principal component analysis of marginal marine environments. M = marsh for all areas; remainder inter-tidal-subtidal, N = Norway, S = Sweden, D = Denmark, E = England.
19

MURRAY AND ALVE: AGGLUTINATED FORAMINIFERA
M
MMM
MMMMMM
M
MMM
MMM
M
M
M MMMMMM
MMM
NN
N
N
N
N
NN
N
N
N
N
N
N
NNN
NNN
N
N
N
NNNN
N
N
N
N
N
NN
NNNN
N
N
NN
N N
N
N
N
N
NN
N
NNN
N
N
N
N
N
NS
S
S
S
S
S
SS
S
S
SSSSS
SSSS
S
S
S
SSS
SSSS
SS
SS
S
S
DD
D
D
D
DDDDD
D
D
D
D
D
D
D
D
D
D
D
DDD
CCCC
CCCCC
CCC
C
CCCC
C
EE
EEEE
E
PP
P
PPPP
PP
PP
PPPP
HHHHH
H
H
H2D Stress: 0.18
FIGURE 11. MDS plot of marginal marine environments. The data were normalised; resemblance based on Euclidiandistance. See Figure 13 for locality details.
those fjords south of Lat. 70°N (Schafer and Cole1986). Similarly, Corner et al. (1996) found liveAdercotryma glomeratum and Spiroplectamminabiformis to be indicative of inner fjord at depths of26-124 m in Tana, Norway.
Hardangerfjord is of particular interestbecause although it reaches bathyal depths (850m) its connection with true deep sea is across acontinental shelf (<200 m) and also shallow sills(140 m) within the fjord system. Nevertheless,there are some living continental slope to deep-seaspecies present including Ammolagena clavata,Ammoscalaria tenuimargo, Cribrostomoides sub-globosus, Haplophragmoides sphaeriloculus, Hor-mosinella guttifer, Hyperammina laevigata,Lagenammina arenulata and Lagenammina tubu-lata, and these were perhaps introduced aspropagules (Alve et al. 2011). In the ATAs dis-cussed here most are present at less than 5%, andthe maximum for any species is 7%. From the esti-mated sea floor organic flux (2.5 gCm-2 y-1) thisarea is comparable with that of the continentalslope.
On the Newfoundland, Canada, upper slope(500 m) live Adercotryma glomeratum,
Spiroplectammina biformis and Cribrostomoidesjeffreysii are found in the seasonally variable, coldLabrador Current water mass while Earlandam-mina bullata (given as Trochamminella) are morecommon in mid-slope NADW and in mixed NADWand NSOW at 2000 m together with Eratidus folia-ceus (given as Ammomarginulina) (Schafer andCole 1982). According to Schmiedl et al. (1997) inthe eastern South Atlantic live Lagenammina,Psammosphaera and Reophax are related tosandy sediments in areas of bottom currents butthis is not obviously so in our study area.
A comparison of >150 μm stained (living) for-aminifera in the axis of a Portuguese submarinecanyon and those on the adjacent continentalslope shows low standing crops (<30 individuals 10cm-2) from 332-4969 m in the canyon, and highervalues at 307 and 1000 m on the slope (140 and40 individuals 10 cm-2) with just a few individuals at4798 m. Arborescent agglutinated taxa are moreabundant on the slope and almost absent from thecanyon except at 4969 m. The distributions in thecanyon were attributed to harsh physical factorssuch as high bottom currents especially in theupper and middle canyon (Garcia et al. 2007).
20

PALAEO-ELECTRONICA.ORG
Samples from terraces in the upper and middlecanyon have larger standing crops dominated bycalcareous infaunal species. The presence of frag-ile agglutinated taxa such as Crithionina hispida istaken as evidence of the absence of sediment dis-turbance by physical factors. The lower canyonfaunas are more similar to those of the adjacentslope, dominated by agglutinated forms includingReophax and Lagenammina with low phytodetritusand most organic material present is refractory(Koho et al. 2007). According to Van der Zwaan etal. (1999) there is a correlation between uniserialagglutinated forms (their Reophax spp.) and Mn:remobilisation of Mn leads to reduced number ofReophax.
In 1985 Jones and Charnock proposed a mor-phogroup model based on samples from the UKcontinental margin, and this model has been widely
used for the interpretation of palaeoecology ofancient sediments. However, it is now known thatthe original model needs some revision, and thepresent large data set will provide an excellentopportunity to do this.
Relationships between Live, Dead andAcid-treated Assemblages
Where agglutinated foraminifera dominate liv-ing assemblages, as in some shallow water areasaround the Skagerrak-Kattegat, the main speciesis the same in live, dead and acid-treated assem-blages; for instance, dominance of Balticamminapseudomacrescens, Haplophragmoides wilberti,Miliammina fusca or Jadammina macrescens(Murray and Alve 1999b). However, in a few casesthe living assemblage has a dominant species dif-ferent from that of the dead and ATA, e.g., live
0
500
1000
1500
2000
2500
3000
3500
4000
4500
0.0 10.0 20.0 30.0 40.0W
ater
dep
th m
Sea floor organic flux gCorg m-2 yr-1
FIGURE 12. Correlation between water depth and sea floor organic flux.
21

MURRAY AND ALVE: AGGLUTINATED FORAMINIFERA
dominant Miliammina fusca leading to Jadamminamacrescens or Trochammina inflata dominatedODA or ATA. This is probably due to a bloom in thedominant living species at the time of sampling. Inthis same area, seven different calcareous ODAsgive rise to Miliammina fusca ATAs making this themost ubiquitous shallow water species represent-ing environments ranging from marsh edge towater depths of 6 m (limit of sampling) with a widerange of temperatures and salinities.
In the North Sea many living and dead assem-blages are dominated by the opportunistic speciesStainforthia fusiformis. Following dissolution, thesegive rise to a variety of ATAs dominated by: Ader-cotryma wrighti (given as A. glomeratum), Cuneataarctica (given as Clavulina obscura), Eggerelloidesmedius or E. scaber, Morulaeplecta bulbosa,Reophax fusiformis or Leptohalysis catella (but thelatter is unlikely to be well preserved due to its fra-gility, Alve and Murray 1995a). Elphidium excava-tum ODAs give rise to Eggerelloides scaber ATAs.In the Skagerrak shelf deep Pullenia osloensisODAs give rise to Textularia earlandi ATAs (givenas T. tenuissima), Stainforthia fusiformis ODAs
give rise to one or other T. earlandi, Eggerelloidesmedius, Haplophragmoides bradyi or Trochammin-opsis quadriloba ATAs (given as T. pusillus).
The English Channel and, to a lesser extent,the Celtic Sea both experience strong bottom cur-rents. Consequently, many of the agglutinated taxaadopt a clinging or attached mode of life. Suchforms comprise >70% of ATAs from the westernChannel and >40% from the Western Approaches(areas of strong tidal currents) and lower values inthose parts of the Celtic Sea least affected by suchcurrents. Whereas there are three distinct innershelf sea ODAs, they all give rise to a single Egger-elloides scaber ATA that Murray and Alve (2000aand 2000b) interpreted as indicating that the ODAsare better discriminators of subtle environmentaldifferences than the ATAs in this instance. How-ever, the more tranquil outer shelf sea areas eachhave distinctive ODAs, which are reasonably wellpreserved in the ATAs.
In the deep-sea NE Atlantic all the ODAs areessentially calcareous, and the dominant genus isCassidulina. In the ATAs trochamminids are abun-dant (>30%) in the majority of samples. The situa-
-4 -2 0 2 4PC1
-4
-2
0
2
PC
2H HHH
HH
H
HHHHHH
FoFoFoFoFoFoEkEkEkEkEk
C
C
C
CCC
CCC CCCCCCC
C
CC
CCCC
CCC
C
CC
C
C C
C
C
CS
S
S
SkSkSkSk
SkSkSkSkSk
SkSkSkSk
Sk
SkSkSkSkSk
SkSkSk
DD
D
D
D
DD
DDD
DD
DD
DD
Water depth (m)
Sediment
Temperature maximum
Organic flux
FIGURE 13. Principal component analysis of shelf to deep sea environments. C = Celtic Sea and Channel, N = NorthSea, Ek = Ekofisk, Fo = Forties, Sk = Skagerrak, H = Hardangerfjord, D = deep sea.
22

PALAEO-ELECTRONICA.ORG
tion is similar on the Newfoundland slope (Schaferet al. 1981). Genera occurring with localised abun-dances >10% in the present deep sea samplesinclude Haplophragmoides, Reophax, Trocham-mina, Cribrostomoides, Psammosphaera, Glomo-spira, Adercotryma, Portatrochammina, Eratidus,Hormosinella, Repmanina, Saccammina, Lage-nammina and Cystammina (Figure 8.2). There is abroad pattern of distribution with respect to waterdepth. Tube fragments are most abundant on thecontinental slope and rise and sparse from thedeeper basin. They are particularly abundant off
NW Africa that may be related to nutrient-richupwelling (Murray and Alve 1994).
CONCLUSIONS
Acid treated assemblages of agglutinated for-aminifera (ATAs) show patterns of species diversitythat mimic those of the original dead assemblages(ODAs) and those of the living assemblages; allshow a progression from low to high diversity withpassage from marginal marine through shelf seasto deep sea.
There is a clear progression in the distributionof species and genera from marginal marine to
ATA Live
Mar
sh
Inte
rtida
l-sub
tidal
Fjo
rd
Shel
f
Shel
f Bas
in
Dee
p fjo
rd
Dee
p se
a
Mar
sh
Inte
rtida
l-sub
tidal
Fjo
rd
Shel
f
Shel
f Bas
in
Dee
p fjo
rd
Dee
p se
a
Balticammina pseudomacrescensHaplophragmoides wilbertiJadammina macrescensTiphotrocha comprimata xTrochammina inflataMiliammina fusca xReophax moniliformisTextularia earlandi x x x x x xAmmobaculites balkwilli xAmmoscalaria runiana x x xAmmotium salsum xEggerelloides scaber x x xAmmotium cassisCribrostomoides x x xCribrostomoides jeffreysii x x x xDeuterammina (L.) ochracea x x xCuneata arctica x x xEggerella europea x x x xEggerelloides medius x xLiebusella goesi x x xPortatrochammina murrayi xRecurvoides trochamminiforme x x xReophax micaceus xAdercotryma glomeratum xAdercotryma wrightiHaplophragmoides bradyi x x x xLeptohalysis catella x xCribrostomoides crassimargo x xEratidus foleaceus x xHormosinella guttifer x xCystammina pauciloculataReophax fusiformis x
FIGURE 14. Comparison of live and ATA distributions in the NE Atlantic (live data based on Murray 2006). Red fieldsindicate abundance >10%; x = <10%.
23

MURRAY AND ALVE: AGGLUTINATED FORAMINIFERA
Table 4. Published SEM micrographs of species from the study area. A = Alve, M = Murray.
Species Published illustrations - SEMAdercotryma glomeratum M & A, 1994, pl. 1, fig 1
Adercotryma wrighti A & M, 1995a, pl. 1, figs 1, 2 (as A. glomeratum); M & A, 2000a, pl. 1, figs 1, 2; M, 2003a, figs 2.1, 2.2
Ammobaculites balkwilli M & A, 1999a, pl. 1, figs 1-5; M & A, 1999b, fig. 2I
Ammoscalaria pseudospiralis M, 2003a, fig. 2.3
Ammoscalaria runiana M & A, 1999b, fig. 2M
Ammotium cassis M & A, 1999b, fig. 2V
Ammotium salsum M & A, 1999b, fig. 2J
Balticammina pseudomacrescens M & A, 1999b, fig. 2A-C
Buzasina ringens M & A, 1994, pl. 1, fig 2
Clavulina obscura A & M, 1995a, pl. 1, fig. 3
Cribrostomoides jeffreysii M & A, 1994, pl. 1, fig. 3; M & A, 2000a, pl. 1, figs 6-8; M, 2003a, fig.2.5
Cribrostomoides subglobosus M & A, 1994, pl. 1, figs 5, 6
Cribrostomoides sp. A M & A, 2000a, pl. 1, figs 9-12
Cribrostomoides sp. M & A, 1994, pl. 1, fig 4
Cuneata arctica M & A, 2000a, pl. 1, figs 13, 14; M, 2003a, fig. 2.6
Cystammina pauciloculata M & A, 1994, pl. 1, fig 7
Deuterammina (Deuterammina) rotaliformis M & A, 2000a, pl. 2, figs 21-23; M, 2003a, figs 2.7, 2.8
Eggerella europea M & A, 2000a, pl. 1, figs 15-17; M, 2003a, fig. 2.9
Eggerelloides medius A & M, 1995a, pl. 1, figs 4, 5; M & A, 2000a, pl. 2, figs 16-17; M, 2003a, fig. 2.10
Eggerelloides scaber A & M, 1995a, pl. 1, figs 6, 7; M & A, 1999b, Fig. 2K; M & A, 2000a, pl. 2, figs 14-15; M, 2003a, fig. 2.11
Eggerelloides sp. A & M, 1995a, pl. 1, figs 8, 9
Eratidus foliaceus M & A, 1994, pl. 1, fig 9
Glomospira gordialis M & A, 1994, pl. 1, fig 10
Haplophragmoides bradyi A & M, 1995a, pl. 1, figs 10, 11; M & A, 2000a, pl. 2, figs 9, 10; M, 2003a, figs 3.1, 3.2
Haplophragmoides sphaeriloculus M & A, 1994, pl. 1, fig 11
Haplophragmoides wilberti M & A, 1999b, fig. 2D, E
Haplophrgmoides sp. 1 M & A, 2000a, pl. 2, figs 7, 8
Haplophrgmoides sp. 2 M & A, 2000a, pl. 2, figs 24, 25
Hormosinella distans M & A, 1994, pl. 1, fig 12
Jadammina macrescens M & A, 1999b, fig. 2D, F-H
Karrerulina apicularis M & A, 1994, pl. 1, fig 13
Lagenammina micaceus M & A, 1994, pl. 1, fig 14
Leptohalysis catella A & M, 1995a, pl. 1, figs 12, 13
Liebusella goësi M & A, 2000a, pl. 1, fig 18; M, 2003a, fig. 3.3
Miliammina fusca M & A, 1999b, fig. 2L
Morulaeplecta bulbosa A & M, 1995a, pl. 1, figs 14, 15; M & A, 2000a, pl. 2, figs 18-20 (as Textularia sp.); M, 2003a, figs 3.4, 3.5
Paratrochammina (Lepidoparatrochammina) haynesi
M & A, 1993, fig. 1-3
Portatrochammina murrayi M & A, 1994, pl. 1, fig. 21?; M & A, 2000a, pl. 2, figs 1-3; M, 2003a, figs 3.6, 3.7
Recurvoides trochamminiforme A & M, 1995a, pl. 1, figs 16-18; M & A, 2000a, pl. 2, figs 11-13; M, 2003a, figs 3.9, 3.10
Reophax fusiformis A & M, 1995a, pl. 1, fig. 19; M & A, 2000a, pl. 1, figs 5
Reophax micaceus A & M, 1995a, pl. 1, figs 20-21
Reophax moniliformis M & A, 1999a, pl. 1, figs 6-14; M & A, 1999b, fig. 2U
Reophax scorpiurus M & A, 1994, pl. 1, fig 19
Repmanina charoides M & A, 1994, pl. 1, fig 20
Saccammina sp. A & M, 1995a, pl. 1, fig. 22
24

PALAEO-ELECTRONICA.ORG
TABLE 4 (continued).
deep sea but it is impossible to determine the pre-cise controls on species distributions. ATAs some-times show the localised effects of transport inwhich case species distributions are slightlybroader than for their live counterparts. Forinstance, transport of marsh species onto adjacenttidal flats and vice versa. However, there is no evi-dence of widespread transport of agglutinatedtests.
Although the genus Miliammina is confined tomarginal marine environments in the study area, itoccurs on the deep shelf sea off Antarctica so it isnot exclusively an index of marginal marine envi-ronments.
As experimentally induced ATAs fill the no-analogue gap for modern environments (alterna-tive 2), there is no need to invoke different ecologi-cal preferences for fossil taxa (alternative 1).
The data on species abundance, speciesdiversity, distribution of species and genera withrespect to environment and geography, providecomparative baselines for the interpretation of fos-sil agglutinated assemblages.
TAXONOMIC NOTES AND COMMENTS ON SPECIES ECOLOGY
For each species the name used is followedby the original name, with notes on taxonomywhere appropriate. The generic scheme of Loe-blich and Tappan (1987) has been followed exceptfor trochamminids. This list is arranged in the sameorder as the illustrations. Many species are illus-trated in Figures 15 (mainly marginal marine taxa),16-18 (shelf sea, shelf deep and fjord taxa) and 19(deep sea taxa); SEM illustrations from our previ-ous studies are listed in Table 4.
The geographical and environmental distribu-tion of many species (marked with **) in our dataset is given in Figures 7-9 so the details are notrepeated here. However, for the less common spe-cies the statement concluding with * refers to theATA distribution recorded in this study. Relative
abundance terms: rare = occasional occurrence;minor = commonly present in abundance <10%;common >10%; dominant = the most abundantspecies in the assemblage. All other referencedecological comments are based on live (stained)occurrences in the study area (NE Atlantic) unlessotherwise specified. Where the notes on speciesecology are from Murray (2006) they include refer-ences cited therein.
Mainly Brackish Marginal Marine Taxa
Ammobaculites balkwilli Haynes, 1973.Figure 15.1**.
Restricted to Europe; mainly low intertidal to sub-tidal; salinity 15-29 around the Skagerrak-Kattegat(Alve and Murray 1999).
Ammoscalaria runiana (Heron-Allen and Earland)= Haplophragmium runianum Heron-Allen and Ear-land, 1916. Figure 15.2-5**.
Intertidal-subtidal; common only in fine to mediumsand with <20% mud and low TOC (0.2-0.7%);salinity 16-18 (Alve and Murray 1999).
Ammotium cassis (Parker) = Lituola cassis Parker,1870. Figure 15.6 (specimen metal coated)**.
Infaunal detritivore lying horizontally in the top 5 cmof sediment; in brackish marginal marine environ-ments, in the transitional water layer and possiblyindicating the halocline; always subtidal; repro-duces at <8°C (Olsson, 1976; Murray 2006).
Ammotium salsum (Cushman and Brönnimann) =Ammobaculites salsus Cushman and Brönni-mann, 1948**.
Infaunal down to 10 cm, detritivore; marshes; with-stands salinities of 60 (Murray 2006).
Balticammina pseudomacrescens Brönnimann,Lutze and Whittaker, 1989**.
Epifaunal; characteristic of low-salinity, brackishhigh marsh closest to land (Murray 2006).
Textularia earlandi A & M, 1995a, pl. 1, fig. 23 (as T. tenuissima); M & A, 2000a, pl. 2, fig 6 (as T. tenuissima); M, 2003a, figs 3.15, 3.16
Tiphotrocha comprimata M & A, 1999b, fig. 2N-P
Tritaxis britannica M & A, 2000a, pl. 2, figs 4, 5
Tritaxis fusca M & A, 2000a, pl. 1, figs 3, 4
Trochammina inflata M & A, 1999b, fig. 2Q-S
Trochammina sp. M & A, 1994, pl. 1, fig 23
Trochamminopsis quadriloba A & M, 1995a, pl. 1, figs 24, 25 (as T. pusillus)
Species Published illustrations - SEM
25

MURRAY AND ALVE: AGGLUTINATED FORAMINIFERA
Haplophragmoides wilberti Anderson, 1953. Figure15.7, 8**.
Epifaunal and infaunal down to 30 cm; marshes(Murray 2006)
Jadammina macrescens (Brady) = Trochamminainflata (Montagu) var. macrescens Brady, 1870.Figure 15.9-11**.
Epifaunal, sometimes on decaying leaves, andinfaunal down to 60 cm; herbivore or detritivore;widespread on high to mid marsh (Murray 2006).
Miliammina fusca (Brady) = Quinqueloculina fuscaBrady, 1870. Figure 15.12**.
Epifaunal or infaunal down to 50 cm in marshes;intertidal to shallow subtidal in brackish waters(Murray 2006). The last survivor in marine environ-ments that are cut off from the sea perhaps due tobeing infaunal (Lloyd and Evans 2002).
Paratrochammina (Lepidoparatrochammina)haynesi (Atkinson) = Trochammina haynesi Atkin-son, 1969. Figure 15.13, 14.
Occasionally common in subtidal marginalmarine*. Attached on gravel and shells, in the pro-tection of crevices or ribs; current-swept areassuch as channels (Murray and Alve 1993; Murray2006).
Reophax moniliformis Siddall, 1886. Figure 15.15,16*.
Detritivore on plant debris; husbands chloroplasts;intertidal to subtidal in brackish environments (Mur-ray 2006).
Tiphotrocha comprimata (Cushman and Brönni-mann) = Trochammina comprimata Cushman andBrönnimann, 1948**.
Epifaunal, free or clinging to algae, and infaunaldown to 42 cm; herbivore or detritivore; marshes(Murray 2006).
FIGURE 15. Mainly marginal marine taxa. The dimensions refer to the length or greatest diameter according toshape. # = sample number. The type specimens are housed in the Natural History Museum. London. 15.1 Ammobac-ulites balkwilli Haynes, 1973, Holotype 1970:11:26:16, 600 μm. 15.2 Ammoscalaria runiana (Heron-Allen and Ear-land) #S145, Kungsbackafjord, Sweden, 200 μm, 15.3 #P10-95, Poole Harbour, England, 200 μm. 15.4, 5Ammoscalaria runiana (Heron-Allen and Earland) = Haplophragmium runianum Heron-Allen and Earland, 1916, Syn-type 1955:19:24:25-39, 300, side and apertural views. 15.6 Ammotium cassis (Parker) = Lituola cassis Parker, 1870,Lectotype ZF4637, (metal coated) size not available as specimen was subsequently damaged. 15.7, 8 Haplophrag-moides wilberti Andersen #S126, Kalundborg, Sweden, 255, 310 μm. 15.9-11 Jadammina macrescens (Brady)#S124, Kalundborg, Sweden, 420, 330, 330 μm. 15.12 Miliammina fusca (Brady) = Quinqueloculina fusca Brady,1870 Syntype 1955:10:28:67-106, 450 μm (previously gold-coated). 15.13, 14 Paratrochammina (Lepidoparatroc-hammina) haynesi (Atkinson) = Trochammina haynesi Atkinson, 1969 Holotype 1968:5:16:1, 360 μm (previouslygold-coated). 15.15, 16 Reophax moniliformis Siddall #S64, Hafstensfjord, Sweden, 15. 600 μm, apertural view 125μm.
26

PALAEO-ELECTRONICA.ORG
Trochammina inflata (Montagu) = Nautilus inflatusMontagu, 1808**.
Epifaunal and infaunal down to 60 cm; herbivore ordetritivores, mid marsh (Murray 2006).
Shelf Sea, Shelf Deep and Fjord Taxa
Adercotryma glomeratum (Brady) = Lituola glomer-ata Brady, 1878. Figure 16.1-2**.
Prior to 1987 adult tests with three or four cham-bers in the final whorl were included in this species
but in that year Brönnimann and Whittaker erecteda new species (A. wrighti) for those with threechambers.
Infaunal - epifaunal; a negative correlation withTOC but tolerates a wide range of temperature 1.8-16.6°C in Gulf of Guinea (Timm 1992). However, inthe Arctic Ocean it favours temperatures of 1.8-3.0°C (Williamson et al. 1984). Inhabits the phyto-detritus layer and sediment (Gooday 1988). Itmoves up and down in sediment seasonally: phyto-
FIGURE 16. Shelf sea, shelf deep and fjord taxa. The dimensions refer to the length or greatest diameter accordingto shape. # = sample number. The type specimens are housed in the Natural History Museum. London. 16.1, 2Adercotryma glomeratum (Brady) #69-92, Skagerrak, side view 200 μm, end view 290 μm. 16.3-5 Adercotrymawrighti Brönnimann and Whittaker #Md6b, Muck Deep, Scotland, 120 μm, end and side views. 16.6-8 Ammodiscuscatinus Höglund #SK168, Skagerrak, 164, 200, 255 μm. 16.9 Ammodiscus gullmarensis Höglund #3117, North Sea,200 μm. 16.10 Ammolagena clavata (Jones and Parker) #SK57, Skagerrak, 475 μm. 16.11 Ammolagena clavata(Jones and Parker) = Trochammina irregularis (d’Orbigny) var. clavata Jones and Parker, 1860, Lectotype ZF4873,1800 μm. 16.12 Ammoscalaria pseudospiralis (Williamson) #1460, English Channel, 820 μm. 16.13 Ammoscalariatenuimargo (Brady) #69-92, Skagerrak, 1400 μm. 16.14, 15 Ammoscalaria tenuimargo (Brady) = Haplophragmiumtenuimargo Brady, 1884, Syntype ZF1554, 2300 μm, side and apertural views. 16.16, 17 Cribrostomoides crassi-margo Norman #69-92, Skagerrak, 820, 900 μm.
27
MURRAY AND ALVE: AGGLUTINATED FORAMINIFERA
detritus feeder in spring, shallow infaunal for theremainder of the year (Kuhnt et al. 2000).
Adercotryma wrighti Brönnimann and Whittaker,1987. Figure 16.3-5**.
Ammodiscus catinus Höglund, 1947. Figure 16.6-8.
Rare in shallow fjord, shelf, shelf deeps*.
Ammodiscus gullmarensis Höglund, 1948. Figure16.9.
Occasionally common but mainly rare in shallowfjord, shelf, shelf deeps*. Brackish, salinity 20-32;temperature 4-14°C, on organic-rich muddy sedi-ment, dominant in deeper water close to the per-manently anoxic layer, in Norwegian fjords (Alve1995).
Ammolagena clavata (Jones and Parker) = Troc-hammina irregularis (d’Orbigny) var. clavata Jonesand Parker, 1860. Figure 16.10, 11.
Rare in Shelf deeps, deep sea*. Sea floor organicflux 0.8-60 g m2 yr-1 (Altenbach et al. 1999).
Ammoscalaria pseudospiralis (Williamson) = Pro-teonina pseudospiralis Williamson, 1858. Figure16.12. More mature specimens have a longer uni-serial part.
Rare in shallow fjord, shelf, and common in shelfdeeps*. Infaunal in top 1 cm (Barmawidjaja et al.1992). Sea floor organic flux 7->100 g m2 yr-1
(Altenbach et al. 1999).
Ammoscalaria tenuimargo (Brady) = Haplophrag-mium tenuimargo Brady, 1882. Figure 16.13-15.
Rare in shallow fjord and deep sea, occasionallycommon in shelf deeps*.
Cribrostomoides crassimargo (Norman) = Hap-lophagmium crassimargo Norman, 1826. Figure16.16, 17**.
Cribrostomoides jeffreysii (Williamson) = Non-ionina jeffreysii Williamson, 1858. Figure 17.1-4**.
In #2070 there are smaller tests with a shiny sur-face and finer texture than the typical C. jeffreysiiyet in other respects the morphology is the same.Tests with more mica are grey, and brown with nomica. We had considered using the name C. koste-rensis but it was impossible to consistently sepa-rate the two. In Murray and Alve (2000a) weseparated off Cribrostomoides sp. A but now thatwe have seen a larger data set we realise that it isnot possible to consistently separate sp. A from C.jeffreysii.
Infaunal to epifaunal, attached mobile (Murray2006).
Cribrostomoides nitidus (Goës) = Haplophragmiumnitidum Goës, 1896. Figure 17.5, 6.
Rare in shelf deeps, deep fjord, deep sea*.
Cribrostomoides subglobosus (Sars) = Lituola sub-globosa Sars, 1868. Figure 17.7, 8**.
Epifaunal – infaunal, detritivore (Murray 2006). Seafloor organic flux 0.2-90 g m2 yr-1 (Altenbach et al.1999). Linke (1989) suggested that the speciesentered a resting phase when food was in shortsupply and responded quickly to phytodetritusinput.
Cuneata arctica (Brady) = Reophax arctica Brady,1881. Figure 17.9**.
The range of morphology of Clavulina obscuraChaster seems to overlap that of this species. SeeAlve and Goldstein (2010) for further comments onsynonymy.
Deuterammina (Deuterammina) balkwilli Brönni-mann and Whittaker, 1983.
Minor in deep fjord*.
Deuterammina (Deuterammina) rotaliformis(Heron-Allen and Earland) = Trochammina rotali-formis Heron-Allen and Earland, 1911.
Rare in shelf, shelf deeps*.
Deuterammina plymouthensis Brönnimann andWhittaker, 1990.
Minor in shelf deep*.
Deuterammina (Lepidodeuterammina) ochracea(Williamson) = Rotalina ochracea Williamson,1858. Figure 17.10, 11**.
Epifaunal, attached mobile (Murray 2006).
Earlandammina bullata (Høglund) = Trochammi-nella bullata Höglund, 1947. Figure 17.12, 13.
Brönnimann and Whittaker (1988) treat this as asynonym of E. inconspicua (Earland). However,that species is tiny and has a thin fragile wall –quite unlike our material or that of Höglund.
Occasionally common in shelf deeps, minor indeep fjord and deep sea*.
Eggerella europea (Christiansen) = Verneuilinaeuropeum Christiansen, 1958, new name forVerneuilina advena Cushman of Höglund, 1947.Figure 17.14, 15**.
#3234 has a few specimens that have a terminalbiserial section.
28

PALAEO-ELECTRONICA.ORG
29
FIGURE 17. Shelf sea, shelf deep and fjord taxa. The dimensions refer to the length or greatest diameter according toshape. # = sample number. The type specimens are housed in the Natural History Museum. London. 17.1, 2 Cribros-tomoides jeffreysii (Williamson) #SK66, Skagerrak, 310 μm. 17.3, 4 Cribrostomoides jeffreysii (Williamson) = Non-ionina jeffreysii Williamson, 1858 Syntype 96:8:13:14, 370 μm, side and apertural views. 17.5, 6 Cribrostomoidesnitidus (Goës) #SK63, Skagerrak, 475, 290 μm. 17.7, 8 Cribrostomoides subglobosus (Sars) #SK68, Skagerrak, 455,380 μm. 17.9 Cuneata arctica (Brady) #SK65, Skagerrak, 235 μm. 17.10, 11 Deuterammina (Lepidodeuterammina)ochracea (Williamson) = Rotalina ochracea Williamson, 1858 Lectotype ZF4837, 180 μm. 17.12, 13 Earlandamminabullata (Höglund) #SK57, Skagerrak, 240, 240 μm. 17.14, 15 Eggerella europea Christiansen #3117, North Sea, 300μm. 17.16 Eggerelloides medius (Höglund) #SK68, Skagerrak, 365 μm. 17.17, 18 Eggerelloides scaber (Williamson)= Bulimina scabra Williamson, 1858 Syntype 96:8:13:30, both 650 μm. 17.19 Gaudryina pseudoturris (Cushman)#SK57, Skagerrak, 1055 μm. 17.20 Glomospira gordialis (Jones and Parker) #72-92, Skagerrak, 130 μm. 17.21 Glo-mospira gordialis (Jones and Parker) = Trochammina squamata var. gordialis Jones and Parker, 1860 LectotypeZF4876, 300 μm. 17.22, 23 Haplophragmoides bradyi (Robertson) #SK67, Skagerrk, 290 μm. 17.24, 25 Haplophrag-moides bradyi (Robertson) = Trochammina bradyi Robertson, 1891 Syntype 62:2:14:467-502, 230 μm. 17.26, 27Haplophragmoides membranaceum (Höglund) #SK67, Skagerrak, 90 μm. 17.28, 29 Haplophragmoides sp. 1 #2203,Western Approaches, England, 220, 220 μm.

MURRAY AND ALVE: AGGLUTINATED FORAMINIFERA
Eggerelloides medius (Höglund) = Verneuilinamedia Höglund, 1947. Figure 17.16**.
Infaunal, positive correlation with % TOC and to alesser extent with % <63 μm sediment; a strongnegative correlation with grain size >1000 μm(Murray 2006).
Eggerelloides scaber (Williamson) = Buliminascabra Williamson, 1858. Figure 17.17, 18**.
Infaunal, detritivore, subtidal, mainly shelf but toler-ates salinity >24 for most of the year and tempera-tures 1-20°C (Murray et al. 2003; Murray 2006).
Gaudryina pseudoturris (Cushman) = Textulariapseudoturris Cushman, 1922. Figure 17.19.
Rare in shelf basin and deep sea*.
Glomospira glomerata Höglund, 1947.
Minor in fjord*.
Glomospira gordialis (Jones and Parker) = Troc-hammina squamata var. gordialis Jones andParker, 1860. Figure 17.20, 21**.
Shallow infaunal (Kuhnt et al. 2000). Sea floororganic flux 11-25 g m2 yr-1 (Altenbach et al. 1999).
Haplophragmoides bradyi (Robertson) = Trocham-mina bradyi Robertson, 1891. Figure 17.22-25**.
Shallow infaunal (Gooday 1990; Kuhnt et al. 2000).
Haplophragmoides membranaceum Höglund,1947. Figure 17.26, 27.
Minor in shelf deeps, deep fjord, deep sea*.
Haplophragmoides sp. 1. Figure 17.28, 29.
Light brown yellowish, shiny, 4-5 chambers, flat.
Rare in shelf, deep fjord*.
Haplophragmoides sp. hetta (helmet) because ofthe large final chamber. Figure 18.1, 2.
We have not found a species name for this.
Rare in fjords, shelf and deep sea*.
Lagenammina tubulata (Rhumbler) = Saccamminatubulata Rhumbler, 1931. Figure 18.3.
Minor in shelf basin, deep fjord, deep sea*.
Leptohalysis catella (Höglund) = Reophax catellaHöglund, 1947. Figure 18.4**.
Leptohalysis catenata (Höglund) = Reophax cate-nata Höglund, 1947.
Minor in fjord and shelf*.
Leptohalysis gracilis (Kiaer) = Reophax gracilisKiaer, 1900.
Minor in fjord, shelf basin, deep fjord*.
Leptohalysis scottii (Chaster) = Reophax scottiiChaster, 1892. Figure 18.5.
Fjord, shelf, shelf basin, deep fjord*. Under experi-mental conditions, lives in the top cm of sediment,responds quickly to disturbance and is very active,thus avoiding hostile environmental conditions, andis considered to be a good competitor (Ernst et al.2000).
Liebusella goesi Höglund, 1947. Figure 18.6**.
Sea floor organic flux 7-90 g m2 yr-1 (Altenbach etal.1999).
Morulaeplecta bulbosa Höglund, 1947. Figure18.7.
Occasionally common in shelf, rare in shelf basin*.Infaunal in top cm (Barmawidjaja et al. 1992).
Paratrochammina (Lepidoparatrochammina) hartiBrönnimann and Whittaker, 1990.
Minor in shelf deeps*.
Paratrochammina (Paratrochammina) wrightiBrönnimann and Whittaker, 1983.
Minor in shelf*.
Portatrochammina murrayi Brönnimann and Zani-netti, 1984. Figure 18.8-10**.
The same as Trochammina globigeriniformis var.pygmaea of authors – including papers by Murray.
Psammosphaera bowmani Heron-Allen and Ear-land, 1912. Figure 18.11.
Minor in fjord and shelf*. Common just below thesurface brackish layer in inner Drammensfjord,Norway (Alve 1990).
Psammosphaera fusca Schultze, 1875. Figure18.12**.
Common in lower canyon at depths of 4810-4976m off Portugal (Koho et al. 2007).
Recurvoides trochamminiforme Höglund, 1947.Figure 18.13, 14**.
Recurvoides turbinatus (Brady) = Haplophragmiumturbinatum Brady, 1881.
Minor in fjord*.
Remaneica anglica Brönnimann and Whittaker,1990.
Minor in shelf*.
Remaneica helgolandica Rhumbler, 1938.
Minor in fjord and shelf*.
Remaneica plicata (Terquem) = Patellina plicataTerquem, 1876.
30

PALAEO-ELECTRONICA.ORG
31
FIGURE 18. Shelf sea, shelf deep and fjord taxa. The dimensions refer to the length or greatest diameter according toshape. # = sample number. The type specimens are housed in the Natural History Museum. London. 18.1, 2 Haplo-phragmoides sp. hetta #YL12, Lyngdalsfjord, Norway, specimen lost. 18.3 Lagenammina tubulata (Rhumbler) #SK62,Skagerrak, 180 μm. 18.4 Leptohalysis catella (Höglund) #SK66, Skagerrak, 400 μm. 18.5 Leptohalysis scottii (Chas-ter) #SK65, Skagerrak, 655 μm. 18.6 Liebusella goesi Höglund #SK65, Skagerrak, 1910 μm. 18.7 Morulaeplecta bul-bosa Höglund #Md6a, Muck Deep, Scotland, 400 μm. 18.8-10 Portatrochammina murrayi Brönnimann and Zaninetti,#Md6a, Muck Deep, Scotland, 145 μm. 18.11 Psammosphaera bowmani Heron-Allen and Earland, 1912 Syntype1957:11:14:93, 620 μm. 18.12 Psammosphaera fusca Schultze #3453, North Sea, 240 μm. 18.13, 14 Recurvoides tro-chamminiforme Höglund #69-92, Skagerrak, 180, 165 μm. 18.15 Reophax fusiformis (Williamson) #SK67, Skagerrak,600 μm. 18.16 Reophax micaceus (Cushman) #SK67, Skagerrak, 400 μm. 18.17 Repmanina charoides (Jones andParker) #SK57, Skagerrak, 420 μm. 18.18 Saccammina socialis Brady #SK57, Skagerrak, 290 μm. 18.19 Saccam-mina sphaerica Sars #2894, North Sea, 1275 μm. 18.20 Spiroplectammina biformis (Jones and Parker) #72-92,Skagerrak, 220 μm. 18.21, 22 Spiroplectammina biformis (Parker and Jones) = Textularia agglutinans d’Orbigny var.biformis Jones and Parker, 1865 Lectotype ZF3639, 370 μm, Paralectotype ZF3638, 500 μm. 18.23 Textularia earlandiParker SK65, Skagerrak, 345 μm. 18.24, 25 Textularia earlandi Parker = new name for Textularia tenuissima Earland,1933 Syntype ZF3518, 400 μm, 380 μm showing aperture. 18.26, 27 Textularia kattegatensis (Höglund) #72-92, Ska-gerrak, 310, 330 μm. 18.28 Textularia skagerakensis Höglund #2895, North Sea, 380 μm. 18.29, 30 Tritaxis britannicaBrönnimann and Whittaker #2203, Western Approaches, England 280 μm. 18.31 Tritaxis conica (Parker and Jones) =Valvulina triangularis d’Orbigny var. conica Parker and Jones, 1865 Syntype ZF3529, 170 μm (specimen gold-coated).18.32-35 Trochammina sp. skrumpa #12-96, Skagerrak, 180 μm. 18.36-39 Trochamminopsis quadriloba Höglund #1-96, Hardangerfjiord, Norway, 36-38 150 μm, 39 165 μm, (39 Höglund material from Gullmar Fjord).

MURRAY AND ALVE: AGGLUTINATED FORAMINIFERA
Minor in shelf*.
Remaneicella gonzalezi (Seiglie) = Remaneicagonzalezi Seiglie, 1964.
Minor in shelf and deep sea*.
Reophax fusiformis (Williamson) = Proteonina fusi-formis Williamson, 1858. Figure 18.15**.
Normal marine salinity and temperature -1 to 13°Con sand and muddy sand down to >3000 m (Mur-ray et al. 2003).
Reophax micaceus Earland, 1934. Figure 18.16**.
Reophax rostrata Höglund, 1947.
Rare fjord, shelf*.
Reophax scorpiurus Montfort, 1808.
Minor in fjord, shelf and shelf basin*. Shallow infau-nal (Kuhnt et al. 2000). Epifaunal; sea floor organicflux 0.8-60 g m2 yr-1 (Altenbach et al. 1999).
Repmanina charoides (Jones and Parker) = Troc-hammina squamata Jones and Parker var. charoi-des Jones and Parker, 1860. Figure 18.17**.
Shallow infaunal (Gooday 1990; Kuhnt et al. 2000).
Saccammina socialis Brady, 1884. Figure 18.18**.
Common in Laptev Sea (Wollenburg and Kuhnt2000).
Saccammina sphaerica Sars, 1872. Figure 18.19.
Rare in shelf, deep fjord, deep sea*. Common inLaptev Sea (Wollenburg and Kuhnt 2000).
Spiroplectammina biformis (Parker and Jones) =Textularia agglutinans d’Orbigny var. biformisParker and Jones, 1865. Figure 18.20-22**.
Estuarine, fjord, shelf in northern regions; toleratessalinity down to 20; low oxygen <2 ml/l (Williamsonet al. 1994; Alve 1990; Alve and Nagy 1990).
Technitella legumen Norman, 1878.
Rare in shelf deep, deep sea*. Epifaunal , attached(Castignetti and Hart 2000). The genus is consid-ered to thrive in organic-rich sediment and anopportunistic coloniser of barren sediments follow-ing sediment disturbance (Anschutz et al. 2002;Koho et al. 2007).
Textularia contorta Höglund, 1947.
Minor in shelf and deep fjord*.
Textularia earlandi Parker = new name for Textu-laria tenuissima Earland, 1933. Figure 18.23-25**.
Shallow infaunal, tolerates dysoxia (Bernhard et al.1997). Seems to be an omnivorous opportunist(Alve 2010).
Textularia kattegatensis (Höglund) = Textularia gra-cillima Höglund, 1947. Figure 18.26, 27.
Minor in fjord, shelf, shelf deep*. Respiration rate5.3 ± 1.9 nmol O2 d-1 ind-1 for individuals 563-611μm in length (Nomaki et al. 2007)
Textularia skagerakensis Höglund, 1947. Figure18.28.
Minor in shelf, shelf deep, deep fjord, deep sea*.
Tritaxis britannica Brönnimann and Whittaker,1990. Figure 18.29, 30.
Høglund (1947) called this Trochammina cf. rotali-formis.
Rare in fjord, shelf and deep sea*.
Tritaxis conica (Parker and Jones) = Valvulina tri-angularis d’Orbigny var. conica Parker and Jones,1865. Figure 18.31.
Minor in shelf deep*.
Tritaxis fusca (Williamson) = Rotalina fusca Wil-liamson, 1858.
Minor in shelf and deep fjord*.
Trochammina sp. skrumpa (shrunken chambers).Figure 18.32-35.
Distinguished by its thin test wall, almost transpar-ent, possibly made of mica. A low trochospiral. Acharacteristic feature is that that some chambersmay collapse through shrinkage when dried. Sub-triangular with 4 chambers in the final whorl, thefinal chamber forming at least one third of the test.
Rare in shallow fjord, deep fjord, shelf basin anddeep sea*. Some chambers may collapse throughshrinkage when dried.
Trochamminopsis quadriloba Höglund, 1948 = Tro-chammina pusilla Höglund, 1947. Figure 18.36-39**.
Deep Sea Taxa
Buzasina ringens (Brady) = Trochammina ringensBrady, 1879.
Rare in deep sea*.
Cystammina pauciloculata (Brady) = Trochamminapauciloculata Brady, 1884. Figure 19.1**.
Shallow infaunal (Kuhnt et al. 2000). Tolerates dys-oxia (Schönfeld 1997). Sea floor organic flux 1-9 gm2 yr-1 (Altenbach et al. 1999).
Eratidus foliaceus (Brady) = Lituola (Haplophrag-mium) foliaceum Brady, 1881. Figure 19.2-4**.
Infaunal; correlates with higher TOC but toleratestemperature of 1.8-7.9°C in Gulf of Guinea (Timm
32

PALAEO-ELECTRONICA.ORG
33
FIGURE 19. Deep sea taxa. The dimensions refer to the length or greatest diameter according to shape. # = samplenumber. The type specimens are housed in the Natural History Museum. London. 19.1 Cystammina pauciloculata(Brady) = Trochammina pauciloculata Brady, 1884, Lectotype ZF2508, 500 μm. 19.2-4 Eratidus foliaceus (Brady) =Lituola (Haplophragmium) foliaceum Brady, 1881. Syntypes ZF1533, 900 μm, 480 μm, 1250 μm. 19.5 Glaphyram-mina americana (Cushman) #3235, NE Atlantic, 745 μm. 19.6, 7 Haplophragmoides sphaeriloculus Cushman#3296, NE Atlantic, both 380 μm. 19.8 Hormosinella distans (Brady) = Lituola (Reophax) distans Brady, 1881 Syn-type ZF2271, 5000 μm. 19.9-11 Hormosinella guttifer (Brady) = Lituola (Reophax) guttifer Brady, 1881 SyntypesZF2276, 600 μm, 810 μm, 700 μm. 19.12 Reophax pilulifera Brady, 1884 Syntype ZF2284/ZF4878-80, 2060 μm.19.13 Karrerulina apicularis (Cushman) #3236, NE Atlantic, 530 μm. 19.14-16 Labrospira scitula (Brady) = Lituola(Haplophragmium) scitulum Brady, 1881 Syntypes ZF1551, 950 μm, 750 μm, 850 μm. 19.17, 18 Lagenamminaarenulata (Skinner) #3236, NE Atlantic, 440, 345 μm. 19.19, 20 Trochammina subturbinatus Cushman #3209, NEAtlantic, 200 μm.

MURRAY AND ALVE: AGGLUTINATED FORAMINIFERA
1992). Sea floor organic flux 0.2-20 g m2 yr-1
(Altenbach et al. 1999). Shallow infaunal (Kuhnt etal. 2000).
Glaphyramina americana (Cushman) = Ammobac-ulites americanus Cushman, 1910. Figure 19.5.
Rare in deep sea*.
Haplophragmoides sphaeriloculus Cushman,1910. Figure 19.6, 7**.
Shallow infaunal (Gooday 1986; Kuhnt et al. 2000).
Hormosinella distans (Brady) = Lituola (Reophax)distans Brady, 1881. Figure 19.8.
Minor in deep sea*. Shallow infaunal (Kuhnt et al.2000). Found in lower canyon at depths of 4810-4976 m in sediments low in phytodetritus and withrefractory organic matter and subject to near-annual sediment gravity flows (off Portugal, Kohoet al. 2007).
Hormosinella guttifer (Brady) = Lituola (Reophax)guttifer Brady, 1881. Figure 19.9-11**.
Epifaunal; may respond to sea floor organic fluxes/phytodetritus inputs (Wollenburg and Kuhnt 2000;Fontanier et al. 2003); highest total occurrences at4°C in the Barents Sea (Hald and Steinsund 1992).
Hyperammina laevigata Wright = Hyperamminaelongata Brady var. laevigata Wright, 1891.
Minor in fjord, shelf deeps, deep fjord, deep sea*.
Reophax pilulifera Brady, 1884. Figure 19.12.
Rare deep sea*.
Karrerulina apicularis (Cushman) = Gaudryina api-cularis Cushman, 1911. Figure 19.13.
The juveniles of this species are very difficult todistinguish from Eggerelloides medius. In sampleswith only the triserial tests we call them E. medius.
Occasionally common in deep sea*. Deep infaunal(Kuhnt et al. 2000). Sea floor organic flux 0.8-10 gm2 yr-1 (Altenbach et al.1999).
Labrospira scitula (Brady) = Lituola (Haplophrag-mium) scitulum Brady, 1881. Figure 19.14-16.
Rare in deep sea*. Sea floor organic flux 0.9-50 gm2 yr-1 (Altenbach et al. 1999).
Labrospira wiesneri Parr, 1950.
Rare in deep sea*. Infaunal (Gooday 1990).
Lagenammina arenulata (Skinner) = Reophaxdifflugiformis arenulata Skinner, 1961. Figure19.17, 18**.
Nodellum membranaceum (Brady) = Reophaxmembranaceum Brady, 1879.
Minor deep sea*.
Placopsilina confusa Cushman, 1920.
Rare in deep sea*.
Portatrochammina challengeri Brönnimann andWhittaker, 1988.
Rare in deep sea*.
Reophax bilocularis Flint, 1899**.
Shallow infaunal (Kuhnt et al. 2000). Sea floororganic flux 0.1-90 g m2 yr-1 (Altenbach et al.1999).
Reophax dentaliniformis Brady, 1881.
Rare in deep fjord and deep sea*. Shallow infaunal(Kuhnt et al. 2000). Sea floor organic flux 0.8-90 gm2 yr-1 (Altenbach et al. 1999).
Trochammina subturbinatus Cushman, 1920. Fig-ure 19.19, 20**.
Other authors may have called this T. inflata indeep sea samples. The umbilical opening seemsto get deeper as the individuals grow larger and thelater chambers become more globular. Some havea kummerform final chamber. This form appears tobe distinct from T. pseudoinflata Scott and Vilks,1991 from the Arctic Ocean.
Trochamminella siphonifera Cushman, 1943
Rare in deep sea*.
ACKNOWLEDGEMENTS
JWM thanks the University of Southamptonfor research facilities and the Natural HistoryMuseum, London, for long-term visitor status,which allows access to their facilities, collectionsand libraries. Thanks also to C. Jones for his helpwith access to the foraminiferal collections. Part ofthis study was carried out during the tenure of aLeverhulme Emeritus Fellowship (JWM). We thankT. Cedhagen (Aarhus University, Denmark) for pro-viding reference material from the Höglund Collec-tion. The NERC Earth Observation DataAcquisition and Analysis Service, NEODAAS,Plymouth, is thanked for supplying satellite imag-ery of primary production. JWM thanks BarryMarsh (Southampton) for introducing him to thebasics of Photoshop.
REFERENCES
Alexandersson, E.T. 1979. Marine maceration of skeletalcarbonates in the Skagerrak, North Sea. Sedimentol-ogy, 26:845-852.
34

PALAEO-ELECTRONICA.ORG
Altenbach, A.V., Pflaumann, U, Schiebel, R, Thies, A.,Timm, S., and Trauth, M. 1999. Scaling percentagesand distributional patterns of benthic foraminiferawith flux rates of organic carbon. Journal of Foramin-iferal Research, 29:173-185.
Alve, E. 1990. Variations in estuarine foraminiferal biofa-cies with diminishing oxygen conditions in Dram-mensfjord, southeast Norway, pp. 661-694. InHemleben, C., Kaminski, M.A., Kuhnt, W., and Scott,D.B. (eds.), Palaeoecology, Biostratigraphy, Palae-oceanography, and Taxonomy of Agglutinated Fora-minifera. Kluwer, Dordrecht.
Alve, E. 1995. Benthic foraminiferal distribution andrecolonization of formerly anoxic environments inDrammensfjord, southern Norway. Marine Micropale-ontology, 25:169-185.
Alve, E. 1996. Benthic foraminiferal evidence of environ-mental change in the Skagerrak over the past sixdecades. NGU Bulletin, 430:85-93.
Alve, E. 2010. Benthic foraminiferal responses toabsence of fresh phytodetritus: A two year experi-ment. Marine Micropaleontolology, 76: 67-75.
Alve, E. and Goldstein, S.T. 2010. Dispersal, survivaland delayed growth of benthic foraminiferalpropagules. Journal of Sea Research, 63:36-51.
Alve, E. and Husum, K. 2006. Foraminifera. In Effekterav oksygensvikt på fjordfauna Fisken og Havet, no. 32006, p. 71-86 (ISSN 0071-5638).
Alve, E. and Murray, J.W. 1994. Ecology and taphonomyof benthic foraminifera in a temperate mesotidal inlet.Journal of Foraminiferal Research, 24:18-27.
Alve, E. and Murray, J.W. 1995a. Experiments to deter-mine the origin and palaeoenvironmental significanceof agglutinated foraminiferal assemblages. In Kamin-ski, M.A., Geroch, S. and Gasiński, M.A. (eds.). Pro-ceedings of the Fourth International Workshop onAgglutinated Foraminifera, Kraków, Poland. Grzy-bowski Foundation Special Publication, 3:1-11.
Alve, E. and Murray, J.W. 1995b. Benthic foraminiferaldistribution and abundance changes in Skagerraksurface sediments: 1937 (Höglund) and 1992/1993data compared. Marine Micropaleontology, 25:269-288.
Alve, E. and Murray, J.W. 1997. High benthic fertility andtaphonomy of foraminifera: a case study of theSkagerrak, North Sea. Marine Micropaleontology,31:157-175.
Alve, E., and Murray, J.W. 1999. Marginal marine envi-ronments of the Skagerrak and Kattegat: a baselinestudy of living (stained) benthic foraminiferal ecology.Palaeogeography, Palaeoclimatology, Palaeoecology,146:171-193.
Alve, E. and Murray, J.W. 2001. Temporal variability invertical distributions of live (stained) intertidal fora-minifera, southern England. Journal of ForaminiferalResearch, 31:12-24.
Alve, E. and Nagy, J. 1986. Estuarine foraminiferal distri-bution in Sandebukta, a branch of the Oslo Fjord.Journal of Foraminiferal Research, 16:261-284.
Alve, E. and Nagy, J. 1990. Main features of foraminiferaldistribution reflecting estuarine hydrography in OsloFjord. Marine Micropaleontology, 16:181-206.
Alve, E., Murray, J.W., and Skei, J. 2011. Deep-sea ben-thic foraminifera, carbonate dissolution, and speciesdiversity in Hardangerfjord, Norway: an initial assess-ment. Estuarine, Coastal and Shelf Science, 92:90-102.
Anderson, H.V. 1953. Two new species of Haplophrag-moides from the Louisiana coast. Contributions fromthe Cushman Foundation for ForaminiferalResearch, 4:21-22.
Anschutz, P., Jorissen, F.J., Chaillou, G., Abu-Zeid, R.,and Fontanier, C. 2002. Recent turbidite depositionin the eastern Atlantic: early diagenesis and bioticrecovery. Journal of Marine Research, 60:835-854.
Atkinson, K. 1969. The association of living foraminiferawith Algae from the littoral zone, south Cardigan Bay.Journal of Natural History, 3:517-542.
Banner, F.T., Simmons, M.D., and Whittaker, J.E. 1991.The Mesozoic Chrysalidinidae (Foraminifera, Textu-lariacea) of the Middle East: the Redmond (Aramco)taxa and their relatives. Bulletin of the BritishMuseum Natural History (Geology), 47:101-152.
Barmawidjaja, D.M., Jorissen, F.J., Puskaric, S., and Vander Zwaan, G.J. 1992. Microhabitat selection by ben-thic foraminifera in the northern Adriatic Sea. Journalof Foraminiferal Research, 22:297-317.
Berger, W.H., Fischer, K., Lai, C., and Wu, G. 1988.Ocean carbon flux: global maps of primary produc-tion and export production, pp. 131-176. In Agegiam,C.R. (ed.), Biogeochemical cycling and fluxesbetween the deep euphotic zone and other oceanicrealms. NOAA National Undersea Research Pro-gram, Research Reports 88 (1).
Berkeley, A., Perry, C.T., Smithers, S.G., Horton, B.P.,and Taylor, K.G. 2007. A review of the ecological andtaphonomic controls on foraminiferal assemblagedevelopment in intertidal environments. Earth-Sci-ence Reviews, 83:205-230.
Bernhard, J.M., Sen Gupta, B.K., and Borne, P.F. 1997.Benthic foraminiferal proxy to estimated dysaerobicbottom-water oxygen concentrations: Santa BarbaraBasin, US Pacific continental margin. Journal of For-aminiferal Research, 27:301-310.
Brady, H.B. 1870. Analysis and descriptions of the fora-minifera. Annals and Magazine of Natural History,series 4, 6:273-309.
Brady, H. B. 1878. On the reticularian and radiolarianRhizopoda (Foraminifera and Polycystina) of theNorth-Polar Expedition of 1875-1876. Annals andMagazine of Natural History, series 5, 1:433.
Brady, H.B. 1879. Notes on some of the reticularianRhizopoda of the “Challenger” Expedition. Part 1. Onnew or little known arenaceous types. Quarterly Jour-nal of Microscopical Science, new series, 19:20-63.
35

MURRAY AND ALVE: AGGLUTINATED FORAMINIFERA
Brady, H.B. 1881. Notes on some of the reticularianRhizopoda of the Challenger Expedition. Part III.Quarterly Journal of Microscopical Science, newseries, 19:261-299.
Brady, H.B. 1882. Report on the foraminifera. In Tizard,S. and Murray, J. Exploration of the Faräo Channelduring the summer of 1880, in Her Majesty’s hiredship “Knight Errant”. Proceedings of the Royal Soci-ety of Edinburgh, 11:715.
Brady, H.B. 1884. Report on the foraminifera dredged byH.M.S. Challenger during the years 1873-1876.Report on the scientific results of the voyage ofH.M.S. Challenger during the years 1873-1876, Zool-ogy, 9: 1-800.
Brönnimann, P., Lutze, G.F., and Whittaker, J.E. 1989.Balticammina pseudomacrescens, a new brackishwater trochamminid from the western Baltic Sea, withremarks on the wall structure. Meyniana, 41:167-177.
Brönnimann, P. and Whittaker, J.E. 1983. A lectotype forDeuterammina (Deuterammina) rotaliformis (Heron-Allen and Earland) and new trochamminids from E.Ireland (Protozoa: Foraminiferida). Bulletin of theBritish Museum (Natural History) (Zoology), 45:347-358.
Brönnimann, P. and Whittaker, J.E. 1987. A revision ofthe foraminiferal genus Adercotryma Loeblich andTappan, with a description of A. wrighti sp. nov. fromBritish waters. Bulletin of the British Museum of Natu-ral History (Zoology), 52 (1):19-28.
Brönnimann, P. and Whittaker, J.E. 1988. The Trocham-minacea of the Discovery Reports. British Museum(Natural History), London. 152 pp.
Brönnimann, P. and Whittaker, J.E. 1990. Revision of theTrochamminacea and Remaneicacea of the Plym-outh District, SW England, described by Heron-Allenand Earland (1930). In Hemleben, C., Kaminski,M.A., Kuhnt, W., and Scott, D.B. (eds.), Paleoecol-ogy, Biostratigraphy, Paleoceanography and Taxon-omy of Agglutinated Foraminifera. NATO ASI SeriesC, 327:105-137.
Brönnimann, P. and Zaninetti, L. 1984. Agglutinated fora-minifera mainly Trochamminacea from the Baia deSepetiba, near Rio de Janeiro, Brazil. Revue dePaléobiologie, Généve, 3:63-115.
Castignetti, P. and Hart, M.B. 2000. Technitella (Norman,1878) from Plymouth South, South Devon, UK. InHart, M.B., Kaminski, M.A., and Smart, C. W. (eds.),Proceedings of the Fifth International Workshop onAgglutinated Foraminifera. Gryzbowski FoundationSpecial Publication, 7:81-88.
Chaster, G.W.1892. Report upon the foraminifera of theSouthport Society of Natural Sciences District. FirstReport Southport Society of Natural Science (1890-1891), appendix, 54-72.
Christiansen, B.O. 1958. The foraminifer fauna in theDröbak Sound in the Oslo Fjord (Norway). Nytt Magasin for Zoologi, 6:5-91.
Clarke, K.R. and Gorley, R.N. 2006. Primer v6: usermanual/tutorial. Primer-E Ltd.
Corner, G.D., Steinsund, P.I., and Aspeli, R. 1996. Distri-bution of recent benthic foraminifera in a subarcticfjord-delta: Tana, Norway. Marine Geology, 134:113-125.
Culver, S.J., Woo, H.J., Oertel, G.F., and Buzas, M.A.1996. Foraminifera of coastal environments, Virginia,U.S.A.: distribution and taphonomy. Palaios, 11:459-486
Cushman, J.A. 1910. A monograph of the foraminifera ofthe North Pacific Ocean. Part I. Astrorhizidae andLituolidae. Bulletin of the United States NationalMuseum, 71(1):1-134.
Cushman, J.A. 1911. A monograph of the foraminifera ofthe North Pacific Ocean. Part II. Textulariidae. Bulle-tin of the United States National Museum, 71(2):1-108.
Cushman, J.A. 1920. Foraminifera of the Atlantic Ocean,Part 2. Lituolidae. Bulletin of the United StatesNational Museum, 104(2):1-143.
Cushman, J.A. 1922. Foraminifera of the Atlantic Ocean,Part 3. Textulariidae. Bulletin of the United StatesNational Museum, 104(3):1-143.
Cushman, J.A. 1943. A new genus of the Trochammini-dae. Contributions from the Cushman Laboratory forForaminiferal Research, 19:95-96.
Cushman, J.A. and Brönnimann, P. 1948. Some newgenera and species of foraminifera from brackishwater of Trinidad. Contributions from the CushmanLaboratory for Foraminiferal Research, 24:15-21.
De Rijk, S. 1995. Salinity control on the distribution ofsalt marsh foraminifera (Great Marshes, Massachu-setts). Journal of Foraminiferal Research, 25:156-166.
De Rijk, S. and Troelstra, S.R. 1999. The application of aforaminiferal actuo-facies model to salt-marsh cores.Palaeogeography, Palaeoclimatology, Palaeoecol-ogy, 149:59-66.
Earland, A. 1933. Foraminifera. Part II. South Georgia.Discovery Reports, 7:27-138.
Earland, A. 1934. Foraminifera. Part III. The Falklandssector of the Antarctic (excluding South Georgia).Discovery Reports, 10:1-208.
Ernst, S.R., Duijnstee, I.A.P., Jannink, N.T., and Van derZwaan, G.J. 2000. An experimental mesocosm studyof microhabitat preferences and mobility in benthicforaminifera: preliminary results. In Hart, M.B.,Kaminski, M.A., and Smart, C.W. (eds.), Proceedingsof the Fifth International Workshop on AgglutinatedForaminifera. Gryzbowski Foundation Special Publi-cation, 7:101-104.
Exon, N. 1972. Sedimentation in the outer FlensburgFjord area (Baltic Sea) since the last glaciation.Meyniana, 22:5-62.
36

PALAEO-ELECTRONICA.ORG
Fatela, F., Moreno, J, Moreno, F., Araújo, M., Valente, T.,Autunes, C., Taborda, R., Andrade, C., and Fisher,R.A., Corbet, A.S., and Williams, C.B. 1943. Therelationship between the number of species and thenumber of individuals in a random sample of an ani-mal population. Journal of Animal Ecology, 12:42-58.
Fisher, R.A., Corbet, A.S. and Williams, C.B. 1943. Therelationship between the number of species and thenumber of individuals in a random sample of an ani-mal population. Journal of Animal Ecology, 12:42-58.
Flint, J.M.1899. Recent foraminifera. A descriptive cata-logue of specimens dredged by the U.S. Fish Com-mission Steamer Albatros. Report of the UnitedStates National Museum for 1897: 249-349.
Fontanier, C., Jorissen, F.J., Chaillou, G., David, C.,Anschutz, P., and Lafon, V. 2003. Seasonal and inter-annual variability of benthic foraminiferal faunas at550 m depth in the Bay of Biscay. Deep-SeaResearch I, 50:457-494.
Freiwald, A. 1995. Bacteria-induced carbonate degrada-tion: a taphonomic case study of Cibicides lobatulusfrom a high-boreal setting. Palaios,10:337-346.
Garcia, R., Koho, K.A., De Stigter, H.C., Epping, E., Kon-ing, E., and Thomsen, L. 2007. Distribution of meiob-enthos in the Nazaré Canyon and adjacent openslope (western Iberian margin) in relation to sedimen-tary composition. Marine Ecology Progress Series,340:207-220.
Goës, A. 1896. The Foraminifera XX. Report of thedredging operations off the west coast of CentralAmerica to the Galapagos, to the west of mexico,and in the Gulf of California, in charge of AlexanderAgassiz, carried on by the U.S. Fish CommissionSteamer “Albatros” during 1891, Lieut. CommanderZ.L. Tanner, U.S.N., commanding. Bulletin of theMuseum of Comparative Zoology at Harvard Col-lege, 29:1-103.
Gooday, A.J. 1986. Meiofaunal foraminiferans from thebathyal Porcupine Seabight (north east Atlantic); sizestructure, standing stock, taxonomic composition,species diversity and vertical distribution in the sedi-ment. Deep-Sea Research, 33:1345-1373.
Gooday, A.J. 1988. Response by benthic foraminifera tophytodetritus in the deep-sea. Nature, 332: 70-73.
Gooday, A.J. 1990. Recent deep-sea agglutinated fora-minifera: a brief review, pp. 271-304. In Hemleben,C., Kaminski, M.A., Kuhnt, W., and Scott, D.B. (eds.),Palaeoecology, Biostratigraphy, Palaeoceanogra-phy, and Taxonomy of Agglutinated Foraminifera.Kluwer, Dordrecht, 271-304.
Green, M.A., Aller, R.C., and Aller, J.Y. 1993. Carbonatedissolution and temporal abundances of foraminiferain Long Island Sound sediments. Limnology andOceanography, 38:331-345.
Habura, A., Wegener, L., Travis, J.L., and Bowser, S.S.2005. Structural and functional implications of anunusual foraminiferal β-tubulin. Molecular Biologyand Evolution, 22:2000-2009.
Hald, M. and Steinsund, P.I. 1996. Distribution of surfacesediment benthic foraminifera in southwestern Bar-ents Sea. Journal of Foraminiferal Research, 22:347-362.
Hayek, L.A.C. and Buzas, M.A.1997. Surveying NaturalPopulations. New York, Columbia University Press,563 pp.
Haynes, J.R. 1973. Cardigan Bay recent foraminifera(cruises of the R.V.Antur, 1962-1964). BritishMuseum (Natural History), Zoology Supplement,4:25-27.
Heron-Allen, E. and Earland, A. 1911. On the recent andfossil foraminifera of the shore-sands of Selsey Bill,Sussex; Part VII. Journal of the Royal MicroscopicalSociety, 1911:309.
Heron-Allen, E. and Earland, A. 1912. On some foramin-ifera from the North Sea, etc., dredged by the Fisher-ies Cruiser “Goldseeker” (International North SeaInvestigations - Scotland). I. On some new Astrorhiz-idae and their shell-structure. Journal of the RoyalMicroscopical Society, London, 1912:382-389.
Heron-Allen, E. and Earland, A. 1916. The foraminiferaof the west of Scotland. Transactions of the LinneanSociety, Zoology, series 2, 11:224.
Höglund, H. 1947. Foraminifera in the Gullmar Fjord andSkagerrak. Zoologiska bidrag från Uppsala, 26:1-328.
Höglund, H. 1948. New names for four homonym spe-cies described in ‘Foraminifera in the Gullmar Fjordand the Skagerak’. Contributions from the CushmanLaboratory of Foraminiferal Research, 24:45-46.
Horne, D.J., Smith, R.J., Whittaker, J.E., and Murray,J.W. 2004. The first British record of a new species ofthe superfamily Terrestricytheroidea (Crustacea,Ostracoda): morphology, ontogeny, lifestyle and phy-logeny. Zoological Journal of the Linnean Society,142:253-288.
Humphreys, J. 2005. Salinity and tides in Poole Harbour:estuary or lagoon? In Humphreys, J. and May, V.(eds.), 2005. The ecology of Poole Harbour. Pro-ceedings in Marine Science, 7:35-47.
Jonasson, K.E. and Patterson, R.T. 1992. Preservationpotential of salt marsh foraminifera from the FrazerRiver delta, British Columbia. Micropaleontology,38:289-301.
Jones, R.W. and Charnock, M.A. 1985. “Morphogroups”of agglutinating foraminifera. Their life positions andfeeding habits and potential applicability in(paleo)ecological studies. Revue de Paléobiologie,4:311-320.
Jones, T.R. and Parker, W.K. 1860. On the Rhizopodalfauna of the Mediterranean, compared with that ofthe Italian and some other Tertiary deposits. Quar-terly Journal of the Geological Society, London,16:292-307.
37

MURRAY AND ALVE: AGGLUTINATED FORAMINIFERA
Kaminski, M.A., Kuhnt, W., and Moullade, M. 1999.Theevolution and paleobiogeography of abyssal aggluti-nated foraminifera since the Early Cretaceous: a taleof four faunas. Neues Jahrbuch für Geologie undPaläontologie-Abhandlungen, 212, 401-439.
Kiaer, H. 1900. Synopsis of the Norwegian Thalamo-phora. Norwegian North Atlantic Expedition 1876-78,7:1-13.
Koho, K.A., Kouwehhoven, T.J., De Stigter, H.C., andVan der Zwaan, G.J. 2007. Benthic foraminifera inthe Nazaré Canyon, Portuguese continental margin:sedimentary environments and disturbance. MarineMicropalaeontology, 66:27-51,
Kolstad, S. 1973. Vurdering av fjordresipienter i Farsundkommune. NIVA Report OR-0531, 16 pp.
Kuhnt, W., Collins, E., and Scott, D.B. 2000. Deep wateragglutinated foraminiferal assemblages across theGulf stream: distribution patterns and taphonomy. InHart, M.B., Kaminski, M.A., and Smart, C.W. (eds.),Proceedings of the Fifth International Workshop onAgglutinated Foraminifera. Gryzbowski FoundationSpecial Publication, 7:261-298.
Lee, A.J. and Ramster, J.W. 1981. Atlas of the Seasaround the British Isles. Ministry of Agriculture, Fish-eries and Food, Lowestoft, England.
Linke, P. 1989. Lebendbeobachtungen und Untersuc-hungen des Energiestoffwechsels benthischer Fora-miniferen aus dem Euorpäischen Nordmeer. BerichteSondersforschungsbereich 313, Universität Kiel No.18:1-123.
Lloyd, J.M. and Evans. J.R. 2002. Contemporary andfossil foraminifera from isolation basins in northwestScotland. Journal of Quaternary Science, 17:431-443.
Loeblich, A.R. and Tappan, H. 1987. Foraminiferal Gen-era and their Classification. New York, Van NostrandReinhold Company, 970 pp.
Majewski, W. and Zajączkowski, M. 2007. Benthic fora-minifera in Adventfjorden, Svalbard: last 50 years oflocal hydrographic changes. Journal of ForaminiferalResearch, 37:107-124.
Montagu, G. 1808. Testacea Britannica; supplement. 183pp.
Montfort, P.D. 1808. Conchyliologie Systématique etClassification Méthodique des Coquilles, 1:1-409.
Moreno, J., Valente, T., Moreno, F., Fatela, F., Guise, L.,and Patinhua, C. 2007. Occurrence of calcareousforaminifera and calcite-carbonate equilibrium condi-tions – a case study in Minho/Coura estuary (North-ern Portugal). Hydrobiologia, 587:177-184.
Murray, J.W. 1967. Transparent and opaque foramin-iferal tests. Journal of Paleontology, 41:791.
Murray, J.W. 1968. The living Foraminiferida ofChristchurch Harbour, England. Micropaleontology,14:83-96.
Murray, J.W. 1970. Foraminifers of the WesternApproaches to the English Channel. Micropaleontol-ogy, 16: 471-85.
Murray, J.W. 1979. Recent benthic foraminiferids of theCeltic Sea. Journal of Foraminiferal Research, 9:193-209.
Murray, J.W. 1980. The foraminifera of the Exe estuary.Devonshire Association Special Publication, 2:89-115.
Murray, J.W. 1983. Population dynamics of benthic fora-minifera: results from the Exe Estuary, England.Journal of Foraminiferal Research, 13:1-12.
Murray, J.W. 1985. Recent Foraminifera from the NorthSea (Forties and Ekofisk areas) and the continentalshelf west of Scotland. Journal of Micropalaeontol-ogy, 4:117-125.
Murray, J.W. 1986. Living and dead Holocene foramin-ifera of Lyme Bay, southern England. Journal of For-aminiferal Research, 16:347-352.
Murray, J.W. 1989. Syndepositional dissolution of calcar-eous foraminifera in modern shallow-water sedi-ments. Marine Micropaleontology, 15:117-121.
Murray, J.W. 1992. Distribution and population dynamicsof benthic foraminifera from the southern North Sea.Journal of Foraminiferal Research, 22:114-128.
Murray, J.W. 2003a. An illustrated guide to the benthic for-aminifera of the Hebridean shelf, west of Scotland,with notes on their mode of life. Palaeontologia Elec-tronica, 5, issue 2, art. 1: 31 pp., 1.4 Mb. http://www.nhm.ac.uk/hosted_sites/pe/2002_2/guide/issue2_02.htm
Murray, J.W. 2003b. Foraminiferal assemblage formationin depositional sinks on the continental shelf marginwest of Scotland. Journal of Foraminiferal Research,33:101-121.
Murray, J.W. 2006. Ecology and applications of benthicforaminifera. Cambridge University Press, 426pp.
Murray, J.W. and Alve, E. 1993. The habitat of the fora-minifer Paratrochammina (Lepidoparatrochammina)haynesi. Journal of Micropalaeontology, 12:34.
Murray, J.W. and Alve, E. 1994. High diversity aggluti-nated foraminiferal assemblages from the NE Atlan-tic: dissolution experiments. Cushman FoundationSpecial Publication, 32:33-51.
Murray, J.W. and Alve, E. 1999a. Natural dissolution ofshallow water benthic foraminifera: taphonomiceffects on the palaeoecological record. Palaeogeog-raphy, Palaeoclimatology, Palaeoecology, 146:195-209.
Murray, J.W. and Alve, E. 1999b. Taphonomic experi-ments on marginal marine foraminiferal assem-blages: how much ecological information ispreserved? Palaeogeography, Palaeoclimatology,Palaeoecology, 149:183-197.
Murray, J.W. and Alve, E. 2000a. Do calcareous domi-nated shelf foraminiferal assemblages leave worth-while ecological information after their dissolution? InHart, M., Kaminski, M.A., and Smart, C. (eds.), Pro-ceedings of the Fifth International Workshop onAgglutinated Foraminifera, Plymouth England, Sep-tember 1997. Grzybowski Foundation Special Publi-cation no. 7:311-331.
38

PALAEO-ELECTRONICA.ORG
Murray, J.W. and Alve, E. 2000b. Major aspects of fora-miniferal variability (standing crop and biomass) on amonthly scale in an intertidal zone. Journal of Fora-miniferal Research, 30:177-191.
Murray, J.W. and Pudsey, C. 2004. Living (stained) anddead foraminifera from the newly ice-free Larsen IceShelf, Weddell Sea, Antarctica: ecology and taphon-omy. Marine Micropaleontology, 53:67-81.
Murray, J.W. and Wright, C.A. 1970. Surface textures ofcalcareous foraminiferids. Palaeontology, 13:184-187.
Murray, J.W., Alve, E., and Cundy, A. 2003. The origin ofmodern agglutinated foraminiferal assemblages: evi-dence from a stratified fjord. Estuarine, Coastal andShelf Science, 58:677-697.
Nagy, J., Hess, S., and Alve, E. 2010. Environmental sig-nificance of foraminiferal assemblages dominated bysmall-sized Ammodiscus and Trochammina in Trias-sic and Jurassic delta-influenced deposits. Earth-Sci-ence Reviews, 99:31-49.
Nomaki, H., Yamaoka, A., Shirayama, Y., and Kitazato,H. 2007. Deep-sea benthic foraminiferal respirationrates measured under laboratory conditions. Journalof Foraminiferal Research, 37:281-286.
Norman, A.M. 1826. Museum Normanianum, Durham,England, part 7-8:17.
Norman, A.M. 1878. The genus Halyphysema with adescription of several forms apparently allied to it.Annals and Magazine of Natural History, series 5,1:265-287.
North Sea Task Force 1993. North Sea Subregion 8Assessment Report. State Pollution Control Author-ity, (SFT):1-79.
Olsson, I. 1976. Distribution and ecology of the foramin-iferan Ammotium cassis (Parker) in some Swedishestuaries. Zoon, 4:137-147.
Parr, W.J. 1950. Foraminifera. Reports B.A.N.Z. Antarc-tic Research Expedition 1929-1931, series B (Zool-ogy, Botany), 5(6):232-392.
Parker, W.K. 1870. In Dawson, G.M. On the foraminin-ifera of the Gulf and River St. Lawrence. CanadianNaturalist and Quarterly Journal of Science, newseries, 5:172-177.
Parker, W.K. and Jones, T.R. 1865. On some foramin-ifera from the North Atlantic and Arctic Oceans,including Davis Straits and Baffin Bay. PhilosophicalTransactions of the Royal Society, 155:325-441.
Patterson, R.T. 1990. Intertidal benthic foraminiferal bio-facies on the Frazer River Delta, British Columbia:modern distribution and paleoecological importance.Micropalaeontology, 36:229-244.
Peebles, M.W. and Lewis, R.D. 1991. Surface textures ofbenthic foraminifera from San Salvador, Bahamas.Journal of Foraminiferal Research, 21:285-292.
Reaves, C.M. 1986. Organic matter metabolizability andcalcium carbonate dissolution in nearshore marinemuds. Journal of Sedimentary Petrology, 56:486-494.
Rhumbler, L. 1931. In Drygalski, E. Von, Deutsche Süd-polar-Expedition 1901-1903, 20 (Zoologie 12):82.
Rhumbler, L. 1938. Foraminiferen aus dem Meeressandvon Helgoland, gesammelt von A. Remane Kiel).Kieler Meeresforschungen, 2:157-222.
Robertson, D. 1891. Trochammina bradyi, n.n. Annalsand Magazine of Natural History, series 6, 7:388.
Rygg, B., Green, N., Molvær, J., and Næs, K. 1987.Grenlandsfjordene og Skienselva 1986. NIVAovervåkningsrapport nr. 287/87, 91 pp.
Saelen, O.H. 1967. Some features of the hydrography ofNorwegian fjords, pp. 63-71. In Lauff, G.H. (ed.),Estuaries. American Association for the Advance-ment of Science, Washington. Publication 83.
Sars, M. 1868. Fortsatte bemaerkninger over det dyriskelivs udbredning i havets dybder. Forhandliner I Viden-skasselskabet i Kristiania: 246-275.
Sars, G.O., 1872. Undersøgelser over Hardangerf-jordens Fauna. Forhandlinger i Videnskasselskabet iKristiania, 1871:246-286.
Schafer, C.T. and Cole, F.E. 1986. Reconnaissance sur-vey of benthonic foraminifera from Baffin Island fjordenvironments. Arctic, 39:232-239.
Schafer, C.T. and Cole, F.E. 1982. Living benthic fora-minifera distributions on the continental slope andrise east of Newfoundland, Canada. Geological Soci-ety of America Bulletin 93:207-217.
Schafer, C.T., Cole, F.E., and Carter, L. 1981. Bathyalzone benthic foraminiferal genera off northeast New-foundland. Journal of Foraminiferal Research,11:296-313.
Schmiedl, G., Mackensen, A., and Müller, P.J. 1997.Recent benthic foraminifera from the eastern SouthAtlantic Ocean: dependence on food supply andwater masses. Marine Micropaleontology, 32:249-287.
Schönfeld, J. 1997. The impact of Mediterranean Out-flow Water (MOW) on benthic foraminiferal assem-blages and surface sediments at the southernPortuguese margin. Marine Micropaleontology,29:211-236.
Schröder, C.J. 1988. Subsurface preservation of aggluti-nated foraminifera in the northwest Atlantic Ocean.Abhandlungen der geologischen Bundesantstalt,41:325-336.
Schultze, F.E. 1875. Zoologische Ergebnisse der Nord-seefahrt, vom Juli bis September, 1872. I.Rhizopoden. II. Jahreberichte Kommission zur Unter-suchungen der Deutschen Meer in Kiel für die Jahr1872, 1873: 99-114.
Scott, D.B. and Vilks, G. 1991. Benthonic foraminifera inthe surface sediments of the deep-sea Arctic Ocean.Journal of Foraminiferal Research, 21:20-38.
39

MURRAY AND ALVE: AGGLUTINATED FORAMINIFERA
Scott, D., Gradstein, F., Schafer, C., Miller, A., and Wil-liamson, M. 1983. The recent as a key to the past:does it apply to agglutinated foraminiferal assem-blages? Proceedings of the First Workshop on Aren-aceous Foraminifera, 7-9 September 1981.Continental Shelf Institute, Norway, Publication108:147-157.
Seiglie, G.A. 1964. Algunos foraminiferos arenáceosrecientes de Venezuela. Boletin del Instituto Ocean-ográfico Univeridad de Oriente, Cumana, 3:5-14.
Shannon, C.E. 1948. A mathematical theory of commu-nication. Bell System Technical Journal, 27:379-423;623-656.
Siddall, J.D. 1886. Report on the foraminifera of the Liv-erpool Marine Biology Committee District. Proceed-ings of the Literary and Philosophical Society,Liverpool, 40 appendix:42-71.
Skinner, H.C 1961. Revision of Proteonina difflugiformis.Journal of Paleontology, 35:1239.
Terquem, O. 1876. Essai sur le classement des animauxqui vivent sur la plage et dans les environs de Dun-querque. Fascicule 2: 55-100.
Tilstone, G.H., Smyth, T.J., Martinez-Vincente, V., andGroom, S. 2005. Inherent optical properties of theIrish Sea and their effect on satellite primary produc-tion algorithms. Journal of Plankton Research,27:1127-1148.
Timm, S. 1992. Rezente Tiefsee-Benthosforaminiferenaus Oberflächen-edimenten des Golfes von Guinea(Westafrika) – Taxonomie, Verbreitung, Ökologie undKorngrößenfraktionen. Berichte – Reports, Geolo-gisch-Paläontologisches Institut Universitet Kiel, 59:1-155.
Van der Zwaan, G.J., Duinstee, I.A.P., Dulk, M. Den,Ernst, S.R., Jannink, N.T., and Kouwenhoven,T.J.1999. Benthic foraminifers: proxies or problems? Areview of paleoecological concepts. Earth-ScienceReviews, 46:213-236.
Walter, L.M. and Burton, E.A. 1990. Dissolution of recentplatform carbonate sediments in marine pore fluids.American Journal of Science, 290:601-643.
Williamson, W.C. 1858. On the Recent Foraminifera ofGreat Britain. Ray Society, 107 pp.
Williamson, M.A., Keen, C.E.. and Mudie, P.J.1984. For-aminiferal distribution on the continental shelf offNova Scotia, Marine Micropaleontology, 9:219-239.
Wollenburg, J.E. and Kuhnt, W. 2000. The response ofbenthic foraminifers to carbon flux and primary pro-duction in the Arctic Ocean. Marine Micropaleontol-ogy, 40:189-231.
Wright, J. 1891. Report on the foraminifera obtained offthe south-west of Ireland during the cruise of the “Fly-ing Falcon”, 1888. Proceedings of the Royal IrishAcademy, series 3, 1:460-502.
40

PALAEO-ELECTRONICA.ORG
APPENDICES
Appendix 1. Data on foraminiferal abundance and envi-ronmental variables in brackish marginal marine environ-ments presented in PDF format online).
Appendix 2. Data on foraminiferal abundance and envi-ronmental variables in fjord and normal marine environ-ments (presented in PDF format online).
41