palacio nacional 11 septiembre 2007 february 2010 mexico 2010 economic recovery: opportunities...
TRANSCRIPT

Palacio Nacional 1111
Septiembre 2007Septiembre 2007February 2010
Mexico 2010
Economic Recovery: Opportunities
Between Japan and Mexico

Palacio Nacional 22
Mexico’s Economy
GDP and Industrial Production:Mexico and U.S.
(quarterly % change)
After a complicated 2009, Mexico shows strong recovery signs in synchrony with US industrial activity.
Source: INEGI and Federal Reserve.
-6
-5
-4
-3
-2
-1
0
1
2
3
No
v-0
6
Fe
b-0
7
Ma
y-0
7
Au
g-0
7
No
v-0
7
Fe
b-0
8
Ma
y-0
8
Au
g-0
8
No
v-0
8
Fe
b-0
9
Ma
y-0
9
Au
g-0
9
No
v-0
9
Industrial Output (US)
Industrial Output (Mex)
GDP (Mex)

Palacio Nacional 33
Protection and Recovery of Labor Market (A)
Non Farm Payroll(% change since peak level)
Mexico preserved thousands of employments. Technical Strike Program, it protected thousands of highly-
skilled and export-driven jobs by direct salary-transfers. Temporary Jobs Program, those without work were employed
in community-related jobs. Mexico Business Program, provided greater liquidity for firms
and increased their capacity to create employment.
Source: IMSS.
-12 -10 -8 -6 -4 -2 0 2 4 6 8
10 12 14
-6 -3 0 3 6 9 12 15 18 21 24 27 30 33 36 39 42 45 48 months
Nov 94 Nov 00 Jun 08
Dec 10Nov 04Jan 97
Peak level on:

Palacio Nacional 44
OECD Unemployment Rate(% of labor force in Nov. ‘09)
Technical Strike Program, It protected thousands of highly- skilled and export-driven jobs by direct salary-transfers.
Temporary Jobs Program, those without work were employed in community-related jobs.
Mexico Business Program, provided greater liquidity for firms and increased their capacity to create employment.
Source: OECD and for Mexico in december the source is INEGI.
5.74.8
0
5
10
15
20
25
Sp
ain
Po
rtu
gal
Fra
nce
Un
ited
Sta
tes
Fin
lan
d
Sw
eden
Po
lan
d
Can
ada
Ital
y
Ger
man
y
Bra
zil
Den
mar
k
Lu
xem
bo
urg
Mex
ico
OE
CD
Au
stri
a
Mex
ico
(dec
)
Net
her
lan
ds
OECD Average: 8.8
Protection and Recovery of Labor Market (B)
Mexico preserved thousands of employments.

Palacio Nacional 55
Engines of Economic Recovery
Mexico’s Exports(quarterly % change)
Retail Stores Sales(annual % change)
Mexico’s recovery is supported on a more dynamic external demand. While domestic demand remained stable last year.
Source: INEGI. Source: ANTAD, Mexico’s Stores Association.
1.9
4.3
0
2
4
6
8
10
12
De
c-0
7
Fe
b-0
8
Ap
r-0
8
Ju
n-0
8
Au
g-0
8
Oc
t-0
8
De
c-0
8
Fe
b-0
9
Ap
r-0
9
Ju
n-0
9
Au
g-0
9
Oc
t-0
9
De
c-0
9
All Retail Stores
Supermarkets
15.7
12.7
-24
-20
-16
-12
-8
-4
0
4
8
12
16
De
c-0
6
Ma
r-0
7
Ju
n-0
7
Se
p-0
7
De
c-0
7
Ma
r-0
8
Ju
n-0
8
Se
p-0
8
De
c-0
8
Ma
r-0
9
Ju
n-0
9
Se
p-0
9
De
c-0
9
Total Exports
Manufacturing Exports

Palacio Nacional 66
Outlook on Output
Manufacturing and Services Expectations Index*
(index points)
Industrial and Services sectors are optimistic on production recovery. Private sector expectations are above the expansion level since July 2009.
Source: IMEF. * This index is analogous to the Purchasing Managers Index of the ISM in the US.
42
44
46
48
50
52
54
56
58
De
c-0
6
Ma
r-0
7
Jun
-07
Se
p-0
7
De
c-0
7
Ma
r-0
8
Jun
-08
Se
p-0
8
De
c-0
8
Ma
r-0
9
Jun
-09
Se
p-0
9
De
c-0
9
Manufacturing Index
Services Index
Ex
pa
ns
ion
Co
ntr
acti
on

Palacio Nacional 77
Several indicators showed the strength of Mexico among emerging markets. Inflation was 3.57% in 2009 and the exchange rate recovered stability.
Macroeconomic Stability
Nominal Exchange Rate(pesos for dollar)
Country Risk: EMBI Global(basis points, average 2009)
Source: JP Morgan.
10
11
12
13
14
15
16
Jan
-08
Ap
r-08
Jul-
08
Oct
-08
Jan
-09
Ap
r-09
Jul-
09
Oct
-09
Jan
-10
Bankruptcy of Lehman Bros.
Inflation(annual % change)
Source: Reuters.Source: Banco de Mexico.
126210 263 306 329
411
1,200
0
200
400
600
800
1,000
1,200
1,400
Ch
ina
Ch
ile
Mex
ico
Bra
zil
Co
lom
bia
Ru
ssia
Arg
entin
a
3.57
2.0
2.5
3.0
3.5
4.0
4.5
5.0
5.5
6.0
6.5
De
c-0
6
Ap
r-0
7
Au
g-0
7
De
c-0
7
Ap
r-0
8
Au
g-0
8
De
c-0
8
Ap
r-0
9
Au
g-0
9
De
c-0
9
Banco de MexicoInflation Target
3.0% +/-1.0%

Palacio Nacional 88Source: Banco de México and SHCP.
Banking System Size(% of GDP)
Mexican Banking System Capitalization(capital to assets ratio, %)
Banking System
The banking sector is strongly capitalized and there is a clear opportunity to increase financial penetration.
15
18
14 14
22
17 16 1513
0
5
10
15
20
25
BB
VA
Ba
nc
om
er
Ba
na
me
x
Sa
nta
nd
er
HS
BC
Inb
urs
a
Sc
oti
ab
an
k
IXE
Azt
ec
a
Afi
rme
Required by regulation=8 System Average=16
21
3442
56
85
108
0
20
40
60
80
100
120
Me
xic
o
Co
lom
bia
Ru
ss
ia
Bra
zil
Ch
ile
Sin
ga
po
re
Source: Banco de México and SHCP.

Palacio Nacional 99
Fostered Investment
Fostered Investment(as % of GDP)
Fostered Investment by Sector in 2010(million dollars)
Infrastructure investment will reach a historical maximum in 2010. It comprises projects in strategic areas to enhance economic development.
Source: SHCP and SCT. e: estimated / a: approved
2.0
2.5
3.0
3.5
4.0
4.5
5.0
5.5
20
00
20
01
20
02
20
03
20
04
20
05
20
06
20
07
20
08
20
09
e
20
10
a
Previous Administration Average: 3.5% (2000-2006)
Source: SHCP and SCT.
47 88326
1,849
3,817 3,904
0500
1,0001,5002,0002,5003,0003,5004,0004,5005,000
Air
po
rts
&
Po
rts
Ra
ilro
ad
s
Infr
as
tru
ctu
re
Pre
pa
rati
on
Wa
ter
Ele
ctr
icit
y
Ro
ad
s
Oil
20,00019,325

Palacio Nacional 1010
Progress on Economic Environment
Mexico has made a major effort to promote an adequate economic environment to foster foreign direct investment.
2.9
2.5
2.
2 2.
1 1.
8 1.
3 0.
9 0.
6 0.
1 0.
0 -0
.1
-0.5
-0
.5
-0.6
-1
.1
-2.0
-2
.0
-2.2
-2
.5
-2.7
-4 -3 -2 -1 0 1 2 3 4
Po
lan
d (
71)
Mex
ico
(41
)T
urk
ey (
67)
Ind
on
esia
(11
4)S
ou
th K
ore
a (3
1)It
aly
(74)
Fra
nce
(64
)G
erm
any
(23)
Jap
an (
19)
Au
stra
lia
(3)
Can
ada
(7)
Ru
ssia
(14
3)S
pai
n (
36)
Ind
ia (
124)
Bra
zil (
113)
Bel
giu
m (
30)
Net
her
lan
ds
(15)
Ch
ina
(140
)U
.K. (
11)
U.S
. (8
)
Economic Freedom Index(changes in score for the 20th largest
economies)
Most Attractive FDI Destinations (ranking position)
Source: AT Kearney. *Gulf States are Bahrein, Kuwait, Omán and Qatar. UAE: United Arab Emirates
Source: The Heritage Foundation.
0
5
1 0
1 5
2 0
2 5
0
5
10
15
20
25
1. C
hin
a
2. U
. S.
3. I
nd
ia
4. B
razi
l
5. G
erm
an
y
6. P
ola
nd
7. A
us
tra
lia
8. M
ex
ico
9. C
an
ad
a
10
. U. K
.
11. U
. A.
E.
12
. Vie
tna
m
13
. Fra
nc
e
14
. Ho
ng
Ko
ng
15
. Gu
lf S
tate
s*
2007
2010

Palacio Nacional 1111
Attractive Manufacturing Costs
Recent studies by international firms showed that manufacturing costs in Mexico are lower than those in Brazil, China or India.
Manufacturing Outsourcing Cost Index(% of producing costs in the US)
100
70
75
80
85
90
95
100
105
110
2005 2006 2007 2008
U.S. (Basis=100)ChinaMexicoBrazilIndia
1 China 1 Mexico2 India 2 India3 Mexico 3 China4 Brazil 4 US5 US 5 Brazil
2005 2008
Change in Manufacturing Cost Ranking
(1 means the lowest cost)
Source: Alix Partners.
Palacio Nacional 1212
-8%
Other1
Labor
FreightCosts
Mexico
307283
China
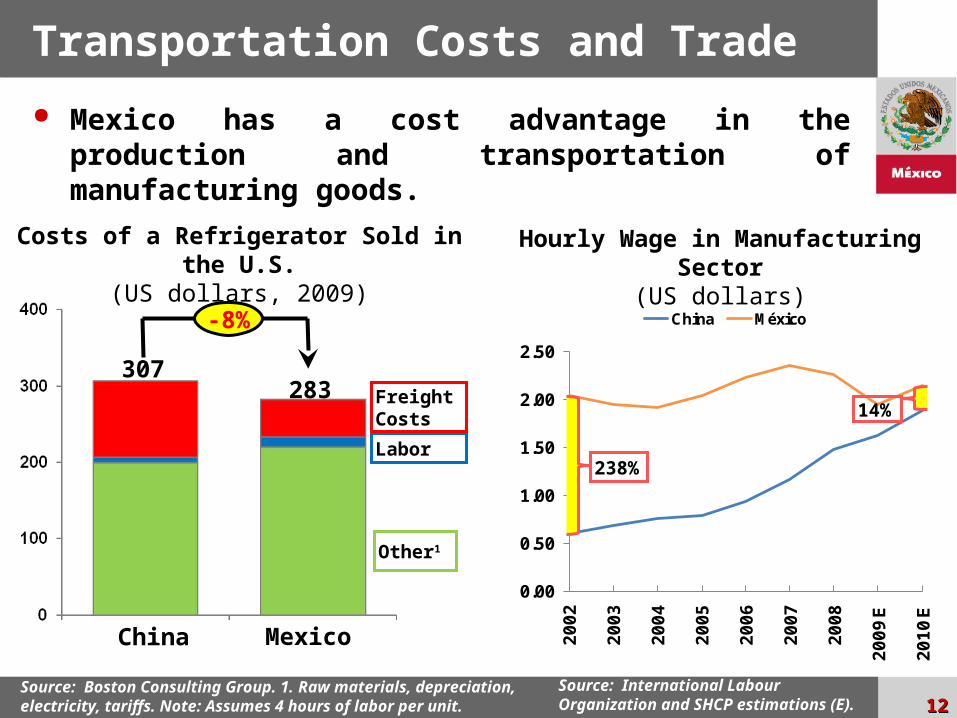
Transportation Costs and Trade
Mexico has a cost advantage in the production and transportation of manufacturing goods.
Costs of a Refrigerator Sold in the U.S.(US dollars, 2009)
Source: Boston Consulting Group. 1. Raw materials, depreciation, electricity, tariffs. Note: Assumes 4 hours of labor per unit.
0.00
0.50
1.00
1.50
2.00
2.50
20
02
20
03
20
04
20
05
20
06
20
07
20
08
20
09
E
20
10
E
China México
Hourly Wage in Manufacturing Sector(US dollars)
238%
14%
Source: International Labour Organization and SHCP estimations (E).

Palacio Nacional 1313
Competitiveness
Operating Costs(index*, higher is more
competitive)
Mexico shows clear opportunities for investment and trade.
Source: Boston Consulting Group / Note:* 1 is the country average of 10 countries and 0 is the worst performance. India is the worst country in two comparatives.
Transportation Costs(index*, higher is more
competitive)
Macroeconomic Stability(index*, higher is more
competitive)
1.2
1.0
0.5
0.00
0.2
0.4
0.6
0.8
1
1.2
1.4
Me
xic
o
Ch
ina
Bra
zil
Ind
ia
1.0
0.8
0.4
0.6
0
0.2
0.4
0.6
0.8
1
1.2
Me
xic
o
Ch
ina
Bra
zil
Ind
ia
1.4
0.50.4
0.00
0.2
0.4
0.6
0.8
1
1.2
1.4
1.6
Me
xic
o
Ch
ina
Bra
zil
Ind
ia

Palacio Nacional 1414
Higher Participation in US Market
The costs and competitiveness advantages have increased the overall market share of Mexico in the US market in 1.0 percentage point.
Mexico’s Share in US Imports of Manufacturing Goods(% of total of imports)
Source: US Census Bureau.
10.4
24.0
17.2
15.1
14.9
12.6
7.6
8.8
7.2
1.0
0.7
2.0
1.4
1.1
1.4
4.3
1.8
1.2
0 5 10 15 20 25 30
Total
Electricity equipment
Transports
Tobacco & drinks
Electronics & computersNon metalic
minerals
Basic metals
Food
Textiles inputs
2008 Level
Gains in 2009

Palacio Nacional 1515
Success Story: Mexico - Japan
Trade between Mexico and Japan increased since 2005 free trade agreement. Manufacturing addressed to the U.S. has been the main engine of such trade growth.
Mexico and Japan Trade(million dollars)
Source: INEGI
0
2,000
4,000
6,000
8,000
10,000
12,000
14,000
16,000
18,000
20,000
19
93
19
94
19
95
19
96
19
97
19
98
19
99
20
00
20
01
20
02
20
03
20
04
20
05
20
06
20
07
20
08
20
09
Imports
Exports
FTA Implementation

Palacio Nacional 1616
Structural Reforms
Two Fiscal Reforms. Increased public revenue and improved the efficiency and transparency of public expenditure.
Public Pensions. Moved from a pay as you go system to individual accounts. It saved for the government an equivalent of 30 percentage points of GDP in the medium term.
Energy Reform. Reformed nation’s oil industry widening Pemex opportunities, the state oil company, and will take advantage of specialized investment and technology in drilling and exploration.
Luz y Fuerza del Centro Liquidation. It reduced taxpayers costs of transferring significant fiscal resources to an electricity company with annual losses of around 4 billion dollars.
Political System Reform. The reform will empower citizenship and improves its involvement in the democratic process.

Palacio Nacional 1717
The Road Ahead
Since the proposal to undertake major reforms in September 2009, progress has been made in the following areas:
Public finance reform.
Improve state-owned enterprises.
Reduction in the regulatory burdens on businesses.
Fight against organized crime.
New generation of political and economic reforms.
Investment in infrastructure.
In addition, we are working to make progress on poverty alleviation, universal health coverage, education quality, telecommunications and labor market reforms.

Palacio Nacional 18181818
Septiembre 2007Septiembre 2007February 2010
Mexico 2010
Economy Recovery: Opportunities
Between Japan and Mexico

Palacio Nacional 19191919
Septiembre 2007Septiembre 2007February 2010
Annexes

Palacio Nacional 2020
Outlook on Industrial Production
Automobile Production(thousands units & annual % change)
Manufacturing and Services Expectations Index1
(index points)
Mexico’s automobile sector is recovering as worldwide demand for vehicles increases. Industrial and Services sectors are optimistic on production recovery.
Source: AMIA
42
44
46
48
50
52
54
56
58
De
c-0
6
Ma
r-0
7
Jun
-07
Se
p-0
7
De
c-0
7
Ma
r-0
8
Jun
-08
Se
p-0
8
De
c-0
8
Ma
r-0
9
Jun
-09
Se
p-0
9
De
c-0
9
Manufacturing Index
Services Index
Ex
pa
ns
ion
Co
ntr
acti
on
154
25.4
-60
-50
-40
-30
-20
-10
0
10
20
30
40
50
70
90
110
130
150
170
190
210
230
250
De
c-0
6
Ma
r-0
7
Jun
-07
Se
p-0
7
De
c-0
7
Ma
r-0
8
Jun
-08
Se
p-0
8
De
c-0
8
Ma
r-0
9
Jun
-09
Se
p-0
9
De
c-0
9
Total Production Annual % Change
Source: IMEF. 1. It is analogous to the Purchasing Managers Index of the ISM

Palacio Nacional 2121
Services Location
Global Services Location Index(index ranking)
Mexico has established itself as best option for locating outsourcing activities, contact centers and back-office support in North America.
Source: AT Kearney.
1211
21
0
2
4
6
8
10
12
14
Brazil Mexico China India

Palacio Nacional 2222
Source of Japanese Investment in Mexico
(share by investment source)
Japan is the 10th largest direct investor in Mexico, with 1.9 billion dollars in the last 10 years. However, an additional amount, 3.4 times larger, came from subsidiaries in the US.
Source: Japan External Trade Organization in Mexico, SE.
Success Stories: Mexico - Japan
20.6%
71.8%6.8% 0.8% 100.0%
0%10%20%30%40%50%60%70%80%90%
100%
Dir
ec
t fr
om
J
ap
an
Ja
pa
n
fro
m o
the
r C
ou
ntr
ies
Ja
pa
n fr
om
M
ex
ico
Oth
er
Ja
pa
n
So
urc
es
To
tal
Palacio Nacional 2323
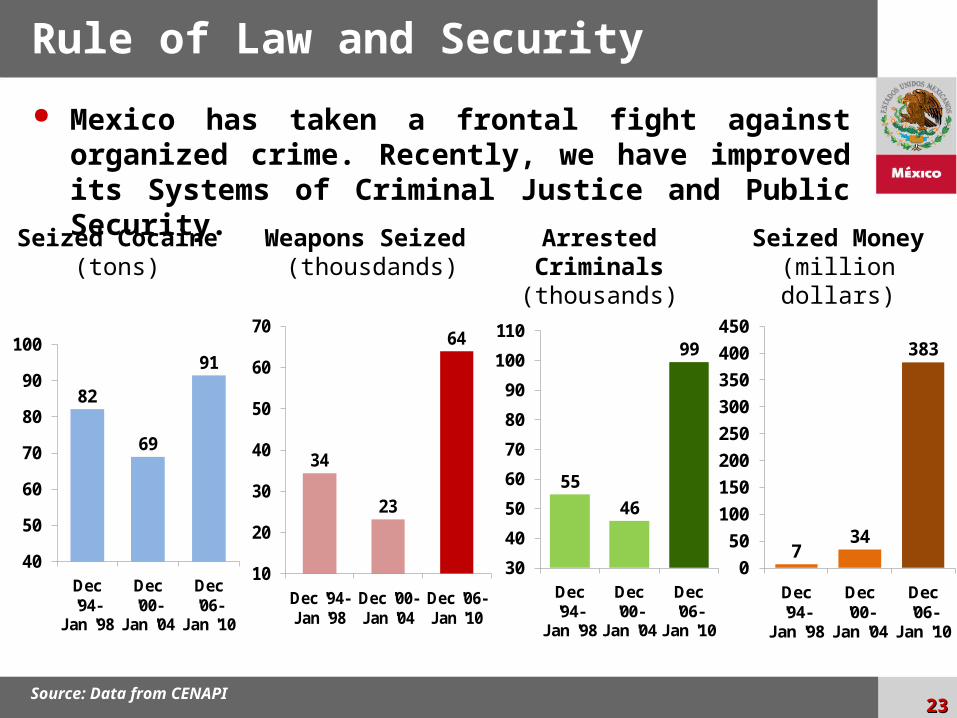
Arrested Criminals(thousands)
Seized Money(million dollars)
Source: Data from CENAPI
Seized Cocaine(tons)
Weapons Seized (thousdands)
Rule of Law and Security
34
23
64
10
20
30
40
50
60
70
Dec '94-Jan '98
Dec '00-Jan '04
Dec '06-Jan '10
55
46
99
30
40
50
60
70
80
90
100
110
Dec '94-
Jan '98
Dec '00-
Jan '04
Dec '06-
Jan '10
734
383
0
50
100
150
200
250
300
350
400
450
Dec '94-
Jan '98
Dec '00-
Jan '04
Dec '06-
Jan '10
82
69
91
40
50
60
70
80
90
100
Dec '94-
Jan '98
Dec '00-
Jan '04
Dec '06-
Jan '10
Mexico has taken a frontal fight against organized crime. Recently, we have improved its Systems of Criminal Justice and Public Security.