pakistan overview of food security and nutrition
TRANSCRIPT
2019
Ministry of National Food Security and ResearchGovernment of Pakistan
IMPROVING ACCESSTO FOOD
PAKISTANOVERVIEW OF
FOOD SECURITYAND NUTRITION


2019
PAKISTANOVERVIEW OF
FOOD SECURITYAND NUTRITION
IMPROVING ACCESS
TO FOOD


CONTENTS
Foreword Acknowledgments Key messages Abbrevia�ons and Acronyms
The Se�ng Part 1: Food Security and Nutri�on in Pakistan
Recent Trends in Hunger and Food Insecurity in Pakistan Prevalence of Undernourishment in Pakistan Prevalence of Moderate and Severe food Insecurity in Popula�on based on Food Insecurity Experience Scale (FIES)
Recent Trends in Malnutri�on in Pakistan Stun�ng among Children under Five Years of Age Was�ng among Children under Five Years of Age Underweight, Overweight and Obesity among Children under 5 Years of Age Micronutrient Deficiencies among Children under Five Years of Age and Adolescents Breas�eeding and Complementary Feeding Nutri�onal Status of Women of Reproduc�ve Age (WRA)
Part 2: Food Insecurity and Malnutri�on in Pakistan – Drivers and Determinants
Poverty Poverty Trends in Pakistan: Na�onal and Provincial Dimensions
Climate Related Disasters –Vulnerability and Food Security in Pakistan Food Safety and Quality
Food Safety Situa�on in Pakistan Strategies for Interven�on
Water, Sanita�on, and Hygiene (WASH) WASH and Nutri�on Nexus and Various Stages of Life Cycle Integrated Ac�on to Improve Nutri�on Accessibility and Availability of Water Water Quality Baseline for Safely Managed Water Safely Managed Sanita�on Services in SDGs Context Baseline for Safely Managed Sanita�on Inclusion and Dispari�es
Part 3: Improving Access to Food Physical Access to Food
Country popula�on, Pakistan's Farming Profile and Access to Food Implica�ons Physical Access to Food in Pakistan Transport and Communica�on Infrastructure Market Infrastructure
Economic Access Trend in Price Indices in Pakistan
ixxixiixiv
1668
15
21222426283136
42434450575859616163636565666868
7273737682848688

Trend in Average Retail Prices of Various Food Items in Pakistan Food Consump�on Pa�erns by Income Groups in Pakistan
Social Access to Food Knowledge Access and Food Security
References Annex. Methodological note
88899198
104107

BOXESBox 1: Food Balance Sheet (FBS) Box 2: Different Sources of Data for PoU Es�ma�on Box 3: Defini�on of Food Security Box 4: Food Insecurity Experience Scale (FIES) Box 5: Integrated Food Security Phased Classifica�on Box 6: Climate Change and Food Security Box 7: Food Safety Authority Agencies in Pakistan Box 8: What is Nutri�on Specific and Nutri�on Sensi�ve Programming Box 9: Wash Defini�ons Box 10: SANITATION AND Handwashing Ladder Box 11: Agro-Ecologies and Crop Produc�on Systems in Pakistan. Box 12: Wheat Policies in Pakistan Box 13: Land Access and Tenure Security Box 14: Urban Poverty Box 15: Gender, Conflict, Food Insecurity and Malnutri�on Box 16: 9211 Informa�on System in Punjab for Livestock and Dairy Development . Box 17: Pakistan Dietary Guidelines for Be�er Nutri�on
FIGURESFigure 1: Indicators for SDG Target 2.1 to Monitor Progress on Ending Hunger and Ensuring
Access to Food for AllFigure 2: Trend in Prevalence of Undernourishment in PakistanFigure 3: Trend in Prevalence of Undernourishment in Pakistan* (Percent)Figure 4: Trend in Prevalence of Undernourishment in Pakistan and Urban-Rural Regions*
(Percent) Figure 5: Infographics on Prevalence of Undernourishment in Pakistan (Percent)Figure 6: Explana�on of Food Insecurity Severity Level Measured by FIES in SDG Indicator 2.1.2 Figure 7: Prevalence of Moderate or Severe Food Insecurity Based on FIES (Percent of
Individuals) Figure 8: Prevalence of Moderate or Severe Food Insecurity Based on FIES (Percent of
Households) Figure 9: Prevalence of Moderate or Severe Food Insecurity Based on FIES by Provinces/Regions
(Percent of Households)Figure 10: Prevalence of Moderate or Severe Food Insecurity Based on FIES by Urban-Rural and
Provinces/Regions (Percent of Households)Figure 11: Prevalence of Moderate or Severe Food Insecurity Based on FIES by Urban-Rural and
Provinces/Regions (Percent of Households)Figure 12: infographics on Prevalence of Moderate or Severe Food Insecurity in Pakistan
(Percent of Households)Figure 13: Trend in Prevalence of Stun�ng among Children under Five Years of Age in Pakistan
(Percent) Figure 14: Prevalence of Stun�ng among Children under Five Years of Age by Provinces/Regions
BOXES, FIGURES AND TABLES
91114185457596365677582879798
101102
8
91013
151617
17
19
20
20
21
22
23
Figure 15: Trend in Prevalence of Stun�ng among Children under Five Years of Age by Provinces (Percent)
Figure 16: Trend in Prevalence of Was�ng among Children under Five Years of Age in Pakistan (Percent)
Figure 17: Prevalence of Was�ng among Children under Five Years of Age by Provinces/Regions (percent)
Figure 18: Trend in Prevalence of Was�ng among Children under Five Years of Age by Provinces (percent)
Figure 19: Trend in Prevalence of Underweight among Children under Five Years of Age in Pakistan (percent)
Figure 20: Prevalence of Underweight among Children under Five Years of Age by Provinces/Regions
Figure 21: Prevalence of Overweight among Children under Five Years of Age by Provinces/Regions
Figure 22: Iron Deficiency among Children under Five Years of Age in Pakistan (percent) Figure 23: Nutri�onal Status of Adolescents in Pakistan (percent)Figure 24: Nutri�onal Status of Adolescents by Urban-Rural Region (percent) Figure 25: Nutri�onal Status of Adolescent Girls by Provinces/Regions (percent)Figure 26: Nutri�onal Status of Adolescent Boys by Provinces/Regions (percent)Figure 27: Exclusive Breas�eeding for First Six Months by Provinces/RegionsFigure 28: Early Ini�a�on of Breas�eeding (within one hour of birth, percent)Figure 29: Early Ini�a�on of Breast feeding (within one hour of birth) by Provinces/Regions Figure 30: Complementary Feeding Prac�ces by Province/Regions (percent)Figure 31: Nutri�onal Status of Women of Reproduc�ve Age (WRA) by Provinces/Regions
(percent) Figure 32: Provincial Comparison of Maternal Anaemia Figure 33: Trend in Poverty Incidence based on Cost of Basic Needs (CBN) Method in Pakistan
and Urban-Rural RegionsFigure 34: Trend in Poverty Incidence based on Cost of Basic Needs (CBN) Method in Provinces Figure 35: Poverty Head Count by District 2014-15, based on CBN, percent of Popula�on Figure 36: Incidence of Poverty by Province (percent)Figure 37: Incidence of Rural Poverty by Province (percent)Figure 38: Trend in Mul�dimensional Poverty (MPI) in Pakistan and Urban-Rural Regions Figure 39: Trends in Mul�dimensional Poverty (MPI) by ProvincesFigure 40: Direct Agriculture Loss A�ributed to Disasters in Pakistan (Current USD Millions) Figure 41: Vulnerability to flood, drought both the hazards in different parts of Pakistan Figure 42: Vulnerability to food insecurity in NMDs and remaining Pakistan Figure 43: Drought Condi�on in Pakistan in 2018Figure 44: Summary findings of IPC analysis for both Sindh and Balochistan districts Figure 45: IPC Acute Food Insecurity Situa�on for Both Sindh and Balochistan Districts Figure 46: WASH Contribu�ons to UNICEF's Key Outcomes for Children across the Life Course Figure 47: Access to Drinking Water Types (percent)Figure 48: Sanita�on Services JMP Es�mates 2017Figure 49: Hygiene Coverage (percent)
24
25
25
26
27
27
28
29303131323233333536
3844
45454647474851515253545662646667

Figure 50: Access to Drinking Water Sources in Pakistan (percent)Figure 51: Access to Sanita�on by Types (percent)Figure 52: Farm size and Farm Number in PakistanFigure 53: Trends in the area under various food crops/groups in PakistanFigure 54: Trends in the area under various food crops/groups in PakistanFigure 55: Provincial Shares in Area under Various Food Crops/Groups in Pakistan (percent) Figure 56:Trends in the Produc�on of Various Food Items/Groups in PakistanFigure 57: Trends in the Produc�on of Various Food Crops/Groups by Provinces in Pakistan Figure 58: Provincial Shares in the Produc�on of Various Food Crops/Groups in Pakistan Figure 59: Product Surplus Status of Provinces in Selected Food Crops/GroupsFigure 60: Logis�cs Performance Index of PakistanFigure 61: Trend in Price Indices in PakistanFigure 62: Trends in Average Retail Prices of Various Food Items Consumed in Pakistan Figure 63: Shares of Different Food Groups in Diet in PakistanFigure 64: Monthly Income and Expenditures on Food by Quin�lesFigure 65: Prevalence of Malnutri�on by Gender (percent)Figure 66: Prevalence of Malnutri�on by Gender (percent)Figure 67: Pro Poor Expenditure (Rs. Billion)Figure 68: Literacy Rate in Pakistan (percent)Figure 69: Public Expenditure on Educa�on (Rs. Billion)Figure 70: Food Security and Nutri�on Informa�on System
TABLESTable 1: Access to Water in Pakistan Baseline in SDGs Context in PakistanTable 2: Baseline for Safely Managed Sanita�on in SDGs Context Pakistan Table 3: Per Capita Availability of Food Crops/Groups in Pakistan (kgs/annum)Table 4: Overview of Transport and Communica�on of PakistanTable 5: Number of Markets and Market Commi�ees (MCs) in PakistanTable 6: Public Markets in Punjab by Year of Establishment (numbers)Table 7: Private Markets in Punjab by Year of Establishment (numbers)Table 8: Food Consump�on Pa�erns by Income Groups in PakistanTable 9: Percentage of Monthly Expenditure on 20 Major Food Items Table 10: Human Development IndicatorsTable 11: Disbursement of Zakat
69697475767778787980848889909293949599
100103
6668818385858690919395


FOREWORD
million Pakistanis are not ge�ng enough food. The absolute number of hungry people in Pakistan is rising every year, driven by its status as the sixth most populous na�on on earth and a popula�on growth rate of 2.4 percent.
In recent �mes,regular natural disasters, conflict and economic slow-downs and down turns, have nega�vely affected Pakistan of con�nuity in its food availability and accessibility through �me. Communi�es have repeatedly faced setbacks in their ability to secure a diverse, nutri�ous, quality, year-round food supply at household level, and to acquire and maintain infrastructure to support health and water systems, sanita�on and hygiene. A changing climate, migra�on and urbaniza�on threaten more instability in the future.
Pakistan is one of the slowest countries in the Southern Asia region to improve on sta�s�cs related to child stun�ng, was�ng and underweight, with no significant progress in the last decade, despite substan�al funds commi�ed to development efforts aimed either directly or indirectly at undernutri�on and micronutrient deficiencies. Based on the Na�onal Nutri�on Survey 2018, stun�ng of children under five years is na�onally at 40.2 percent, while was�ng is at 17.7 percent and underweight at 28.9 percent. There is no significant difference in either stun�ng or was�ng by gender; boys and girls are almost equally affected. The lack of achievement in reducing stun�ng has a par�cularly strong bearing on the Asia Pacific region's progress towards zero hunger.
The nutri�onal status of Pakistani women of childbearing age poses huge challenges to overcome the incidence of underweight babies (31.5 percent) and malnourished children. Pakistan also has a rapidly emerging mul�ple burden of nutri�on, with rising overweight and obesity in all age groups and the prevalence of
This report is the combined effort of four UN agencies and the Government of Pakistan coming together to present the overall picture of where Pakistan stands in the efforts to eliminate hunger and malnutri�on. It is the first �me a country level report has been a�empted for Pakistan backed by the methodology of the UN's global series on the State of Food Security and Nutri�on in the World. FAO, WFP, WHO, UNICEF, the Ministry of Na�onal Food Security and Research (MNFSR), the Pakistan Bureau of Sta�s�cs (PBS) the Ministry of Planning, Development and Reform (MPDR) and Ministry of Na�onal Health Services, Regula�on and Coordina�on (MNHSRC) have collaborated to produce it with the coopera�on of provincial governments and many other stakeholders.
Regular monitoring of Pakistan's food security and nutri�on situa�on can support good policy and programme design. This report is one piece of a holis�c food security and nutri�on informa�on system for the country. The inten�on is to support a well-informed, ac�on-oriented dialogue about food security and nutri�on, relevant to decision-makers with responsibility for the health and wellbeing of Pakistan's rapidly growing popula�on. As a joint publica�on, it is a consensus of the informa�on and understanding we have in 2019 of the problem, where and why it is most prevalent, what needs further analysis and what the most promising pathways are to its eventual eradica�on. This consensus is a stepping-stone to evidence based formula�on of posi�ve solu�ons and concerted ac�on to correct pervasive hunger and malnutri�on and reach towards prosperity and sustainability.
Pakistan is facing a major challenge of mee�ng food security and nutri�on targets of SDG 2 by 2030. FAO es�mates show that the Prevalence of Undernourishment (PoU) in Pakistan is 20.3 percent, and the marginal reduc�on has been erased by popula�on growth such that 40.0
ix

The special theme of this first Pakistan Overview of Food Security and Nutri�on, 2019 report is 'Improving Access to Food'. As a lower-middle-income country that has stabilised its availability of staple crops, Pakistan can do more to improve the access dimension of food security by working to remove inequali�es in physical, economic, social and knowledge access. These inequali�es are most obvious between urban and rural se�ngs, but also exist between provinces, socio-economic groups and genders. Enlargement of government-run social protec�on programs is a very promising development that can be leveraged by increasing informa�on provided along with training and educa�on outcomes. Similarly, improvements in market arrangements, and policies that have desirable impact on prices of healthy and nutri�ous food, both hold high poten�al to open up access to affordable food in Pakistan and at the same �me contribute to the development of sustainable food and agriculture systems.
The contributors to this report hope that it is both useful and inspiring in deciding future analysis, policies and programs for be�er food security and nutri�on in Pakistan, and an accelera�on towards mee�ng SDG2.
overweight children almost doubling in seven years, a problem which has been largely ignored.
Four of the known drivers and determinants of food insecurity and malnutri�on are explored in some detail in this report in the Pakistan context: poverty; climate related disasters; food safety and quality; and water, sanita�on and hygiene (WASH). Poverty, with which food security is closely connected, is steadily declining in Pakistan, but there are considerable dispari�es and divides between different provinces, and between urban and rural se�ngs. As with food insecurity and malnutri�on, the report shows that Sindh and Balochistan are most affected by poverty. Pakistan's high climate change vulnerability and its dependence on agriculture and livestock ac�vi�es means that be�er preparedness and adap�ve responses to a ho�er, drier climate with more variable rainfall will be essen�al to managing food insecurity and malnutri�on during natural disasters. Much work remains to be done throughout Pakistan to improve food safety and quality, and par�cularly WASH. Gains in these two areas will heighten the impact of other work aimed at arres�ng malnutri�on in the popula�on.
Minà Dowlatchahi, FAO Representa�ve in Pakistan Finbarr Curran, WFP Country Director in Pakistan
Palitha Gunarathna Mahipala, WHO Representa�ve in Pakistan Aida Girma, UNICEF Representa�ve in Pakistan
x
ACKNOWLEDGEMENTS
Eh�sham, I�ikhar Abbas, Aman ur Rehman and Syed Razak (WFP); Eric Etegbo, Naureen Arshad, Thewodros Mulugeta, Prakash Raj, Mubashara Iram and Kamran Naeem (UNICEF); and Noureen Aleem Nishtar and Muhammad Naseer (WHO). Mission heads of all the collabora�ng UN organiza�ons under the leadership of Knut Ostby, United Na�ons Resident Coordinator supported this undertaking in Pakistan from a One UN perspec�ve. Muhammad Azeem Khan and Umar Farooq from Pakistan Agriculture Research Council (PARC), and Ghulam Muhammad Arif and Ikram Saeed (FAO Consultants) provided technical input and valuable historical informa�on to some sec�ons of the report.
The report benefited from the comments of par�cipants of consulta�ons held in Islamabad, Karachi, Que�a, Peshawar and Lahore during November 2019.
Technical guidance was provided by Carlo Cafiero (FAO, OCS), Abdul Sa�ar, Sara Viviani and Marinella Cirillo (FAO, ESS) and Aziz Elbehri (FAO, RAP).
The financial support of Swiss Development Coopera�on (SDC) for this report is acknowledged and appreciated.
Under the aegis of MNFSR in the Government of Pakistan,the first Pakistan Overview of Food Security and Nutri�on 2019 has been prepared by the FAO in Pakistan, in collabora�on with Sta�s�cs Division of the Economic and Social Development Department, and a team of technical experts from WFP, WHO, and UNICEF. A technical and oversight commi�ee established under Pakistan's Food Security and Nutri�on Informa�on System (FSNIS) and chaired by MNFSR guided the produc�on of the report. Membership of both commi�ees was from collabora�ng UN organiza�ons, IFPRI, and federal and provincial government representa�ves.Under the overall leadership of Muhammad Hashim Popalzai, Secretary MNFSR, Javed Hamayun and Waseem ul Hassan played a cri�cal role in the coordina�on of the whole exercise. Minà Dowlatchahi (FAO Representa�ve, Pakistan) led the prepara�on of the report, the direc�on of the publica�on was carried out by Aamer Irshad, the coordina�on by Raja Ajmal Jahangeer and Genevieve Hussain was the Editor (FAO, Pakistan). Contribu�ons were provided by Minà Dowlatchahi, Aamer Irshad, Genevieve Hussain, Raja Ajmal Jahangeer, Nomeena Anis, Faisal Syed, Asifa Ghani, Muhammad Afzal, Muhammad Waheed Anwar, Marium Zia Khan, Areesha Asghar, Mehwish Ali, Henrie�e Bjorge, Mehr Hasan and Shahid Ahmad (FAO); as well as Yasir
xi

KEY MESSAGES
GDP a year in lost produc�vity.
4. Dietary habits in Pakistan require realignment to balanced, fresh and nutri�ous ingredients, through making a diverse range of foods more accessible to the poor and through educa�ng both the poor and the rich on the health consequences of a diet dominated by energy-dense, low-nutrient foods. Diets based mainly on wheat that are consumed due to poverty, subsidies, or lack of knowledge, should be supplemented through government programs for wheat, oil and salt for�fica�on, while fruits, vegetables, dairy, pulses, eggs, fish and meat should be made more accessible and more desirable through changes in food and agriculture systems, including government interven�ons on price, food safety, market structure and social protec�on, and through promo�ng the recommenda�ons in the Pakistan Dietary Guidelines for Be�er Nutri�on.
5. Climate-related disasters and the ability to prepare for and withstand them are an important lens through which to consider food security and malnutri�on in Pakistan. The impact of climate-related disasters on the losses to the crucial agriculture sector, which employs 39 percent of the overall workforce and two-thirds (67 percent) of women who work, cannot be overstated. While cyclical drought condi�ons and large-scale floods are the main natural disasters faced, Pakistan is also in an ac�ve earthquake zone. The adop�on of climate-resilient agriculture and water management prac�ces is a promising approach to strengthen food security in Pakistan, in par�cular when coupled with improved land access and tenure arrangements.
6. Water, sanita�on and hygiene (WASH) remain cri�cal and are an important determinant for
1. Prevalence of Undernourishment and of food insecurity are slowly declining in Pakistan but are challenged by low resilience to shocks such as climate-related disasters, economic slow downs and down turns and food price hikes. Inequality needs to be addressed in order to li� both the accessibility and the u�lisa�on of food in Pakistan. The provinces of Sindh and Balochistan are becoming more food insecure. Rural households are more food insecure in terms of economic access and have lower dietary diversity. Addi�onal data expected to be available next year from new waves of surveys may help to be�er address the causes and consequences of food insecurity and malnutri�on, but it is clear that poverty reduc�on is a main lever out of both hunger and food insecurity in Pakistan.
2. The persistent malnutri�on sta�s�cs of Pakistan are at odds with its status as a lower-middle-income country, risking failure to gain the demographic dividend of a youthful popula�on because almost half of the future workforce is stunted and may be unable to reach their poten�al produc�vity, health and wealth. The provinces of Sindh and Balochistan are the worst affected by child malnutri�on. Overweight and obesity are rapidly increasing, especially in urban areas of Pakistan, indica�ng a nutri�on transi�on.
3. Urgent a�en�on is needed on the care of the health and nutri�onal status of women of childbearing age to overcome the alarming rates of underweight, anaemia, zinc deficiency, vitamin A deficiency and vitamin D deficiency and their effect on unborn children. Low birth weight children have an increased likelihood of becoming stunted in the short term and/or overweight and vulnerable to non-communicable diseases in the long term. Such inter-genera�onal malnutri�on is cos�ng the economy of Pakistan 3 percent of its
xii

8. Physical access to food in Pakistan is a challenge. Transport and communica�on infrastructure and logis�cs performance are not adequate and market infrastructure and enhanced market support services are needed to improve food accessibility in Pakistan to the desirable level.
Social access to food in Pakistan is provided through a mix of tradi�onal, charitable disbursements of food and money to the needy, both in rural and urban se�ngs, and more formal and modern government welfare programs, which un�l recently have had limited coverage. Integra�on of these two streams, addi�onal data and an assessment of the joint funding adequacy and targe�ng effec�veness is needed, especially for urban se�ngs where self-produc�on of food is grossly limited and social access to food not fully captured.
improving maternal and child health including stun�ng. WASH is a crucial area of public infrastructure investment and knowledge access for Pakistan, if any gains are to be made in malnutri�on. Contaminated water supplies and unsafe drinking water are urgent problems to resolve in both urban and rural contexts. Major scaling up of integrated nutri�on-sensi�ve WASH interven�ons (e.g. water supply including quality and quan�ty; sanita�on, par�cularly excreta disposal; and hygiene promo�on) is warranted, and will facilitate improved infant and young child feeding prac�ces necessary to overcome malnutri�on.
7. Notwithstanding the WASH challenges, the pathway of a na�onal food safety coordina�on mechanism, harmonizing food safety standards and food safety regulatory control at the na�onal and provincial level, will enhance food security and nutri�on, par�cularly in urban Pakistan.
xiii

ABBREVIATIONS AND ACRONYMS
AKU Agha Khan University BISP Benazir Income Support Program BMI Body-Mass Index CV Coefficient of Varia�onDEC Dietary Energy Consump�on FAO Food and Agriculture Organiza�onFATA/FR Federally Administered Tribal Area/Fron�er RegionsFIES Food Insecurity Experience ScaleGAM Global Acute Malnutri�on GB Gilgit-Bal�stanGDP Gross Domes�c Product HDI Human Development Index HIES Household Integrated Economic Survey KP-NMD Khyber Pakhtunkhwa - Newly Merged DistrictsMAM Moderately Acute Malnutri�on MDER Minimum Dietary Energy Requirement MDG Millennium Development GoalMNFSR Ministry of Na�onal Food Security and Research MoCC Ministry of Climate Change MPDR Ministry of Planning, Development and Reform MNHSRC Ministry of Na�onal Health Services, Regula�on and Coordina�on MPI Mul�-dimensional Poverty Index NCD Non-Communicable Disease NDMA Na�onal Disaster Management Authority NNS Na�onal Nutri�on Survey NoU Number of Undernourished PBS Pakistan Bureau of Sta�s�cs PCRWR Pakistan Council of Research on Water Resources POFI Pakistan Overview of Food Security and Nutri�onPOU Prevalence of UndernourishmentPSLM Pakistan Social Standard Living Measurement Survey SDG Sustainable Development Goal SOFI State of Food Security and Nutri�on in the World USD United States Doller VAD Vitamin A deficiency UNICEF United Na�ons Interna�onal Children's Emergency Fund WASH Water, Sanita�on and Hygiene WFP World Food ProgramWHA World Health Assembly WRA Women of Reproduc�ve Age WHO World Health Organiza�on
xiv
THE SETTING
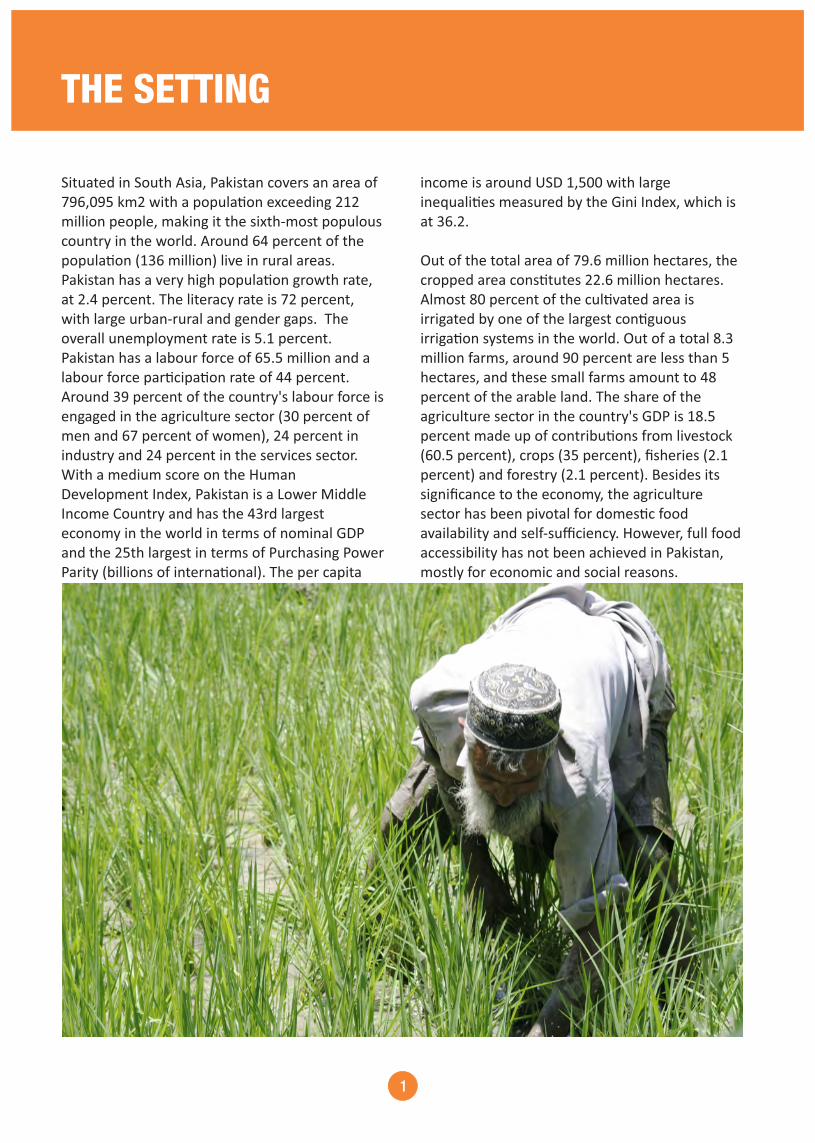
income is around USD 1,500 with large inequali�es measured by the Gini Index, which is at 36.2.
Out of the total area of 79.6 million hectares, the cropped area cons�tutes 22.6 million hectares. Almost 80 percent of the cul�vated area is irrigated by one of the largest con�guous irriga�on systems in the world. Out of a total 8.3 million farms, around 90 percent are less than 5 hectares, and these small farms amount to 48 percent of the arable land. The share of the agriculture sector in the country's GDP is 18.5 percent made up of contribu�ons from livestock (60.5 percent), crops (35 percent), fisheries (2.1 percent) and forestry (2.1 percent). Besides its significance to the economy, the agriculture sector has been pivotal for domes�c food availability and self-sufficiency. However, full food accessibility has not been achieved in Pakistan, mostly for economic and social reasons.
Situated in South Asia, Pakistan covers an area of 796,095 km2 with a popula�on exceeding 212 million people, making it the sixth-most populous country in the world. Around 64 percent of the popula�on (136 million) live in rural areas. Pakistan has a very high popula�on growth rate, at 2.4 percent. The literacy rate is 72 percent, with large urban-rural and gender gaps. The overall unemployment rate is 5.1 percent. Pakistan has a labour force of 65.5 million and a labour force par�cipa�on rate of 44 percent. Around 39 percent of the country's labour force is engaged in the agriculture sector (30 percent of men and 67 percent of women), 24 percent in industry and 24 percent in the services sector. With a medium score on the Human Development Index, Pakistan is a Lower Middle Income Country and has the 43rd largest economy in the world in terms of nominal GDP and the 25th largest in terms of Purchasing Power Parity (billions of interna�onal). The per capita
1
the globe, with SDG 2 Zero Hunger using the Prevalence of Undernourishment (PoU) and Food Insecurity Experience Scale (FIES) as the key indicators. The Government of Pakistan has now also adopted these and included them in its 12th Five Year Plan 2018-23 to target and measure the level of food security in the country.
In this context, the prepara�on of this Pakistan Overview of Food Security and Nutri�on is a �mely contribu�on to a more standardised and regular repor�ng of the food insecurity situa�on in the country. It provides an overview of the available sta�s�cs and challenges in measuring and eradica�ng food insecurity and malnutri�on. It needs to be seen as first report to iden�fy the areas for which more data or analysis are needed to be able to understand the true situa�on of food insecurity and its linkages with poverty and malnutri�on. The report points to the areas where more informa�on is required to be�er understand the rela�onship between food insecurity and poverty, and food insecurity and malnutri�on.
A review of the economic planning documents of the Government of Pakistan suggests that the country has historically not had a standard yards�ck to measure the level of food insecurity. The 11th Five Year Plan 2013-18, therefore, did not include food security targets and made only an objec�ve statement about reducing food insecurity while se�ng five-year targets. Similarly, the Vision 2025 could not find any appropriate benchmark for food security, and indicated the level of food insecurity as 58 percent, which was obtained from Na�onal Nutri�on Survey 2011, although this was neither computed on the basis of standard methodology nor was the NNS intended to determine food insecurity in the country. Later this informa�on was withdrawn from the Vision 2025 in the revised version and a corrigendum was issued. S�ll the country could not find any appropriate figure to denote the level of food security in the country in the revised version and men�oned only about improving access and increasing food produc�on as measures to reduce food insecurity in the country. In 2015, the Sustainable Development Goals (SDGs) were adopted across
2


Part 1
FOOD SECURITY AND NUTRITIONIN PAKISTAN
1.1 RECENT TRENDS IN HUNGER AND FOOD INSECURITY IN PAKISTAN
This part of the report provides informa�on on the Prevalence of Undernourishment (PoU-SDG indicator 2.1.1) and the Prevalence of Moderate and Severe food Insecurity in popula�on based on the Food Insecurity Experience Scale (FIES-SDG indicator 2.1.2). These are the two indicators used to monitor Target 2.1 under the global SDGs monitoring framework. The PoU was also the main indicator used to monitor the World Food Summit target and the Millennium Development Goal (MDG) 1C target: Eradicate extreme hunger and poverty. Globally, three-year averages are used in repor�ng PoU for each country.
Mee�ng food security and nutri�on targets of SDG 2 by 2030 will be a challenge for Pakistan, with marginal reduc�ons in hunger and food insecurity over the past decade; almost no change in stun�ng, was�ng and underweight among under 5 children; and a rapid rise in overweight and obesity. The number of hungry people in Pakistan is rising every year since 2008-09, driven by a stagna�on in the prevalence of undernourishment and a rapid popula�on growth rate of 2.4 percent per year, which has made it the sixth most populous na�on in the world. This, coupled with the lack of achievement in reducing stun�ng, has a par�cularly strong bearing on the Asia Pacific region's progress towards zero hunger and the eradica�on of all forms of malnutri�on.
6

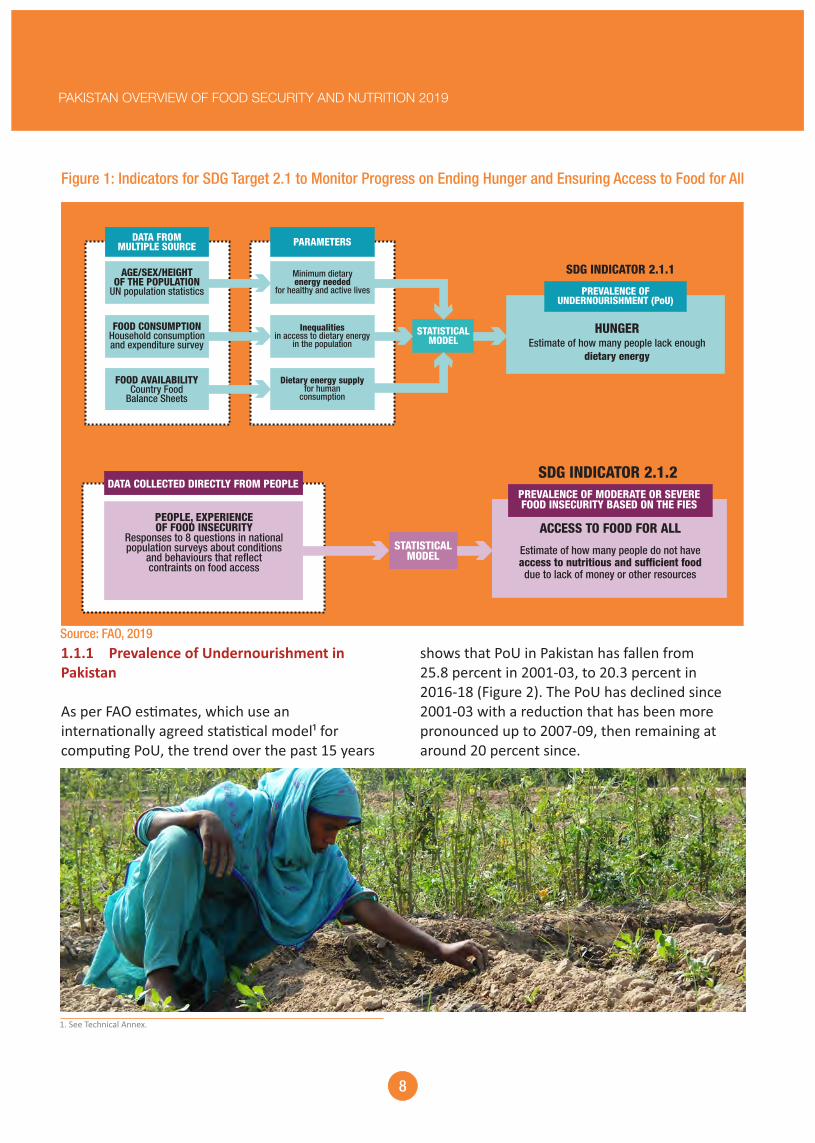
While the PoU has been FAO's tradi�onal indicator used to monitor hunger for many years, in 2017 Prevalence of Moderate and Severe food Insecurity based on the FIES began also to be reported in the global State of Food Security and Nutri�on in the World (SOFI) report as another, complementary indicator of food insecurity. Unlike the PoU, FIES is calculated based on people's direct responses to ques�ons regarding their access to food of adequate quality and quan�ty, and the stability of such access. Use of FIES allows es�ma�on of how many people do not have access to nutri�ous and sufficient food, due to lack of resources or other reasons. Both PoU and FIES are further explained in figure 1.
The PoU es�mates are based on informa�on on the level and distribu�on of dietary energy consump�on in the popula�on, which are contrasted with the expected distribu�on of dietary energy requirements given the composi�on of the popula�on by sex, age, body masses and physical ac�vity level, to establish the probability that the habitual food consump�on of the average individual in the popula�on may fail to cover the dietary energy needs for an ac�ve and healthy life. PoU allows es�ma�on of how many people lack enough dietary energy. It does not give informa�on about the quality of the diets, only dietary energy adequacy.
7
DATA FROM MULTIPLE SOURCE
AGE/SEX/HEIGHTOF THE POPULATION
UN population statistics
FOOD CONSUMPTIONHousehold consumptionand expenditure survey
FOOD AVAILABILITYCountry Food
Balance Sheets
PARAMETERS
Minimum dietaryenergy needed
for healthy and active lives
Inequalitiesin access to dietary energy
in the population
Dietary energy supplyfor human
consumption
STATISTICALMODEL
HUNGEREstimate of how many people lack enough
dietary energy
SDG INDICATOR 2.1.1
PREVALENCE OFUNDERNOURISHMENT (PoU)
STATISTICALMODEL Estimate of how many people do not have
access to nutritious and sufficient fooddue to lack of money or other resources
SDG INDICATOR 2.1.2PREVALENCE OF MODERATE OR SEVEREFOOD INSECURITY BASED ON THE FIES
PEOPLE, EXPERIENCEOF FOOD INSECURITY
Responses to 8 questions in nationalpopulation surveys about conditions
and behaviours that reflectcontraints on food access
DATA COLLECTED DIRECTLY FROM PEOPLE
ACCESS TO FOOD FOR ALL
Source: FAO, 2019
shows that PoU in Pakistan has fallen from 25.8 percent in 2001-03, to 20.3 percent in 2016-18 (Figure 2). The PoU has declined since 2001-03 with a reduc�on that has been more pronounced up to 2007-09, then remaining at around 20 percent since.
1.1.1 Prevalence of Undernourishment in Pakistan
As per FAO es�mates, which use an interna�onally agreed sta�s�cal model¹ for compu�ng PoU, the trend over the past 15 years
Figure 1: Indicators for SDG Target 2.1 to Monitor Progress on Ending Hunger and Ensuring Access to Food for All
8
PAKISTAN OVERVIEW OF FOOD SECURITY AND NUTRITION 2019
1. See Technical Annex.

2Figure 2: Trend in Prevalence of Undernourishment in Pakistan
Source: FAO, Statistics Division
explained by a series of events, such as climate related disasters (floods in 2010-2013 and drought in 2013-14 and 2017-18 in parts of Pakistan) and high infla�on during 2008-14, which have defied efforts to reduce hunger in the country.
Despite the reduc�on in PoU, the es�mated Number of Undernourished people (NoU) has increased from 37.6 million in 2002-04 to 40 million in 2016-18, as a result of steady popula�on growth over the same period. The stagna�on in the PoU and the rise in the undernourished popula�on since 2008-10 can be
Box 1: Food Balance Sheet (FBS) FBS data is used to improve the es�mates of PoU obtained from survey data, when there are reasons to believe that the survey may fail to account for all sources of household food consump�on. The FBS presents a comprehensive picture of the pa�ern of a country's food supply during a specified reference period, usually one year. The food balance sheet shows for each food item - i.e. each primary commodity and a number of processed commodi�es poten�ally available for human consump�on - the sources of supply and its u�liza�on. The total quan�ty of foodstuffs produced in a country added to the total quan�ty imported and adjusted to any change in stocks that may have occurred since the beginning of the reference period, gives the supply available during that period. On the u�liza�on side, a dis�nc�on is made between the quan��es exported, fed to livestock, used for seed, put to manufacture for non-food uses, losses during storage and transporta�on, and food supplies available for human consump�on. The per capita supply of each such food item available for human consump�on is obtained by dividing the respec�ve quan�ty by the size of the popula�on partaking of it. Data on per capita food supplies are expressed in terms of quan�ty and - by applying appropriate food composi�on factors for all primary and processed products - also in terms of dietary energy, protein and fat content.
Source: FAO.
9
Part 1:FOOD SECURITY AND NUTRITION IN PAKISTAN
2. As per FAO Global Report on State of Food Security and Nutri�on in the World. These es�mates are based on Food Balance Sheet data.
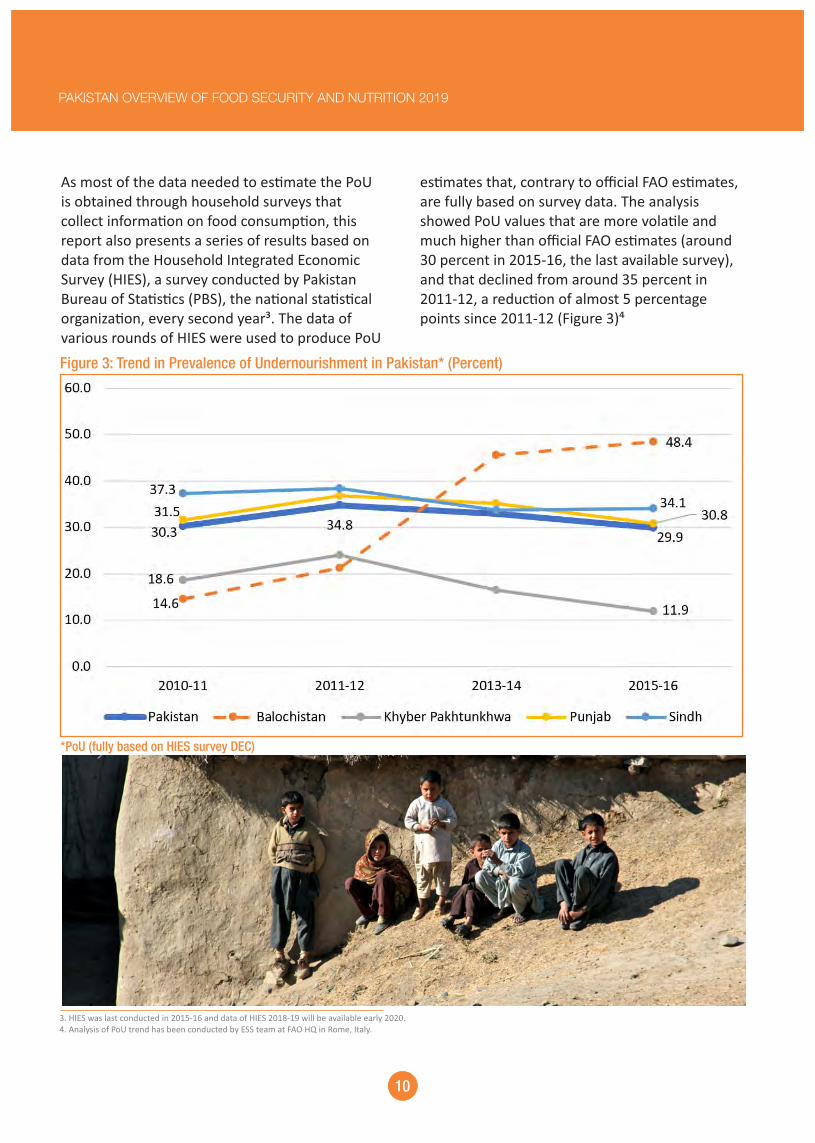
es�mates that, contrary to official FAO es�mates, are fully based on survey data. The analysis showed PoU values that are more vola�le and much higher than official FAO es�mates (around 30 percent in 2015-16, the last available survey), and that declined from around 35 percent in 2011-12, a reduc�on of almost 5 percentage points since 2011-12 (Figure 3)⁴
As most of the data needed to es�mate the PoU is obtained through household surveys that collect informa�on on food consump�on, this report also presents a series of results based on data from the Household Integrated Economic Survey (HIES), a survey conducted by Pakistan Bureau of Sta�s�cs (PBS), the na�onal sta�s�cal organiza�on, every second year³. The data of various rounds of HIES were used to produce PoU
Figure 3: Trend in Prevalence of Undernourishment in Pakistan* (Percent)
*PoU (fully based on HIES survey DEC)
10
PAKISTAN OVERVIEW OF FOOD SECURITY AND NUTRITION 2019
3. HIES was last conducted in 2015-16 and data of HIES 2018-19 will be available early 2020. 4. Analysis of PoU trend has been conducted by ESS team at FAO HQ in Rome, Italy.

Box 2: Different Sources of Data for PoU Es�ma�onAs detailed in the technical annex, the parameters needed to compute PoU es�mates using the FAO methodology can be informed by different sources of data. While survey data remain the only source for a direct es�mate of the coefficient of varia�on (CV), an es�mate the average dietary energy consump�on (DEC) can be obtained either from survey data or from Food Balance Sheets (FBS). In this sense, independently from the source that is used, the method for es�ma�on of the PoU is unique.Official FAO es�mates for Pakistan are reported every year in the State of Food Security and Nutri�on in the world report, based on data from Food Balance Sheets to es�mate the mean (DEC) and from na�onal household surveys to es�mate the CV. They are reported as three-year moving average to control for possible year-to-year uncertainty in capturing some of the FBS components.FAO promotes the use of surveys to the maximum possible extent, as this is the only way to produce also es�mates at sub-na�onal level. This is the case of this report as there are surveys available in Pakistan that describe the pa�erns of food consump�on in the country. Nevertheless, it also recognized that the average DEC es�mated from survey data may be affected by serious bias, in cases when the food consump�on data collected in the survey fail to fully capture all sources of household food consump�on. As a result, PoU es�mated based on survey data only are usually affected by a considerable bias. This is the case of the HIES-based es�mates of PoU presented in this report at subna�onal levels.One key recommenda�on to enhance the quality and reliability of PoU es�mates for Pakistan is to improve the current modules included in household surveys to be�er capture all sources of food consump�on. For further details, please refer to methodological note in Annex
ins�tu�on has in the country, but which does not get captured fully in the survey data. Par�cularly relevant, for example, seems to be the food consumed by visitors at Sufi shrines present in many parts of the country⁵. A detailed food consump�on module in future edi�ons of the HIES may be�er capture this important alterna�ve source of food consump�on, which is expected to be par�cularly relevant especially for the poorer strata of the popula�on⁶.Based on the above considera�on, and pending further inquiries on the discrepancy between food consump�on accounted for in surveys and apparent food consump�on es�mated from FBS, a safe conclusion is that the true PoU in Pakistan in 2015-17 is around 20 percent.
The difference between the PoU es�mates computed using the average Dietary Energy Consump�on (DEC) es�mated from the HIES survey data only and the one computed by FAO es�ma�ng the mean from FBS data, reveals that either the HIES survey data underes�mates food consump�on, that FBS data overes�mates the average DEC in the country, or both. The difference in PoU based on Food Balance Sheet data and household survey data has been also found in other countries in the region such as India, Myanmar, Mongolia, Sri Lanka, Vietnam and Philippines. One convincing reason for why survey data may underes�mate total food consump�on in Pakistan, is found in the relevance that consump�on of food received for free, at work, at school, or at the charitable
11
Part 1:FOOD SECURITY AND NUTRITION IN PAKISTAN
5. See: h�p://www.ipsnews.net/2018/11/sufi-shrines-public-private-partnership-improve-food-security-nutri�on/ 6. See World Bank publica�on which highlights the problems in fully capturing total food consump�on through household economic surveys. h�p://surveys.worldbank.org/sites/default/files/publica�ons/6_Guidebook_final_Web2.pdf

Balochistan are par�cuarly problema�c, yielding incredibly low values of the PoU in 2010-11 and 2011-12, compared with those of the other provinces⁷.
An analysis of the PoU by area of residence of the household (urban-rural) based on the survey data (Figure 4) would show that the propor�on of the popula�on in rural areas that is undernourished is consistently lower than it is in urban areas. However, this finding may be due to larger underes�ma�on of food consump�on data of urban households, rela�ve to that of rural households. While it is possible that rural popula�on engaged in agriculture will have access to self-produced cereals, vegetables and milk, thus having higher levels of dietary energy consump�on than the urban poor. It must also be considered that, given the current design of the food consump�on module, survey data may fail to fully capture the contribu�on of food consumed away from home in urban areas, in par�cular of consump�on of food received for free. However, given the rapid urbaniza�on of areas near large ci�es, it is possible that many of the households that are s�ll classified as “rural” in the more recent surveys are actually living in what are nowadays urban or peri-urban contexts. This may explain the observed closing gap⁸. An infographic on PoU in Pakistan is given in figure 5.
As the HIES surveys are designed to be representa�ve at the provincial level and by urban or rural area of residence, survey data would allow, in principle, to conduct a disaggregated analysis of PoU. This is obtained by trea�ng the subset of data belonging to each area (urban or rural) or to each province as a separate survey, and es�ma�ng all parameters separately.
Given the very likely underes�ma�on of total food consump�on obtained from survey data, the resul�ng series of PoU should be considered only with reference to the trends they show over �me, and the rela�ve differences between sub-na�onal units (e.g., provinces, and urban/rural area of residence), but not with reference to the absolute level.
The analysis of PoU by provinces (Figure 3) shows that except in Balochistan, PoU has declined in other three provinces since 2011-12. Many parts of the country faced extensive floods in 2010, which seem to have contributed to the rise in high PoU between 2010-11 and 2011-12. In 2015-16, the PoU was lowest in Khyber Pakhtunkhwa, followed by Punjab, Sindh and Balochistan. Punjab and Khyber Pakhtunkhwa registered consistent decline since 2011-12, in Balochistan PoU increased, whereas Sindh has a mixed picture, as a�er an ini�al decline, PoU in Sindh increased since 2013-14. The results for
12
PAKISTAN OVERVIEW OF FOOD SECURITY AND NUTRITION 2019
7. One reason for the ques�onable reliability of survey data from Balochistan in those years may be linked to difficul�es in accessing the area in that period due to conflicts. It may have resulted in being able to collect data only in the rela�vely safer, and arguably be�er off, areas of the province, while in more recent years data collec�on has been more systema�c. 8. PBS uses the local government's no�fica�on to classify the areas as urban or rural. If a semi-urban area is s�ll no�fied as rural by the local government authority, PBS considers it as rural.
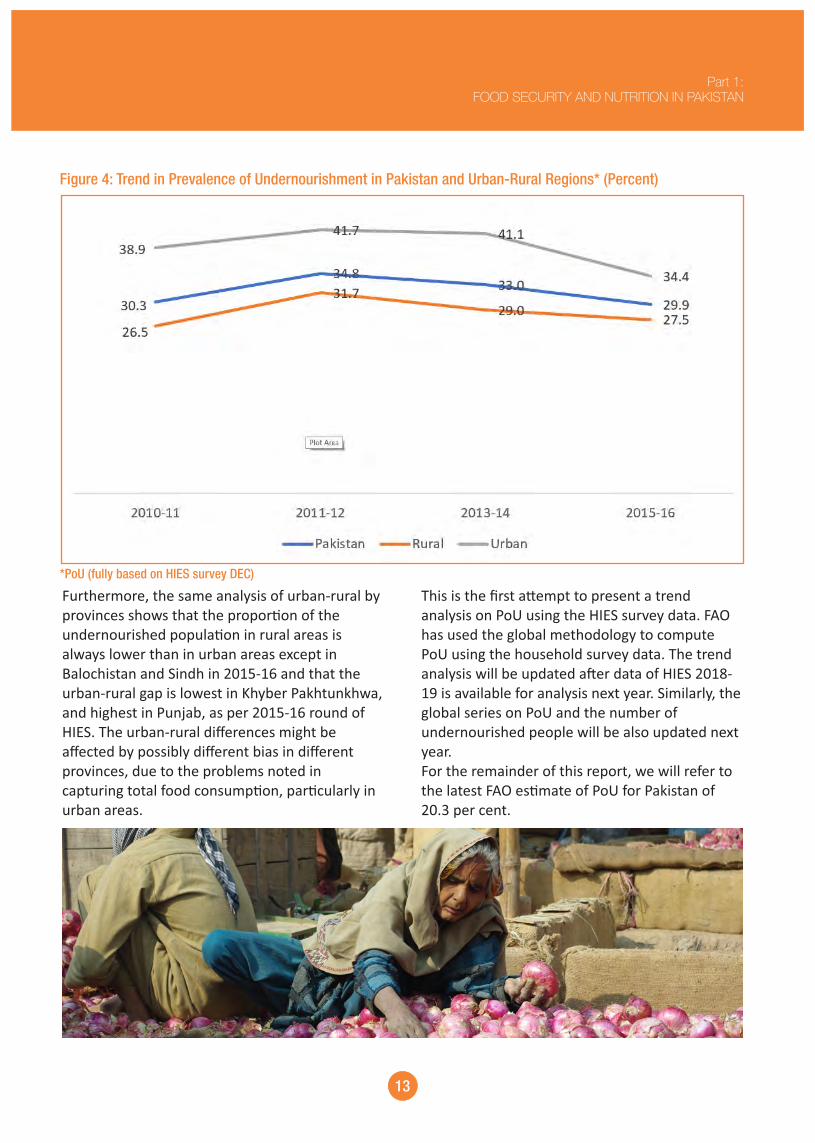
Figure 4: Trend in Prevalence of Undernourishment in Pakistan and Urban-Rural Regions* (Percent)
*PoU (fully based on HIES survey DEC)
This is the first a�empt to present a trend analysis on PoU using the HIES survey data. FAO has used the global methodology to compute PoU using the household survey data. The trend analysis will be updated a�er data of HIES 2018-19 is available for analysis next year. Similarly, the global series on PoU and the number of undernourished people will be also updated next year. For the remainder of this report, we will refer to the latest FAO es�mate of PoU for Pakistan of 20.3 per cent.
Furthermore, the same analysis of urban-rural by provinces shows that the propor�on of the undernourished popula�on in rural areas is always lower than in urban areas except in Balochistan and Sindh in 2015-16 and that the urban-rural gap is lowest in Khyber Pakhtunkhwa, and highest in Punjab, as per 2015-16 round of HIES. The urban-rural differences might be affected by possibly different bias in different provinces, due to the problems noted in capturing total food consump�on, par�cularly in urban areas.
13
Part 1:FOOD SECURITY AND NUTRITION IN PAKISTAN

Box 3: Defini�on of Food SecurityŸ A situa�on that exists when all people, at all �mes, have physical, social and economic access to
sufficient, safe and nutri�ous food that meets their dietary needs and food preferences for an ac�ve and healthy life. Food insecurity exists when people are not able to secure access to an adequate and safe diet which constrains them from leading an ac�ve and healthy life today. In addi�on, those who are currently food secure may become vulnerable to food insecurity in the future. Based on this defini�on, four food security dimensions can be iden�fied: food availability, economic and physical access to food, food u�liza�on, and stability over �me.
Ÿ Food security dimensionsŸ Refers to the four dimensions of food security:Ÿ Availability – This dimension addresses whether or not food is actually or poten�ally physically
present, including aspects of produc�on, food reserves, markets and transporta�on, and wild foods.
Ÿ Access – If food is actually or poten�ally physically present, the next ques�on is whether or not households and individuals have sufficient access to that food.
Ÿ U�liza�on – If food is available and households have adequate access to it, the next ques�on is whether or not households are consuming food of adequate nutri��ve value. Achieving sufficient dietary energy and nutrient intake by all individuals of different sex and age depends on the extent of good care and feeding prac�ces, food prepara�on, dietary diversity and intra-household distribu�on of food. Combined with the absence of health problems that may prevent good biological u�liza�on of the food consumed, this determines the nutri�onal status of individuals.
Ÿ Stability – If the dimensions of availability, access and u�liza�on are sufficiently met, stability is the condi�on in which the whole system is stable, thus ensuring that households are food secure at all �mes. Stability issues can refer to short-term instability (which can lead to acute food insecurity) or medium to long-term instability (which can lead to chronic food insecurity). Clima�c, economic, social and poli�cal factors can all be a source of instability.
Source: FAO
14
PAKISTAN OVERVIEW OF FOOD SECURITY AND NUTRITION 2019
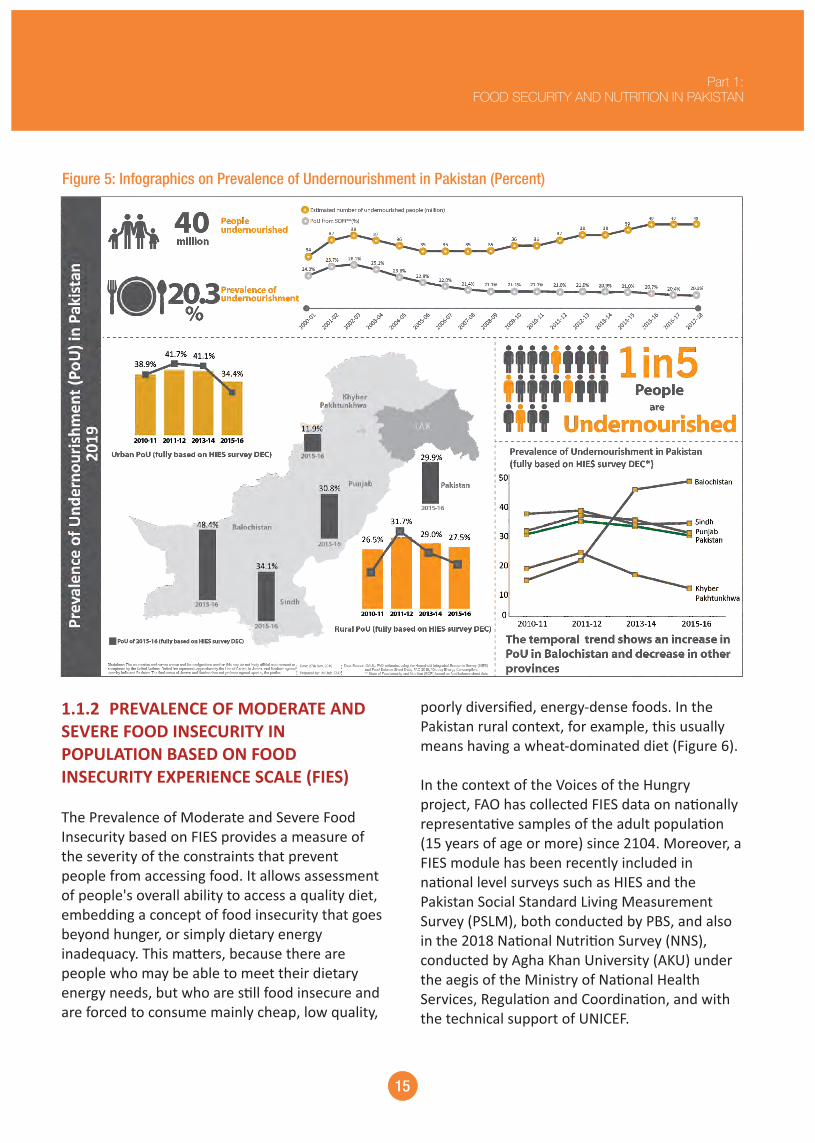
Figure 5: Infographics on Prevalence of Undernourishment in Pakistan (Percent)
poorly diversified, energy-dense foods. In the Pakistan rural context, for example, this usually means having a wheat-dominated diet (Figure 6).
In the context of the Voices of the Hungry project, FAO has collected FIES data on na�onally representa�ve samples of the adult popula�on (15 years of age or more) since 2104. Moreover, a FIES module has been recently included in na�onal level surveys such as HIES and the Pakistan Social Standard Living Measurement Survey (PSLM), both conducted by PBS, and also in the 2018 Na�onal Nutri�on Survey (NNS), conducted by Agha Khan University (AKU) under the aegis of the Ministry of Na�onal Health Services, Regula�on and Coordina�on, and with the technical support of UNICEF.
1.1.2 PREVALENCE OF MODERATE AND SEVERE FOOD INSECURITY IN POPULATION BASED ON FOOD INSECURITY EXPERIENCE SCALE (FIES)
The Prevalence of Moderate and Severe Food Insecurity based on FIES provides a measure of the severity of the constraints that prevent people from accessing food. It allows assessment of people's overall ability to access a quality diet, embedding a concept of food insecurity that goes beyond hunger, or simply dietary energy inadequacy. This ma�ers, because there are people who may be able to meet their dietary energy needs, but who are s�ll food insecure and are forced to consume mainly cheap, low quality,
15
Part 1:FOOD SECURITY AND NUTRITION IN PAKISTAN

The analysis of FIES data collected by FAO through the Gallup World Poll since 2014 reveals a decreasing trend in the prevalence of food insecurity, both at moderate or severe levels combined and at severe levels only (figure 7). According to this provisional assessment, which is based on a very small sample of 1000 individuals, representa�ve only at the na�onal level, 34.1 percent of the popula�on was exposed to food insecurity, at moderate or severe levels over the three-year period 2016-18, down from a level of 41.7 percent in 2014-16. The percentage of those exposed to severe level dropped from 13.0 to 10.8 percent over the same period.
Given the ins�tu�onal arrangements that give the Pakistani Bureau of Sta�s�cs the ul�mate responsibility to produce data to inform SDG indicators, the data collected with the FIES module included in the HIES 2018-19 will be the first official source of data to compile the SDG indicator 2.1.2 for Pakistan for the first �me in 2020. However, these data are not yet available for analysis at the �me this report goes to the press. In this report, we comment on provisional assessments of the prevalence of food insecurity in Pakistan based on FAO data from the Voices of the Hungry project and on data from the 2018 NNS.
Figure 6: Explanation of Food Insecurity Severity Level Measured by FIES in SDG Indicator 2.1.2
16
PAKISTAN OVERVIEW OF FOOD SECURITY AND NUTRITION 2019

Figure 7. Prevalence of Moderate or Severe Food Insecurity Based on FIES (Percent of Individuals)
Source: FAO-Voices of the Hungry Project
area of residence. These addi�onal results show that in 2018, 23.5 percent of the households in Pakistan have been es�mated to be either moderately or severely food insecure, whereas 10.1 percent are severely food insecure (figure 8)⁹.
These results are broadly consistent with those derived from the analysis of FIES data collected in the NNS 2018, which is a much larger survey covering more than 100,000 households, designed to be representa�ve at na�onal, provincial and district level, and by urban/rural
Figure 8: Prevalence of Moderate or Severe Food Insecurity Based on FIES (Percent of Households)
Source: FAO Estimates Using Data of National Nutrition Survey of 2018
percent) and severe (11.6 percent) food insecurity appears to be higher in rural areas than in urban areas (18.9 percent and 7.7 percent, respec�vely).
Contrary to the evidence on the PoU as obtained from HIES surveys, here the urban-rural gap appears to be in the opposite direc�on: the prevalence of both moderate or severe (26.3
17
Part 1:FOOD SECURITY AND NUTRITION IN PAKISTAN
9. The analysis of FIES data collected in the NNS has been conducted jointly with Agha Khan University, with the support of FAO Sta�s�cs Division in Rome. Es�mates from the NNS are reported as percentage of households rather than individuals and are expected to be higher than those based on FAO's data if food insecure households are, on average, larger than non-food insecure ones, a feature that is consistent with the observa�on that, for example, poorer households tend to have, on average, more children.

Box 4: Food Insecurity Experience Scale (FIES)
FIES developed by FAO is used to compute SDG indicator 2.1.2: the prevalence of moderate or severe food insecurity in the popula�on. FIES is a food security measurement scale composed of eight ques�ons to evaluate the level of food insecurity experienced by households. The responses report on the occurrence of experiences and condi�ons that are typically associated with food insecurity. The experiences and condi�ons are that household members: were worried about not having enough food to eat, did not eat healthy and nutri�ous food, ate only few kinds of food, skipped a meal, ate less food, ran out of food in the house, were hungry but did not eat food, or did not eat food a whole day. Respondents were asked to report if each of the condi�ons has been experienced, at �mes, over the past 12 months, because of a lack of money or other resources to obtain food. A rigorous sta�s�cal analysis based on the Rasch measurement model allows conver�ng the qualita�ve informa�on conveyed with the responses to the FIES ques�on, into a quan�ta�ve measure of the severity of the food security condi�on of the respondents¹⁰ www.fao.org/in-ac�on/voices-of-the-hungry
Source: FAO
NMD, 27.1 percent) (figure 9). The prevalence of severe food insecurity also follows the same trend and is highest in Balochistan (21.4 percent) followed by Sindh (14.7 percent) and KP-NMD (12.1 percent).
NNS data show also dispari�es in the prevalence of moderate and severe food insecurity across provinces/regions. The prevalence of moderate or severe food insecurity is highest in Balochistan (38.4 percent) followed by Sindh (33.3 percent) and by the Newly Merged Districts of KP (KP-
18
PAKISTAN OVERVIEW OF FOOD SECURITY AND NUTRITION 2019
10. (see h�p://www.fao.org/in-ac�on/voices-of-the-hungry )

Figure 9: Prevalence of Moderate or Severe Food Insecurity Based on FIES by Provinces/Regions (Percent of Households)
insecurity, 23.7 percent of rural households in Balochistan, 21.6 percent of rural Sindh and 13.0 percent in rural AJK are severely food insecure. The gap between urban and rural households in the case of prevalence of both moderate or severe food insecurity, and severe food insecurity, is largest in Sindh, and the smallest in KP.
An urban-rural disaggregated analysis of the NNS-FIES data within each province/region has been also performed. Results show that households living in the rural areas of Sindh have the highest prevalence of moderate or severe food insecurity (46.3 percent) followed by rural households in Balochistan (42.1 percent) and KP-NMD¹¹ (27.1) percent (figure 10 & 11). In case of severe food
Source: FAO Estimates Using Data of National Nutrition Survey of 2018
19
Part 1:FOOD SECURITY AND NUTRITION IN PAKISTAN
11. Due to small sample size of urban areas of KP-NMD, only results for rural areas of KP-NMD are reported.

Figure 10: Prevalence of Moderate or Severe Food Insecurity Based on FIES by Urban-Rural and Provinces/Regions (Percent of Households)
Source: FAO Estimates Using Data of National Nutrition Survey of 2018
Figure 11: Prevalence of Moderate or Severe Food Insecurity Based on FIES by Urban-Rural and Provinces/Regions (Percent of Households)
Source: FAO Estimates Using Data of National Nutrition Survey of 2018
drought-affected districts of Sindh and Balochistan. There is thus a strong disparity between the overall, averaged figures for the country, province, urban and rural levels in Pakistan, compared with the actual situa�on of drought affected/vulnerable districts. We will return to this situa�on and consider its drivers and determinants in Part 2 of this report, a�er first considering malnutri�on trends.
FIES data was also included among the set of food security and livelihood relevant informa�on for assessments conducted in drought-affected areas of Sindh and Balochistan and Newly Merged Districts (NMDs) regions during 2016-19. FAO Pakistan contributed to the analysis of those data. The results of these recent household assessments based on FIES data show a very high prevalence of food insecurity, par�cularly in
20
PAKISTAN OVERVIEW OF FOOD SECURITY AND NUTRITION 2019

Figure 12: infographics on Prevalence of Moderate or Severe Food Insecurity in Pakistan (Percent of Households)
Source: FAO using data of NNS 2018
measured: three that form part of the SDG monitoring framework for 2030; six that refer to global nutri�on targets as agreed by the World Health Assembly (WHA) for 2025; and one from the WHO global voluntary Non-Communicable Disease (NCD) targets.
This part of the report provides an assessment of Pakistan's na�onal and provincial trends to track progress towards the SDG nutri�on indicator 2.2.1 stun�ng among children under five years of age; and SDG indicator 2.2.2 was�ng and overweight among children under five years of age. It also looks at micronutrient deficiencies in children and at the nutri�onal status of women of
1.2 RECENT TRENDS IN MALNUTRITION IN PAKISTAN
SDG 2 target 2.2 calls for an end to all forms of malnutri�on by 2030. Malnutri�on covers a broad spectrum ranging from severe undernutri�on to overweight and obesity. A mul�ple burden of malnutri�on, where undernutri�on, micronutrient deficiencies and overweight/ obesity coexist in the same country, same household, and even the same person through life, is a serious and growing concern in the Asia Pacific Region, including in Pakistan. To track global progress on ending malnutri�on in all its forms, several nutri�on indicators are normally
21
Part 1:FOOD SECURITY AND NUTRITION IN PAKISTAN
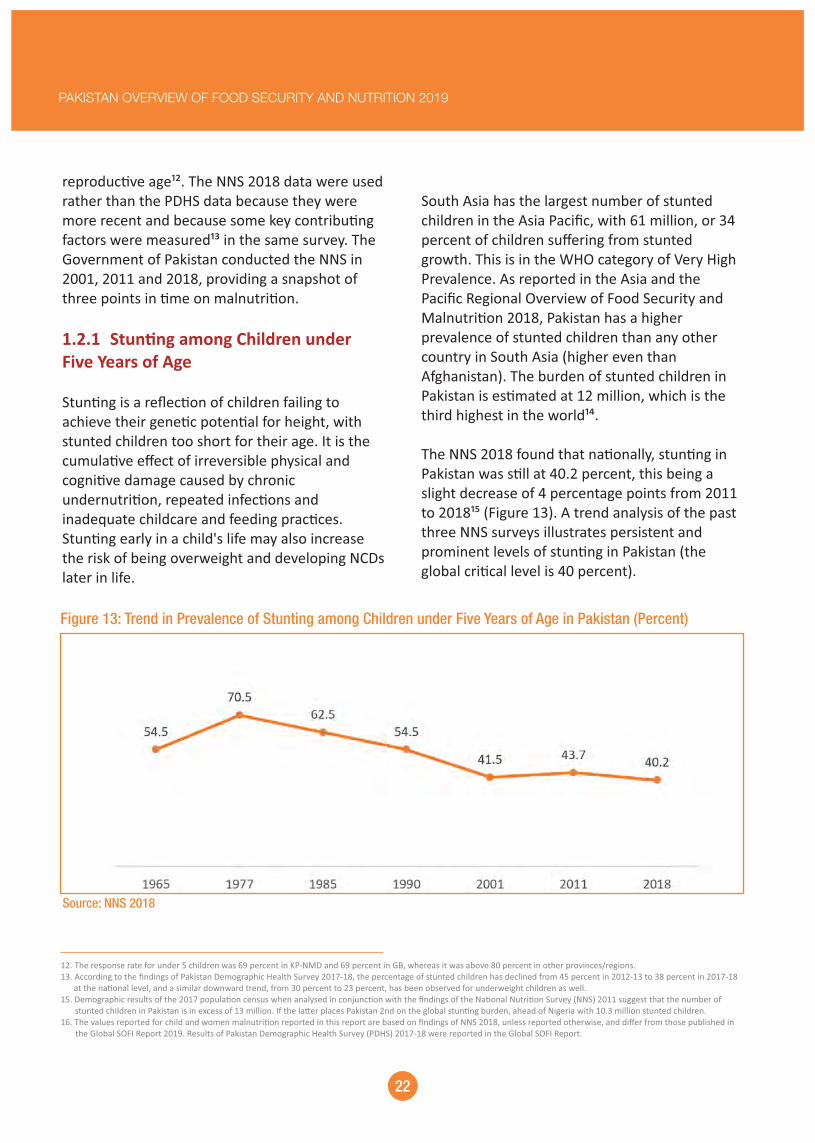
South Asia has the largest number of stunted children in the Asia Pacific, with 61 million, or 34 percent of children suffering from stunted growth. This is in the WHO category of Very High Prevalence. As reported in the Asia and the Pacific Regional Overview of Food Security and Malnutri�on 2018, Pakistan has a higher prevalence of stunted children than any other country in South Asia (higher even than Afghanistan). The burden of stunted children in Pakistan is es�mated at 12 million, which is the third highest in the world¹⁴.
The NNS 2018 found that na�onally, stun�ng in Pakistan was s�ll at 40.2 percent, this being a slight decrease of 4 percentage points from 2011 to 2018¹⁵ (Figure 13). A trend analysis of the past three NNS surveys illustrates persistent and prominent levels of stun�ng in Pakistan (the global cri�cal level is 40 percent).
reproduc�ve age¹². The NNS 2018 data were used rather than the PDHS data because they were more recent and because some key contribu�ng factors were measured¹³ in the same survey. The Government of Pakistan conducted the NNS in 2001, 2011 and 2018, providing a snapshot of three points in �me on malnutri�on.
1.2.1 Stun�ng among Children under Five Years of Age
Stun�ng is a reflec�on of children failing to achieve their gene�c poten�al for height, with stunted children too short for their age. It is the cumula�ve effect of irreversible physical and cogni�ve damage caused by chronic undernutri�on, repeated infec�ons and inadequate childcare and feeding prac�ces. Stun�ng early in a child's life may also increase the risk of being overweight and developing NCDs later in life.
12. The response rate for under 5 children was 69 percent in KP-NMD and 69 percent in GB, whereas it was above 80 percent in other provinces/regions.13. According to the findings of Pakistan Demographic Health Survey 2017-18, the percentage of stunted children has declined from 45 percent in 2012-13 to 38 percent in 2017-18
at the na�onal level, and a similar downward trend, from 30 percent to 23 percent, has been observed for underweight children as well.15. Demographic results of the 2017 popula�on census when analysed in conjunc�on with the findings of the Na�onal Nutri�on Survey (NNS) 2011 suggest that the number of
stunted children in Pakistan is in excess of 13 million. If the la�er places Pakistan 2nd on the global stun�ng burden, ahead of Nigeria with 10.3 million stunted children.16. The values reported for child and women malnutri�on reported in this report are based on findings of NNS 2018, unless reported otherwise, and differ from those published in
the Global SOFI Report 2019. Results of Pakistan Demographic Health Survey (PDHS) 2017-18 were reported in the Global SOFI Report.
Figure 13: Trend in Prevalence of Stunting among Children under Five Years of Age in Pakistan (Percent)
Source: NNS 2018
22
PAKISTAN OVERVIEW OF FOOD SECURITY AND NUTRITION 2019

knowledge, as well as widespread deficiencies in WASH, food safety and food quality in Pakistan.
Among the four provinces, stun�ng prevalence was highest in Balochistan (46.6 percent), followed by Sindh (45.5 percent), KP (40.0 percent) and Punjab (36.4 percent). In all provinces, rural children were more likely to be stunted compared to urban children. Among other regions of Pakistan, stun�ng prevalence was found to be highest (48.3 percent) in KP-NMD, followed by 46.6 percent in GB, 39.3 percent in AJK and 32.6 percent in ICT (Figure 14 &15)). Regarding the pa�ern observed in Balochistan, we note that data collec�on is more difficult in this province due to access and security issues.
NNS 2018 revealed that stun�ng in Pakistan had a slightly higher prevalence in boys (40.9 percent) compared to girls (39.4 percent). The prevalence of stun�ng in rural areas was significantly higher (43.2 percent) compared to urban areas (34.8 percent). Regarding age distribu�on, stun�ng was lowest (28.6 percent) at 0 to 5 months of age and highest (46.6 percent) at 18 to 23 months of age. This implies that stun�ng among new-borns probably rises with exposure to environmental factors such as poor WASH and lack of a healthy and nutri�ous diet. Stun�ng was highest (51.4 percent) in children where the household belonged to the poorest quin�le, however a substan�al propor�on (29.2 percent) was also found to be stunted in the richest quin�le. This points not only poverty, but also lack of
Figure 14: Prevalence of Stunting among Children under Five Years of Age by Provinces/Regions (Percent)
Source: NNS 2018
23
Part 1:FOOD SECURITY AND NUTRITION IN PAKISTAN

Figure 15: Trend in Prevalence of Stunting among Children under Five Years of Age by Provinces (Percent)
Source: NNS 2018
world's wasted children live in South Asia, with India having the highest prevalence at over 20 percent in 2018. This is in the WHO category of Very High Prevalence. In that publica�on, Pakistan was reported as being in the WHO High Prevalence category for prevalence of was�ng, at just over 10 percent. The source of these data was the UNICEF, WHO and World Bank Group Joint Child Malnutri�on Es�mates 2018.
The NNS data series available in Pakistan has been used to report FIES, stun�ng, and now was�ng. It gives a higher prevalence than either PDHS or the Joint Child Malnutri�on Es�mate on was�ng, but as men�oned it is preferred because it is more recent, and furthermore it contains provincial level informa�on, and in the latest survey, district-level informa�on¹⁶. Using the NNS, we can look at the trend of was�ng in the country. Over the past eighteen years, the was�ng rates in children under age five have consistently increased from 14.2 percent in 2001 to 15.1 percent in 2011 and 17.7 percent in 2018¹⁷.
1.2.2 WASTING AMONG CHILDREN UNDER FIVE YEARS OF AGE
Childhood was�ng is a reflec�on of acute malnutri�on in children, with wasted children being too thin for their height. This indicator refers to acute undernutri�on caused by recent nutri�onal deficiency due to changes in the availability of food and/or infec�ous diseases such as diarrhoea. It occurs when children rapidly lose weight and is o�en the result of illness coupled with inadequate care and feeding prac�ces with diets that do not meet the child's nutri�onal needs. Was�ng, par�cularly prolonged severe was�ng, is a life-threatening condi�on that has serious adverse effects on growth and brain development.
The Asia and the Pacific Regional Overview of Food Security and Nutri�on 2018 reports that the Asia Pacific has the highest prevalence and burden of wasted children in the world. South Asia, in turn, has the largest burden of wasted children in the Asia Pacific, such that half of the
16. We note that while the NNS findings we are using show the prevalence of was�ng increasing, the PDHS findings show the percentage of children who are wasted has declined from 11 percent to 7 percent since 2012-13.17. The values reported in this report are based on findings of NNS 2018 and differ from those published in the Global SOFI Report 2019. Results of Pakistan Demographic Health Survey (PDHS) 2017-18 were reported in the Global SOFI Report.
24
PAKISTAN OVERVIEW OF FOOD SECURITY AND NUTRITION 2019

Figure 16: Trend in Prevalence of Wasting among Children under Five Years of Age in Pakistan (Percent)
Source: NNS 2018
Analysis by provinces show that the prevalence of was�ng among 6-59 months children is highest in Sindh, followed by Balochistan and Punjab and KP, whereas among the regions, it is highest (lowest) in KP-NMD (GB). The recurring dry spell in southern parts of Sindh and most parts of Baluchistan has further aggravated the high burden of acute malnutri�on.
The NNS 2018 showed that the was�ng prevalence in Pakistan was 17.7 percent with a slightly higher prevalence in boys (18.4 percent) compared to the girls (17.0 percent). The prevalence of was�ng in rural areas was higher (18.6 percent) compared to urban areas (16.2 percent).
Figure 17: Prevalence of Wasting among Children under Five Years of Age by Provinces/Regions (Percent)
Source: NNS 2018
25
Part 1:FOOD SECURITY AND NUTRITION IN PAKISTAN

declined between 2001 and 2011 and then increased whereas in KP it ini�ally increased and then declined since 2011.
Further, trend analysis reveals that the prevalence of was�ng has increased steadily in Punjab and Balochistan since 2001, in Sindh it
Figure 18: Trend in Prevalence of Wasting among Children under Five Years of Age by Provinces (Percent)
Source: NNS 2018
suggests that malnutri�on is rampant across the life course and that integrated strategies for preven�on and management will be needed. The age distribu�on of was�ng and stun�ng differs, but both condi�ons may already be present at birth (in underweight babies) and persist concurrently in the first year of life.
1.2.3 UNDERWEIGHT, OVERWEIGHT AND OBESITY AMONG CHILDREN UNDER 5 YEARS OF AGE
The high prevalence of underweight children in Pakistan remains a concern. The prevalence of underweight among children under five years of age over the past three NNS surveys is in decline, with 38 percent in 2001, 31 percent in 2011 and 28.9 percent in 2018¹⁸.
Regarding age distribu�on, a trend of decreasing was�ng rate with increasing age has been seen. Was�ng was found to be highest (26.6 percent) in 0 to 5 months of age and lowest (14.7 percent) in 48 to 59 months of age. Was�ng was highest (23.0 percent) in children where the household belonged to the poorest quin�le, however, a substan�al propor�on (14.6 percent) was also found to be wasted in the richest quin�le. Was�ng was also found to be high (19.4 percent) among children whose mothers were illiterate.
The NNS 2018 for the first �me presented concurrence of stun�ng and was�ng, largely clustered in the south of the country and indica�ve of a close rela�on between these two forms of malnutri�on. The concurrence of stun�ng and was�ng in 5.9 percent of children
18. The values reported in this report are based on findings of NNS 2018 and differ from those published in the Global SOFI Report 2019. Results of Pakistan Demographic Health Survey (PDHS) 2017-18 were reported in the Global SOFI Report.
26
PAKISTAN OVERVIEW OF FOOD SECURITY AND NUTRITION 2019
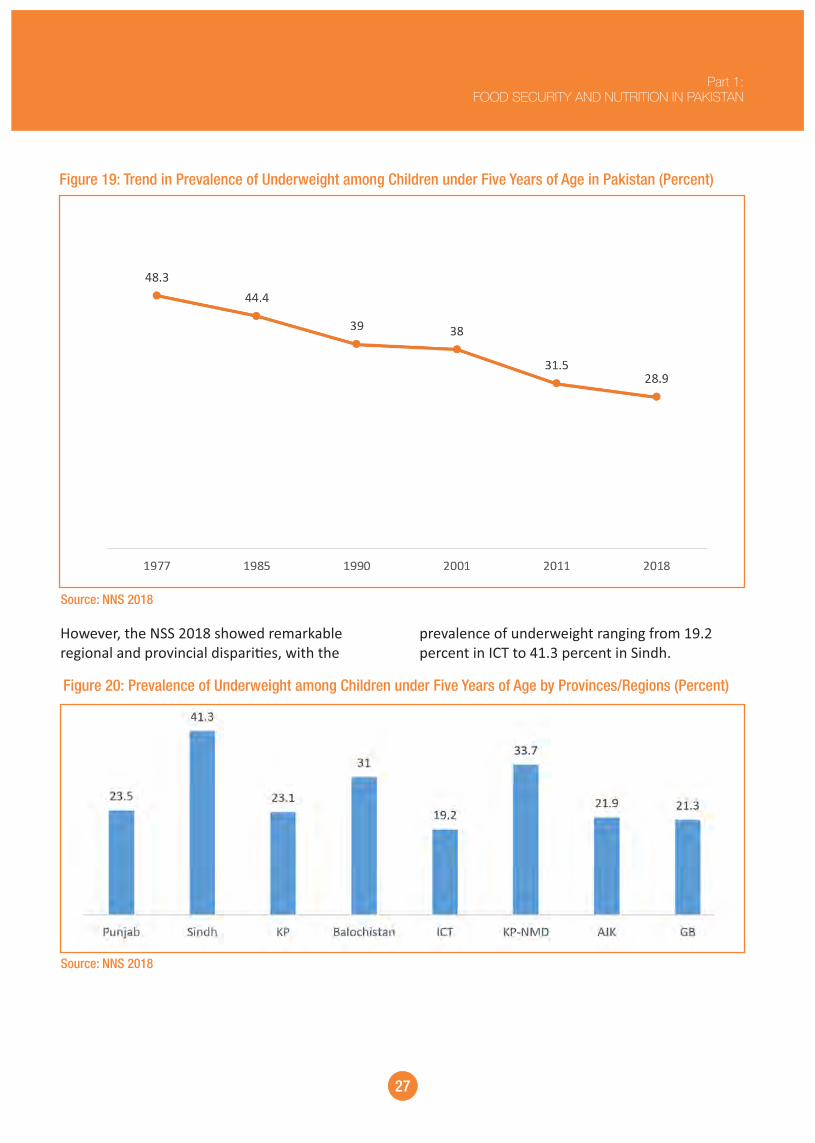
Figure 19: Trend in Prevalence of Underweight among Children under Five Years of Age in Pakistan (Percent)
prevalence of underweight ranging from 19.2 percent in ICT to 41.3 percent in Sindh.
However, the NSS 2018 showed remarkable regional and provincial dispari�es, with the
Source: NNS 2018
Figure 20: Prevalence of Underweight among Children under Five Years of Age by Provinces/Regions (Percent)
Source: NNS 2018
27
Part 1:FOOD SECURITY AND NUTRITION IN PAKISTAN
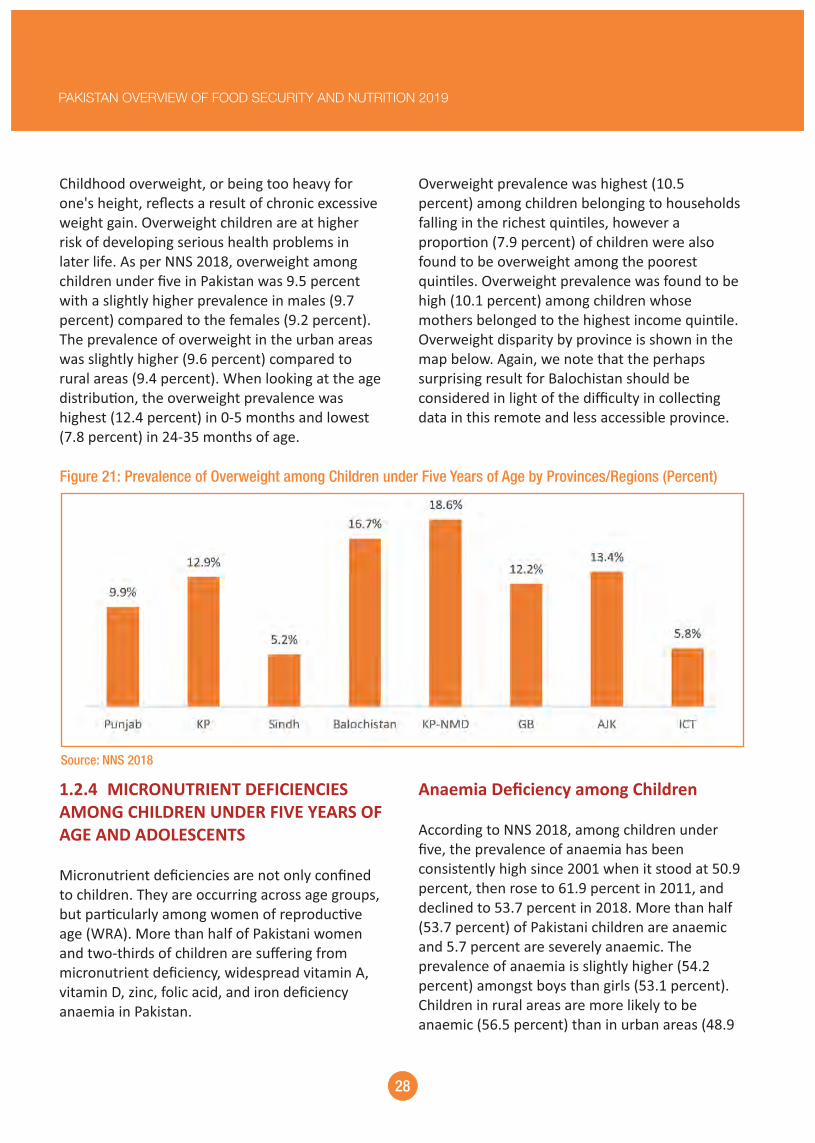
Overweight prevalence was highest (10.5 percent) among children belonging to households falling in the richest quin�les, however a propor�on (7.9 percent) of children were also found to be overweight among the poorest quin�les. Overweight prevalence was found to be high (10.1 percent) among children whose mothers belonged to the highest income quin�le. Overweight disparity by province is shown in the map below. Again, we note that the perhaps surprising result for Balochistan should be considered in light of the difficulty in collec�ng data in this remote and less accessible province.
Childhood overweight, or being too heavy for one's height, reflects a result of chronic excessive weight gain. Overweight children are at higher risk of developing serious health problems in later life. As per NNS 2018, overweight among children under five in Pakistan was 9.5 percent with a slightly higher prevalence in males (9.7 percent) compared to the females (9.2 percent). The prevalence of overweight in the urban areas was slightly higher (9.6 percent) compared to rural areas (9.4 percent). When looking at the age distribu�on, the overweight prevalence was highest (12.4 percent) in 0-5 months and lowest (7.8 percent) in 24-35 months of age.
Figure 21: Prevalence of Overweight among Children under Five Years of Age by Provinces/Regions (Percent)
Source: NNS 2018
Anaemia Deficiency among Children
According to NNS 2018, among children under five, the prevalence of anaemia has been consistently high since 2001 when it stood at 50.9 percent, then rose to 61.9 percent in 2011, and declined to 53.7 percent in 2018. More than half (53.7 percent) of Pakistani children are anaemic and 5.7 percent are severely anaemic. The prevalence of anaemia is slightly higher (54.2 percent) amongst boys than girls (53.1 percent). Children in rural areas are more likely to be anaemic (56.5 percent) than in urban areas (48.9
1.2.4 MICRONUTRIENT DEFICIENCIES AMONG CHILDREN UNDER FIVE YEARS OF AGE AND ADOLESCENTS
Micronutrient deficiencies are not only confined to children. They are occurring across age groups, but par�cularly among women of reproduc�ve age (WRA). More than half of Pakistani women and two-thirds of children are suffering from micronutrient deficiency, widespread vitamin A, vitamin D, zinc, folic acid, and iron deficiency anaemia in Pakistan.
28
PAKISTAN OVERVIEW OF FOOD SECURITY AND NUTRITION 2019

Figure 22: Iron Deficiency among Children under Five Years of Age in Pakistan (Percent)
Source: NNS 2018
children of which 13.2 percent have severe Vitamin D deficiency. The prevalence of vitamin D deficiency is also slightly higher (63.1 percent) in boys compared to the girls (62.4 percent), with severe deficiency also being higher (13.5 percent) in girls compared to boys (12.9 percent).
Zink Deficiency among ChildrenThe prevalence of Zinc deficiency among children in Pakistan is 18.6 percent with a similar propor�on among boys and girls. Zinc deficiency is found to be slightly higher (19.5 percent) in the rural popula�on compared to 17.1 percent in urban.
Vitamin A Deficiency among ChildrenNNS 2018 reveals that 51.5 percent of children age 6-59 months have Vitamin A deficiency (VAD), of which 12.1 percent have severe VAD. VAD prevalence is slightly higher (51.7 percent) in boys compared to the girls (51.3 percent), while severe VAD is also higher (12.4 percent) in boys compared to girls (11.8 percent). Children in rural areas have slightly more (51.7 percent) VAD compared to the urban areas (51.2 percent).
Vitamin D Deficiency among ChildrenThe prevalence of vitamin D deficiency reveals a high prevalence (62.7 percent) among Pakistani
29
Part 1:FOOD SECURITY AND NUTRITION IN PAKISTAN

significantly fewer girls are underweight; slightly less are obese compared to boys. A similar pa�ern is observed in both rural and urban areas of Pakistan and by province.
Nutri�on Status of Adolescents
The NNS 2018 shows considerably more adolescent girls than boys are of normal weight based on BMI; slightly more are overweight;
Figure 23: Nutritional Status of Adolescents in Pakistan (Percent)
Source: NNS 2018
30
PAKISTAN OVERVIEW OF FOOD SECURITY AND NUTRITION 2019

Figure 24: Nutritional Status of Adolescents by Urban-Rural Region (Percent)
Source: NNS 2018
Figure 25: Nutritional Status of Adolescent Girls by Provinces/Regions (Percent)
Source: NNS 2018
and the consequent incidence of pregnancies to anaemic women.
1.2.5 BREASTFEEDING AND COMPLEMENTARY FEEDING
High levels of malnutri�on have serious consequences on the health and survival of
Further, more than half (56.6 percent) of adolescent girls in Pakistan are anaemic; adolescent girls in rural areas are more likely (58.1 percent) to be anaemic than their counterparts in urban areas (54.2 percent). This fact has strong implica�ons for child nutri�on given the trend of early marriage and child marriage in Pakistan, par�cularly in rural areas,
31
Part 1:FOOD SECURITY AND NUTRITION IN PAKISTAN

Figure 26: Nutritional Status of Adolescent Boys by Provinces/Regions (Percent)
Source: NNS 2018
children receiving breastmilk during the first hour a�er birth between 2011 and 2018, the trend for exclusive breas�eeding is not linear. From 50 percent in 2001, it decreased to 37.7 percent in 2011 and increased again to 48.3 percent in 2018, bringing Pakistan close to the WHA target of 50 percent. The propor�on of children who are exclusively breas�ed for the first six months of life is highest in KP (60.8 percent) and KP-NMD (59.0 percent), and lowest in AJK (42.1 percent) and Balochistan (43.7 percent) respec�vely.
infants and young children. Appropriate infant and young child feeding (IYCF) prac�ces have been iden�fied as important for appropriate child growth and development. Children in Pakistan s�ll experience high rates of malnutri�on, indica�ng a likely need for improved IYCF prac�ces, which includes exclusive breas�eeding for the first six months and then appropriate complementary feeding and con�nued breas�eeding up to two years of age. While there has been a steady increase in the propor�on of
Figure 27: Exclusive Breastfeeding for First Six Months by Provinces/Regions (Percent)
Source: NNS 2018
32
PAKISTAN OVERVIEW OF FOOD SECURITY AND NUTRITION 2019
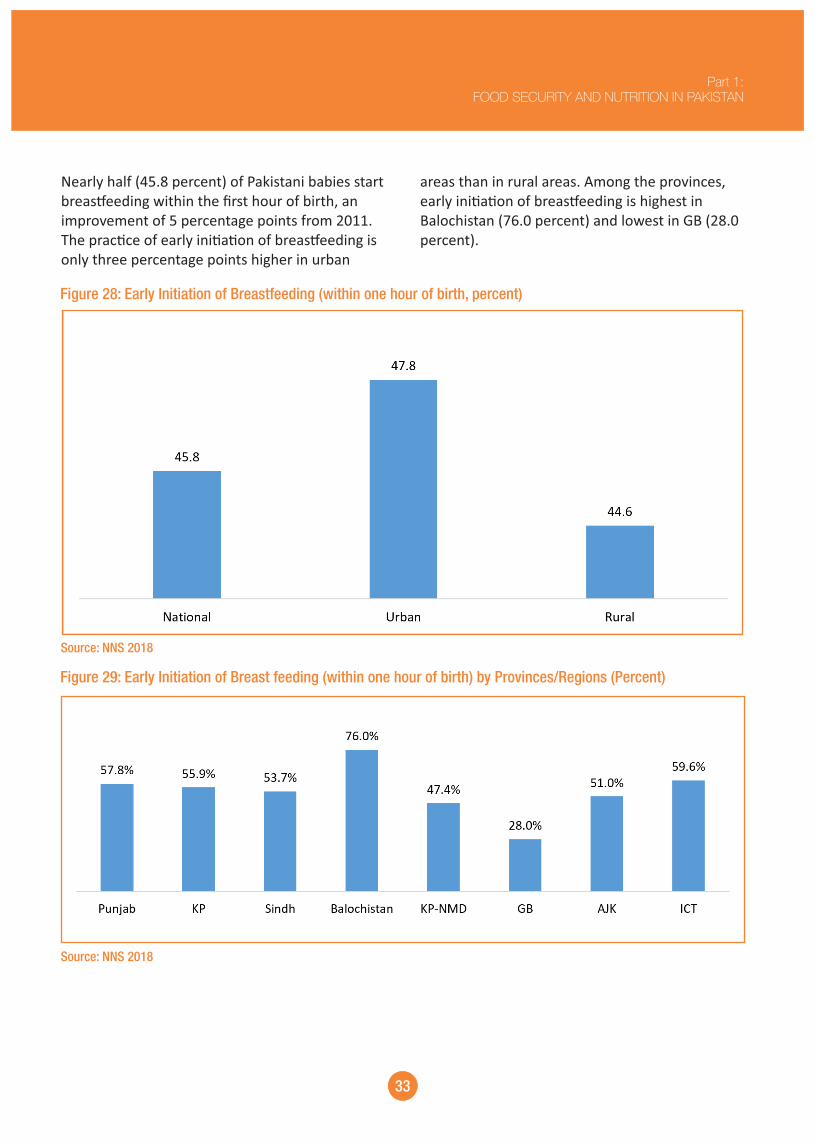
areas than in rural areas. Among the provinces, early ini�a�on of breas�eeding is highest in Balochistan (76.0 percent) and lowest in GB (28.0 percent).
Nearly half (45.8 percent) of Pakistani babies start breas�eeding within the first hour of birth, an improvement of 5 percentage points from 2011. The prac�ce of early ini�a�on of breas�eeding is only three percentage points higher in urban
Figure 28: Early Initiation of Breastfeeding (within one hour of birth, percent)
Source: NNS 2018
Figure 29: Early Initiation of Breast feeding (within one hour of birth) by Provinces/Regions (Percent)
Source: NNS 2018
33
Part 1:FOOD SECURITY AND NUTRITION IN PAKISTAN


home-based foods tends to be poor. Some provinces/regions (Sindh and KP-NMD) perform be�er than others do but the �mely introduc�on of complementary feeding needs significant improvement across Pakistan. Only one in seven children (14.2 percent) aged 6–23 months receive a meal with minimum dietary diversity, with at least four different food groups. One in four children (18.2 percent) receive the minimum number of meals a day. Complementary foods that meet the requirements of a minimum acceptable diet to ensure op�mal growth and development for children aged 6 to 23 months are provided to less than one in 20 children (3.6 percent). More children in urban areas receive adequate complementary foods than their peers in rural areas, but rates are cri�cally low in both locali�es.
Prevalence of the prac�ce of con�nued breas�eeding is highest at one year of age (68.4 percent) and therea�er decreases to 56.5 percent at two years of age, with no significant difference by gender and locality. Rela�ve to the rates in 2011 this represents a decrease from 77.3 percent at one year of age and an increase from 54.3 percent at two years of age, respec�vely.
Age-appropriate complementary feeding is an essen�al addi�on to breas�eeding a�er a child is six months of age. Quality complementary feeding is measured using three indicators: minimum dietary diversity, minimum meal frequency, and minimum acceptable diet. NNS 2018 found all indicators to be far below acceptable levels. The results show that 54 percent of children aged 6 to 8 months receive �mely complementary foods; the quality of
Figure 30: Complementary Feeding Practices by Province/Regions (Percent)
Source: NNS 2018
35
Part 1:FOOD SECURITY AND NUTRITION IN PAKISTAN
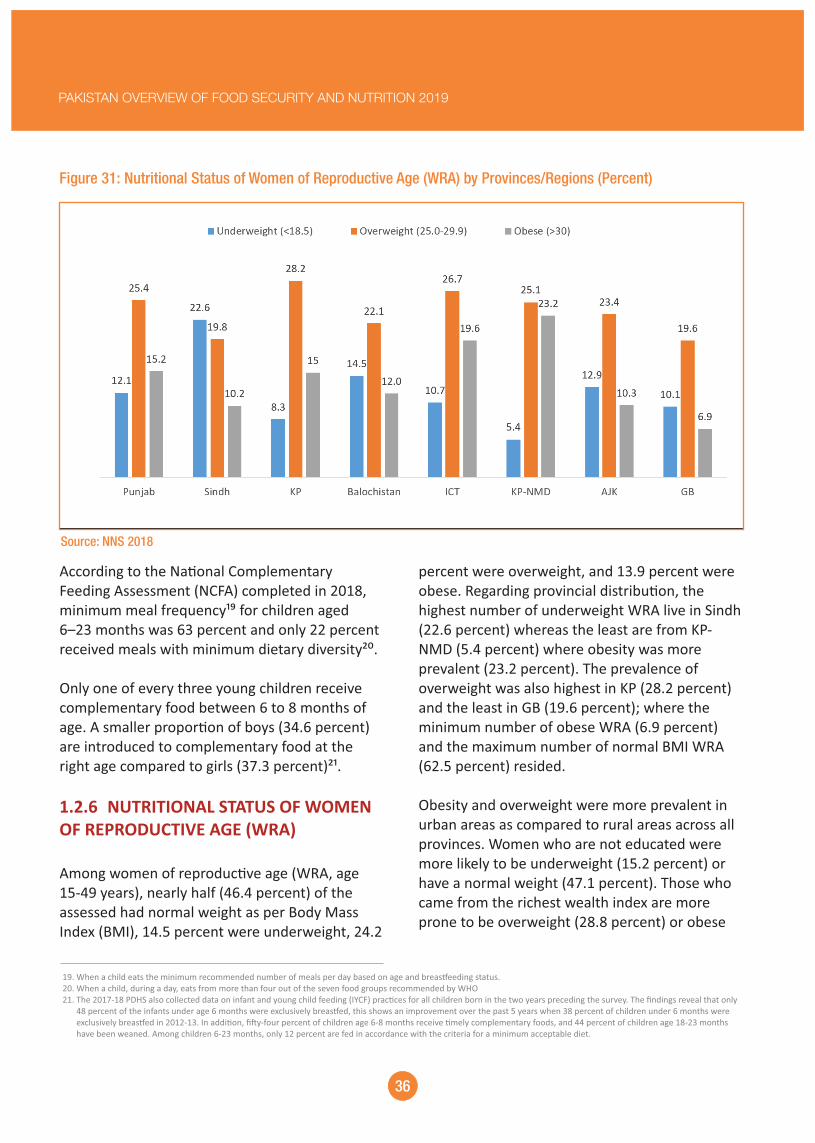
Figure 31: Nutritional Status of Women of Reproductive Age (WRA) by Provinces/Regions (Percent)
Source: NNS 2018
19. When a child eats the minimum recommended number of meals per day based on age and breas�eeding status. 20. When a child, during a day, eats from more than four out of the seven food groups recommended by WHO 21. The 2017-18 PDHS also collected data on infant and young child feeding (IYCF) prac�ces for all children born in the two years preceding the survey. The findings reveal that only
48 percent of the infants under age 6 months were exclusively breas�ed, this shows an improvement over the past 5 years when 38 percent of children under 6 months were exclusively breas�ed in 2012-13. In addi�on, fi�y-four percent of children age 6-8 months receive �mely complementary foods, and 44 percent of children age 18-23 months have been weaned. Among children 6-23 months, only 12 percent are fed in accordance with the criteria for a minimum acceptable diet.
percent were overweight, and 13.9 percent were obese. Regarding provincial distribu�on, the highest number of underweight WRA live in Sindh (22.6 percent) whereas the least are from KP-NMD (5.4 percent) where obesity was more prevalent (23.2 percent). The prevalence of overweight was also highest in KP (28.2 percent) and the least in GB (19.6 percent); where the minimum number of obese WRA (6.9 percent) and the maximum number of normal BMI WRA (62.5 percent) resided.
Obesity and overweight were more prevalent in urban areas as compared to rural areas across all provinces. Women who are not educated were more likely to be underweight (15.2 percent) or have a normal weight (47.1 percent). Those who came from the richest wealth index are more prone to be overweight (28.8 percent) or obese
According to the Na�onal Complementary Feeding Assessment (NCFA) completed in 2018, minimum meal frequency¹⁹ for children aged 6–23 months was 63 percent and only 22 percent received meals with minimum dietary diversity²⁰.
Only one of every three young children receive complementary food between 6 to 8 months of age. A smaller propor�on of boys (34.6 percent) are introduced to complementary food at the right age compared to girls (37.3 percent)²¹.
1.2.6 NUTRITIONAL STATUS OF WOMEN OF REPRODUCTIVE AGE (WRA)
Among women of reproduc�ve age (WRA, age 15-49 years), nearly half (46.4 percent) of the assessed had normal weight as per Body Mass Index (BMI), 14.5 percent were underweight, 24.2
36
PAKISTAN OVERVIEW OF FOOD SECURITY AND NUTRITION 2019
(15 percent), and in rural Sindh more than a quarter of women (26 percent) are underweight. Whereas, regions with a high prevalence of overweight and obese women include ICT Islamabad (68 percent), NMDs (58 percent), Khyber Pakhtunkhwa (57 percent), and Punjab (56 percent).
Anaemia among WRA
NNS survey 2018 reveals that 42.6 percent of WRA were anaemic with higher propor�on coming from rural areas (44.2 percent) than the urban se�ngs (40.1 percent). The prevalence of severe anaemia was 1.0 percent and was more prominent among rural women (1.2 percent). When taking provincial distribu�on into account, it was evident that the highest prevalence of anaemia was present in Balochistan (61.3 percent) followed by AJK (55.8 percent) and KP-NMD (52.1 percent) with severe anaemia prevalence of 4.7 percent, 0.3 percent and 1.0 percent respec�vely.Iron deficiency anaemia among WRA was 18.2 percent, which was more pronounced among those residing in rural areas (18.7 percent versus 17.4 percent among urban). Sindh was found to have a higher propor�on of iron deficiency anaemia i.e. about a quarter (22.8 percent) of all WRAs, whereas Balochistan (18.6 percent) and Punjab (17.9 percent) followed closely.
(20.3 percent) as compared to underweight WRA (24.2 percent) who largely belong to poorest quin�les.
Trend analysis shows that the propor�on of underweight WRA has almost remained unchanged between 2001 (13.3 percent) and 2018 (14.4 percent) with a slight spike in 2011 (18 percent). On the other hand, a consistent decline was observed in WRA with normal weight from 2001 to 2018; with less than half of the WRA (46.1 percent) having normal weight in the 2018 survey. In 2011, overweight and obesity were lower than what was observed in the 2001 NNS data. However, both overweight and obesity rose in 2018. Women in urban areas are more likely to be overweight and obese, while in rural areas women are more likely to be underweight.
As per the findings of PDHS 2017-18, over the past 5 years the propor�on of underweight women has decreased from 14 percent to 9 percent. Overweight/obesity increases with increase to economic and educa�on access. The findings are evident that 40 percent of women in the highest wealth quin�le are overweight compared with only 16 percent in the lowest wealth quin�le. Similarly, 12 percent of women with no educa�on are underweight (12 percent) compared with only 4 percent of those with secondary or higher educa�on. The prevalence of women who are underweight is highest in Sindh
37
Part 1:FOOD SECURITY AND NUTRITION IN PAKISTAN
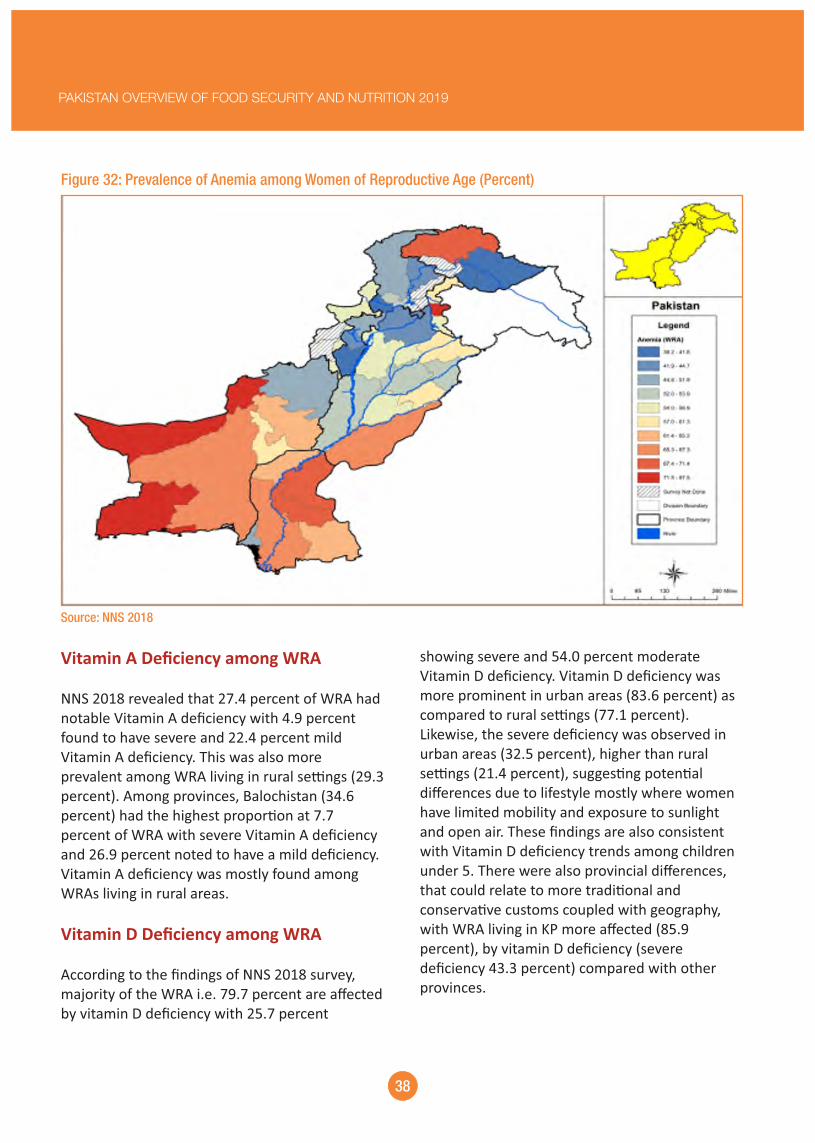
showing severe and 54.0 percent moderate Vitamin D deficiency. Vitamin D deficiency was more prominent in urban areas (83.6 percent) as compared to rural se�ngs (77.1 percent). Likewise, the severe deficiency was observed in urban areas (32.5 percent), higher than rural se�ngs (21.4 percent), sugges�ng poten�al differences due to lifestyle mostly where women have limited mobility and exposure to sunlight and open air. These findings are also consistent with Vitamin D deficiency trends among children under 5. There were also provincial differences, that could relate to more tradi�onal and conserva�ve customs coupled with geography, with WRA living in KP more affected (85.9 percent), by vitamin D deficiency (severe deficiency 43.3 percent) compared with other provinces.
Vitamin A Deficiency among WRA
NNS 2018 revealed that 27.4 percent of WRA had notable Vitamin A deficiency with 4.9 percent found to have severe and 22.4 percent mild Vitamin A deficiency. This was also more prevalent among WRA living in rural se�ngs (29.3 percent). Among provinces, Balochistan (34.6 percent) had the highest propor�on at 7.7 percent of WRA with severe Vitamin A deficiency and 26.9 percent noted to have a mild deficiency. Vitamin A deficiency was mostly found among WRAs living in rural areas.
Vitamin D Deficiency among WRA
According to the findings of NNS 2018 survey, majority of the WRA i.e. 79.7 percent are affected by vitamin D deficiency with 25.7 percent
Figure 32: Prevalence of Anemia among Women of Reproductive Age (Percent)
Source: NNS 2018
38
PAKISTAN OVERVIEW OF FOOD SECURITY AND NUTRITION 2019


Part 2
Food Insecurity and Malnutrition in Pakistan – Drivers and Determinants
While recognizing these many different causes, this report considers four selected sets of factors that are contribu�ng to the food security and nutri�on situa�on:
1. Poverty
2. Climate related natural disasters
3. Food quality and safety
4. Water, sanita�on and hygiene (WASH)
Food insecurity and malnutri�on have mul�ple drivers and determinants, and many of these are present in the Pakistan context. Insufficient dietary intake and diseases reflect the direct reasons for insufficient nutrients at an individual level. The underlying causes of that are of a more complex nature, and include poor care prac�ces and ea�ng habits, household food insecurity, and lack of access to health services and facili�es. Finally, structural causes refer to basic resource alloca�on at societal level, over and above unchangeable factors such as geography and climate. They may reflect long-term problems requiring interven�ons to change policies and societal a�tudes.
42
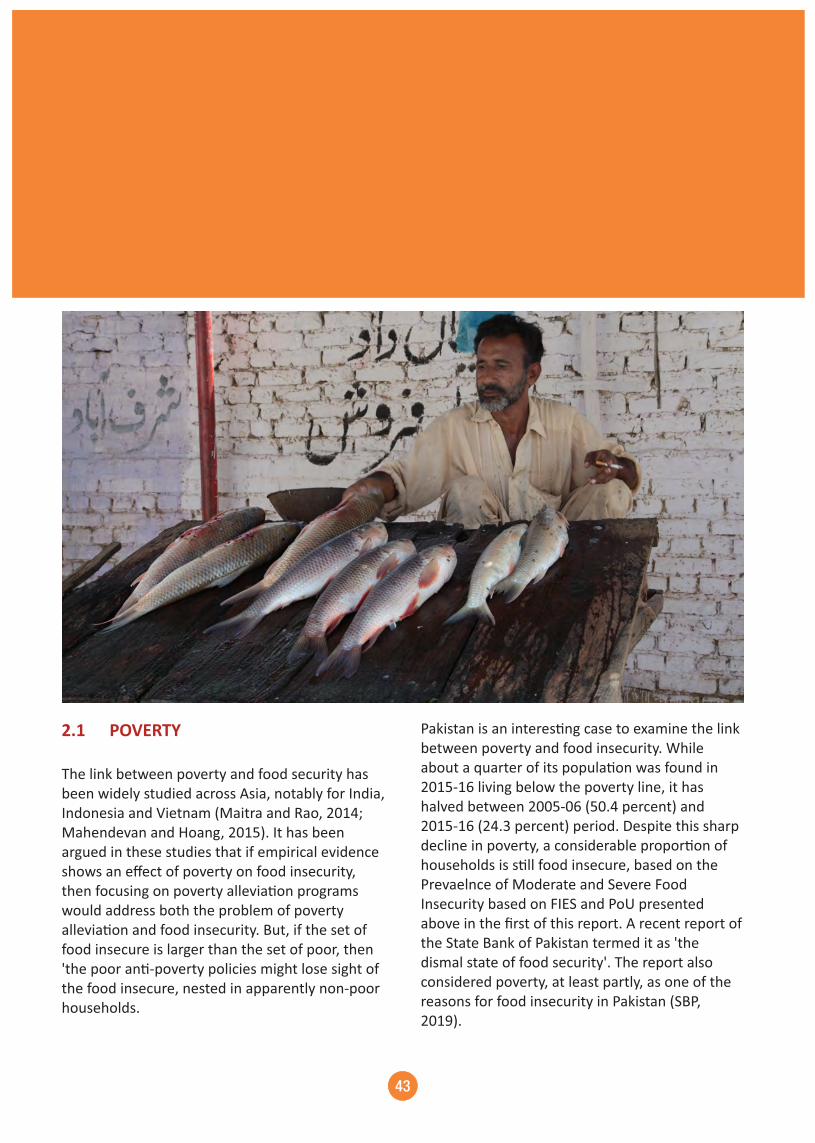
Pakistan is an interes�ng case to examine the link between poverty and food insecurity. While about a quarter of its popula�on was found in 2015-16 living below the poverty line, it has halved between 2005-06 (50.4 percent) and 2015-16 (24.3 percent) period. Despite this sharp decline in poverty, a considerable propor�on of households is s�ll food insecure, based on the Prevaelnce of Moderate and Severe Food Insecurity based on FIES and PoU presented above in the first of this report. A recent report of the State Bank of Pakistan termed it as 'the dismal state of food security'. The report also considered poverty, at least partly, as one of the reasons for food insecurity in Pakistan (SBP, 2019).
2.1 POVERTY
The link between poverty and food security has been widely studied across Asia, notably for India, Indonesia and Vietnam (Maitra and Rao, 2014; Mahendevan and Hoang, 2015). It has been argued in these studies that if empirical evidence shows an effect of poverty on food insecurity, then focusing on poverty allevia�on programs would address both the problem of poverty allevia�on and food insecurity. But, if the set of food insecure is larger than the set of poor, then 'the poor an�-poverty policies might lose sight of the food insecure, nested in apparently non-poor households.
43

guarantee food security, par�cularly for the poor. Pakistani governments have designed some safety net programs for the poor, including the Benazir Income Support Program (BISP), Pakistan Bait-ul-Mal, and Zakat and Usher²². The main criterion for iden�fying recipients for these programs is poverty, which may exclude many food insecure households.
2.1.1 POVERTY TRENDS IN PAKISTAN: NATIONAL AND PROVINCIAL DIMENSIONS
Poverty es�mates based on Cost of Basic Needs (CBN) method, the official poverty line, show a linear decline in poverty at the na�onal level between 2001-02 and 2015-16 period; in fact, poverty incidence halved overall from 50 percent to 24 percent in the ten years from 2005-06 to 2015-16. Poverty declined in both urban and rural areas, although the decline is more pronounced among urban popula�on than their rural counterparts (Figure 33). In 2015-16, rural poverty (30.7 percent) was two and half �mes higher than the urban poverty (12.5 percent).
Another noteworthy dimension of food insecurity in Pakistan is that its prevalence varies across the provinces and regions of the country, as the NSS 2018 shows that Sindh and Balochistan are rela�vely less food secure than other provinces and regions of the country. Although the Government of Pakistan has not provided informa�on on the province-level incidence of poverty, the independent studies carried out at provincial, regional, zonal and district levels support the NNS data by showing rela�vely higher incidence of poverty in areas of Sindh and Balochistan than in areas of other provinces and regions. The 10-year decline in poverty noted above has been witnessed across the provinces (World Bank, 2018). Nevertheless, the rate of change in poverty incidence and contribu�ng factors in poverty reduc�on varies across the provinces.The major focus of Pakistan for ensuring food security has historically remained on the supply side, covering the food availability dimension and to an extent food accessibility. It has primarily focused on na�onal self-sufficiency in wheat (Ahmed and Farooq, 2010; SBP, 2019). However, na�onal self-sufficiency does not per se
Figure 33: Trend in Poverty Incidence based on Cost of Basic Needs (CBN) Method in Pakistan and Urban-Rural Regions
Source: Planning Commission 2017
22.The other programs mainly by provinces include school feeding, safe motherhood and child nutri�on etc.
44
PAKISTAN OVERVIEW OF FOOD SECURITY AND NUTRITION 2019
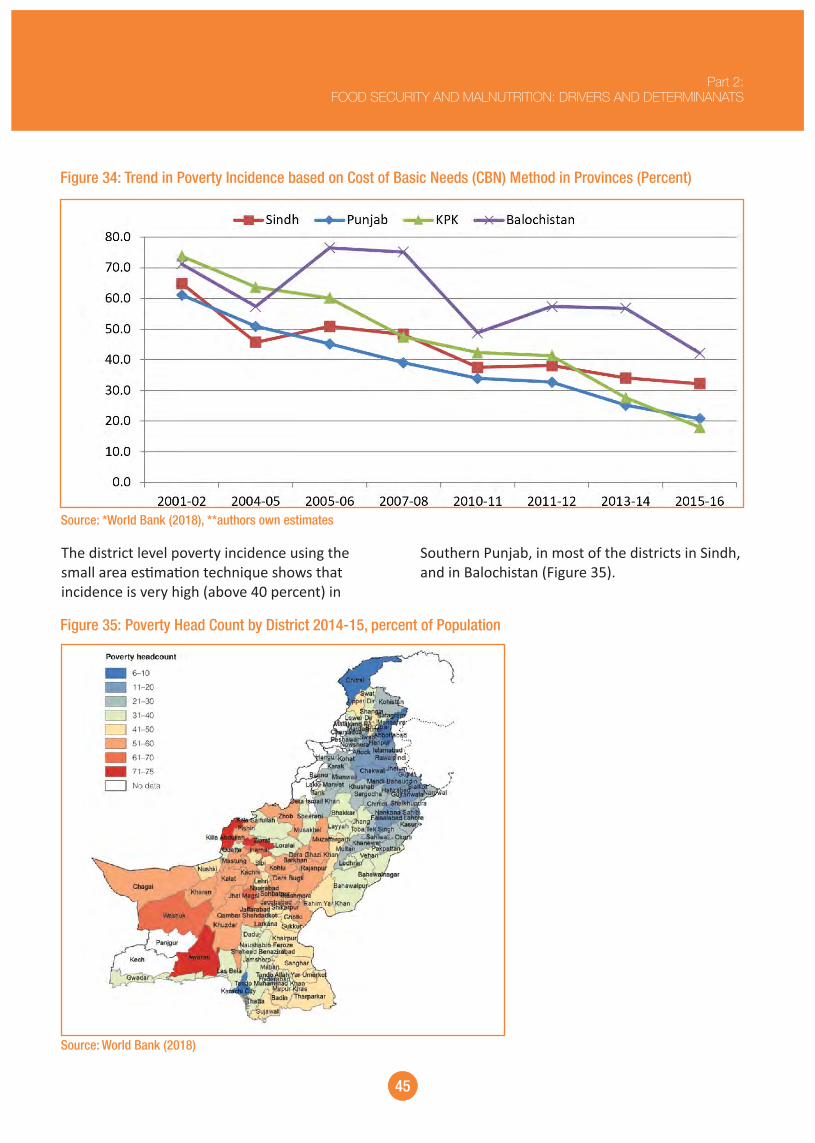
Figure 34: Trend in Poverty Incidence based on Cost of Basic Needs (CBN) Method in Provinces (Percent)
Source: *World Bank (2018), **authors own estimates
Southern Punjab, in most of the districts in Sindh, and in Balochistan (Figure 35).
The district level poverty incidence using the small area es�ma�on technique shows that incidence is very high (above 40 percent) in
Figure 35: Poverty Head Count by District 2014-15, percent of Population
Source: World Bank (2018)
45
Part 2:FOOD SECURITY AND MALNUTRITION: DRIVERS AND DETERMINANATS

the decline is fi�y percent or less (Figure 36). The fastest decline in Khyber Pakhtunkhwa poverty is witnessed in both urban and rural areas. At present, the poverty level is lowest in KP while a decade ago (in 2005-06), it was third in the ranking. The incidence of urban poverty in Khyber Pakhtunkhwa (10 percent) is like urban poverty incidence in Punjab (9.9 percent), while rural poverty in Khyber Pakhtunkhwa is lowest among the four provinces of the country.
There is an encouraging and consistent decline in poverty across the four provinces of Pakistan and in their urban as well as rural areas, though it not of uniform magnitude across the provinces. The four main features of province-level poverty decline are as follows. First, the decline in poverty is much faster in Khyber Pakhtunkhwa than in other provinces. In Khyber Pakhtunkhwa, it declined by 70 percent in one decade - from 60 percent of the popula�on in 2005-06 to only 18 percent in 2015-16, whereas in other provinces,
Figure 36: Incidence of Poverty by Province (Percent)
Source: World Bank (2018), Authors own estimates
highest in Balochistan, where at least one in four households is found below the poverty line. Urban poverty in Balochistan is two and half �mes greater than urban poverty in Punjab and KP. Fourth, the urban and rural gap in poverty has widened during the last decade in all provinces of the country.
Second, the slowest poverty decline, 26 percent, is witnessed in rural Sindh (Figure 37). Poverty in rural Sindh is presently (2015-16) the highest among the provinces, even higher by one percentage point from poverty in rural Balochistan. About half of the rural popula�on of these two provinces (Sindh and Balochistan) live below the poverty line. Third, urban poverty is
46
PAKISTAN OVERVIEW OF FOOD SECURITY AND NUTRITION 2019
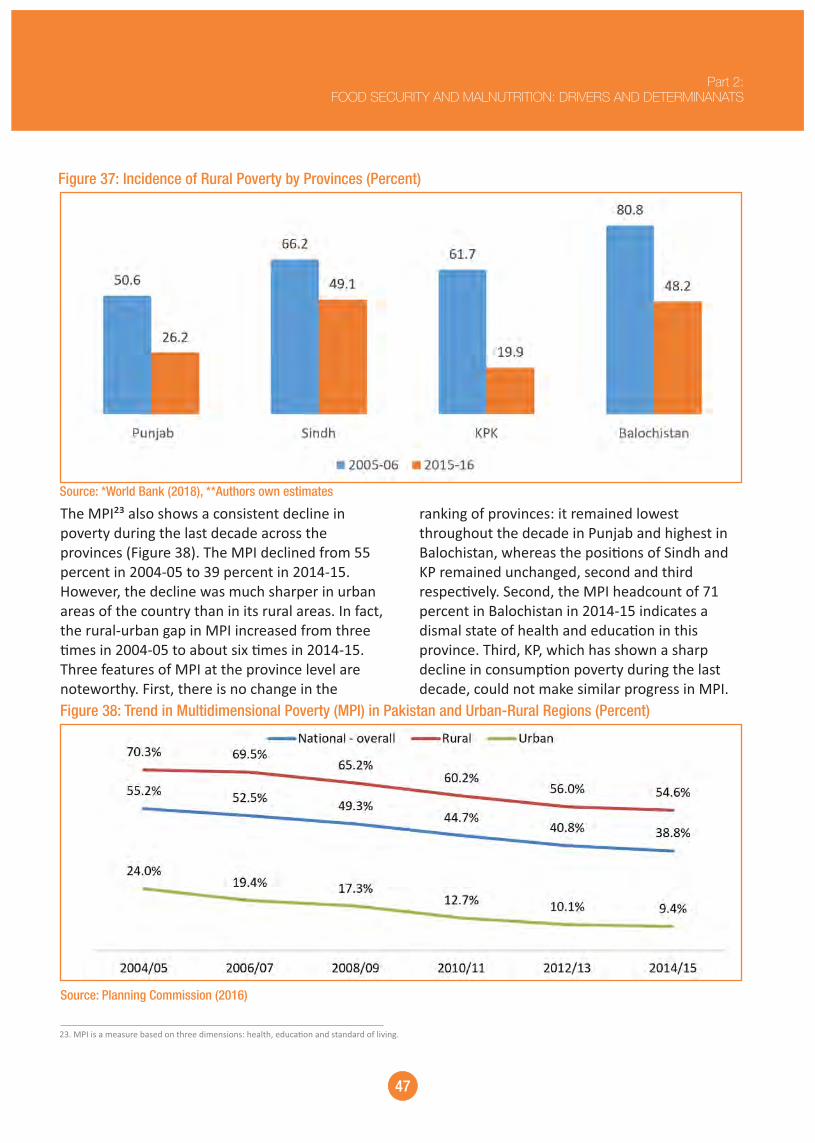
Figure 37: Incidence of Rural Poverty by Provinces (Percent)
Source: *World Bank (2018), **Authors own estimates
ranking of provinces: it remained lowest throughout the decade in Punjab and highest in Balochistan, whereas the posi�ons of Sindh and KP remained unchanged, second and third respec�vely. Second, the MPI headcount of 71 percent in Balochistan in 2014-15 indicates a dismal state of health and educa�on in this province. Third, KP, which has shown a sharp decline in consump�on poverty during the last decade, could not make similar progress in MPI.
The MPI²³ also shows a consistent decline in poverty during the last decade across the provinces (Figure 38). The MPI declined from 55 percent in 2004-05 to 39 percent in 2014-15. However, the decline was much sharper in urban areas of the country than in its rural areas. In fact, the rural-urban gap in MPI increased from three �mes in 2004-05 to about six �mes in 2014-15. Three features of MPI at the province level are noteworthy. First, there is no change in the
Figure 38: Trend in Multidimensional Poverty (MPI) in Pakistan and Urban-Rural Regions (Percent)
Source: Planning Commission (2016)
47
Part 2:FOOD SECURITY AND MALNUTRITION: DRIVERS AND DETERMINANATS
23. MPI is a measure based on three dimensions: health, educa�on and standard of living.
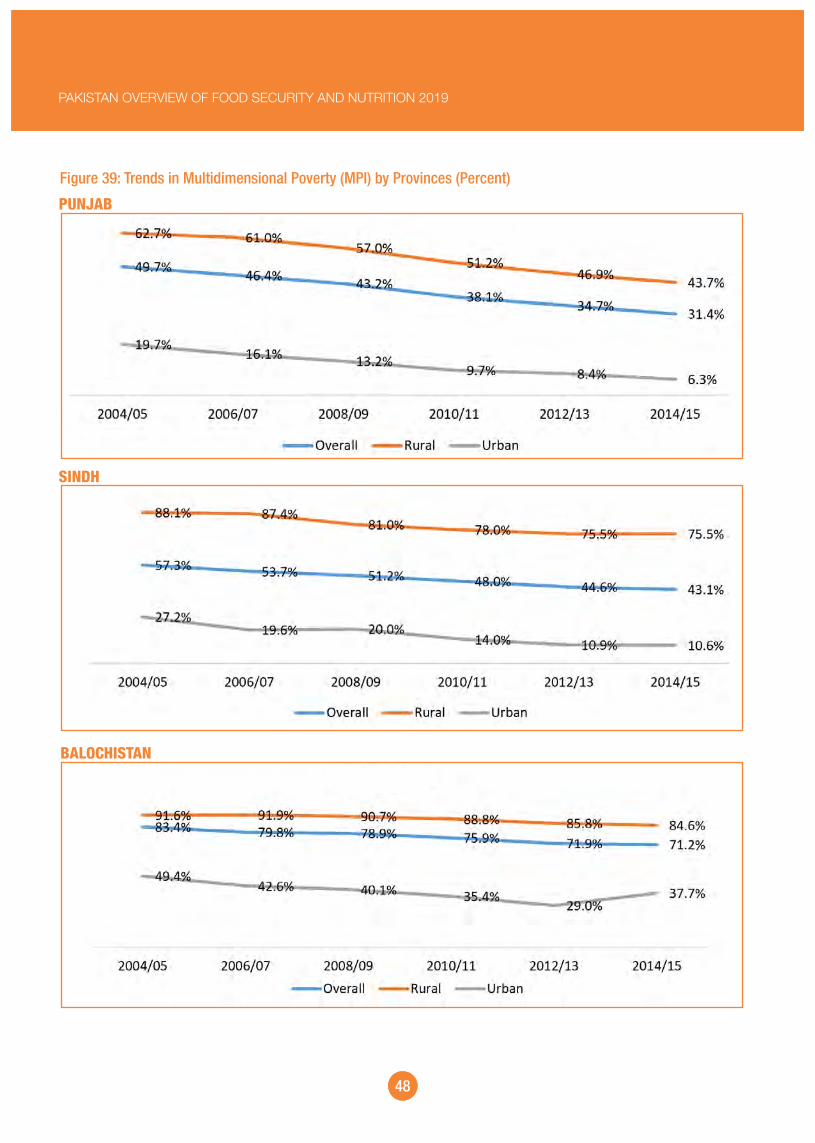
Figure 39: Trends in Multidimensional Poverty (MPI) by Provinces (Percent)
PUNJAB
SINDH
BALOCHISTAN
48
PAKISTAN OVERVIEW OF FOOD SECURITY AND NUTRITION 2019
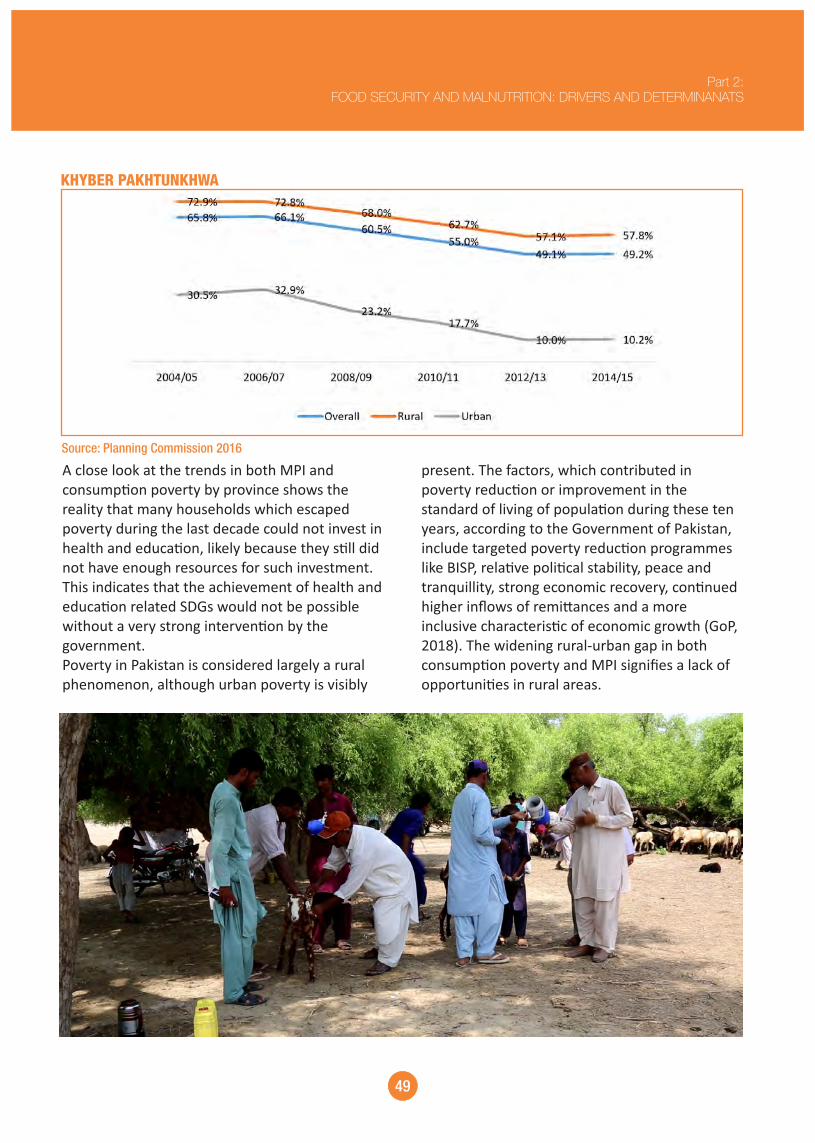
KHYBER PAKHTUNKHWA
Source: Planning Commission 2016
present. The factors, which contributed in poverty reduc�on or improvement in the standard of living of popula�on during these ten years, according to the Government of Pakistan, include targeted poverty reduc�on programmes like BISP, rela�ve poli�cal stability, peace and tranquillity, strong economic recovery, con�nued higher inflows of remi�ances and a more inclusive characteris�c of economic growth (GoP, 2018). The widening rural-urban gap in both consump�on poverty and MPI signifies a lack of opportuni�es in rural areas.
A close look at the trends in both MPI and consump�on poverty by province shows the reality that many households which escaped poverty during the last decade could not invest in health and educa�on, likely because they s�ll did not have enough resources for such investment. This indicates that the achievement of health and educa�on related SDGs would not be possible without a very strong interven�on by the government. Poverty in Pakistan is considered largely a rural phenomenon, although urban poverty is visibly
49
Part 2:FOOD SECURITY AND MALNUTRITION: DRIVERS AND DETERMINANATS

produc�vity and an increase in poverty incidence and even mortality. Thus, all manifesta�ons of climate change like drought, higher temperature, and heavy rainfalls have an impact on disease pressure and there is also growing evidence that these changes affect food safety and food security.
Pakistan is ranked as the country 8th most vulnerable to climate change. Pakistan has also experienced extreme clima�c events in the recent past. Pakistan has faced around 150 freak weather incidents a�ributed to climate change in the past 20 years, in the form of flash floods, drought, smog in winter, forest fires in summer, mel�ng glaciers, unusual heat waves with devasta�ng heat indices, landslides and displaced popula�ons. The agriculture sector in Pakistan has faced huge losses due to disasters, and annual losses reached up to USD 1,700 million in 2010, mainly due to floods (Figure 40). During the 2010-11 floods, almost 10 percent of the popula�on was displaced in both Sindh and KP provinces, with South Punjab also very affected.Droughts (meteorological and hydrological) are a form of environmental stress origina�ng from deficient precipita�on over an extended period of �me long enough to cause moisture stress for crops, bio�c loss, loss of human and animal lives and a general increase in hardships (Ngaira, 2004). Droughts have direct and indirect effects on livelihood, especially where they are more weather dependent. Overgrazing, poor water management, deser�fica�on, rain-fed agriculture, poor services, and weak environmental management are common issues of drought prone areas of Pakistan.
2.2 CLIMATE RELATED DISASTERS – VULNERABILITY AND FOOD SECURITY IN PAKISTAN
The frequent cyclic nature of droughts, floods and diseases/pathogens incidence is an important driver of food insecurity. Climate-related risks, uncertain�es and environmental degrada�on are also cri�cal factors, which exacerbates soil loss, deforesta�on and pest incidence, all of which affect food availability and subsequently food security. Climate change has its effect via increasing varia�ons in weather including temperature and precipita�on²⁴ affects humanity by disturbing food produc�on, the natural ecosystem, health and water supply. The impacts of global climate change on food systems are expected to be widespread, complex, geographically and temporally variable, and profoundly influenced by socioeconomic condi�ons. Climate induced disasters impact human well-being in ever increasing ways and complex manners.
Climate change affects food produc�on both directly - by changes in agro-ecological condi�ons and indirectly by affec�ng agricultural access²⁵. Climate change can also affect the food u�liza�on ability of the individuals by altering the condi�ons for food safety and changing the disease pressure from the vector, water, and food borne diseases. The most important worry about climate change and food security are that changing clima�c condi�ons can ini�ate a vicious circle where infec�ous diseases cause hunger, which in turn, increases the vulnerability of the popula�on to more infec�ous diseases. Its impact may lead to a substan�al decline in labour
50
PAKISTAN OVERVIEW OF FOOD SECURITY AND NUTRITION 2019
24. Changes in temperature and precipita�on associated with con�nued emissions of greenhouse gases effects that will bring changes in land suitability and crop yields.25. If climate fluctua�ons become more pronounced and widespread, droughts and floods, the dominant causes of short-term fluctua�ons in food produc�on in semi-arid and in
sub-humid areas, it will become more severe and frequent. In semiarid areas, droughts can drama�cally reduce crop yields and livestock numbers and its produc�vity.
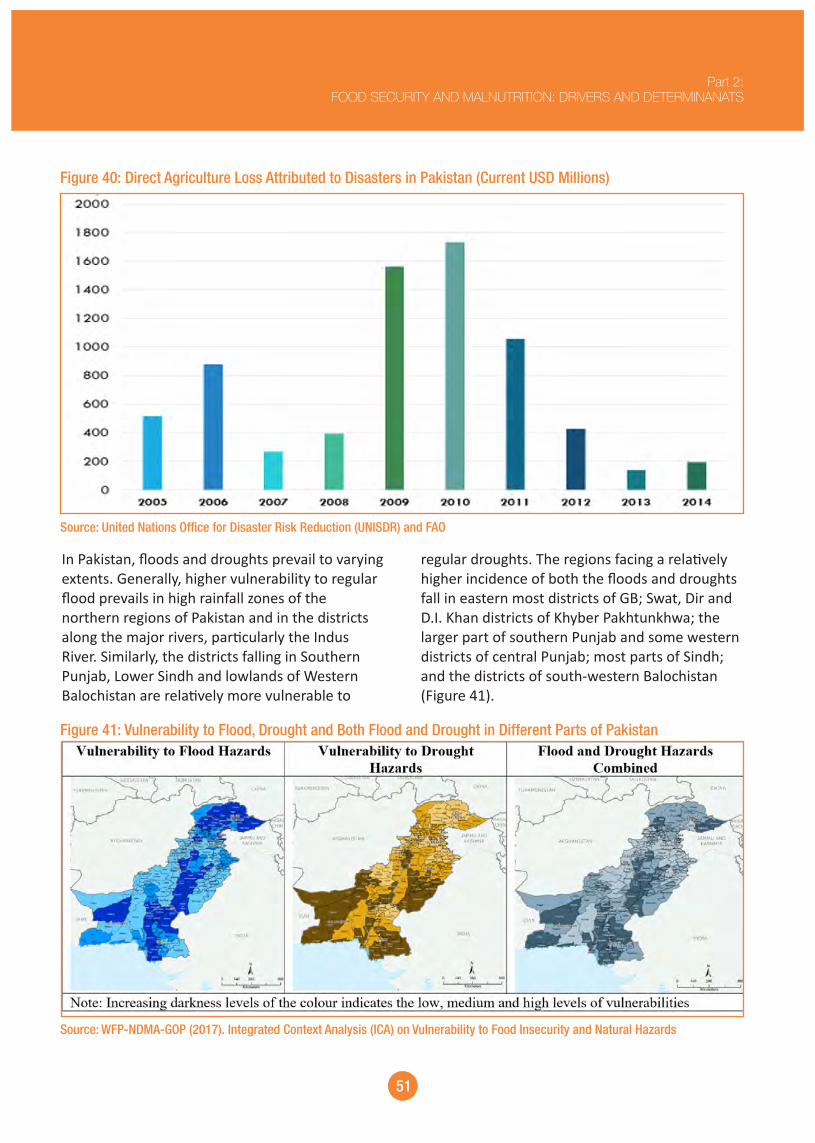
Figure 40: Direct Agriculture Loss Attributed to Disasters in Pakistan (Current USD Millions)
Source: United Nations Office for Disaster Risk Reduction (UNISDR) and FAO
regular droughts. The regions facing a rela�vely higher incidence of both the floods and droughts fall in eastern most districts of GB; Swat, Dir and D.I. Khan districts of Khyber Pakhtunkhwa; the larger part of southern Punjab and some western districts of central Punjab; most parts of Sindh; and the districts of south-western Balochistan (Figure 41).
In Pakistan, floods and droughts prevail to varying extents. Generally, higher vulnerability to regular flood prevails in high rainfall zones of the northern regions of Pakistan and in the districts along the major rivers, par�cularly the Indus River. Similarly, the districts falling in Southern Punjab, Lower Sindh and lowlands of Western Balochistan are rela�vely more vulnerable to
Figure 41: Vulnerability to Flood, Drought and Both Flood and Drought in Different Parts of Pakistan
Source: WFP-NDMA-GOP (2017). Integrated Context Analysis (ICA) on Vulnerability to Food Insecurity and Natural Hazards
51
Part 2:FOOD SECURITY AND MALNUTRITION: DRIVERS AND DETERMINANATS

Pakhtunkhwa. On the other hand, a medium level of vulnerability to food insecurity exists in almost all FATA regions except the Orakzai agency, where its prevalence is no�ced at the highest level (Figure 42).
Considering the regional distribu�on of vulnerability to or recurrence of food insecurity in Pakistan, rela�vely higher concentra�on can be observed in almost en�re Balochistan followed by lower Sindh and south-western Khyber
Figure 42: Vulnerability to Food Insecurity in NMDs and Remaining Pakistan
Source: WFP-NDMA-GOP (2017). Integrated Context Analysis (ICA) on Vulnerability to Food Insecurity and Natural Hazards
52
PAKISTAN OVERVIEW OF FOOD SECURITY AND NUTRITION 2019

2018. The drought condi�ons in Pakistan, reflected by the Standardised Precipita�on Index (SPI), for selected months in 2018 are shown in Figure 43 below.
In 2018, several districts in Sindh and Balochistan experienced moderate or severe drought due to no or very low precipita�on and persistent dry condi�ons, which had worsened since July of
Figure 43: Drought Condition in Pakistan in 2018
53
Part 2:FOOD SECURITY AND MALNUTRITION: DRIVERS AND DETERMINANATS
Source: Drought Bulletins of Pakistan Meteorological Department

Box 5: Integrated Food Security Phase Classifica�on (IPC) IPC has the specific objec�ve of iden�fying popula�ons in need of urgent ac�on. To achieve this, IPC is based on convergence of evidence from a number of sources. To reach technical consensus on the classifica�on of the severity of the food insecurity situa�on, a team of analysts conducts a cri�cal evalua�on and analysis of all available evidence on food security, which is compared against global standardized indicators and then interpreted with reference to local contexts. As a result, IPC analyses provide evidence needed to support emergency response planning. IPC analysis can be a snapshot of the food insecurity status in subna�onal areas – typically using the recent data (typically not older than two or three months) – to give an overview of the current and projected situa�on and to provide informa�on to decision-makers on ongoing and upcoming response needs. While extremely valuable for strategic response, IPC numbers are not intended to be used for monitoring achievements towards global development goals, unlike numbers based on Prevalence of Undernourishment and Prevalence of Moderate and Severe Food Insecurity Based on FIES indicator.
Source: FAO, 2018
Food Insecurity Analysis for drought affected areas of 7 districts in Sindh (Tharparkar, Umerkot, Sanghar, Jamshoro, Badin, Dadu and Qambar Shahdadkot) and 14 districts in Balochistan (Awaran, Chagai, Dera Bug�, Gwadar, Jhal Magsi, Kacchi, Kech, Kharan, Killa Abdullah, Loralai, Nushki, Panjgur, Pishin and Washuk) was conducted in April 2019 (Figure 44) . The summary findings of IPC analysis for both Sindh and Balochistan districts are reported below²⁶.
THE INTEGRATED FOOD SECURITY PHASE CLASSIFICATION (IPC) ACUTE FOOD INSECURITY ANALYSIS FOR DROUGHT AFFECTED AREAS OF SINDH AND BALOCHISTAN
Several districts in Sindh and Balochistan experienced drought during 2018. In this context, the Integrated Phase Classifica�on (IPC) Acute
Figure 44: Summary Findings of IPC Acute Food Insecurity Analysis for Drought Affected Districts of Sindh and Balochistan
54
PAKISTAN OVERVIEW OF FOOD SECURITY AND NUTRITION 2019
26. Detailed reports on IPC acute analysis for drought affected districts of Sindh and Balochistan are available on IPC website h�p://www.ipcinfo.org/ipc-country-analysis/ and Food Security Cluster's website h�ps://fscluster.org/pakistan.

Source: IPC Reports 2019
classified in IPC Phase 3 (Crisis).
From the above discussion, it can be concluded that Pakistan is situated in a natural induced disasters prone region, where floods and drought frequently occur and cause nega�ve impacts on the food security and livelihoods of millions of people. Recurring disasters considerably damage the coping capacity of the people causing huge losses to na�onal GDP and people's livelihoods making them more vulnerable to food insecurity. This clearly calls for adop�ng a well-coordinated approach to deal with the situa�on suddenly arising in case of floods and gradually aggrava�ng in case of drought.
The experience of well-coordinated efforts of Pakistan's na�onal agencies; Space and Upper Atmosphere Research Commission (SUPARCO) and the Na�onal Disaster Management Authority (NDMA) in mi�ga�ng damages will con�nue to be very important in responding to future natural disasters. Inclusion in the post-disaster rehabilita�on process of MNSFR and other relevant government ministries and financial ins�tu�ons is equally important in order to
In Sindh, around 1.28 million people (57 percent of the rural popula�on) in drought-affected areas of seven districts (Tharparkar, Umerkot, Sanghar, Jamshoro, Badin, Dadu and Qambar Shahdadkot) were es�mated to be in Crisis and Emergency (IPC Phase 3 and Phase 4). Four out of the seven drought-affected districts analysed (Tharparkar, Umerkot, Sanghar and Jamshoro) were classified in IPC Phase 4 (Emergency, whereas drought-affected areas in 3 districts (Badin, Dadu and Qambar Shahdadkot) were classified in IPC Phase 3 (Crisis).
In Balochistan, around 1.79 million people (48 percent of the rural popula�on) in 14 drought-affected districts (Awaran, Chagai, Dera Bug�, Gwadar, Jhal Magsi, Kacchi, Kech, Kharan, Killa Abdullah, Loralai, Nushki, Panjgur, Pishin and Washuk) were es�mated to be in IPC Phase 3 (Crisis) and Phase 4 (Emergency). Out of 14 districts analysed, rural areas of two districts (Chagai and Washuk) were classified in IPC Phase 4 (Emergency), whereas drought affected areas in 12 districts (Awaran, Dera Bug�, Gwadar, Jhal Magsi, Kacchi, Kech, Kharan, Killa Abdullah, Loralai, Nushki, Panjgur and Pishin) were
55
Part 2:FOOD SECURITY AND MALNUTRITION: DRIVERS AND DETERMINANATS
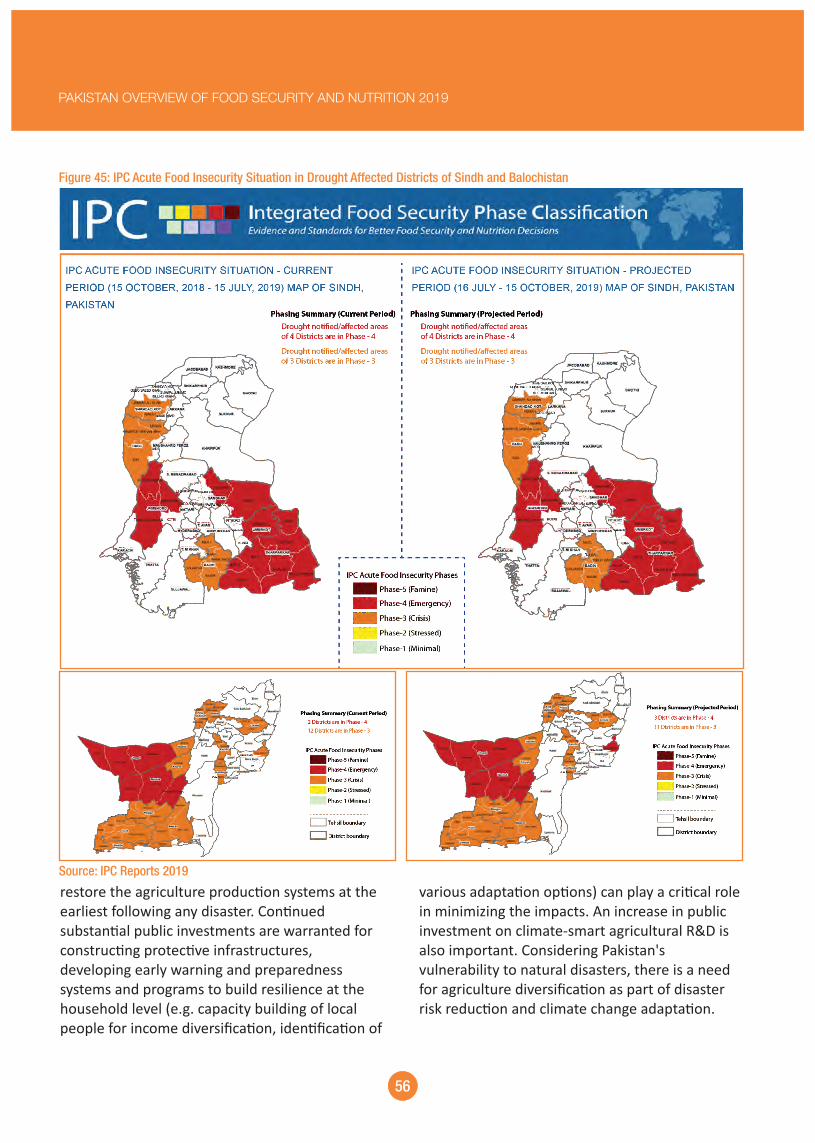
Figure 45: IPC Acute Food Insecurity Situation in Drought Affected Districts of Sindh and Balochistan
Source: IPC Reports 2019
various adapta�on op�ons) can play a cri�cal role in minimizing the impacts. An increase in public investment on climate-smart agricultural R&D is also important. Considering Pakistan's vulnerability to natural disasters, there is a need for agriculture diversifica�on as part of disaster risk reduc�on and climate change adapta�on.
restore the agriculture produc�on systems at the earliest following any disaster. Con�nued substan�al public investments are warranted for construc�ng protec�ve infrastructures, developing early warning and preparedness systems and programs to build resilience at the household level (e.g. capacity building of local people for income diversifica�on, iden�fica�on of
56
PAKISTAN OVERVIEW OF FOOD SECURITY AND NUTRITION 2019
Box 6: Climate Change and Food Security
During 2014 and 2015, a series of ten climate change working papers were published by the Pakistan Ins�tute of Development Economics, Islamabad. The findings of the analysis showed a sta�s�cally significant associa�on between climate change and food security. The households who adapted climate change strategies are more food secure as compared to those who did not. The Though farm size and land ownership ma�er a lot in arres�ng food security, other factors like crop diversifica�on and non-farm income improve household food security. Due to rela�vely higher non-farm income in total household income, the cropping systems of the farmers from co�on-wheat, rice-wheat, and rain-fed are more food secure than those in mixed cropping systems. During the formula�on of the GCF Funding Proposal, a number of reviews and feasibili�es were undertaken, which clearly indicated that the agriculture produc�on is declining due to the climate change factors. This will have strong repercussion on the food security and local livelihoods
For safeguarding na�onal food security interest against erra�c climate changes, it is crucial to invest in agriculture research for developing agro-ecology and farming system-specific climate-smart varietal and crop management related technologies. There is also a need to employ various informa�cs tools for early meteorological warning preparedness, transfer, and adop�on of appropriate generated technologies from lab-to-land through expert agricultural advisory service providers (adap�ve extension research approaches). Moreover, policy implica�ons are warranted with the focus on i) increasing the climate change awareness programs about its coping strategies tailored through increasing access to agricultural extension educa�on; and ii) strengthening the affordability capacity of the poor farm households in order to cope the chronic cyclic clima�c changes via augmen�ng the farm assets as well as lowering the cost towards changing climate adapta�ons (e.g. endowment facili�es --- services of advisory through developing effec�ve informa�on communica�on technologies (ICT), as well as genera�ng alterna�ve feasible livelihood opportuni�es. The GCF Funding Proposal also reveals that there is a need for crea�ng enabling environment for private sector and financial ins�tu�ons to support the farming communi�es
Source: PIDE Climate Change Working Papers and FAO-GCF Funding Proposal on Transforming Indus Basin with Climate Resilient Agriculture and Water Management.
foodborne hazards are known to cause over 200 acute and chronic diseases from diges�ve tract infec�ons to cancer (FAO, 2019). Children below the age of five are more affected by contaminated food, with a consequent impact on nutri�on and health. Urban popula�ons who consume street food from vendors with unsafe food standards are also at increased risk of illness and poor nutri�onal outcomes. Food safety includes all steps and procedures that apply from food produc�on to consump�on. It
2.3 FOOD SAFETY AND QUALITY
Food safety is a driver and determinant for achieving the u�liza�on aspect of food security. Ready access to safe and nutri�ous food is a basic human right. Unsafe food takes a huge toll on human health and the economy. Every year around the world, over 420 000 people die and some 600 million people – almost one in ten – fall ill a�er ea�ng contaminated food. In fact,
57
Part 2:FOOD SECURITY AND MALNUTRITION: DRIVERS AND DETERMINANATS

eggs cons�tute the main na�onal diet, however, the safety of the food chain from producer to consumer is compromised for a number of reasons. Food safety issues in the country pose a challenge to human health, especially for infants, the young, elderly and sick. This, in turn, creates a burden on the economy of health-related costs. A review of food safety challenges in Pakistan documented that the prevalence of pathogens was common in several foods; poor processing and storage of milk, cereal grains, and nuts caused contamina�on especially with aflatoxin and prolifera�on of mould. In addi�on, lack of monitoring and enforcement of food standards, par�cularly of milk, poses risk to the health of the popula�on. The environmental condi�ons of Pakistan, with its mostly hot climate, are conducive to the growth of toxigenic fungi resul�ng in mycotoxin produc�on in different food items. Moreover, the poor condi�ons of storage and deficiency in regulatory measures in food quality control exacerbate the situa�on in the country (Akhtar, 2015). Food handlers also contribute to food contamina�on in many ways, with poor personal hygiene and handling of foodstuffs having a role in transmi�ng many intes�nal enteropathogenic bacteria.
requires good agriculture prac�ces (GAP) star�ng from primary produc�on i.e., pre-harvest (soil, water, seed, fer�lizers, integrated pest management, livestock management, disease preven�on and control) to postharvest (storage, transporta�on, handling, processing storage, maintaining cold chain etc.) good hygiene prac�ces (GHP), good manufacturing prac�ces (GMP) and good sanita�on prac�ces (GSP) (FAO and MNFSR, 2019).
2.3.1 FOOD SAFETY SITUATION IN PAKISTAN
Food safety is integral to SDG 2 and an important part of Pakistan's 2018 Na�onal Food Security Policy The policy recognizes that levels beyond globally recognized maximum residue limits for pes�cides have been a problem in the food supply chain, especially in fruits and vegetables. The policy inten�ons include safe food produc�on, strengthening the food produc�on system, legisla�ng food safety regulatory laws, awareness raising on the safe use of pes�cides, and curtailing the indiscriminate use of pes�cides in order to ensure that food complies with Codex standards.Food grains, vegetables, fruits, milk, meat, and
PAKISTAN OVERVIEW OF FOOD SECURITY AND NUTRITION 2019

Box 7: Food Safety Authority Agencies in Pakistan
During the early years of the ongoing decade, the significance of food safety and hygiene was realized in Pakistan. Ini�ally, the Punjab Government came up with the idea of the se�ng of Punjab Food Authority with main func�ons of food surveillance, food standards and food licensing. It has established its own food-tes�ng laboratory.
Ÿ The Punjab Food Authority Act, 2011 entrusts the following func�ons and responsibili�es to the Punjab Food Authority:
Ÿ Punjab Food Authority regulates and monitors the food business in order to ensure compliance by formers, manufacturers, distributors, importers and other stake holders in orders to provide safe food.
Ÿ Formulate standards, procedures, processes and guidelines in rela�on to any aspect of food including food business, food labelling, food addi�ve, and specify appropriate enforcement systems.
Ÿ Enforcement of food safety and quality standards.Ÿ Specify procedures and guidelines for se�ng up and up-grada�on of food laboratories.Ÿ Specify licensing, prohibi�on orders, recall procedures, improvement no�ces and prosecu�on in
the court of law.Ÿ Provides scien�fic advice and technical support to the Government in ma�ers rela�ng to food
safety.Ÿ Establishment of food laboratories.Ÿ Organize training programs in food safety and standards.Ÿ Promote general awareness regarding food safety and standards.Ÿ Cer�fy food products/items for export.Ÿ Forward and backward traceability of food items.Ÿ Surveillance including collec�on, integra�on, analysis, interpreta�on and dissemina�on of data
related to food and nutrient intakes.
Seeing the success of the ini�a�ve, other provinces (Sindh, Khyber Pakhtunkhwa and Balochistan) also followed the suit and set up their own independent food authori�es with similar func�ons.
sellers may a�empt to counter the dilu�on by adding vegetable oil, whey powder, and other ingredients to improve the solid content of the milk, affec�ng the purity of the product.
2.3.2 STRATEGIES FOR INTERVENTION
The current situa�on in Pakistan calls for improving food safety along the food supply chain and reducing food quality losses, also paying
Unsafe milk is an issue that has plagued the dairy sector of Pakistan, causing not only economic losses for the processing industry, but also health risks for consumers. Due to the lack of proper equipment and training of smallholding farmers, milk-handling processes in the tradi�onal system may be unhygienic, and the cold chain not maintained properly. In order to keep milk temporarily “fresh”, there has been a prac�ce of adding ice to the milk, which results in dilu�on of milk solids by up to 30 percent. In addi�on,
59
Part 2:FOOD SECURITY AND MALNUTRITION: DRIVERS AND DETERMINANATS

required between ministries, departments and food safety authori�es, as well as through innova�ons and technologies, labelling and standards, monitoring and surveillance in a harmonized manner (HLPE, 2107). Food safety is the base for preparing and serving a healthy diet and providing good nutri�on. It is therefore important that the governments adopt food safety as a na�onal and public health priority; develop policies, strategies, regulatory frameworks and coordina�ng mechanisms; establish and implement effec�ve food safety systems that ensure food producers and suppliers along the whole food chain operate responsibly and supply safe food to consumers. The recommenda�ons in the Pakistan Dietary Guidelines for Be�er Nutri�on developed by MPDR and FAO should be widely disseminated and used in policy making and programming directed at health and nutri�on.
special focus to aflatoxins. In par�cular, in order to ensure that food supply is healthy for the consumer, retailers and food outlet owners, including street food vendors should be incen�vized and encouraged to sell safe foods, made with less sodium, a higher propor�on of fruits and vegetables, and using healthy oils for cooking. It is also very relevant that except for the large-scale corporate farms and at the ca�le colonies, women play an ac�ve role in livestock produc�on and therefore the milk supply chain. This entails that both women and men livestock holders be trained in safe milk produc�on and sale. A robust monitoring system and traceability is the missing link in the food supply chain to reduce chemical and microbiological contamina�on of food and water supplies.
For improving food safety governance and control along food supply chains, close collabora�on is
60
PAKISTAN OVERVIEW OF FOOD SECURITY AND NUTRITION 2019
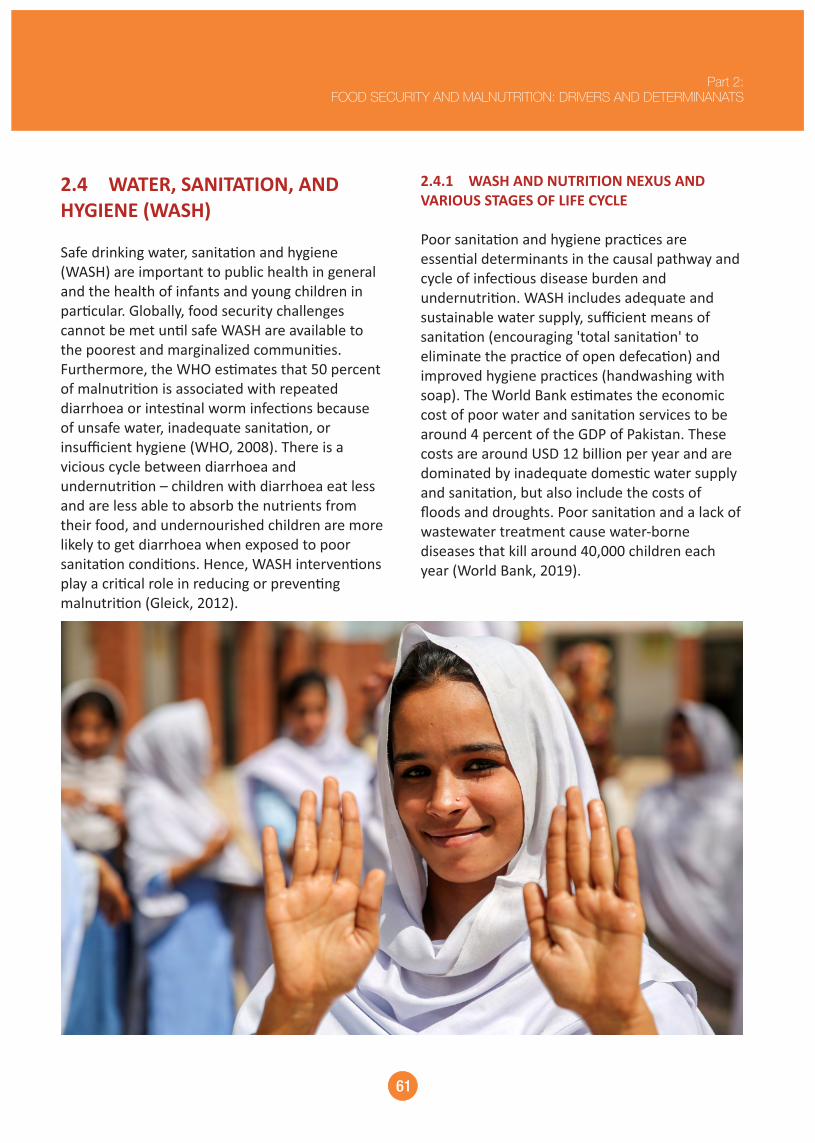
2.4.1 WASH AND NUTRITION NEXUS AND VARIOUS STAGES OF LIFE CYCLE
Poor sanita�on and hygiene prac�ces are essen�al determinants in the causal pathway and cycle of infec�ous disease burden and undernutri�on. WASH includes adequate and sustainable water supply, sufficient means of sanita�on (encouraging 'total sanita�on' to eliminate the prac�ce of open defeca�on) and improved hygiene prac�ces (handwashing with soap). The World Bank es�mates the economic cost of poor water and sanita�on services to be around 4 percent of the GDP of Pakistan. These costs are around USD 12 billion per year and are dominated by inadequate domes�c water supply and sanita�on, but also include the costs of floods and droughts. Poor sanita�on and a lack of wastewater treatment cause water-borne diseases that kill around 40,000 children each year (World Bank, 2019).
2.4 WATER, SANITATION, AND HYGIENE (WASH)
Safe drinking water, sanita�on and hygiene (WASH) are important to public health in general and the health of infants and young children in par�cular. Globally, food security challenges cannot be met un�l safe WASH are available to the poorest and marginalized communi�es. Furthermore, the WHO es�mates that 50 percent of malnutri�on is associated with repeated diarrhoea or intes�nal worm infec�ons because of unsafe water, inadequate sanita�on, or insufficient hygiene (WHO, 2008). There is a vicious cycle between diarrhoea and undernutri�on – children with diarrhoea eat less and are less able to absorb the nutrients from their food, and undernourished children are more likely to get diarrhoea when exposed to poor sanita�on condi�ons. Hence, WASH interven�ons play a cri�cal role in reducing or preven�ng malnutri�on (Gleick, 2012).
61
Part 2:FOOD SECURITY AND MALNUTRITION: DRIVERS AND DETERMINANATS

faecal sludge management combined with a high reliance on water from hand pumps that extract water from shallower depths had led to contamina�on rates as high as 57 percent at the source. Drinking water contaminated with E. coli leads to permanent and irreversible damage to the intes�nal villi of children, which hinders their ability to digest nutrients and their long-term life and growth prospects (World Bank, 2018)
WASH interven�ons contribute to improve the health and nutri�on status of vulnerable groups at various stages of the lifecycle, and therefore, contribute to stun�ng reduc�on (Figure 46). The UNICEF WASH Strategy 2016-2030 and the Stun�ng Reduc�on Framework for South Asia, both highlight the need for integrated Nutri�on and WASH programming as a step forward to address malnutri�on. Undernutri�on can span across genera�ons. Girls suffering from undernutri�on are likely to become undernourished mothers who are, in turn, more likely to give birth to low birth weight infants. Adolescent girls are par�cularly vulnerable to undernutri�on because they have high nutrient needs due to growth and because they are at risk of becoming pregnant (Black et al., 2013).
WASH infrastructure has significantly improved in Pakistan, but what has not improved, and has arguably worsened considerably, is the level of bacterial contaminants in water and in the soil. Only 35 percent the popula�on has access to safely managed water, which is free of contamina�on. Water quality remains a major setback in Pakistan – mostly contaminated water is used for drinking purpose, largely without any treatment, as well as for food produc�on, crea�ng powerful oral transmission mechanism for faecal waste to find its way into both adults and children.
In Pakistan, access to improved water has come primarily from greater reliance on groundwater, and access to improved latrines has come from an increase in flush toilets connected to leaching pits or sep�c tanks connected to open drains. The combina�on of these two types of infrastructure can provide a perfect recipe for the source contamina�on of drinking water when the distance between the point of intake of water and the point of disposal of human waste is below recommended levels and the groundwater aquifer is shallow. This is far too o�en the norm in rural Pakistan. In rural Sindh, for instance, poor
Figure 46: WASH Contributions to UNICEF's Key Outcomes for Children across the Life Course
Source: UNICEF, WASH Strategy 2016-2030
62
PAKISTAN OVERVIEW OF FOOD SECURITY AND NUTRITION 2019

that achieving 100 percent coverage of the set of 10 nutri�on specific interven�ons to address malnutri�on will only lead a 20 percent reduc�on in stun�ng. The other 80 percent will be contributed by structural changes and nutri�on-sensi�ve interven�ons, including WASH. WASH is, therefore, part of the set of ac�ons required to achieve op�mal foetal development and nutri�on.
2.4.2: INTEGRATED ACTION TO IMPROVE NUTRITIONWASH interven�ons represent a key nutri�on-sensi�ve approach in preven�ng undernutri�on. If implemented at large scale as part of public works and educa�on programs, they offer a major opportunity to reduce water borne, faecally transmi�ed diseases, and thence malnutri�on. The Lancet 2013 series highlighted
Box 8: What is Nutri�on Specific and Nutri�on Sensi�ve Programming?
Nutri�on Specific Interven�ons and Programmes: Interven�ons or programmes that address the immediate determinants of foetal and child nutri�on and development – adequate food and nutrient intake (diets), feeding, caregiving and paren�ng prac�ces, and low burden of infec�ous diseases.
Examples: Adolescent, preconcep�on and maternal health and nutri�on; maternal dietary or micronutrient supplementa�on; promo�on of op�mum breas�eeding; complementary feeding and responsive feeding prac�ces and s�mula�on; dietary supplementa�on; diversifica�on and micronutrient supplementa�on or for�fica�on for children, treatment of severe acute malnutri�on, disease preven�on and management, and nutri�on in emergencies.
Nutri�on Sensi�ve Interven�ons and Programmes: Interven�ons or programmes that address the underlying determinants of foetal and child nutri�on and development – food security; adequate caregiving resources at the maternal, household and community levels; and access to health services and a safe and hygienic environment – and incorporate specific nutri�on goals and ac�ons. Nutri�on sensi�ve programmes can serve as delivery pla�orm for nutri�on specific interven�ons, poten�ally increasing their scale, coverage, and effec�veness.
Examples: Agriculture and food security, schooling, water, sanita�on and hygiene (WASH), health and family planning services.
Source: Ruel, M., H. Alderman and Maternal and Child Nutri�on Study Group. 'Nutri�on-sensi�ve Interven�ons and Programmes: How Can They Help to Accelerate Progress in Improving Maternal and Child Nutri�on?' – Lancet, 6 June 2013
contamina�on. As per different data sources (e.g. JMP, PCRWR and PDHS), about 91 percent of the popula�on in Pakistan has access to improved water sources (JMP, 2017). This largely consists of motorized pumps, hand pumps, piped water and closed wells. Around one-fourth (26.7 percent) of
2.4.3 ACCESSIBILITY AND AVAILABILITY OF WATER
Safely managed water under the SDG indicator framework comprises water accessible at premises, available when needed, and free from
63
Part 2:FOOD SECURITY AND MALNUTRITION: DRIVERS AND DETERMINANATS

quality of service delivery. As per JMP es�mates 2017, around 56 percent popula�on of Pakistan has access to basic services while 35 percent has access to safe water. In figure 47, the descrip�on of drinking water sources as per the JMP 2017 report is given with overall, rural and urban es�mates.
the popula�on in Pakistan has access to piped water. High reliance of drinking water in the form of hand pumps or motor pumps (self-provision of water) is leading primarily in Punjab and Sindh, as compared to Balochistan and KP where there is high reliance is on piped or surface water. The lack of water availability in exis�ng piped water infrastructure further highlights the lack of
Figure 47: Access to Drinking Water Types (Percent)
Source: JMP Estimates 2017
64
PAKISTAN OVERVIEW OF FOOD SECURITY AND NUTRITION 2019

Box 9: WASH Defini�onsWASH typically refers to ac�vi�es aimed at improving access to and use of safe drinking water and sanita�on as well as promo�ng good hygiene prac�ces (e.g. handwashing with soap at cri�cal �mes) and interven�ons can include;Ÿ Water Quan�ty: Provision of facili�es and services that increase the amount of water available
for drinking, cooking and maintaining good hygiene prac�ces within households, health care facili�es or schools; and reduce the �me and effort required to collect the water.
Ÿ Water Quality: Improvement and protec�on of the microbiological or chemical quality of drinking water through water treatment and safe storage or by improving exis�ng water sources to protect them from outside contamina�on. Improved water sources, as defined by the Joint Monitoring Programme (JMP) for Water Supply and Sanita�on, include piped water on-site, public taps or standpipes, tube wells or boreholes, protected dug wells, protected springs and rainwater.
Ÿ Sanita�on: Provision and use of facili�es and services that safely dispose of human urine and faeces, thereby preven�ng contamina�on of the environment. Improved sanita�on facili�es are defined by the JMP are those that hygienically separate human excreta from human contact and include flush or pour-flush toilets to piped sewer systems, sep�c tanks or pits, ven�lated improved pit latrines, pit latrines with slab, and compos�ng toilets.
Ÿ Hygiene: Prac�ce of handwashing with soap a�er defeca�on and disposal of child faeces, prior to preparing and handling food, before ea�ng, and, in health care facili�es, before and a�er examining pa�ents and conduc�ng medical procedures.
Source: WHO, UNICEF, USAID, Improving Nutri�on Outcomes with Be�er, Sanita�on and Hygiene,
2.4.5 BASELINE FOR SAFELY MANAGED WATER
Based on the na�onal WASH data, a diagnos�c study conducted by the Ministry of Climate Change (MoCC), and literature review, delibera�ons were held at na�onal and provincial levels through SDG localiza�on and technical collabora�on with the JMP team. The improved water/accessible is 91 percent, available in premises when needed is 77.5 percent, basic service is 56 percent and free from contamina�on is 35 percent. The lowest figure of all three is free from contamina�on i.e. 35 percent which is the baseline figure of safely managed water in Pakistan. The na�onal, provincial and regional break-up is given in Table 1. The worst rates of contamina�on-free water are found in Sindh and Balochistan.
2.4.4 WATER QUALITY
According to the Pakistan Council of Research on Water Resources (PCRWR), more than 60 percent of drinking water samples have been found to be unfit for drinking because of bacterial contamina�on. Similarly, only eight percent of the popula�on reported using an appropriate treatment method for drinking water at household levels (PDHS 2012-13). JMP 2017 es�mated that only around 35 percent of the popula�on in Pakistan has access to water that was free from any bacterial contamina�on, and this is broken down into 33 percent in the rural areas and 41 percent in the urban areas.
65
Part 2:FOOD SECURITY AND MALNUTRITION: DRIVERS AND DETERMINANATS
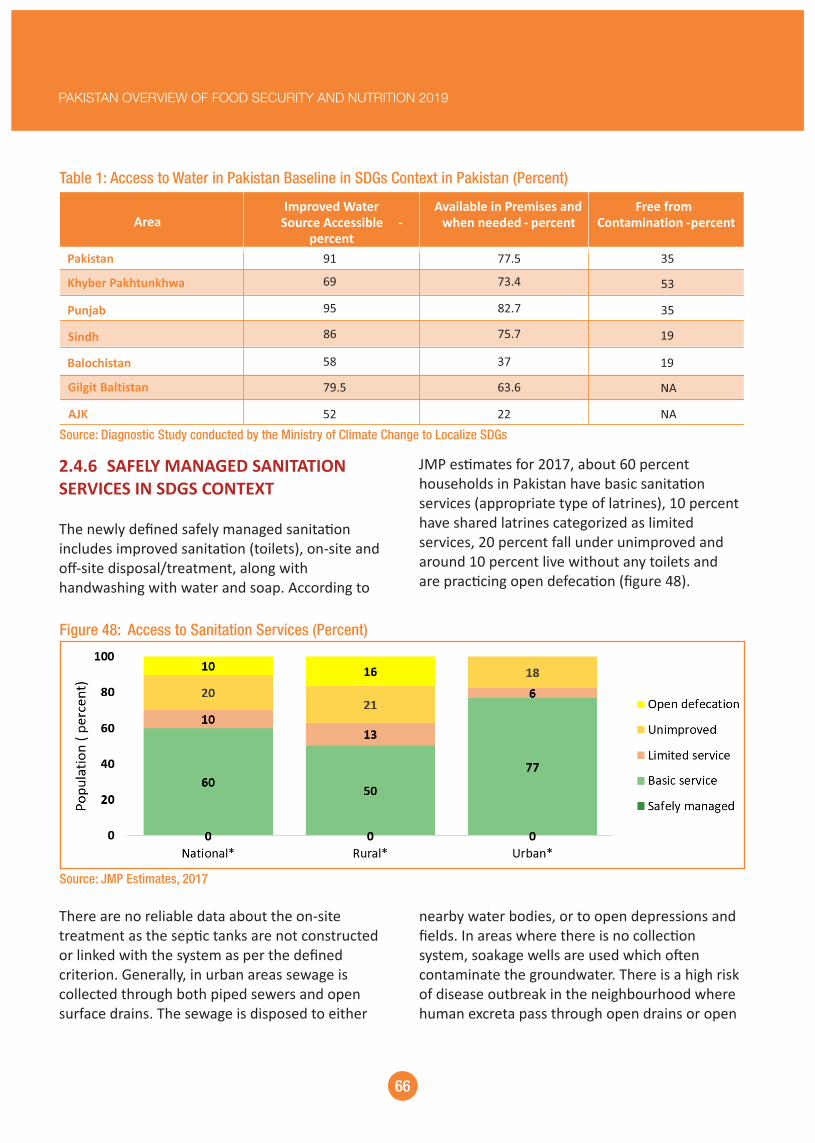
Table 1: Access to Water in Pakistan Baseline in SDGs Context in Pakistan (Percent)
Area Improved Water
Source Accessible - percent
Available in Premises and when needed - percent
Free from Contamination - percent
Pakistan 91 77.5 35
Khyber Pakhtunkhwa
69
73.4
53
Punjab 95 82.7 35
Balochistan 58 37 19
Gilgit Baltistan 79.5 63.6 NA
Source: Diagnostic Study conducted by the Ministry of Climate Change to Localize SDGs
JMP es�mates for 2017, about 60 percent households in Pakistan have basic sanita�on services (appropriate type of latrines), 10 percent have shared latrines categorized as limited services, 20 percent fall under unimproved and around 10 percent live without any toilets and are prac�cing open defeca�on (figure 48).
2.4.6 SAFELY MANAGED SANITATION SERVICES IN SDGS CONTEXT
The newly defined safely managed sanita�on includes improved sanita�on (toilets), on-site and off-site disposal/treatment, along with handwashing with water and soap. According to
Figure 48: Access to Sanitation Services (Percent)
Source: JMP Estimates, 2017
Sindh 86 75.7 19
AJK 52 22 NA
nearby water bodies, or to open depressions and fields. In areas where there is no collec�on system, soakage wells are used which o�en contaminate the groundwater. There is a high risk of disease outbreak in the neighbourhood where human excreta pass through open drains or open
There are no reliable data about the on-site treatment as the sep�c tanks are not constructed or linked with the system as per the defined criterion. Generally, in urban areas sewage is collected through both piped sewers and open surface drains. The sewage is disposed to either
66
PAKISTAN OVERVIEW OF FOOD SECURITY AND NUTRITION 2019
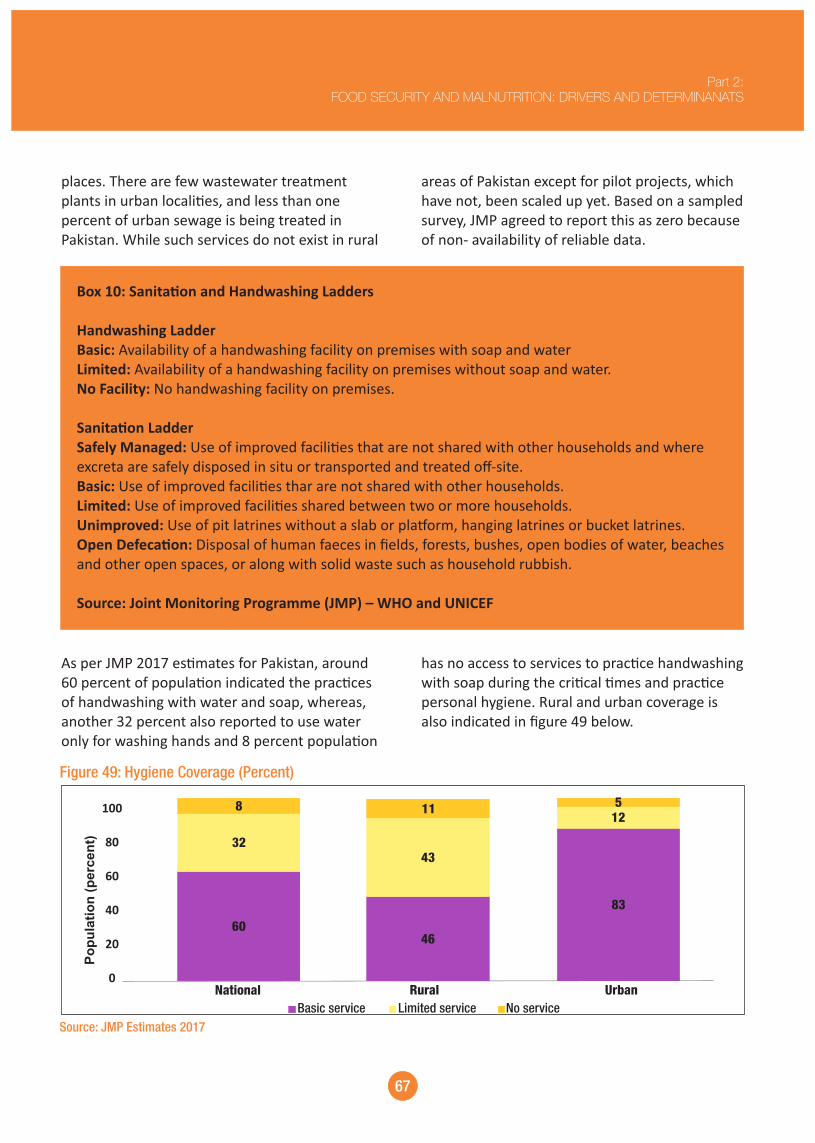
areas of Pakistan except for pilot projects, which have not, been scaled up yet. Based on a sampled survey, JMP agreed to report this as zero because of non- availability of reliable data.
places. There are few wastewater treatment plants in urban locali�es, and less than one percent of urban sewage is being treated in Pakistan. While such services do not exist in rural
Box 10: Sanita�on and Handwashing Ladders
Handwashing LadderBasic: Availability of a handwashing facility on premises with soap and waterLimited: Availability of a handwashing facility on premises without soap and water.No Facility: No handwashing facility on premises.
Sanita�on LadderSafely Managed: Use of improved facili�es that are not shared with other households and where excreta are safely disposed in situ or transported and treated off-site. Basic: Use of improved facili�es thar are not shared with other households.Limited: Use of improved facili�es shared between two or more households.Unimproved: Use of pit latrines without a slab or pla�orm, hanging latrines or bucket latrines. Open Defeca�on: Disposal of human faeces in fields, forests, bushes, open bodies of water, beaches and other open spaces, or along with solid waste such as household rubbish.
Source: Joint Monitoring Programme (JMP) – WHO and UNICEF
has no access to services to prac�ce handwashing with soap during the cri�cal �mes and prac�ce personal hygiene. Rural and urban coverage is also indicated in figure 49 below.
As per JMP 2017 es�mates for Pakistan, around 60 percent of popula�on indicated the prac�ces of handwashing with water and soap, whereas, another 32 percent also reported to use water only for washing hands and 8 percent popula�on
100
80
60
40
20
0
Basic service Limited service No service
8
32
60
11
43
46
512
83
National Rural Urban
Po
pu
lati
on
(p
erc
en
t)
Figure 49: Hygiene Coverage (Percent)
Source: JMP Estimates 2017
67
Part 2:FOOD SECURITY AND MALNUTRITION: DRIVERS AND DETERMINANATS

handwashing with soap is 60 percent, on-site and off-site treatment is not available or is less than one percent. For Pakistan, no data is available for safely managed sanita�on. The provincial and regional break-up are given below in table 2.
2.4.7 BASELINE FOR SAFELY MANAGED SANITATION
Though improved sanita�on is 73 percent as per PSLM (it is 60 percent as per JMP 2017),
Pakistan
Khyber Pakhtunkhwa
Punjab
Sindh
Balochistan
Gilgit Baltistan
AJK
Area No Toiletpercent
NotImprovedpercent
Improvedpercent
Hand Washing with Waterand Soap percent
15 22 63 60.0
13 19 68 56.7
17 8 75 72.6
12 49 39 51.5
23 55 22 36.0
7.7 10 82 22.4
5 20 75
Table 2: Baseline for Safely Managed Sanitation in SDGs Context Pakistan (Percent)
Source: Diagnostic Study conducted by the Ministry of Climate Change to Localize SDGs
sources. Pakistan has access to a piped water supply that stands around 26 percent. There is a significant difference between access to piped water in urban areas with coverage of 48 percent and rural areas with 13 percent respec�vely. Regarding the type of water supply, the below figure as per PSLM, 2014-15 data shows that only 10 percent of the poorest have access to piped water supply compared to 39 percent rich people and 35 percent of the richest groups. More than half of the rural popula�on use hand pumps for extrac�ng drinking water while 43 percent of the richest use motorized pumps (Figure 50).
2.4.8 INCLUSION AND DISPARITIES
Access to safe and clean water and sanita�on facili�es is a basic right of all people, including the people who are the most marginalized and hard to reach in remote areas in different parts of the country. Equity in programmes may include special measures to address the needs of people who are discriminated and disadvantaged. Globally, recent data of improved water and sanita�on shows dispari�es among different income levels, geographic loca�ons, social groups and marginalized segments. There are no significant dispari�es between rural and urban se�ngs for access to improved water
68
PAKISTAN OVERVIEW OF FOOD SECURITY AND NUTRITION 2019

Figure 50: Access to Drinking Water Sources in Pakistan (Percent)
Source: PSLM 2014-15
leading to nearby fields or pit/dry raised latrines. O�en sector investments are primarily used for infrastructures, such as drinking water supplies and urban wastewater treatment that is not likely to dispropor�onately benefit the poor especially when higher number of the poor reside in rural areas or slums of the urban areas, which are not, recognized se�lements in the urban development.
Less than half of the rural popula�on in Pakistan uses improved sanita�on. A sharp contrast is also visible between income groups as only 20 percent of the poorest have access to improved sanita�on compared to 82 percent richest. Similarly, 40 percent of the poorest have no toilets compared to only one percent of the richest as per PSLM 2015 as shown in Figure 51. Either latrines are o�en connected to open drains or unlined drains
Figure 51: Access to Sanitation by Types (Percent)
Source: PSLM 2014-15
poverty and behavioural change as another 43 percent of the rural popula�on reported to wash their hands with water only, or other cleansing materials.
Compared to 83 percent popula�on of urban areas using water and soap for handwashing, only 46 percent popula�on in rural areas prac�ce handwashing with soap. This is also linked with
69
Part 2:FOOD SECURITY AND MALNUTRITION: DRIVERS AND DETERMINANATS

FOOD SECURITY:IMPROVING ACCESS TO FOOD

Part 3
FOOD SECURITY : IMPROVING ACCESS TO FOOD
and distribu�on system that can best contribute towards food security and nutri�on, in terms of availability, access, u�liza�on and stability”.
In view of this, Part 3 of the report features 'Improving Access to Food' as a special theme. The purpose is to highlight the different aspects of food accessibility and how they are having an impact on the ability to acquire food at the individual and household levels, as well as to describe some relevant policy and program ini�a�ves in Pakistan to date.
3. IMPROVING ACCESS TO FOOD
The second dimension of food security, access, has been recognized as par�cularly challenging in Pakistan, both in the sense of moving beyond an understanding of food security as being mainly about staple food availability and consump�on at na�onal level, and in the sense of improving access for all parts of society. In 2018, the Federal Government of Pakistan adopted a new food security policy, with a vision “to ensure modern and efficient food produc�on
72

pa�erns from various produc�on regions/provinces of the country, par�cularly for analysing, designing and developing of targeted agricultural R&D programs and plans, and for improving backward-forward market linkages, food supply and distribu�on across regions/provinces of the country. Popula�on trends play an important role in the food security of the country. In the past 70 years, the country's popula�on has increased almost six-fold, and is becoming more urbanised. Punjab was and will remain the most populated province followed by Sindh, Khyber Pakhtunkhwa and Balochistan of Pakistan. It is an�cipated that the ra�o of popula�on found in Punjab and Khyber Pakhtunkhwa will decline in favour of Sindh and Balochistan provinces. The country's popula�on may increase to 253 million by 2030, nearly 300 million by 2040 and 350 million by 2050. In other words, the country's popula�on will increase by about 70 percent compared with 2019.In the past four Agriculture Censuses, the absolute number of farming households has increased from 3.8 million in 1972 to 8.26 million in 2010. The average farm size halved during this �me to 6.40 acres per farm in 2010, and at this rate, is expected to decline to 4.72 acres per farm by 2050 (i.e. by 26.25 percent compared to 2010). By farm size groups, the farming popula�on are comprised of marginal (up to 5 acres), small (>5 to 12.5 acres), medium (>12.5 to 25 acres), large (>25 to 50 acres) and landlord categories (>50 acres) that cons�tuted to the extent of 64.7 percent, 24.8 percent, 6.8 percent, 2.6 percent and 1.1 percent, respec�vely. The propor�on of total agricultural lands operated by
The four aspects considered for improving access to food are:
1. Physical access2. Economic access 3. Social access4. Knowledge access
3.1 PHYSICAL ACCESS TO FOOD
Physical access to food is determined by domes�c produc�on, import capacity of the country, existence of food stock and food aid, transport, and lastly market infrastructure. As Pakistan does not possess enough capacity to import food, its food security mainly depends on domes�c produc�on. Therefore, Pakistan's food availability heavily depends on agriculture growth (par�cularly food crops and livestock) measured against its popula�on growth. Like several other countries, Pakistan has historically u�lized agriculture policies that were intended to increase supplies of staple foods (cereal crops), rather than the total food consump�on basket.
3.1.1 COUNTRY POPULATION, PAKISTAN'S FARMING PROFILE AND IMPLICATIONS ON ACCESS TO FOOD
Farm size and farming households' composi�on in terms of their popula�on and the propor�on of farmland operated by them needs to be considered before any discussion of physical access to food. Acreage and land per capita are also important for understanding the food supply
73

nearly 48 percent of agricultural land, whereas only 10 percent of total farming households are opera�ng 52 percent of farmland in the country (Figure 52).
these farm size groups are 19.5 percent, 28.8 percent, 17.7 percent, 12.7 percent and 21.5 percent, respec�vely. This implies that nearly 90 percent of farming households, belonging to small sized farming category, are cul�va�ng
Figure 52: Farm size and Farm Number in Pakistan
Source: Agriculture Censuses of Pakistan from 1972 to 2010 and Further Projections Based on Inter-Census Growth Rates
74
PAKISTAN OVERVIEW OF FOOD SECURITY AND NUTRITION 2019
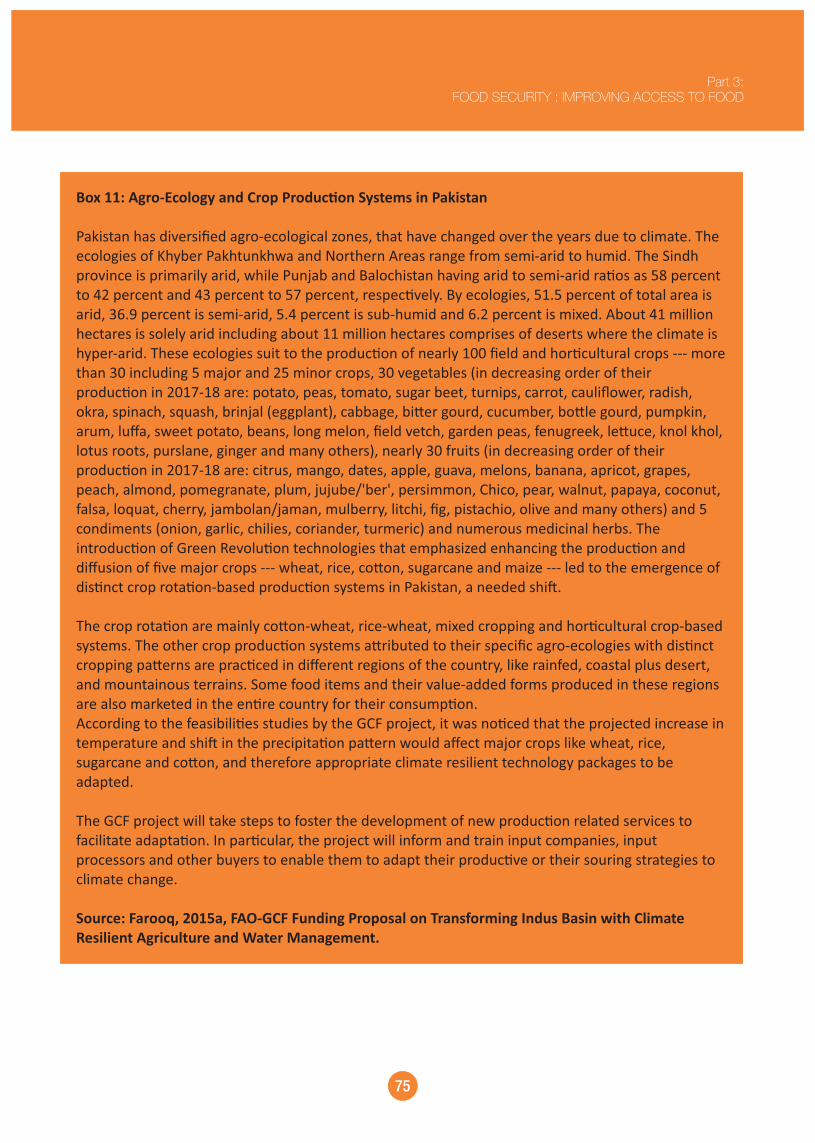
Box 11: Agro-Ecology and Crop Produc�on Systems in Pakistan
Pakistan has diversified agro-ecological zones, that have changed over the years due to climate. The ecologies of Khyber Pakhtunkhwa and Northern Areas range from semi-arid to humid. The Sindh province is primarily arid, while Punjab and Balochistan having arid to semi-arid ra�os as 58 percent to 42 percent and 43 percent to 57 percent, respec�vely. By ecologies, 51.5 percent of total area is arid, 36.9 percent is semi-arid, 5.4 percent is sub-humid and 6.2 percent is mixed. About 41 million hectares is solely arid including about 11 million hectares comprises of deserts where the climate is hyper-arid. These ecologies suit to the produc�on of nearly 100 field and hor�cultural crops --- more than 30 including 5 major and 25 minor crops, 30 vegetables (in decreasing order of their produc�on in 2017-18 are: potato, peas, tomato, sugar beet, turnips, carrot, cauliflower, radish, okra, spinach, squash, brinjal (eggplant), cabbage, bi�er gourd, cucumber, bo�le gourd, pumpkin, arum, luffa, sweet potato, beans, long melon, field vetch, garden peas, fenugreek, le�uce, knol khol, lotus roots, purslane, ginger and many others), nearly 30 fruits (in decreasing order of their produc�on in 2017-18 are: citrus, mango, dates, apple, guava, melons, banana, apricot, grapes, peach, almond, pomegranate, plum, jujube/'ber', persimmon, Chico, pear, walnut, papaya, coconut, falsa, loquat, cherry, jambolan/jaman, mulberry, litchi, fig, pistachio, olive and many others) and 5 condiments (onion, garlic, chilies, coriander, turmeric) and numerous medicinal herbs. The introduc�on of Green Revolu�on technologies that emphasized enhancing the produc�on and diffusion of five major crops --- wheat, rice, co�on, sugarcane and maize --- led to the emergence of dis�nct crop rota�on-based produc�on systems in Pakistan, a needed shi�.
The crop rota�on are mainly co�on-wheat, rice-wheat, mixed cropping and hor�cultural crop-based systems. The other crop produc�on systems a�ributed to their specific agro-ecologies with dis�nct cropping pa�erns are prac�ced in different regions of the country, like rainfed, coastal plus desert, and mountainous terrains. Some food items and their value-added forms produced in these regions are also marketed in the en�re country for their consump�on. According to the feasibili�es studies by the GCF project, it was no�ced that the projected increase in temperature and shi� in the precipita�on pa�ern would affect major crops like wheat, rice, sugarcane and co�on, and therefore appropriate climate resilient technology packages to be adapted.
The GCF project will take steps to foster the development of new produc�on related services to facilitate adapta�on. In par�cular, the project will inform and train input companies, input processors and other buyers to enable them to adapt their produc�ve or their souring strategies to climate change.
Source: Farooq, 2015a, FAO-GCF Funding Proposal on Transforming Indus Basin with Climate Resilient Agriculture and Water Management.
75
Part 3:FOOD SECURITY : IMPROVING ACCESS TO FOOD
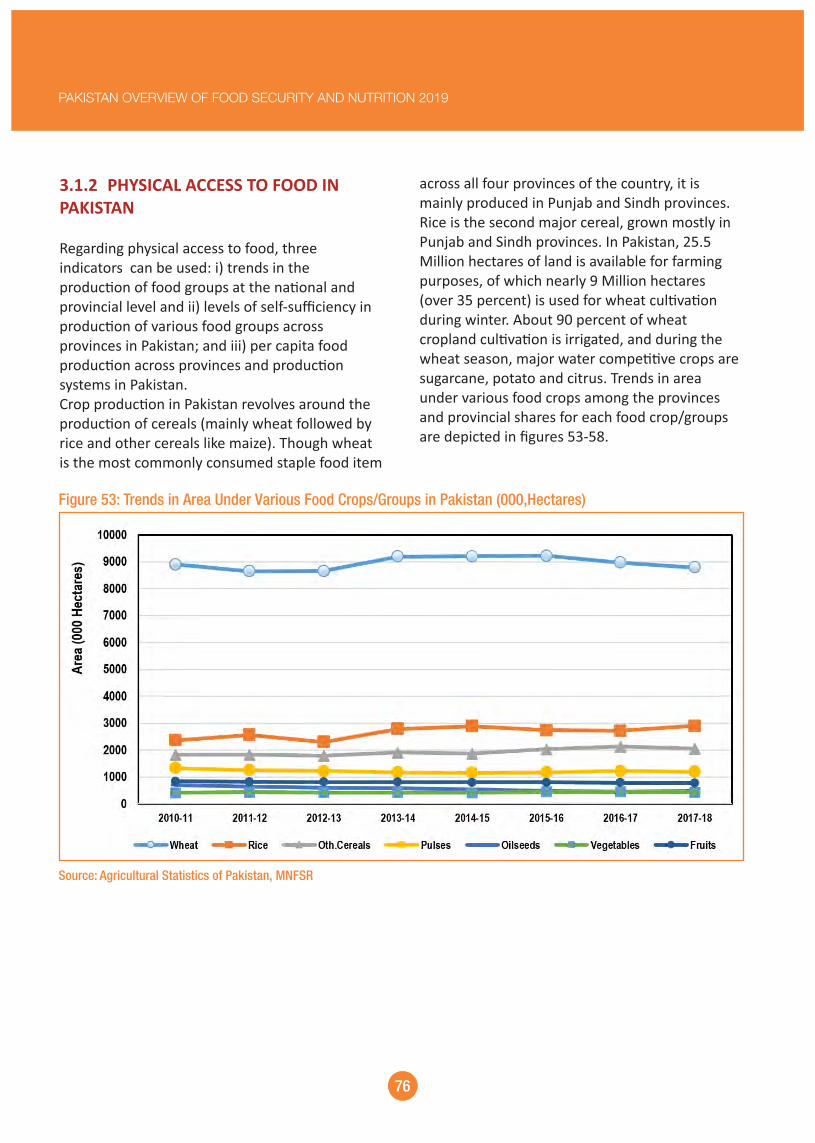
across all four provinces of the country, it is mainly produced in Punjab and Sindh provinces. Rice is the second major cereal, grown mostly in Punjab and Sindh provinces. In Pakistan, 25.5 Million hectares of land is available for farming purposes, of which nearly 9 Million hectares (over 35 percent) is used for wheat cul�va�on during winter. About 90 percent of wheat cropland cul�va�on is irrigated, and during the wheat season, major water compe��ve crops are sugarcane, potato and citrus. Trends in area under various food crops among the provinces and provincial shares for each food crop/groups are depicted in figures 53-58.
3.1.2 PHYSICAL ACCESS TO FOOD IN PAKISTAN
Regarding physical access to food, three indicators can be used: i) trends in the produc�on of food groups at the na�onal and provincial level and ii) levels of self-sufficiency in produc�on of various food groups across provinces in Pakistan; and iii) per capita food produc�on across provinces and produc�on systems in Pakistan.Crop produc�on in Pakistan revolves around the produc�on of cereals (mainly wheat followed by rice and other cereals like maize). Though wheat is the most commonly consumed staple food item
Figure 53: Trends in Area Under Various Food Crops/Groups in Pakistan (000,Hectares)
Source: Agricultural Statistics of Pakistan, MNFSR
76
PAKISTAN OVERVIEW OF FOOD SECURITY AND NUTRITION 2019

Figure 54: Trends in the Area under Various Food Crops/Groups in Pakistan (000, Hectares)
Source: Agricultural Statistics of Pakistan, MNFSR
Figure 55: Provincial Shares in Area Under Various Food Crops/Groups in Pakistan (Percent)
Source: Agricultural Statistics of Pakistan, MNFSR
77
Part 3:FOOD SECURITY : IMPROVING ACCESS TO FOOD

Figure 56: Trends in the Production of Various Food Crops/Groups in Pakistan
Source: Agricultural Statistics of Pakistan, MNFSR
Figure 57: Trends in the Production of Various Food Crops/Groups by Provinces in Pakistan
Source: Agricultural Statistics of Pakistan, MNFSR
78
PAKISTAN OVERVIEW OF FOOD SECURITY AND NUTRITION 2019

Figure 58: Provincial Shares in the Production of Various Food Crops/Groups in Pakistan
Source: Agricultural Statistics of Pakistan, MNFSR
why the prices of vegetables and fruits remain unstable, generally, high in slack and low in peak crop seasons across the consumer markets of the country; although a good road, transport connec�vity network exists across the provinces. Long distances some�mes reinforce rising prices – par�cularly when there is seasonal produc�on shortage of some commodi�es manifested – making both physical and economic access more difficult for the consumers.
Pakistan is net-surplus producing in wheat, rice and other cereals. However, it is net-deficient in producing pulses, oilseeds, vegetables and fruits (Figure 59). Across provinces, Punjab is significantly net-surplus in producing wheat and other cereals; Punjab and Sindh are net-surplus in rice produc�on. All provinces of Pakistan are net-deficient in yielding pulses, oilseeds and vegetables. In fruits, only Balochistan is net-surplus in produc�on. This picture partly explains
79
Part 3:FOOD SECURITY : IMPROVING ACCESS TO FOOD

Figure 59: Product Surplus Status of Provinces in Selected Food Crops/Groups
Source: Computations using Agricultural Statistics of Pakistan, MNFSR
80
PAKISTAN OVERVIEW OF FOOD SECURITY AND NUTRITION 2019

Years Wheat Rice Pulses Edible Oil & Ghee
Milk Meat 27 Sugar Fruits & Vegetables
2006 -07 114.5 12.5 6.7 13.4 114.4 16.4 25.5 43.8
2007 -08 135.8 15.0 7.1 13.5 114.4 16.6 29.2 47.0
2008 -09 127.3 23.2 5.5 12.6 115.6 16.9 19.1 44.2
2009 -10 125.7 13.2 6.6 11.6 117.2 17.3 20.6 41.6
2010 -11 109.8 4.9 6.7 13.0 112.3 16.8 28.7 40.1
2011 -12 124.6 13.8 6.5 13.1 96.5 18.1 25.1 39.4
2012 -13 120.5 17.8 6.3 13.2 97.6 18.6 27.0 37.8
2013 -14 125.3 14.2 5.2 12.6 121.9 19.0 29.2 35.3
2014 -15 122.0 14.2 4.9 12.4 122.4 19.3 26.4 38.6
2015 -16 116.5 11.0 4.9 14.2 170.5 20.0 25.6 36.7
2016 -17 119.1 14.6 5.7 14.6 102.6 20.8 33.8 36.9
2017 -18 101.2 14.0 5.6 14.5 100.0 21.1 34.3 39.3
and ghee, meat and sugar. The growing popula�on and other factors such as climate related disasters, low produc�on and low imports might have contributed to reduc�on/fluctua�on in the per capita availability of these food crops/groups.
The year-wise trends in per capita availability of various food crops/groups (in KGs/annum) in Pakistan are presented in Table 3 below. Per capita availability of wheat, pulses, milk, fruits and vegetables has declined between 2006-07 and 2017-18, with fluctua�ons during this period, whereas it improved in the case of rice, edible oil
Table 3: Per Capita Availability of Food Crops/Groups in Pakistan (kgs/annum)
Source: Computations using Agricultural Statistics of Pakistan, MNFSR
81
Part 3:FOOD SECURITY : IMPROVING ACCESS TO FOOD
27. Meat includes beef, mu�on and poultry meat

Box 12: Wheat Policies in Pakistan
Wheat is a staple diet and it contributes most of the food calories of Pakistan popula�on. Resultantly most of the country's agricultural resources (land, water, and inputs) go to cul�va�ng wheat all over Pakistan in the winter season. Wheat has had a special place in the public policy of the Government of Pakistan.
The cornerstone of the policy is to provide price control by ensuring cheaper wheat flour to the consumer and as well as reasonable prices to the wheat-growers. Although agriculture is a provincial subject, for the wheat crop federal government itself s�ll takes a policy decision and oversees its implementa�on. Before the start of the wheat cul�va�on season, the federal government/cabinet, announce wheat support price and procurement targets for the ensuing season. This support price, however, is announced taking into considera�on of analysis carried out by the Agriculture Policy Ins�tute. For the implementa�on of this policy decision, provincial food departments, Pakistan Agricultural Storage, and Services Corpora�on (PASSCO), a federal agency, procures wheat directly from farmers. Generally, procurements are kept at around 20 percent of produc�on. This is intended to directly benefit the farmers it reaches, and stabilise the market. Both food departments and PASSCO have a storage capacity of over 4 million tons. Procurement opera�ons run for a couple of months in April and May un�l the achievement of procurement targets. The procured wheat is stored for a few months and then released to flour mills on subsidized rates based on quota issued to each flour mill. The government has a price monitoring mechanism through which reasonably priced flour is ensured to the ci�zens of Pakistan.
Recently, the impact of the wheat policy has begun to be reconsidered, both in terms of the nutri�onal impacts of subsidising and encouraging an imbalanced diet dominated by wheat, as well as with regards to whether the budgetary alloca�ons that go to the wheat policy could be redirected to other priority policy and program areas in the budget, for example WASH, educa�on, health services and knowledge to address climate change for small holder farmers, men and women, that, as drivers of food insecurity and malnutri�on, deserve more emphasis.
transport and communica�on infrastructure are necessary so that people can access the food in �mely manner. Over �me, Pakistan has improved its infrastructure, which includes roads, railways, ports and shipping, avia�on and logis�cs services. Road transport, with a share of 96.7 percent of freight traffic, dominates the sector. The railways, which were a cheap and effec�ve means of transporta�on, lost their compe��veness to road transport, and are now le� with only 3.32 percent of freight traffic. This imbalance is not only over-burdening road systems, causing conges�on,
3.1.3 TRANSPORT AND COMMUNICATION INFRASTRUCTURE
Presently no country in the world is fully reliant on its domes�c produc�on, due to different factors of produc�on and food choices of the people. Similarly, not all regions of Pakistan produce enough food of sufficient variety to support local people. Punjab is a food basket of the country and has a good produc�on base, followed by Sindh province. All other regions are deficient for staple foods i.e. wheat and other kitchen food items. To ensure food for all, good
82
PAKISTAN OVERVIEW OF FOOD SECURITY AND NUTRITION 2019
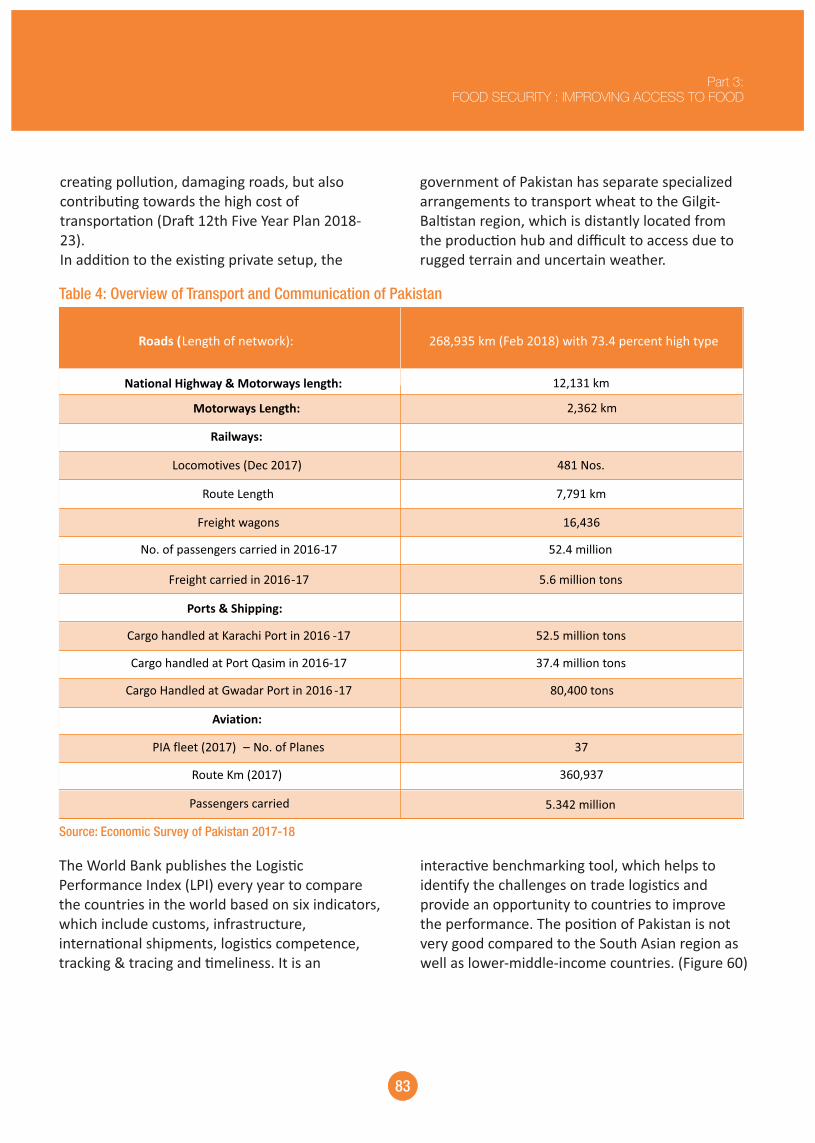
government of Pakistan has separate specialized arrangements to transport wheat to the Gilgit-Bal�stan region, which is distantly located from the produc�on hub and difficult to access due to rugged terrain and uncertain weather.
crea�ng pollu�on, damaging roads, but also contribu�ng towards the high cost of transporta�on (Dra� 12th Five Year Plan 2018-23). In addi�on to the exis�ng private setup, the
Table 4: Overview of Transport and Communication of Pakistan
Roads (Length of network): 268,935 km (Feb 2018) with 73.4 percent high type
National Highway & Motorways length: 12,131 km
Motorways Length: 2,362 km
Railways:
Locomotives (Dec 2017) 481 Nos.
Route Length 7,791 km
Freight wagons 16,436
17No. of passengers carried in 2016 52.4 million
Freight carried in 2016-17 5.6 million tons
-
Ports & Shipping:
Cargo handled at Karachi Port in 2016 -17 52.5 million tons
Cargo handled at Port Qasim in 2016-17 37.4 million tons
Cargo Handled at Gwadar Port in 2016 -17 80,400 tons
Aviation:
PIA fleet (2017) – No. of Planes
37
Route Km (2017)
360,937
Passengers carried
5.342 million
Source: Economic Survey of Pakistan 2017-18
interac�ve benchmarking tool, which helps to iden�fy the challenges on trade logis�cs and provide an opportunity to countries to improve the performance. The posi�on of Pakistan is not very good compared to the South Asian region as well as lower-middle-income countries. (Figure 60)
The World Bank publishes the Logis�c Performance Index (LPI) every year to compare the countries in the world based on six indicators, which include customs, infrastructure, interna�onal shipments, logis�cs competence, tracking & tracing and �meliness. It is an
83
Part 3:FOOD SECURITY : IMPROVING ACCESS TO FOOD

Figure 60: Logistics Performance Index of Pakistan
Source: World Bank Logistics Performance Index (LPI) Report, 2018
efficient for consumers and farmers. For producer par�cularly these markets transformed into a trap where taxes are charged and services in return become very poor. Agricultural markets are being run with old colonial legisla�on called agricultural produce market act 1939 and with li�le amendments since then though some efforts were made in the various provinces, but implementa�on could not reach the desired level.
Very recently few changes were observed in legisla�on in Punjab (The Punjab Agricultural Marke�ng Regulatory Authority Act, 2018), Sindh (The Sindh Wholesale Agricultural Produce Markets Act, 2010), Balochistan (The Balochistan Agriculture Produce Market Act 1991) and Khyber Pakhtunkhwa (Khyber Pakhtunkhwa Agricultural and Livestock Produce Markets Act, 2007). Under this arrangement, the situa�on of agriculture markets and market commi�ees is given in table 5.
3.1.4 MARKET INFRASTRUCTURE
To make food products physically available, market infrastructure is needed along with the transport infrastructure. Agriculture marke�ng is a provincial subject in Pakistan. Legal framework for the marke�ng of agricultural commodi�es has evolved over �me in accordance with change in the produc�on, informa�on dissemina�on, transporta�on and consumer preferences. Generally, the protec�on of the farmers from exploita�ve prac�ces of intermediaries has been an important policy concern and has been provided in legisla�on but not prac�ced much.
Ini�ally, produce markets were designed as places where prices were set through auc�on by market agents for a commission. In return, these markets were obliged to provide the infrastructure and regulatory environment. With the passage of �me, however such markets did not remain
84
PAKISTAN OVERVIEW OF FOOD SECURITY AND NUTRITION 2019

Province No. of MCs No. of Markets No. of markets
Grain
ood F &
Vegetables Total
Public
Private
Punjab 135 140 122 262 233 29
Sindh 71 13 21 34 27 7
KPK 2 5 31 36 2 34
Balochistan 12 2 10 12 12 -
Islamabad 1 - 1 1 1 -
Total 221 160 185 345 280 65
Table 5: Number of Markets and Market Committees (MCs) in Pakistan
Source: Rana MA 2014
agriculture commodi�es. Data from Punjab explain the increase in produce and opening of the new market over the years (Table 6 to 7).
It seems that an expansion in market infrastructure has occurred over �me, but not commensurate with the increase in the value of
Duration Relocated Total
Grain Food & Vegetables
Both Feeder
New arketsM
1939 -62 107 62 - - - 169
1963 -70 1 - 1 - 1 3
1971 -80 2 1 2 7 1 13
1981 -89 1 2 - - - 3
1990 -99 1 5 - - 3 9
2000 -09 3 3 - - 16 22
2010 -17 1 3 - - 10 14
Total 116 76 3 7 31 233
Table 6: Public Markets in Punjab by Year of Establishment (Numbers)
Source: Rana MA 2014
85
Part 3:FOOD SECURITY : IMPROVING ACCESS TO FOOD

Table 7: Private Markets in Punjab by Year of Establishment (Numbers)
Year/period M Relocated Total
Grain F ood Vegetables
Both Feeder
New arkets
&
1939-62 - - - - - -
1963-70 - - - - - -
1971-80 - - - - - -
1981-89 1 - - - 1 2
1990-99 - - - - - -
2000-09 - 4 - - - 4
2010-17 7 15 1 - - 23
Total 8 19 1 1 29
Source: Rana MA 2014
popula�on growth. However, agricultural policies of developing countries, generally, revolve around increasing supplies of staple foods in the country, rather than the total food consump�on basket. Pakistan is no excep�on. The country has made significant progress in enhancing food produc�on to feed the growing popula�on. However, household level food security and nutri�on remained a significant concern with numerous issues related to economic access to food, its u�liza�on and coping with natural disasters affec�ng food produc�on and its access to the poor. Lack of purchasing power³⁰ (or high market prices of food) deprives a person from access to food even though food is available. Economic access to food in a country can be examined from the perspec�ves like trends in prices of important foods, food price index and trends in per capita availability of various food groups.
3.2 ECONOMIC ACCESS
From the economic access perspec�ve, food security prevails when food is available, and people can afford to buy it in sufficient quan��es. This leads to the recent development of the concept of food insecurity. Food insecurity prevails when there is insufficient availability of food (i.e. local produc�on + import) and even if food is available, but people are unable to afford or to use, in �me.
Availability²⁸ and access²⁹ are two important dimensions of food security. Availability indicates year-round sufficient quan��es of quality/nutri�ous food available to all individuals in the country. As men�oned earlier, food availability in any country mainly depends on the growth performance of agriculture (par�cularly the crop and livestock sectors) against its
28. The availability of sufficient quan��es of food of appropriate quali�es, supplied through domes�c produc�on and marke�ng systems coupled with �mely imports (in case of shortages) and food aids (if any). This is o�en confused with food security, though it is important part of food security, but not all. The ques�on is not only that food is available in a country, but also whether it is available at right place, at the right �me and there must be a mechanism for ensuring that food of the right quality made available.
29. Access by individuals to adequate resources (en�tlements) to acquire appropriate foods for a nutri�ous diet. These resource need not be exclusively monetary but may also include tradi�onal rights, e.g. to a share of common resources. En�tlements are defined as the set of all those commodity bundles over which a person can establish command given the legal, poli�cal, economic and social arrangements of the community in which s/he lives.
30. Inadequate livelihood opportuni�es to the working age group of the people, par�cularly in rural areas are partly responsible for household food and/or nutri�on security.
86
PAKISTAN OVERVIEW OF FOOD SECURITY AND NUTRITION 2019
Box 13: Land Access and Tenure Security – an important element of economic access and stability
Access to land, including security of tenure for those who do not own land, is a fundamental determinant of food security in an agriculture-based rural economy. In Pakistan, there are a variety of arrangements whereby small farmers and landless men and women may work on the land of larger landowners, either as sharecroppers, tenants or agricultural labourers. In some areas the prac�ce is that labourers may be at least partly paid in wheat or other staple grains, rather than cash. Large landowners may also follow a custom of se�ng aside some area of land for their sharecroppers to self-produce food such as vegetables for immediate needs, although with the recent focus on cash crops, this prac�ce is declining. Sharecropping involves the sharecropper farmers and landowners sharing both inputs and outputs to the produc�on system via customary arrangements that are reflected in tenancy legisla�on in the respec�ve province – this is especially prevalent in Sindh and to a lesser extent in Punjab. The sharecropping system is u�lised on acreages of varying sizes from quite small farms of less than 12.5 acres up to very large holdings of above 500 acres.With the change in agriculture prac�ces required to adapt to climate change and modernize the sector, challenges have increased for sharecroppers in Pakistan, par�cularly regarding the transi�on to mechanisa�on and to widespread use of fer�lizers and pes�cides. These challenges include debt accumula�on due to the higher cost of inputs, land prepara�on and harves�ng opera�ons; greater health risks from exposure toxic agro-chemicals; and uncertainty in yields due to the scarcity of water, changed agro-ecological zones, inadequate access to knowledge and more frequent natural disasters. Compounding these produc�on related challenges are governance issues and a lack of documenta�on of customary rights, and the details of inputs paid, leading to uncertainty in income, insecure land access from year to year, and ul�mately, food insecurity. Lack of documenta�on is partly related to the s�ll high illiteracy levels and social inequality found in rural society. At a local level, land tenure insecurity for sharecroppers discourages improvements to sustainability of land and water management prac�ces used in the cropping system, because the incen�ve for a long term approach also requiring some investment is missing. Although a number of reforms to the land access system have been a�empted by governments during the history of Pakistan, these have only had limited success, contribu�ng to the persistence of food insecurity.Good governance of land tenure has implica�ons for social stability, improved human development and a fairer society; more efficient provision of government services with lower risk of malprac�ce; improved delivery of infrastructure; as a basis for a broader, fairer tax base for government; be�er care for the environment; and improved resilience and preparedness for natural disasters and climate change. Beginning in 2013, FAO has led some efforts in Pakistan to improve land tenure governance by drawing on the interna�onally recognised Voluntary Guidelines for Responsible Governance of Tenure of Land, Fisheries and Forestry in the Context of Na�onal Food Security that were developed by FAO and agreed by the Commi�ee on World Food Security in 2012. In Sindh, FAO has been trialling an innova�ve approach of assis�ng landowners and sharecroppers to have wri�en versions of their customary agreements, along with informa�on and training on climate-resilient approaches to crop produc�on and on farm water management. Poten�ally, such agreements, if combined with improvements to the administra�on of the Sindh Tenancy Act, represent an important step towards improved food security for the large number of vulnerable sharecroppers in the province as well as the opportunity for landowners to benefit from a modernised food and agriculture produc�on system. Source: FAO, Strategy for Improved Land Tenancy in Sindh
87
Part 3:FOOD SECURITY : IMPROVING ACCESS TO FOOD
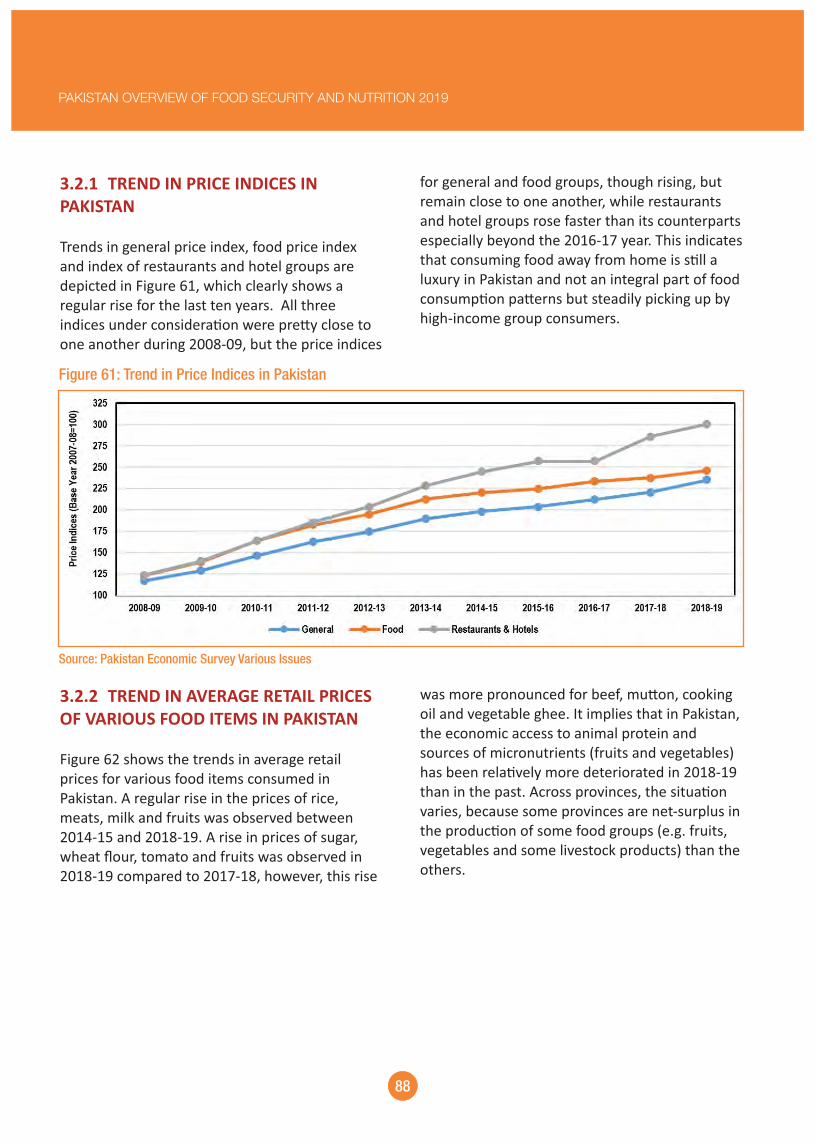
for general and food groups, though rising, but remain close to one another, while restaurants and hotel groups rose faster than its counterparts especially beyond the 2016-17 year. This indicates that consuming food away from home is s�ll a luxury in Pakistan and not an integral part of food consump�on pa�erns but steadily picking up by high-income group consumers.
3.2.1 TREND IN PRICE INDICES IN PAKISTAN
Trends in general price index, food price index and index of restaurants and hotel groups are depicted in Figure 61, which clearly shows a regular rise for the last ten years. All three indices under considera�on were pre�y close to one another during 2008-09, but the price indices
Figure 61: Trend in Price Indices in Pakistan
Source: Pakistan Economic Survey Various Issues
was more pronounced for beef, mu�on, cooking oil and vegetable ghee. It implies that in Pakistan, the economic access to animal protein and sources of micronutrients (fruits and vegetables) has been rela�vely more deteriorated in 2018-19 than in the past. Across provinces, the situa�on varies, because some provinces are net-surplus in the produc�on of some food groups (e.g. fruits, vegetables and some livestock products) than the others.
3.2.2 TREND IN AVERAGE RETAIL PRICES OF VARIOUS FOOD ITEMS IN PAKISTAN
Figure 62 shows the trends in average retail prices for various food items consumed in Pakistan. A regular rise in the prices of rice, meats, milk and fruits was observed between 2014-15 and 2018-19. A rise in prices of sugar, wheat flour, tomato and fruits was observed in 2018-19 compared to 2017-18, however, this rise
88
PAKISTAN OVERVIEW OF FOOD SECURITY AND NUTRITION 2019

families, food consump�on is 12 percent higher than their counterparts. Moreover, wheat and other cereals are the only groups that are rela�vely less consumed in high-income households, while for all other food groups, the per capita daily consump�on is significantly higher in high-income households than their counterparts (Table 8).
3.2.3 FOOD CONSUMPTION PATTERNS BY INCOME GROUPS IN PAKISTAN
In Pakistan, on average more than 1 kilogram of food per capita is consumed daily. Quan�ta�vely, cereals are most consumed followed by milk products + fats and vegetables. Fruits and meats fall in the least consumed groups. In high-income
Figure 62: Trends in Average Retail Prices of Various Food Items Consumed in Pakistan
Source: Monthly Retail Price Statistics Published by Pakistan Bureau of Statistics (Various Issues)
89
Part 3:FOOD SECURITY : IMPROVING ACCESS TO FOOD

th
Food Groups
Average Per capita Consump�on Per Month (kg.)
Food Groups’ Shares in the Diet ( percent)
(1Quin�le) Quin�le)
Low income groupst & 2nd
Middle income group
(3rd
Quin�le)
High income group
(4 & 5th
All income groups (1st
Quin�le)
Low income group
& 2nd
Quin�le)
Middle income group
(3rd (4th
Quin�le)
High income group
& 5th
All income groups
Total
Wheat
Pulses
Milk (Liquid + powder)
Bu�er, Ghee, Cook-oil
Meats
Fruits
Other cereals
Vegetables
Miscellaneous (Salt, sugars, tea)
7.15
2.05
0.29
5.36
0.84
0.53
1.01
3.11
1.60
6.75
1.94
0.27
4.65
0.77
0.43
0.81
2.80
1.50
19.90 21.94
32.01
7.63
2.50
0.45
9.72
1.14
1.36
2.54
4.68
2.00
7.26
2.22 0.36 7.10 0.95 0.85
1.62
3.70
1.74
25.81
33.92 9.75 1.36 23.37 3.87 2.16
4.07
14.07
7.54
100.00
32.59 9.34 1.32 24.43 3.83 2.42
4.60
14.18
7.29
100.00
23.84
7.81
1.41
30.37
3.56
4.25
7.94
14.62
6.25
100.00
28.14 8.60 1.40 27.52 3.68 3.29
6.28
14.34
6.74
100.00
Table 8: Food Consumption Patterns by Income Groups in Pakistan
Source: Estimations made from Food Consumption Table for 20 Most Consumed Items Reported in HIES 2015-16 Report.
micronutrients. In an era of rising food prices and otherwise, kitchen gardening would be an important source for the consump�on of nutri�on vegetables.
In other words, the dietary pa�erns in Pakistan are cereals dominated (Figure 63). Protein intake from plant and animal sources is generally low, whereas vegetables are a major source of
Figure 63: Share of Different Food Groups in Diet in Pakistan
Source: Estimations made from Food Consumption Table for 20 Most Consumed Commodities Reported in HIES 2015-16 Report.
90
PAKISTAN OVERVIEW OF FOOD SECURITY AND NUTRITION 2019

expenditure on food is incurred on wheat, milk, vegetable ghee, vegetables and sugar that have almost 52.1 percent share out of 88.4 percent (Table 9).
Out of the total food expenditure, 88.4 percent was spent on 20 food items. These items a�ract 89.1 percent in rural areas and 87.3 percent in urban areas. A comparison of the same 20 food items shows that the major share of consump�on
Wheat & Wheat Flour
Rice & Rice Flour
Pulses, Split & Whole
Bread and Other Cereals
Vegetable Ghee
Tea (black & green)
Milk, Fresh & Boiled
Milk Tetra Pack
Mutton
Beef
Chicken
Fish
Fruits (fresh & dried)
Vegetables
Salt
Spices
Mineral
Water, Soft Drinks, Fruits and Vegetable Juice
Hotel & Restaurants
Total
National Urban Food Items Rural
12.55
3.45
2.31
2.67
4.38
2.62
20.92 1.23
1.66
3.01
3.54
0.8
4.33
9.02
0.17
2.49
4.01
0.25
1.71
7.25
88.4
9.88
3.35
2.11
2.65
2.93 2.31 18.38 1.77
2.44
3.35
3.87
1.09
5.01
8.22
0.17
2.83
3.16
0.11
2.4
11.3
87.3
14.42 3.51
2.45 2.69
5.39
2.84
22.69
0.85 1.12 2.77
3.32
0.6
3.86 9.58 0.17
2.26
4.6
0.35
1.23
4.43
89.1
Gur & Shakkar
Table 8: Food Consumption Patterns by Income Groups in Pakistan
Source: Household Integrated Economic Survey (HIES) 2015-16 Report, Pakistan Bureau of Statistics, 2017
cultural, ethnic, social systems and consumer preferences are some underlying factors. Similarly, in some households, men tradi�onally have the choicest access to cooked food, but may have a lack of knowledge about its prepara�on, food safety and hygiene challenges in the kitchen facili�es. Such observa�ons can be easily made in rural socie�es of Pakistan. It is s�ll a custom in many households in Pakistan that the breadwinner has advantage in ea�ng over others. Furthermore, the prepara�on of food is considered the domain of women in these contexts and the workload involved is ignored by
3.3 SOCIAL ACCESS TO FOOD
Social access to food is a phenomenon can be observed in both inter-household (in society) and intra-household levels. Generally, in every society, some households suffer from malnutri�on while others do not, though both are living under same condi�ons of physical and economic access to food, indica�ng the differen�al cultural access to food in the society. No doubt, the differences in culture, beliefs, religious background and educa�on play a pivotal role in adop�ng food choices out of the available basket of food. The
91
Part 3:FOOD SECURITY : IMPROVING ACCESS TO FOOD
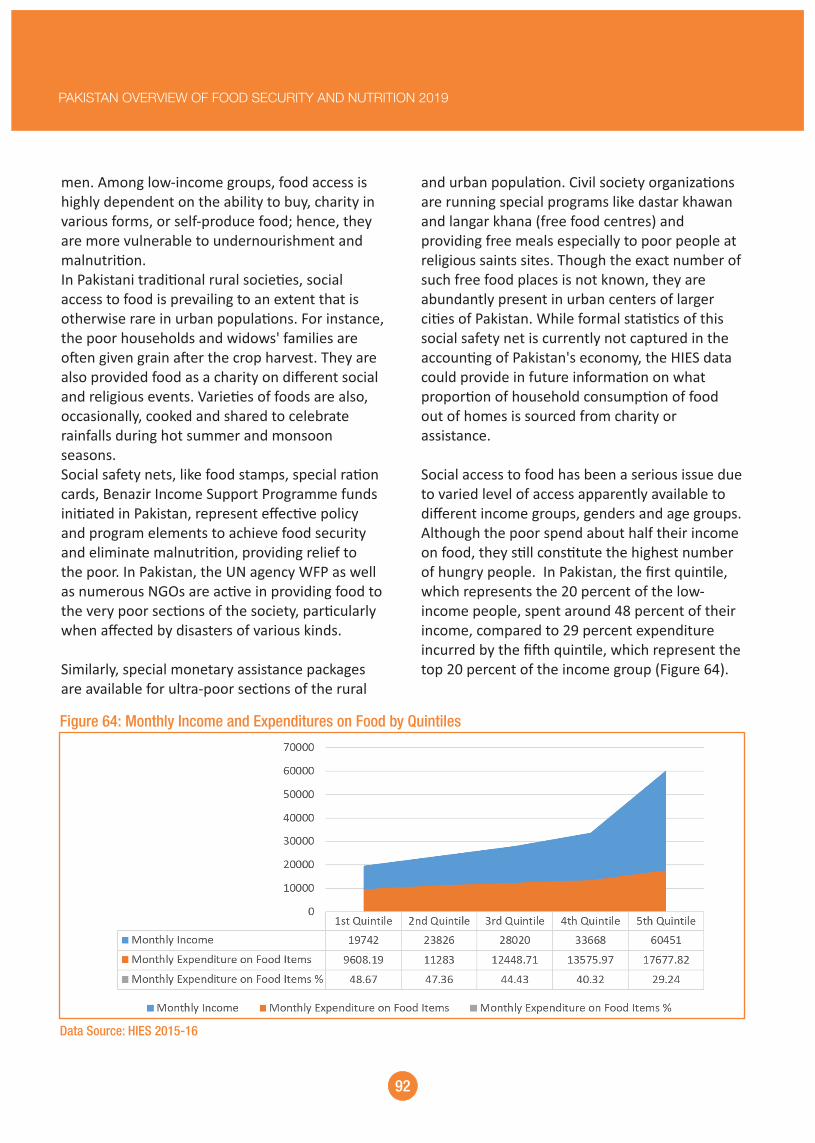
and urban popula�on. Civil society organiza�ons are running special programs like dastar khawan and langar khana (free food centres) and providing free meals especially to poor people at religious saints sites. Though the exact number of such free food places is not known, they are abundantly present in urban centers of larger ci�es of Pakistan. While formal sta�s�cs of this social safety net is currently not captured in the accoun�ng of Pakistan's economy, the HIES data could provide in future informa�on on what propor�on of household consump�on of food out of homes is sourced from charity or assistance. Social access to food has been a serious issue due to varied level of access apparently available to different income groups, genders and age groups. Although the poor spend about half their income on food, they s�ll cons�tute the highest number of hungry people. In Pakistan, the first quin�le, which represents the 20 percent of the low-income people, spent around 48 percent of their income, compared to 29 percent expenditure incurred by the fi�h quin�le, which represent the top 20 percent of the income group (Figure 64).
men. Among low-income groups, food access is highly dependent on the ability to buy, charity in various forms, or self-produce food; hence, they are more vulnerable to undernourishment and malnutri�on.In Pakistani tradi�onal rural socie�es, social access to food is prevailing to an extent that is otherwise rare in urban popula�ons. For instance, the poor households and widows' families are o�en given grain a�er the crop harvest. They are also provided food as a charity on different social and religious events. Varie�es of foods are also, occasionally, cooked and shared to celebrate rainfalls during hot summer and monsoon seasons.Social safety nets, like food stamps, special ra�on cards, Benazir Income Support Programme funds ini�ated in Pakistan, represent effec�ve policy and program elements to achieve food security and eliminate malnutri�on, providing relief to the poor. In Pakistan, the UN agency WFP as well as numerous NGOs are ac�ve in providing food to the very poor sec�ons of the society, par�cularly when affected by disasters of various kinds.
Similarly, special monetary assistance packages are available for ultra-poor sec�ons of the rural
Figure 64: Monthly Income and Expenditures on Food by Quintiles
Data Source: HIES 2015-16
92
PAKISTAN OVERVIEW OF FOOD SECURITY AND NUTRITION 2019
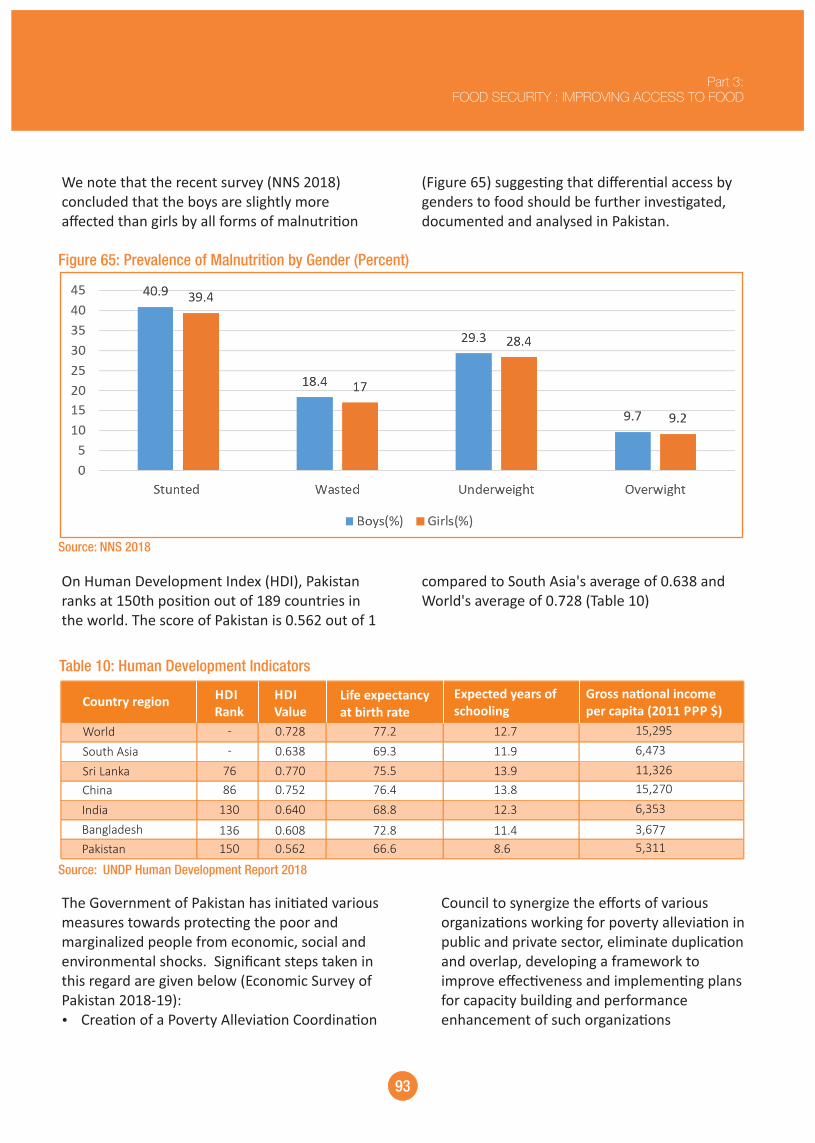
(Figure 65) sugges�ng that differen�al access by genders to food should be further inves�gated, documented and analysed in Pakistan.
We note that the recent survey (NNS 2018) concluded that the boys are slightly more affected than girls by all forms of malnutri�on
Figure 65: Prevalence of Malnutrition by Gender (Percent)
Source: NNS 2018
compared to South Asia's average of 0.638 and World's average of 0.728 (Table 10)
On Human Development Index (HDI), Pakistan ranks at 150th posi�on out of 189 countries in the world. The score of Pakistan is 0.562 out of 1
Table 10: Human Development Indicators
Source: UNDP Human Development Report 2018
Council to synergize the efforts of various organiza�ons working for poverty allevia�on in public and private sector, eliminate duplica�on and overlap, developing a framework to improve effec�veness and implemen�ng plans for capacity building and performance enhancement of such organiza�ons
The Government of Pakistan has ini�ated various measures towards protec�ng the poor and marginalized people from economic, social and environmental shocks. Significant steps taken in this regard are given below (Economic Survey of Pakistan 2018-19): Ÿ Crea�on of a Poverty Allevia�on Coordina�on
93
Part 3:FOOD SECURITY : IMPROVING ACCESS TO FOOD

people, and li� lagging districts. The target of the program is the poor including poor farmers. The strategy is ar�culated in four pillars and it currently embodies 115 policy ac�ons, which may be expanded as the process of consulta�ons on the program, further widens. The four pillars include addressing elite capture and making the government system work to create equality; safety nets for disadvantaged segments of the popula�on; jobs and livelihoods; and human capital development.
The following types of policy ac�ons may affect social access to food:
Ÿ Addressing Elite CaptureŸ Human Capital Development (Malnutri�on)Ÿ Jobs and Livelihood Ÿ Special Programs for Small/Poor FarmersŸ Social Safety Programs in Pakistan
The largest social safety program in Pakistan under the public sector is the Benazir Income Support Program (BISP). BISP has run for over ten years. The achievements of BISP with regard to disbursements and beneficiaries are given below (Figure 66).
Ÿ Establishment of Poverty Allevia�on and Social Safety Division
Ÿ Re-priori�zing PSDP alloca�ons to focus more on pro-poor projects and the projects for less developed areas
Ÿ Scaling up ac�vi�es of BISP and Pakistan Poverty Allevia�on Fund (PPAF), re-organizing Pakistan Bait ul Mal, to focus on poverty allevia�on and asset transfer to the rural poor to graduate them out of poverty
Ÿ Approval of provision of $82.6 million funds (IFAD funded) as grant to PPAF for disbursement to 320,000 beneficiaries of BISP to help them graduate out of poverty
Ÿ Micro-credits for low-cost housing to provide shelter to the homeless and providing free of cost shelters for the poorest homeless
Ÿ Employment crea�on through housing construc�on and increased access to microfinance under Prime Minister's Naya Pakistan Housing Scheme.
Ÿ Expanding coverage of the Prime Minister's Health Insurance scheme through the Sehat Insaf Card scheme to provide free medical treatment to approximately 80 million people.
The new Ehsaas program was launched in 2019 with the objec�ve to reduce inequality, invest in
Figure 66: Prevalence of Malnutrition by Gender (Percent)
Source: Pakistan Economic Survey 2018-19
94
PAKISTAN OVERVIEW OF FOOD SECURITY AND NUTRITION 2019

Benefits Ins�tu�on, and Workers Welfare Fund. Zakat is the most significant of these. The situa�on of Zakat is given in the table (Table 11)
Along with BISP, several other social protec�on programs are opera�ng in Pakistan. The main ones are Zakat, Baitulmal Employees' Old Age
Federal Areas/Provinces Disbursement (Rs.million) Share(percent)
Federal areas
Punjab
Sindh
Khyber pakhtunkhwa
Balochistan
Total
516.4
3936
1627
984
351
7378
6.99
53.30
22.05
12.85
4.76
100
Table 11: Disbursement of Zakat
Source: Pakistan Economic Survey 2018-19
cases, sluggish implementa�on. Similarly, social pension programmes do not cover informal sectors, even when they employ an overwhelming majority of the workforce.
Poverty oriented programmes including safety nets have been in place for the past several decades. However, most programmes suffer from design limita�ons, limited coverage, fiscal challenges, weak fiscal capaci�es and in some
Figure 67: Pro Poor Expenditure (Rs. Billion)
Source: Pakistan Economic Survey 2018-19
95
Part 3:FOOD SECURITY : IMPROVING ACCESS TO FOOD

The poor, living mainly in the rural areas, tend to be unskilled and work in the informal sector. Employment opportuni�es are limited, and real earnings have declined since the economic slowdown in the 1990s. The poor also lack physical and produc�ve assets and have limited or no access to essen�al services. Agriculture, a key aspect of Pakistan's rural economy and a major source of employment, is not only excluded from social security, but the laws pertaining to the protec�on of workers in terms of condi�ons of employment, health and safety have historically not applied to it. The absence of insurance coverage for crops and produc�ve assets aggravates farmers' vulnerability to extreme clima�c events such as floods, droughts and warming.
With the introduc�on of systema�c targe�ng mechanism, progressive increase in value of transfer and introduc�on of complementary services, BISP has improved its effec�veness. These gains have been iden�fied by systema�c evalua�on: 91 percent targe�ng efficiency, 7 percent reduc�on in the poverty rate³¹, PKR 187 increase in adult equivalent monthly expenditure, 10 percent increase in primary enrolment and reten�on rates, and a slight improvement in asset holding. However, due to its design limita�ons and an extended focus on consump�on smoothing, BISP's poten�al for reducing malnutri�on remains untapped – the malnutri�on situa�on in BISP supported communi�es is characteris�c of an on-going crisis (Oxford Policy Management Ins�tute, 2016).
96
PAKISTAN OVERVIEW OF FOOD SECURITY AND NUTRITION 2019
31. Based on energy-based poverty line. No sta�s�cally significant impact on poverty rate if cost of basic needs (CBN) method is applied for poverty es�ma�on.

Box 14: Urban Poverty
Although urban poverty is nearly half of what it was in 2004, growing trends in urbaniza�on and unplanned expansion of urban and peri-urban areas would seriously threaten, if not reverse, these gains. By 2030, more than half of Pakistan's popula�on is expected to be living in urban areas – posing addi�onal pressure on already strained resources. Many urban areas already host a larger number of people than what they were originally planned to accommodate. The unprecedented surge in the demand for housing, sanita�on and basic services is undermining the quality of life while increasing the cost of living in urban canters. This has resulted in the mushroom growth of slums and poorly planned private housing projects in and around ci�es. Currently, 46 percent of the urban popula�on lives in shanty towns, inner urban slums and under make-shi� arrangements along roadsides, along the railway tracks and under the bridges³². Some studies have been held recently to establish the socio-economic status of the urban slum dwellers. However, there remains a dearth of informa�on on how they nego�ate their entry into the mainstream. More challenging is the segrega�on of data rela�ng to educa�on, health, food security and nutri�on between the well-off urbanites and their under-privileged counterparts – even when the divide between them is highly pronounced. While each urban centre has its own unique characteris�cs, the underlying challenges confron�ng the poor can be, to the most part, generalized. The urban poor have normally always endured hardships, but several emerging trends are further exacerba�ng their adversi�es. First and foremost, the persistent upward surge in food prices, house rent and healthcare in recent years far exceed the trivial increase in wages, leaving the urban poor barely able to afford the household expenditure. The growing rate of urbaniza�on, an influx of the IDPs and the protected presence of Afghan refugees have �ghtened the labour market situa�on with the increasing availability of 'cheap' labour. IDPs and refugees are o�en willing to accept low wages when compared to long-term residents. For example, in IDP and refugee hos�ng areas of KP province, daily wage rates are reduced by 30-40 percent during the periods of heightened displacements³³. Similarly, in rela�vely stable urban areas such as Rawalpindi, Islamabad and Lahore, dwindling private sector investments in real estate and housing and market infrastructure are progressively satura�ng the labour market and thereby reducing income-earning opportuni�es for those dependent on them. The urban poor are o�en hit by severe idiosyncra�c and covariate shocks resul�ng in high consump�on vola�lity. Their dependence on the market to acquire basic food products, even staple, aggravates their vulnerability to income losses, adverse health condi�ons, loss of a breadwinner, infla�onary shocks and disasters. In order to deal with these shocks, the urban poor o�en resort to nega�ve coping strategies such as reducing the quality, frequency and quan�ty of food intake, withdrawing children from school, selling household items and assets and accumula�ng debt. Income vola�lity can make them the 'transitory poor' since they o�en move in and out of poverty. Ironically, they are considered to be living above the na�onally established poverty line and therefore, very few, if at all, are covered by formal safety nets. A recent study highlights the narrowing dispari�es between the urban rich and poor in Pakistan. The study shows that Mother Mortality Ra�o (MMR) is 2.5 �mes more amongst the urban poor when compared to the rich³⁴.
97
Part 3:FOOD SECURITY : IMPROVING ACCESS TO FOOD
32. As cited by several sources i.e. UN Sta�s�cs Division, Department of Economic and Social Affairs 2014, United Na�ons Human Se�lements Programme (UN-Habitat) and Global Urban Indicators Database 2014.
33. Sanctuary in the City? Urban displacement and vulnerability in Peshawar, Pakistan (Irina Mosel & Ashely Jackson) 34. The Urban Disadvantage – Global study by Save the Children
Box 15: Gender, Conflict, Food Insecurity and Malnutri�on
Poverty, cultural barriers, limited access to social services, illiteracy and social inequali�es, among others, are responsible for widening gender gaps in Pakistan, and further contribu�ng to food insecurity and malnutri�on. Growing frequency of human ini�ated and natural disasters have added new dimensions to the tradi�onal gender roles. Delving deeper into the lives of conflict vic�ms in KP and Newly Merged Districts (NMD) unfold the incontestable link between poverty and conflict. In NMD-KP poverty has been a major imputes for conflict and in return, conflict has aggravated poverty. This 'doom spiral' has a strong gender dimension that is important to recognize. First and foremost, the restricted mobility of men during heightened conflicts forced their family members, including women to adjust and assume a leading economic role in the household. During the periods of heightened displacements, many tribal women started to navigate public spaces, previously denied to them. But a leading economic role in the household does not translate into economic empowerment in these conserva�ve areas. In fact, for many of them, the breadwinning responsibility in addi�on to their tradi�onal care taker roles only posed an addi�onal strain. Due to the loss of a male household head due to conflict, many women have con�nued their economic roles upon return to na�ve villages. However, their structural and con�nued limited access to and control over produc�ve resources (land, capital, life skills), as well as limited mobility, seriously undermines their ability to pursue such roles – aggrava�ng the poverty and food and nutri�onal insecurity of the en�re household. Further, their limited access to safety nets due to minimal coverage in NMDs further compounds their situa�on of great vulnerability.
genera�on, processes, acquisi�on and dissemina�on of knowledge and informa�on that covers the supply side only. However, li�le is known about the demand side of the knowledge and informa�on, what are the actual needs of people regarding food security and nutri�on. In other words, it is important to document about extent of available informa�on actually u�lized produc�vely. Moreover, the empirical authen�city of available knowledge is also important based on assimila�on, capacity and capability levels from the receiving ends.
The educa�on system in Pakistan comprises lower educa�on (school) and higher educa�on (college and university) besides some voca�onal and technical training. The literacy rate in Pakistan is not up to the mark, which indicates the limited capacity of the country to u�lize the knowledge for food produc�on consump�on and u�liza�on. Only 62.3 percent of the popula�on is
3.4 KNOWLEDGE ACCESS AND FOOD SECURITY
“Knowledge is like light. Weightless and intangible, it can easily travel in the world, enlightening the lives of the people everywhere”. Similarly, “Knowledge is cri�cal for Development, because everything we do depends on knowledge” (World Development Report, 1990)
Tangible evidence suggests that knowledge and informa�on are capable of helping na�ons to achieve targeted developmental goals. The extraordinary progress in informa�on and communica�on technology, coupled with the increased speed of scien�fic, technological advances and global compe��on along line with changing demands are the reasons why knowledge is becoming more important in the current era. Developments, so far, have been taken place through phases of analysis,
98
PAKISTAN OVERVIEW OF FOOD SECURITY AND NUTRITION 2019

percent) and lowest (15 percent) where mothers have above secondary school level educa�on (matricula�on). Literacy of women in Balochistan was the worst (33.5 percent) compared (57.4 percent in Punjab) with 51.8 percent of the na�onal average (Figure 68).
literate, much worse for women with an abysmal 51.8 percent literacy rate compared to 72.5 percent for men. The Na�onal Nutri�on Survey (NNS, 2011), established the visible link between maternal educa�on and childhood stun�ng. According to the NNS 2011, stun�ng prevalence is highest amongst children of illiterate mothers (38
Figure 67: Literacy Rate in Pakistan (Percent)
increase the accessibility to science-based informa�on and communica�on technologies modes, but also how to improve the relevance and adop�on of informa�on with specific agricultural produc�on pa�erns in different agro-ecologies and produc�on systems prevalent in all provinces of Pakistan. The nature and access to food produc�on related informa�on to the farmers is fairly varied across provinces of Pakistan, as well as farmers' capaci�es to change prac�ces based on informa�on accessed.
In Punjab, besides providing informa�on through conven�onal agricultural extension approaches (wri�ng slogans on signboards, providing printed material, demonstra�on plots, organizing
Public Expenditure on educa�on has been es�mated at just over two percent (2.4 percent in 2017-18). This was too low before 2009-10 but since then it has been rising. Despite an increase in budget alloca�on on educa�on (Rs. 829 billion in 2017-18), it is s�ll not sufficient to address the high illiteracy among masses (Figure 69). Ar�cle 25-A of the Cons�tu�on obligates the state to provide free and compulsory quality educa�on to all children aged 5-16 years. Despite a favourable legisla�ve environment, 22.84 million Pakistani children in this age group are out of school - the second-highest number of out-of-school children in the world.
In rural Pakistan, the challenge is not only to
Source: Economic Survey of Pakistan 2018-19
99
Part 3:FOOD SECURITY : IMPROVING ACCESS TO FOOD
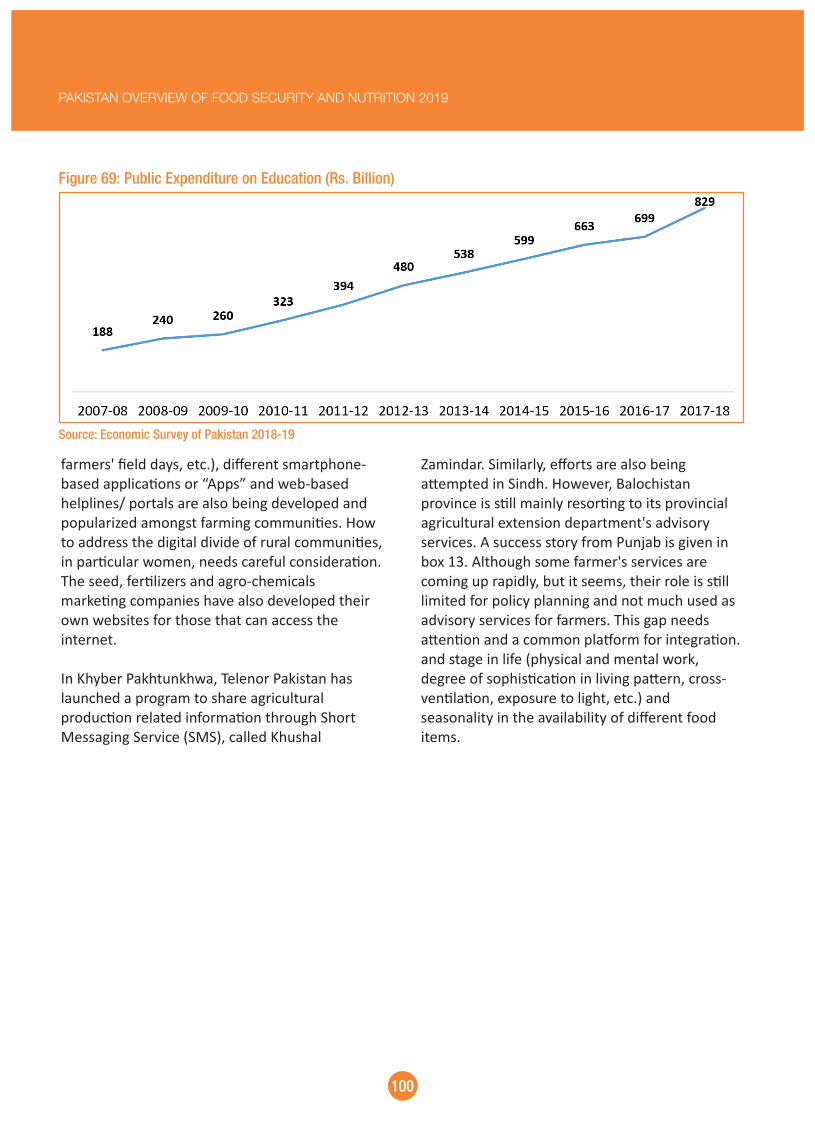
Figure 69: Public Expenditure on Education (Rs. Billion)
Source: Economic Survey of Pakistan 2018-19
Zamindar. Similarly, efforts are also being a�empted in Sindh. However, Balochistan province is s�ll mainly resor�ng to its provincial agricultural extension department's advisory services. A success story from Punjab is given in box 13. Although some farmer's services are coming up rapidly, but it seems, their role is s�ll limited for policy planning and not much used as advisory services for farmers. This gap needs a�en�on and a common pla�orm for integra�on. and stage in life (physical and mental work, degree of sophis�ca�on in living pa�ern, cross-ven�la�on, exposure to light, etc.) and seasonality in the availability of different food items.
farmers' field days, etc.), different smartphone-based applica�ons or “Apps” and web-based helplines/ portals are also being developed and popularized amongst farming communi�es. How to address the digital divide of rural communi�es, in par�cular women, needs careful considera�on. The seed, fer�lizers and agro-chemicals marke�ng companies have also developed their own websites for those that can access the internet.
In Khyber Pakhtunkhwa, Telenor Pakistan has launched a program to share agricultural produc�on related informa�on through Short Messaging Service (SMS), called Khushal
100
PAKISTAN OVERVIEW OF FOOD SECURITY AND NUTRITION 2019

Box 16: 9211 Informa�on System in Punjab for Livestock and Dairy Development
The 9211 is a system that was created through a unique ICT based dynamic communica�on pla�orm that uses the simple GSM network and chiefly Unstructured Supplementary Service Data (USSD) to transfer huge amount of data sets right from the field through simple feature cellular phones resul�ng in a low-cost but high-end database. With the help of this system the Punjab Government generated good deal of empirical evidence that helped formulate the first ever Livestock & Dairy Development Policy of the Punjab in January 2016. Each service that is delivered by the Department is not only mapped on the 9211 System but a system generated SMS also land on the mobile of the farmer for confirma�on of delivered service (for instant social audit), backed by 24/ 7 Call Centre accessible through a toll free number. The System makes 7000 plus field staff of Livestock Department Punjab the largest data entry machine in the world under open skies. The data entry cost is 340 �mes less as compared to a conven�onal computer based system with no possibility of hacking as DB is accessed through VPN tunnels only. In the system, all of 25,892 villages of the Punjab are codified. The system has created a live database of 7.4 million livestock farmers and their 65 million plus livestock. Now Government of the Punjab is ini�a�ng branchless financial digital access to livestock farmers by using 9211 System so that financial inclusion could be facilitated as 73 percent poten�al banking market in Pakistan does not have access to banking products. It will have direct bearing on gender development as well as livestock is intrinsically a part of rural women's lives that spend 59 percent of their daily �me in livestock related ac�vi�es.
vegetables, nuts and legumes will have to significantly increase, and consump�on of foods such as sugar, cereals, fats and oils will have to significantly be reduced.
Recently FAO Pakistan in collabora�on with the Government of Pakistan published dietary guidelines for be�er nutri�on (Box 16). The goal of this work is to improve the nutri�onal wellbeing of the people by promo�ng examples of healthy ea�ng prac�ces by age groups and provinces, reduce nutri�on deficiency and improve the quality of life.
In Pakistan, there is s�ll a big gap in working on shi�ing food consump�on habits to achieve healthy diets, and sustainable food produc�on. In fact, if at present, consumers are provided informa�on about preparing different local dishes and globalized cuisines, the nutri�onal value of different food items in terms of macro and micro-nutrients through the electronic (talks and programs on radio, television, cable channels and internet) and print media (newspapers and magazines) , these do not address the needs for behavioural changes. Transforma�on to healthy diets by 2050 will require substan�al dietary shi�s in Pakistan. Consump�on of fruits,
101
Part 3:FOOD SECURITY : IMPROVING ACCESS TO FOOD

Box 17: Pakistan Dietary Guidelines for Be�er Nutri�on (PDGN)
The PDGN are intended to help in maintaining healthy body weight and reduce the incidence of under-nutri�on, overweight, obesity, premature deaths, and infec�ous and non-communicable chronic diseases by promo�ng healthy diets. It recommends the daily consump�on of basic food groups including cereal, cereal grains and grain products, meat, pulses and eggs, milk and milk products, vegetables and fruits. The guidelines suggest that the consump�on of refined cereals should be reduced and subs�tuted by wholegrain cereals while the consump�on of fresh fruits, vegetables, pulses, meat, and milk be increased as per body requirements. In addi�on to diet, regular physical exercise and physical ac�vity are crucial for the preven�on and management of diseases through the guidelines. The essence of PDGN is to provide updated dietary recommenda�ons to the general popula�on by age groups for promo�ng good nutri�on, safe food handling/ management prac�ces and adop�on of healthy lifestyles for quality life and economic produc�vity. An e-learning course has also been developed for mass awareness raising, covering the important aspects of the dietary guidelines for reinforcement of dietary messages.
The PDGN will be useful for professionals and policy makers to formulate appropriate policy, plan and programmes directly or indirectly. It will facilitate provincial food and drug authori�es to implement food quality standards in their respec�ve provinces for ensuring that all type of food is safe and of be�er quality.
Source: Pakistan Dietary Guidelines for Be�er Nutri�on
format and in a �mely manner has been a challenge for forward planning and decision-making.
A detailed assessment made by FAO on exis�ng data and sub-systems related to food security and nutri�on in Pakistan revealed a strategic gap in integrated data and informa�on management to support evidence based policy making: weak or �me consuming data repor�ng and processing, limited data reliability, non-representa�ve sampling frames, non-coverage of cri�cal indicators and provincial dispari�es in data collec�on mechanisms, and that exis�ng data on indicators of food security and nutri�on and analy�cal capaci�es were sca�ered in Pakistan.
The Government of Pakistan, with the technical assistance of FAO, has inaugurated in July 2019 the establishment of a Food Security and
FOOD SECURITY AND NUTRITION INFORMATION SYSTEM
During 2007-08, a wave of food price infla�on moved across the globe leading to food shortages in domes�c markets. Pakistan in that par�cular year harvested record wheat but due to lack of global informa�on, exported the wheat. In the same year when the crisis hit the country, Pakistan had to import wheat to meet local demands, at a higher price than the export price. The Prime Minister Task Force on Food Security iden�fied that in Pakistan, there was inadequate awareness of these type of disrup�ve factors to food security and nutri�on, and therefore no policy response to the emerging crisis could be an�cipated. Un�l recently there was no system available to make the data easily retrievable and develop analy�cal products. Access to reliable informa�on on food security in an integrated
102
PAKISTAN OVERVIEW OF FOOD SECURITY AND NUTRITION 2019

effec�ve communica�ons. This first Pakistan Overview of Food Security and Nutri�on, 2019 report is the first analy�cal product of the Food Security and Nutri�on Informa�on System, and a major step forward in the fight against hunger and malnutri�on. (Figure 70).
Nutri�on Informa�on System to provide �mely informa�on for monitoring, advisory and planning purposes on food security and nutri�on related ma�ers in Pakistan that encompass the data availability and exchange and forward looking analy�cal products, supported by
Figure 70: Food Security and Nutrition Information System
FSNIS
Data Products
Analytical Products
Tabulation Reports
Visualization
Download
Metadata
National SOFI
Food Outlook
Crop Monitor
Market Monitor
Agriculture Outlook
of knowledge access, awareness, educa�on and behavioural changes as well as standards se�ng are extremely important and require policy makers, private sector and civil society to each play their role in contribu�ng to the necessary shi� in food consump�on habits to achieve healthy diets, and sustainable food produc�on. Keeping in view the low literacy rate in Pakistan, it is nevertheless a challenging task.
Knowledge in understanding and making the right choices at each stage of sustainable and safe agriculture and food produc�on, processing, storage, marke�ng, and consump�on is fundamental to achieve food security and be�er nutri�on. The significance of knowledge in the 'u�liza�on' dimension of food security is what allows healthy food choices, food quality, personal hygiene and food safety. For this aspect
103
Part 3:FOOD SECURITY : IMPROVING ACCESS TO FOOD

REFERENCES
1. Agricultural Census 2010: Pakistan Report. Government of Pakistan Sta�s�cs Division Agricultural Census Organiza�on. Available at: h�p://www.pbs.gov.pk/sites/default/files/aco/publica�ons/agricultural_census2010/WRITE-UP percent20AGRI. percent20CENSUS percent202010.pdf
2. Ahmad M & Farooq U.2010. The state of food security in Pakistan: future challenges and coping strategies, The Pakistan Development Review, 49 (Winter 2010): 903-23.
3. Akhtar S. 2015. Food Safety Challenges: A Pakistan's Perspec�ve. Cri�cal Reviews in Food Science and Nutri�on. 55(2): 219-26.
4. Alauddin, S. 2012. Food adultera�on and society. Global Research Analysis. 1: 3-5.5. Arif, G.M. & Farooq S. 2014. Rural poverty dynamics in Pakistan: evidence from three waves of the
panel survey, The Pakistan Development Review, Volume 53, Number 2, 71-98. 6. Asian Development Bank. 2013. The Social Protec�on Index: Assessing Results for the Asia and
Pacific. Available at: h�ps://www.adb.org/sites/default/files/publica�on/30293/social-protec�on-index.pdf
7. Black R.E., Victora C.G., Walker S.P. & Bhu�a Z.A. 2013. Maternal and Child Undernutri�on and Overweight in Low- and Middle-Income Countries. The Lancet (Maternal and Child Nutri�on) 2013; 371(9600):243-60. Published Online at: h�p://dx.doi.org/10.1016/S0140-6736(13)60937-X
8. Farooq, U. 2015a. Popula�on and Urbaniza�on Projects in Pakistan, Background Chapter in “Vision-2050: Addressing Challenges to Agriculture Sector of Pakistan”. Social Sciences Division, Pakistan Agricultural Research Council, Islamabad, July 2015.
9. FAO & WHO. 1997. Assuring food safety and quality. Guidelines for strengthening na�onal food control systems. FAO Food and Nutri�on paper 76.h�p://www.wpro.who.int/foodsafety/documents/docs/English_Guidelines_Food_control.pdf
10. Food and Agriculture Organiza�on . 2017. Nutri�on & Food Systems. 2017. Commi�ee on World Food Security. Available at: h�p://www.fao.org/3/a-i7846e.pdf
11. Food and Agriculture Organiza�on 2019. HLPE. 2017. Nutri�on and food systems. A report by the High Level Panel of Experts on Food Security and Nutri�on of the Commi�ee on World Food Security, Rome. h�p://www.fao.org/3/a-i7846e.pdf
12. Food and Agriculture Organiza�on 2019. The Future of Food Security. Available at: h�p://www.fao.org/3/ca4289en/CA4289EN.pdf
13. Food and Agriculture Organiza�on 2019. Pakistan Dietary Guidelines for be�er Nutri�on.14. Food and Agriculture Organiza�on 2019. The State Food Security and Nutri�on in the World
(Global SOFI). 15. Food and Agriculture Organiza�on 2019. Strategy for Improved Land Tenancy in Sindh16. Food and Agriculture Organiza�on Publica�on. Considera�ons of Food Safety and Consumer
Protec�on. Available at: h�p://www.fao.org/3/y8705e/y8705e09.htm17. Food and Agriculture Organiza�on and MNFSR. 2019. Food safety manual for food vendors, food
inspectors and stakeholder. Pakistan.18. Food Security Assessment. 2016. Government of Pakistan and World Food Programme19. Gleick P. 2012. The World's Water. Volume 7. The Biennial Report on Freshwater Sources. 20. Government of Pakistan, ILO and UNDP 2015. Social Protec�on in Pakistan: Concept, Situa�on
Analyses and the Way forward.21. Government of Pakistan & World Food Programme.2016. Cost of Diet Analysis. 22. Government of Pakistan.2016. Mul�dimensional Poverty in Pakistan. Joint Report Prepared by
104

Planning Commission of Pakistan, Government of Pakistan, UNDP and Oxford Poverty and Human Development Ini�a�ve.
23. Government of Pakistan. 2016. Household Integrated Economic Survey (HIES), 2015-16Pakistan Bureau of Sta�s�cs. Available at: h�p://www.pbs.gov.pk/content/household-integrated-economic-survey-hies-2015-16
24. Government of Pakistan. 2017. Agriculture Sta�s�cs of Pakistan (various issues) MNFSR. 25. Government of Pakistan. 2018. Pakistan - Demographic And Health Survey 2017-2018.26. Government of Pakistan.2018. Pakistan Economic Survey 2017-18, Economic Advisor's Wing,
Finance Division, Government of Pakistan, Islamabad.27. Government of Pakistan.2019. Pakistan Economic Survey 2018-19, Economic Advisor's Wing,
Finance Division, Government of Pakistan, Islamabad.28. Mosel I & Jackson A. 2013. Sanctuary in the city? Urban displacement and vulnerability in
Peshawar, Pakistan. Available at: h�ps://www.odi.org/publica�ons/7436-sanctuary-city-urban-displacement-and-vulnerability-peshawar-pakistan
29. Na�onal Food Security Policy. 2018. Ministry of Food Security & Research, Government of Pakistan. Available at: h�p://www.mnfsr.gov.pk/mnfsr/userfiles1/file/12 percent20Revised percent20Food percent20Security percent20Policy percent2002 percent20June percent202017.pdf
30. Na�onal Nutri�on Survey. 2018. Government of Pakistan & UNICEF. Available at: h�ps://www.unicef.org/pakistan/na�onal-nutri�on-survey-2018
31. Ngaira, J. K. W. (2004) Basic facts in contemporary climatology. Lake Publishers and Enterprises,Kisumu
32. Oxford Policy Management Ins�tute (OPMI). 2016. BSP Final Impact Evalua�on Report – June 2016
33. Pakistan Ins�tute of Development Economics. 2015. Climate Change Working Papers. 34. Pakistan Social and Living Standards Measurement Survey 2013-14. Pakistan Bureau of Sta�s�cs.
Government of Pakistan. 35. Planning Commission. (2016). Mul�dimensional Poverty in Pakistan, Government of Pakistan 36. Rana M.A. 2014. Commissions and Omissions: Agricultural Produce Markets in Pakistan, Lahore
University of Management Sciences. 37. Save The Children. 2015. The Urban Disadvantage, State of the World's Mothers. 2015. Available
at: h�ps://resourcecentre.savethechildren.net/node/9052/pdf/sowm_2015.pdf 38. Mahendevan R & Hoang V.2015. Is there a link between poverty and food security?” Social
Indicators Research, July 2015. 39. Ruel, M., Alderman H. and Maternal and Child Nutri�on Study Group. 2013. 'Nutri�on-sensi�ve
Interven�ons and Programmes: How Can They Help to Accelerate Progress in Improving Maternal and Child Nutri�on?' – Lancet, 6 June 2013.
40. State Bank of Pakistan. 2019. The state of Pakistan's economy: third quarterly report for the year 2018-19 of the Board of Directors of the State Bank of Pakistan, State Bank of Pakistan, Karachi
41. United Na�on Development Program.2018.Pakistan Human Development Report. Available at: h�ps://www.undp.org/content/dam/pakistan/docs/HDR/PK-NHDR.pdf
42. World Bank. 1998. World Development Report. Available at: h�p://documents.worldbank.org/curated/en/620641468165566752/pdf/71860WDR0ENGLI00Box385391B00PUBLIC0.pdf
43. World Bank. 2006. World Development Report. Available from:
105
PAKISTAN OVERVIEW OF FOOD SECURITY AND NUTRITION 2019

h�p://documents.worldbank.org/curated/en/435331468127174418/World-development-report-2006-equity-and-development.
44. World Health Organiza�on. 2008. Safer Water, Be�er Health: Costs, Benefits and Sustainability of Interven�ons to Protect and Promote Health. Available at: h�p://whqlibdoc.who.int/publica�ons/2008/9789241596435_eng.pdf
45. World Health Organiza�on. 2015. Es�ma�on of the global burden of foodborne diseases. Available at: h�ps://apps.who.int/iris/bitstream/handle/10665/199350/9789241565165_eng.pdf?sequence=1
46. World Health Organiza�on. 2016. Summary report on the expert consulta�on on development of regional plan of ac�on for food safety for Eastern Mediterranean Region 2017-2022. Available at: h�ps://apps.who.int/iris/bitstream/handle/10665/252821/IC_Meet_Rep_2016_19173_EN.pdf?sequence=1&isAllowed=y
47. WHO.2016. Joint External Evalua�on of IHR Core Capaci�es of the Islamic Republic of Pakistan: Available at: h�ps://extranet.who.int/sph/sites/default/files/jeeta/WHO-WHE-CPI-2017.9-eng.pdf
48. World Health Organiza�on. 2017. Joint External Evalua�on of IHR Core Capaci�es of the Islamic Republic of Pakistan. Geneva, Switzerland.
49. WHO & UNICEF. 2017. The Joint Monitoring Programme (JMP) for Water Supply and Sanita�on and Hygiene.
50. World Bank. 2018. Global Logis�cs Performance Index Rankings. Available at: h�ps://lpi.worldbank.org/interna�onal/global/2018
51. World Bank. 2018. When Water Becomes a Hazard - A Diagnos�c Report on The State of Water Supply, Sanita�on and Poverty in Pakistan and Its Impact on Child Stun�ng, WASH Poverty Diagnos�c series Washington, D.C. World Bank Group.
52. World Bank Press Release. 2019. Pakistan's Scarce Water Can Bring More Value to People and Economy. Available at: h�ps://www.worldbank.org/en/news/press-release/2019/02/04/pakistans-scarce-water-can-bring-more-value-to-people-and-economy
106
REFERENCES

ANNEX. METHODOLOGICAL NOTE
PREVALENCE OF UNDERNOURISHMENT (POU)
PoU is an es�mate of the percentage of individuals in the total popula�on that are in a condi�on of undernourishment. To compute it, the probability distribu�on of habitual dietary energy intake levels (expressed in kcal per person per day) for the average individual is modelled as a parametric probability density func�on (pdf), f(x). The indicator is obtained as the cumula�ve probability that the habitual dietary energy intake (x) is below the Minimum Dietary Energy Requirements (MDER) (i.e., the lowest limit of the range of energy requirements for the popula�on's representa�ve average individual that is consistent with an ac�ve and healthy life) as in the formula below:
where θ is a vector of parameters that characterizes the pdf. Typically, the distribu�on is assumed to be lognormal, so that it can be fully characterized by only two parameters: the mean dietary energy consump�on (DEC), and its coefficient of varia�on (CV). Es�ma�ng the PoU therefore requires es�ma�ng three different parameters: MDER, DEC and CV.Minimum dietary energy requirement (MDER): Human energy requirements for an individual in a given sex/age class are determined on the basis of norma�ve requirements for basic metabolic rate (BMR) per kilogram of body mass, mul�plied by the ideal weights that a healthy person of that class may have, given his or her height, and then mul�plied by a coefficient of physical ac�vity level (PAL) to take into account physical ac�vity. Given that both healthy BMIs and PALs vary among ac�ve and healthy individuals of the same sex and age, a range of energy requirements applies to each sex and age group of the popula�on. The MDER for the popula�on as a whole, that is the parameter used in the PoU formula, is obtained as the weighted average of the lower bounds of the energy requirement ranges for each sex and age group, using the shares of the popula�on in each sex and age group as weights.Dietary energy consump�on (DEC): The average, per capita daily dietary energy consump�on in a popula�on can be es�mated either from the total food available for human consump�on, derived from na�onal food supply and u�liza�on accounts used in compiling the so-called na�onal Food balance Sheets (FBS), or from the data on food consump�on as reported in a na�onally representa�ve survey of the popula�on. While, in principle, the es�mates obtained from the two alterna�ve sources for a given popula�on in a given year should converge, they may differ due to different data problems. Typically, es�mates of DEC from FBS tend to be higher than the corresponding es�mates obtained from survey data. Reasons for the discrepancy can be found in the fact that FBS-based es�mates may be overes�mated, failing to properly account for the amount of food wastage that occurs a�er the food has been made available for human consump�on (e.g., during storage, retail distribu�on, including by restaurants, and at the household level) and/or that reported food consump�on in surveys may be incomplete, due to failure to capture all sources of food consump�on by all household members (e.g., food consumed away from home, at work or at school, or received by charitable ins�tu�ons).Coefficient of Varia�on (CV): The variability in the distribu�on of habitual, daily per capita DEC, is the most difficult parameter to es�mate for two reasons. First, when food consump�on data are only available at the household level, the observed variability across households will largely underes�mate the variability due to differences in sex, age, body mass, physiological status (e.g., sickness, pregnancy, lacta�on, etc.) and physical ac�vity levels in the popula�on. Second, the average consump�on measured from survey data, be it at the household or at the individual level, is notoriously affected by non-
107

negligible measurement errors. While these errors may not be relevant to es�mate the average DEC in the popula�on, they will almost certainly inflate es�mates of the variance of DEC across individuals, as the variance of measurement errors will add to the variance of true DEC. To reduce the impact of measurement errors on es�mates of the CV, the variance of DEC for the average individual in the popula�on is decomposed into two components, and the two components (which are assumed to be independent from each other) are es�mated separately.
The first component, CV|r, reflects varia�on in DEC due to differences in sex, age, body mass, physiological status and physical ac�vity levels in the popula�on. As these are essen�ally the same factors that determine the variability in dietary energy requirements, the CV|r is es�mated from the same informa�on used to es�mate the MDER. The second component, CV|y-, represents the varia�on in DEC resul�ng from differences in access to food induced by socio-economic characteris�cs of individuals and households, geographic loca�on, and other relevant factors that are independent from the sex-age, body mass and physical ac�vity levels of the households' members. .In es�ma�ng CV|y from household survey data, one needs to control for the variability induced by seasonality and by measurement error. This is achieved by referring to the mean and standard devia�on of the predicted values of the seasonality adjusted DEC obtained from a regression like the following one :h
where 'h' refers to the household; DEC is the daily dietary energy consump�on per capita in household h; Income is seasonality adjusted in household h; region and province is a set of dummy variables indica�ng the region or province in which the household h is located.Trend analysis of the PoU in Pakistan based on different rounds of HIES.
In this report, we compute all parameters needed to es�mate the PoU using, to the maximum possible extent, microdata from different rounds of the Pakistan Household Integrated Economics Survey (HIES), integra�ng them from other sources whenever needed, as detailed below. Ÿ The informa�on on the popula�on level and its structure by sex and age in each period, needed to
es�mate both the MDER and the CV|r is obtained from the respec�ve rounds of the HIES, for all of which the sampling design was based on popula�on data from the fi�h Census of the Popula�on, conducted in 1998.
Ÿ As HIES do not convey anthropometric informa�on, the median height in each sex and age group needed to es�mate the MDER and the CV|r is derived from a Demographic and Health Survey (DHS) conducted in 2012-13.
Ÿ Several improvements have been introduced in the food consump�on module of HIES 2015-16, compared to earlier rounds, that make the es�mates of DEC not directly comparable across surveys. For example, a more detailed food consump�on module is included in 2015/16 to be�er capture the food consumed when away from home (FAFH) which is likely to have an impact on the es�mated DEC. In fact, the na�onal average daily DEC obtained from the 2015/16 round (1998 kcal) is slightly higher than the one from previous rounds (e.g.: 1929 in 2013/14, 1924 in 1984 in 2011/12). This can hardly be explained only by an actual increase in the households food consump�on, and may be a consequence of the improvement in the measurement of FAFH.
Assuming that the FAFH component would be underreported in rounds of the HIES previous to 2015/16,
108
PAKISTAN OVERVIEW OF FOOD SECURITY AND NUTRITION 2019

we adjusted the average DEC for earlier surveys as follows:In a first step, the contribu�on of FAFH to food consump�on as captured in the HIES data of 2015/16 is modelled as a func�on of household characteris�cs
- The es�mated regression parameters are used to predict the FAFH consump�on for each household in the previous rounds of HIESs and adjus�ng the incomes of each previous survey for infla�on using the series of consumer price index (CPI) published by PBS.- The predicted value FAFHh is added to the DEC of each household in each previous rounds of
HIESsEven a�er such adjustment, the na�onal average DEC obtained from the surveys appears to s�ll be possibly underes�mated. For example, the DEC es�mated from various rounds of HIESs is lower than DEC computed using the Food Balance Sheet (FBS) data compiled by FAO and based on data provided by the Ministry Food Security and Nutri�on, by about 300 kcal/per capita or more. One convincing explana�on for the discrepancy can be found in the relevance that consump�on of food received for free, at work, at school, or at charitable ins�tu�on has in Pakistan, but that does not get captured in the survey data. Par�cularly relevant is the food consumed by visitors at sufi shrines present in many parts of the country (see: h�p://www.ipsnews.net/2018/11/sufi-shrines-public-private-partnership-improve-food-security-nutri�on/ )Given the persis�ng uncertainty regarding the level of average DEC, two series of PoU are presented in the report: the first one deriving all informa�on from the surveys, the second one reflec�ng the es�mates produced by FAO Sta�s�cs to inform the annual report on The State of Food Security and Nutri�on in the world in 2019.
Pending further inquiries on the discrepancy between food consump�on accounted for in surveys and apparent food consump�on es�mated from FBS, a safe conclusion is that the true PoU in Pakistan in 2015-17 may lie around 20 percent in Pakistan.
Prevalence of moderate or severe food insecurity, based on the Food Insecurity Experience Scale (FIES)The official SDG indicator 2.1.2 is defined as the “prevalence of moderate and severe food insecurity in the popula�on based on the FIES” and is used, together with the PoU, to monitor progress towards target 2.1 of the Sustainable Development Goals. Food insecurity as captured by this indicator refers to limited access to food, at the level of households, due to lack of money or other resources. The severity of food insecurity is measured using data collected with the Food Insecurity Experience Scale (FIES) survey module, which is a set of eight ques�ons asking members of the households to self-report condi�ons and experiences typically associated with limited access to food. Using sophis�cated sta�s�cal techniques based on the Rasch measurement model, the informa�on obtained in a survey is validated for internal consistency and used to produce quan�ta�ve measures along a scale of increasing severity. Based on their responses to the FIES items and two conven�onal, globally set severity levels used as thresholds, households are assigned a probability to be in one of three classes: food secure or only marginally insecure; moderately food insecure; and severely food insecure.
109
ANNEX. METHODOLOGICAL NOTE

SDG Indicator 2.1.2 is obtained as the cumulated probability to be in the two classes of moderate and severe food insecurity. A separate indicator (FIsev) is computed by considering only the severe food insecurity class.Methodology: The data consis�ng of yes/no responses to the FIES ques�ons are validated and used to construct a scale of food-insecurity severity using the Rasch model (Rasch, 1960; Bond and Fox, 2015; Nord, 2016). The model postulates that the probability of observing an affirma�ve answer by respondent i to ques�on j is a logis�c func�on of the distance, between the posi�on of the respondent, ai, and that of the item, bj, on an underlying scale of severity:
By applying the Rasch model to the FIES data, it is possible to es�mate the probability of being food insecure (Pi,L) at any given level of severity of food insecurity L, with 0 < Pi,L < 1, for each respondent i. Given a representa�ve sample of N respondents, the prevalence of food insecurity in a popula�on is then computed as the weighted sum of the probability of being severely food insecure for all households in a sample:
where wi are popula�on weights that indicate the propor�on of individuals in the na�onal popula�on represented by each household in the sample. To produce cross-country comparable es�mates, FAO established a global reference scale and set two thresholds that separate “mild” from “moderate”, and “moderate” from severe levels of food insecurity. (Cafiero et al., 2016). As es�mates of the Rasch model parameters obtained from a given dataset are defined on a local scale, before a procedure for calibra�ng them against the FIES global standard, and vice versa, referred to as equa�ng, is needed to make sure that the globally set thresholds are used when the objec�ve is to es�mate the SDG indicator.In prac�ce, the analysis of FIES data involves the following steps: Ÿ Parameter es�ma�on: calcula�on of the severity of food insecurity associated with each FIES ques�on
and each household.Ÿ Sta�s�cal valida�on: The assessment of whether, depending on the quality of the data collected, the
measure is valid. Calcula�on of measures of food insecurity: For each household, the probability of the household experiencing food insecurity above, a given level of severity is calculated, based on their responses to the FIES ques�ons. The probabili�es are used to es�mate the prevalence of food insecurity at moderate and severe levels in the popula�on.ReferencesRasch, G., 1960, Probabilis�c model for some intelligence and achievement tests. Copenhagen: Danish Ins�tute for Educa�onal Research.Bond T. and Fox, C., 2015, Applying the Rasch model. Fundamental measurement in the human sciences. 3rd ed., Routledge, London.Nord, M. 2014. “Introduc�on to Item Response Theory applied to Food Security Measurement: Basic Concepts, Parameters, and Sta�s�cs”. Technical Paper, FAO, Rome (available at h�p://www.fao.org/3/a-i3946e.pdf). Cafiero, C., Viviani, S. and Nord, M., 2018, “Food security measurement in a global context: The food insecurity experience scale”, Measurement 116:146–152.
110
PAKISTAN OVERVIEW OF FOOD SECURITY AND NUTRITION 2019


IMPROVING ACCESSTO FOOD
PAKISTANOVERVIEW OF
FOOD SECURITYAND NUTRITION
The report Pakistan Overview of Food Security and Nutri�on is the combined effort of four UN agencies and the Government of Pakistan to present the overall picture of where Pakistan stands in the efforts to eliminate hunger and malnutri�on. The special theme of this first Pakistan Overview of Food Security and Nutri�on report is 'Improving Access to Food'. It is the first country level report on the lines of UN's Global and Regional Reports on State of Food Security and Nutri�on in the World. FAO, WFP, WHO, UNICEF, the Ministry of Na�onal Food Security and Research (MNFSR), the Pakistan Bureau of Sta�s�cs (PBS), the Ministry of Planning, Development and Reform (MPDR) and Ministry of Na�onal Health Services, Regula�on and Coordina�on (MNHSRC) have collaborated to produce it with the coopera�on of provincial governments and many other stakeholders.
Regular monitoring of Pakistan's food security and nutri�on situa�on can support be�er policy and programme design. This report would help the government to assess and monitor the progress on food security and nutri�on situa�on. Using the na�onal data, the report provides an overview of where we are today in terms of the sta�s�cs and challenges in measuring and eradica�ng food insecurity and malnutri�on. It needs to be seen as first report to iden�fy the areas for which more data/analysis is needed to be able to understand the true situa�on of food insecurity and its linkages with poverty and malnutri�on. The report also points to the areas where more informa�on is required to be�er understand the rela�onship between food insecurity and poverty, and food insecurity and malnutri�on.
2019