pakistan market: 2007-2008 - akd securitiesakdsecurities.net/downloads/pakistan market...
TRANSCRIPT

Copyr ight©2007 AKD Securities Limited. All rights reserved. The information provided on this document is not intendedfor distribution to, or use by, any person or entity in any jur isdiction or country where such dis tr ibution or use wouldbe contrary to law or regulation or which would subject AKD Secur ities or its affi liates to any regis tration requirementwithin such jurisdiction or country. Neither the information, nor any opinion contained in this document constitutes asolicitation or offer by AKD Securities or its affiliates to buy or sell any securities or provide any investment advice or service.AKD Securities does not warrant the accuracy of the information provided herein.
Pakistan Market: 2007-2008
AKD SECURITIESMember: Karachi Stock Exchange
Find AKD research on Bloomberg(AKDS<GO>), firs tcall.com and Reuters Knowledge
w w w .akd s ec u ri t i es . n et
Equity Research / Pakistan January 2008
AKD Research [email protected]
Priced on January 04, 2008
KSE-100 Index
14,259.60
KSE Market Cap
PkR4,352.89bn (US$69,982mn)
KSE-100 Mkt Cap as % of Total Mkt Cap.
86%
1 Year KSE-100 High/Low
14,814/10,040
12m KSE-100 Avg. Traded Value
PkR26,268mn (US$406.25mn)
KSE-30 Mkt Cap. as % of Total Mkt Cap.
17%
YTD KSE-30 High/Low
18,083/11,301
AKD Universe
71% of KSE-100 Market Cap.
AKD Research's take on the Numbers2008 has begun with clouds of political uncertainty hanging on the Pakistanstock market. With the political risk premium having risen after the ghastlyassassination of Benazir Bhutto the shocked nation is groping for hope.Announcement of election date as February 18, 2008 and a mature stance byPPP's new leadership as well as PML(N) to participate in the elections haveprovided investors a degree of comfort regarding the transition to a democraticallyelected government. Yet, investors remain cautious keeping in mind that there's"many a slip betwixt the cup and the lips".
The Central Bank’s latest quarterly review (for quarter ended Sep 2007) indicates thatpolitical uncertainty has created a drag on the economy and this was before BB'sassassination and consequent law & order crisis. While the law & order situation hasbeen brought under control, investors will be keeping a wary eye on the political sceneleading up to the election in six week's time. As such, 1QCY2008 is expected towitness high market volatility driven by news flow from the political front. That said,our oft repeated point regarding stronger market resilience than in the past was againdemonstrated last week when the KSE-100 Index staged a smart recovery in thesecond half of the week and closed 4% down from its most recent peak. In the firsthalf of the week the Index had been down 10% from its peak.
By most valuation measures the Pakistan market is arguably the cheapest in theAsian (ex Japan) region. The question investors have to address is whether thePakistan market could be a value trap in 2008 if longer term political risk premiumhas significantly increased? That risk cannot be discounted at this point. However,we need to keep in mind that much more is at stake in Pakistan than merely the stockmarket. The geo-political dynamic of this region has meant that what happens inPakistan is not simply a domestic issue. It has significant regional and global implications.That is why we believe the powers that be - both internal and external, are likely toleave no stone unturned to focus on: (i) medium term socio-political stability; (ii) anew concerted and sustained campaign against terrorism & extremism post theelections; (iii) ensuring sufficient economic growth to keep the domestic politicalconstituencies aligned to the first two objectives. In the above context, we believe thatless risk averse investors will likely find significant potential for outperformance inPakistan in 2008.
In this report we have focused primarily on numbers. Both fundamental sectorand company performance in 2007 and forecasts for 2008 are provided, as wellas market and valuation data. We believe that this comprehensive databank ofAKD covered universe should prove useful for investors as they mull over theirnear term and longer term investment exposure to Pakistan. .
AKD Universe - Valuation MultiplesFY07A/F FY08F FY09F
EPS (%) 0.66 20.44 11.23
PER (x) 12 .7 10.5 9.5P/BVS (x) 3.08 2.64 2.29Dividend Yield (%) 4 .4 4.9 5.5
ROE (%) 24.25 25.02 24.1
KSE-100 Index
9,500
10,600
11,700
12,800
13,900
15,000
Dec-06 Apr-07 Jun-07 Sep-07 Jan-08
Index
-
100
200
300
400
500
600
Shares (mn)
Volume(mn) KSE-100 Index Readers are recommended to also keep in mind risk factors (pleasesee page 63) when investing in equities.
02
AKD Securities LimitedJanuary 2008 Pakistan Market: 2007 - 2008
Please see important disclosures and disclaimerson the last page of this report.
Analyst Tel no. E-mail CoverageFaiza Naeem (9221) 111 253 111 faiza.naeem@akdsecuri ties.net Telecom, Fert ilizer, Autos & Paper & Board
Naveed Vakil (9221) 111 253 111 naveed.vakil@akdsecuri ties.net E&P, Oil & Gas MarketingUmer Pervez (9221) 111 253 111 umer.pervez@akdsecuri ties.net Power, Insurance, Chemical & Texti les
Raza Jafri (9221) 111 253 111 raza.jafri@akdsecuri ties.net Commercial BanksFurqan Ayub (9221) 111 253 111 furqan.ayub@akdsecuri ties.net CementQas im Anwar (9221) 111 253 111 qas im.anwar@akdsecuri ties.net Technical Analyst
Rizwan Ahmed (9221) 586 9314 rizwan.ahmed@akdsecuri ties.net Research OperationsAbdul Wadood (9221) 111 253 111 abdul .wadood@akdsecuri ties.net Research Production
Hassan Quadri (9221) 111 253 111 hassan.quadri@akdsecuri ties.net Research Production
AKD Research Team

AKD Universe: Growth vs Value Ranking
Source: AKD Research
03
AKD Securities LimitedJanuary 2008 Pakistan Market: 2007 - 2008
Priced on January 04, 2008
PER (x) P/BVS (x) Div Yield PB/ROE PEG RatioSymbol 2009F Symbol 2008F Symbol 2008F Symbol 2008F Symbol 2009GADT 4.2 GADT 0.50 FFC 11% HCAR 2.1 MLCF 0.0FCCL 5.7 NML 0.52 AGTL 10% NESTLE 2.6 CHCC 0.1ACPL 6.0 DGKC 0.68 MLCF 10% PKGS 4.8 SHEL 0.2PSMC 6.4 MLCF 0.81 KAPCO 10% ENGRO 5.2 GADT 0.3PIOC 6.4 HUBC 1.25 FFBL 10% ULEVER 5.9 FCCL 0.3MTL 6.4 FCCL 1.32 HUBC 9% AICL 6.3 ACPL 0.3MLCF 6.9 CHCC 1.52 PIOC 8% MCB 6.7 PICT 0.3AGTL 7.0 PSMC 1.53 OGDC 8% DGKC 7.2 HBL 0.4CHCC 7.0 MTL 1.64 PTC 7% PTC 7.7 BAFL 0.4INDU 7.1 PIOC 1.78 MTL 6% ICI 8.0 UBL 0.5AKBL 7.6 ACPL 1.85 ULEVER 6% PICT 8.1 PSMC 0.5NML 7.8 LUCK 1.93 INDU 6% HUBC 8.3 DGKC 0.6BAFL 7.9 PTC 1.94 ACPL 6% LUCK 8.5 FFBL 0.6PPL 8.4 SNGP 1.98 SNGP 5% SHEL 8.5 PPL 0.6HBL 8.4 AKBL 2.01 PSO 5% UBL 8.6 SNGP 0.6KAPCO 8.6 HCAR 2.09 SHEL 5% THALL 9.3 OGDC 0.6OGDC 8.6 BAFL 2.10 PPL 5% SNGP 9.4 AGTL 0.7LUCK 9.0 SHEL 2.15 ICI 4% BAFL 9.9 INDU 0.7PICT 9.2 ICI 2.18 GADT 4% MLCF 10.0 LUCK 0.7FFC 9.3 KAPCO 2.28 BAFL 4% PSO 10.1 AKBL 0.7DGKC 9.6 THALL 2.37 THALL 4% OGDC 10.1 NML 0.8SNGP 9.8 INDU 2.42 UBL 3% FFBL 10.3 ICI 0.9THALL 10.0 PKGS 2.61 FCCL 3% HBL 10.3 PSO 0.9UBL 10.5 ENGRO 2.63 PICT 3% NML 10.4 NESTLE 1.1FFBL 10.7 AGTL 2.70 NML 3% PPL 10.5 HUBC 1.1SHEL 10.7 HBL 2.79 CHCC 2% AKBL 10.8 THALL 1.2HUBC 11.2 PICT 2.82 PKGS 2% CHCC 10.9 MCB 1.2ICI 11.4 PSO 3.18 MCB 2% FFC 11.1 ULEVER 1.3PSO 12.3 UBL 3.41 NESTLE 2% KAPCO 11.3 FFC 1.4PTC 12.8 PPL 3.65 DGKC 2% PIOC 12.3 PKGS 1.5MCB 13.6 AICL 3.94 AKBL 2% PSMC 12.8 MTL 1.5AICL 14.0 FFBL 4.09 ENGRO 2% INDU 12.8 PTC 3.9ULEVER 14.4 FFC 4.23 HBL 2% AGTL 13.3 KAPCO 5.6PKGS 18.0 OGDC 4.49 AICL 1% ACPL 13.8 ENGRO 6.8ENGRO 18.1 MCB 5.05 LUCK 1% MTL 14.7 AICL n.mNESTLE 27.0 ULEVER 15.23 HCAR 0% FCCL 15.0 PIOC n.mHCAR 29.2 NESTLE 20.62 PSMC 0% GADT 20.4 HCAR n.m
AKD Securities LimitedJanuary 2008 Pakistan Market: 2007 - 2008
04
10,000
11,000
12,000
13,000
14,000
15,000
16,000
Moody's upgradesPakistan Outlook
Rumors of anextension incapital gainstax
ABN Amro - Primedeal news flow
PresidentialReference againstthe Chief Justice
SECP and KSE agree onbonus and rights with
execution of CLN system
SECP not to take punitiveaction against brokers forthe Mar05 s tock market
meltdown
PM states thatconstitutional
provisions do not barthe imposition of
emergency
Riots disrupt Karachiamid clashes on arrival
of the CJ
Gen. Musharraf steps down from COAS
Nawas Sharif returns to Pakistan
Elections areannounced
State ofEmergencydeclared
Gen. Kiyaniappointed as
VCOAS
Singtel deal withWarid in the
making
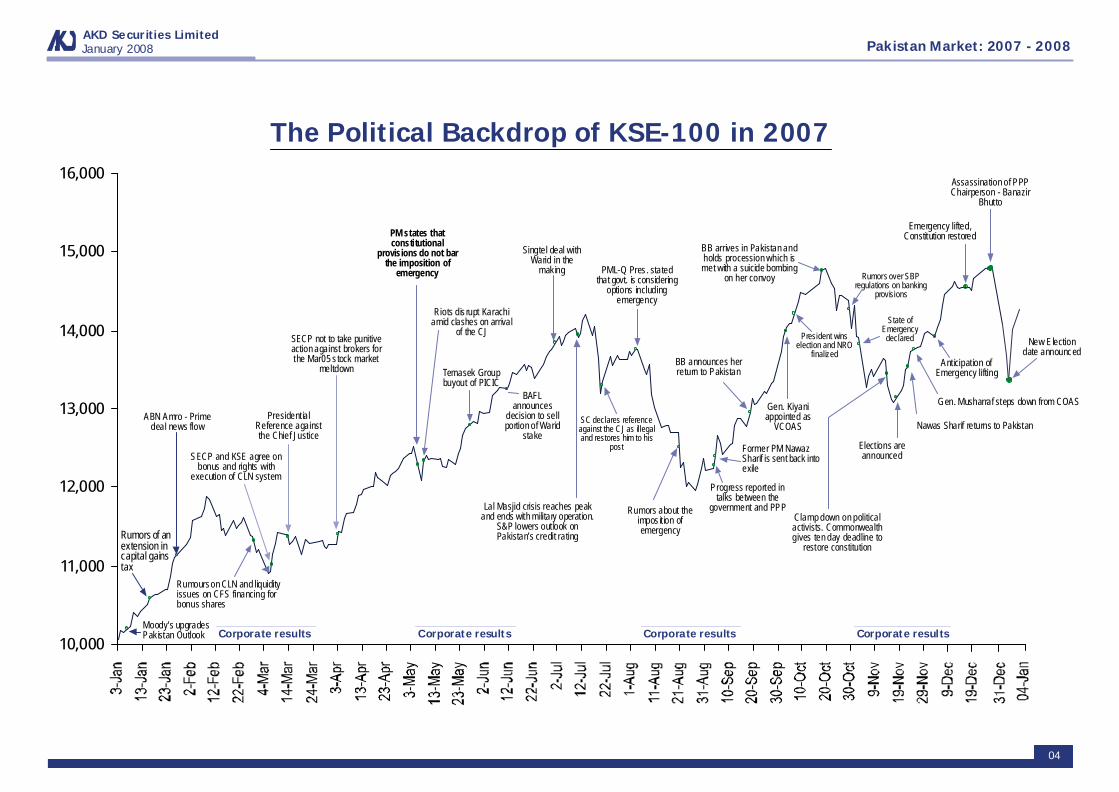
The Political Backdrop of KSE-100 in 2007
Temasek Groupbuyout of PICIC
BAFLannounces
decision to sellportion of Warid
stake
Lal Masjid crisis reaches peakand ends with military operation.
S&P lowers outlook onPakistan’s credit rating
SC declares referenceagainst the CJ as illegaland restores him to his
post
PML-Q Pres. statedthat govt. is considering
options includingemergency
Rumors about theimposit ion ofemergency
Progress reported intalks between the
government and PPP
Former PM NawazSharif is sent back intoexile
BB announces herreturn to Pakistan
President winselection and NRO
finalized
BB arrives in Pakistan andholds procession which ismet with a suicide bombing
on her convoy Rumors over SBPregulations on banking
provisions
Clamp down on politicalactivists. Commonwealthgives ten day deadline to
restore constitution
Emergency lifted,Constitution restored
Anticipation ofEmergency lifting
Corporate results Corporate resultsCorporate resultsCorporate results
Rumours on CLN and liquidityissues on CFS financing forbonus shares
Assassination of PPPChairperson - Banazir
Bhutto
New Electiondate announced
05
AKD Securities LimitedJanuary 2008 Pakistan Market: 2007 - 2008
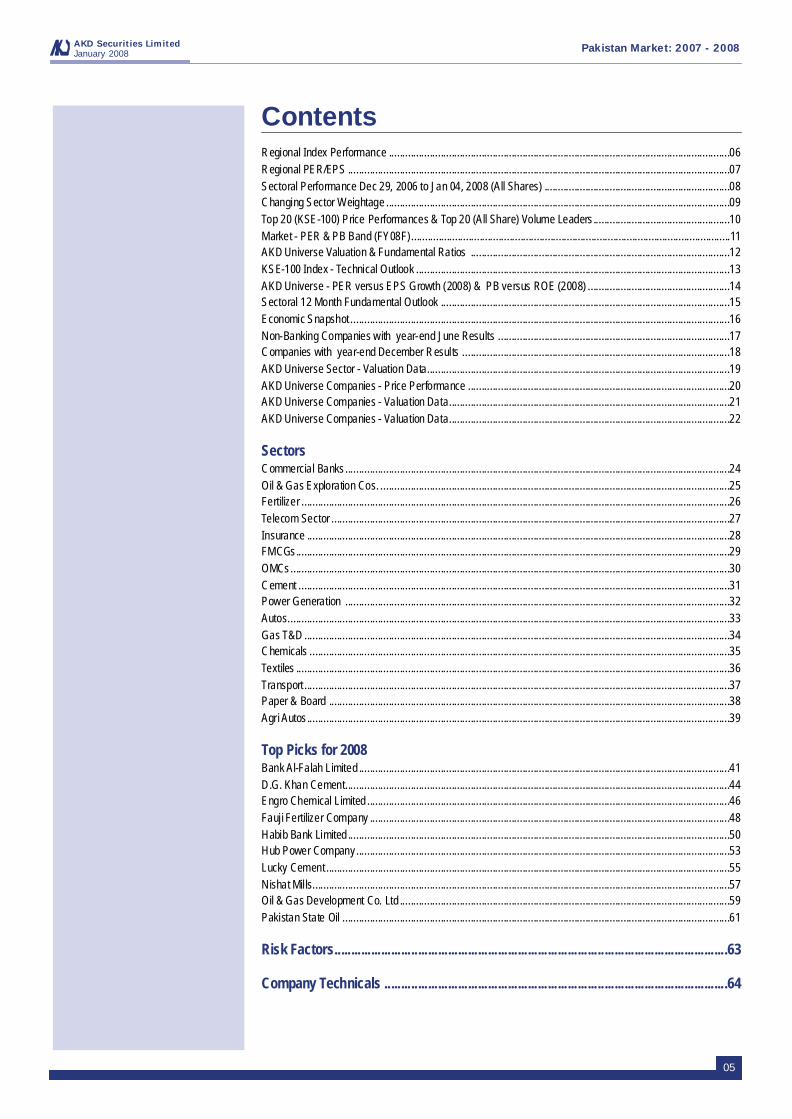
ContentsRegional Index Performance .............................................................................................................................06Regional PER/EPS ............................................................................................................................................07Sectoral Performance Dec 29, 2006 to Jan 04, 2008 (All Shares) ....................................................................08Changing Sector Weightage ..............................................................................................................................09Top 20 (KSE-100) Price Performances & Top 20 (All Share) Volume Leaders..................................................10Market - PER & PB Band (FY08F).....................................................................................................................11AKD Universe Valuation & Fundamental Ratios ...............................................................................................12KSE-100 Index - Technical Outlook ...................................................................................................................13AKD Universe - PER versus EPS Growth (2008) & PB versus ROE (2008) ....................................................14Sectoral 12 Month Fundamental Outlook ..........................................................................................................15Economic Snapshot ...........................................................................................................................................16Non-Banking Companies with year-end June Results .....................................................................................17Companies with year-end December Results ..................................................................................................18AKD Universe Sector - Valuation Data...............................................................................................................19AKD Universe Companies - Price Performance ................................................................................................20AKD Universe Companies - Valuation Data.......................................................................................................21AKD Universe Companies - Valuation Data.......................................................................................................22
SectorsCommercial Banks.............................................................................................................................................24Oil & Gas Exploration Cos. ................................................................................................................................25Fertilizer .............................................................................................................................................................26Telecom Sector ..................................................................................................................................................27Insurance ...........................................................................................................................................................28FMCGs...............................................................................................................................................................29OMCs.................................................................................................................................................................30Cement ..............................................................................................................................................................31Power Generation .............................................................................................................................................32Autos..................................................................................................................................................................33Gas T&D ............................................................................................................................................................34Chemicals ..........................................................................................................................................................35Textiles ...............................................................................................................................................................36Transport ............................................................................................................................................................37Paper & Board ...................................................................................................................................................38Agri Autos...........................................................................................................................................................39
Top Picks for 2008Bank Al-Falah Limited ........................................................................................................................................41D.G. Khan Cement.............................................................................................................................................44Engro Chemical Limited .....................................................................................................................................46Fauji Fertilizer Company ....................................................................................................................................48Habib Bank Limited ............................................................................................................................................50Hub Power Company.........................................................................................................................................53Lucky Cement ....................................................................................................................................................55Nishat Mil ls.........................................................................................................................................................57Oil & Gas Development Co. Ltd .........................................................................................................................59Pakistan State Oil ..............................................................................................................................................61
Risk Factors......................................................................................................................63
Company Technicals .......................................................................................................64

06
AKD Securities LimitedJanuary 2008 Pakistan Market: 2007 - 2008
Regional Markets’ Performance
Regional Valuations
PBV ROE (%) DY (%)2008 2009 2008 2009 2008 2008 2008
Pakistan 10.55 9.48 20.44 11.23 2.6 25.0 4.9
Thailand 10.90 10.20 18.10 7.30 1.9 17.3 3.9Singapore 14.80 12.90 3.90 14.70 2.1 14.1 3.5Malaysia 16.00 14.40 7.20 11.90 2.4 14.7 3.7Indonesia 16.10 13.90 11.90 16.00 4.3 26.8 2.7
China 19.00 16.20 21.90 17.20 3.4 18.0 1.9Hong Kong 20.90 17.90 (8.30) 16.60 2.2 10.3 2.6India 22.20 17.80 21.10 23.50 4.1 18.6 1.0
Source: Datastream & AKD Research
Source: Datastream
2002-2007 2003 2004 2005 2006 2007 2008Return YTD*
Indonesia (JKSE) 546% 63% 45% 16% 55% 52% 0.7%
India (SENSEX) 501% 73% 13% 42% 47% 47% 2.0%
Pakistan (KSE-100) 421% 66% 39% 54% 5% 40% 1.3%
Vietnam Index (VNINDEX) 406% -9% 43% 29% 143% 23% -2.6%
Philippines (PSEi) 255% 42% 26% 15% 42% 21% -3.8%
Sri Lanka (CSEALL) 214% 30% 42% 28% 42% -6% -2.1%
Thailand (SET) 136% 110% -13% 7% -5% 26% -4.2%
Malaysia (KLSE) 124% 23% 14% -1% 22% 32% 1.5%
NIKKEI 225 JAPAN 78% 24% 8% 40% 7% -11% -4.0%
S&P 500 (U.S) 67% 26% 9% 3% 14% 4% -3.9%
FTSE (U.K) 64% 14% 8% 17% 11% 4% -1.7%
*From Dec 31, 2007 to Jan 04, 2008
Priced on Dec 31, 2007 except Pakistan which is on Jan 04, 2008
PER EPS Growth

07
AKD Securities LimitedJanuary 2008 Pakistan Market: 2007 - 2008
Regional PER/EPS
Source: Datastream
Regional P/B and ROE
6.00
8.00
10.00
12.00
14.00
16.00
18.00
20.00
22.00
24.00
6.00 8.00 10.00 12.00 14.00 16.00 18.00 20.00 22.00
PER08
EPS Growth08
IndonesiaMalaysia Philippines
India
Pakistan
Thailand
1.00
2.00
3.00
4.00
5.00
14.00 16.00 18.00 20.00 22.00 24.00 26.00 28.00
PBV2008
ROE 2008
Indonesia
Malaysia
Philippines
India
Pakistan
Thailand
Source: Datastream

08
AKD Securities LimitedJanuary 2008 Pakistan Market: 2007 - 2008
Sectoral Performance Dec 29, 2006 to Jan 04, 2008 (All Share)
Source: AKD Research
*New companies listed in 2007 are not included in the performance which are BPGF, POAF, ARM, AHL, JSIL, PASL, HBL, SCBPL, HIRAT,
FLYNG, DSL, SPL & PACE.
( ) Numbers in parenthesis indicate number of companies l isted in the sector.
-31%
-17%
1%
5%
7%
8%
13%
15%
21%
22%
26%
27%
28%
38%
41%
42%
45%
45%
47%
47%
49%
50%
57%
58%
63%
67%
70%
70%
83%
97%
98%
125%
138%
150%
312%
197%
-50% 0% 50% 100% 150% 200% 250% 300% 350%
Textile Weaving (18)
Leasing (19)
Telco & Tech. (9)
Closed-&-Mutual Funds (24)
Sugar & Allied (37)
Oil & Gas Exploration (4)
Textile Spinning (108)
Modarabas (35)
Power G&D (13)
Synthetic (19)
Oil & Gas Marketing (6)
Glass & Ceramics (10)
Vanaspati (12)
Miscellaneous (28)
Fertilizer (4)
Kse-100 Index
Transport (6)
Auto Assembler (12)
Pharmaceuticals (8)
Cement (21)
All Share Index
Textile Composite (59)
Cable & Elect, (9)
Auto Parts (12)
Tobacco (3)
Chemicals (24)
Banking (25)
Food & Allied (22)
Paper & Board (10)
Refining (4)
Engineering (14)
Jute (6)
Investment Banks (26)
Insurance (38)
Woolen (5)
Leather (5)

09
AKD Securities LimitedJanuary 2008 Pakistan Market: 2007 - 2008
Changing Sector Weightage
SECTOR NAME Dec-07 Dec-06 Dec-05 Dec-04 Dec-03
COMMERCIAL BANKS* 33.32 25.06 15.97 9.79 9.30
OIL & GAS EXPLORATION COMPANIES 21.03 29.24 30.50 25.73 3.97
FERTILIZER 4.96 5.30 6.27 7.45 7.67
OIL & GAS MARKETING COMPANIES 4.72 5.62 6.75 8.20 12.12
TELECOM & TECHNOLOGY 4.54 6.85 10.54 12.15 22.13
INSURANCE 4.00 1.93 1.05 1.15 1.62
INVESTMENT BANKS/COS./SECURITIES 3.95 2.14 1.83 2.24 1.01
FOOD & PERSONAL CARE-PRUDUCTS 3.89 3.31 2.78 3.64 5.41
CEMENT 3.19 3.18 4.32 3.95 3.88
POWER GENERATION & DISTRIBUTION 2.65 3.47 3.96 4.26 7.93
AUTOMOBILE ASSEMBLER 2.10 2.49 2.14 2.55 3.69
TOBACCO 1.78 1.65 1.47 2.24 1.58
REFINING 1.70 1.30 2.08 2.24 1.76
PHARMACEUTICALS 1.45 1.47 1.51 2.08 2.39
CHEMICALS 1.35 1.39 1.81 3.14 4.80
TRANSPORT 0.87 0.91 1.41 1.68 1.60
TEXTILE COMPOSITE 0.81 0.80 1.55 1.53 1.24
PAPER & BOARD 0.71 0.59 0.83 1.11 1.49
SYNTHETIC & RAYON 0.57 0.76 0.93 1.96 2.54
CABLE & ELECTRICAL GOODS 0.55 0.34 0.29 0.33 0.37
MISCELLANEOUS 0.49 0.68 0.40 0.56 1.24
ENGINEERING 0.29 0.25 0.29 0.41 0.17
JUTE 0.23 0.16 0.11 0.11 0.17
CLOSED-END-MUTUAL FUNDS 0.22 0.49 0.62 0.48 0.71
GLASS & CERAMICS 0.18 0.22 0.09 0.16 0.11
LEATHER & TANNERIES 0.10 0.04 0.03 0.04 0.04
AUTOMOBILE PARTS & ACCESSORIES 0.07 0.06 0.09 0.18 0.29
TEXTILE SPINNING 0.07 0.06 0.08 0.15 0.10
SUGAR & ALLIED INDUSTRIES 0.07 0.09 0.09 0.12 0.10
LEASING COMPANIES 0.05 0.07 0.09 0.14 0.24
MODARABAS 0.02 0.05 0.04 0.08 0.17
TEXTILE WEAVING 0.02 0.04 0.06 0.11 0.11
WOOLEN 0.01 0.01 0.01 0.01 0.04
VANASPATI & ALLIED INDUSTRIES 0.01 0.01 0.01 0.01 0.01
Total 100.00 100.00 100.00 100.00 100.00Source: AKD Research* excluding Standard Chartered Bank Pakistan Ltd., banking sector weight in Dec 07 would be approx. 29%

10
AKD Securities LimitedJanuary 2008 Pakistan Market: 2007 - 2008
Top 20 (KSE-100) Price Performance
Top 20 (All Share) Volume Leaders
S.# Company Symbol 1Year Chg. 3M Chg.
1 Jahangir Siddiqui & Company JSCL 1,231% 126%2 Bata (Pakistan) BATA 292% 28%3 Pakistan Reinsurance PAKRI 288% -2%4 Attock Refinery ATRL 278% 21%5 EFU General Insurance EFUG 254% 45%6 Thal Limited THALL 197% 22%7 New Jubilee Insurance NJICL 197% 10%8 Rafhan Maize Products RMPL 161% 27%9 P.N.S.C. PNSC 145% 5%10 Arif Habib Securities AHSL 138% 23%11 Mari Gas MARI 124% 8%12 Adamjee Insurance AICL 118% -10%13 Bannu Woollen BNWM 116% 33%14 Azgard Nine Limited ANL 110% 10%15 Lucky Cement LUCK 105% -14%
16 Pakistan Tobacco PAKT 102% -4%17 Meezan Bank MEBL 98% 8%18 Attock petroleum APL 82% 19%19 Atlas Honda ATLH 82% 42%20 Packages Ltd PKGS 80% 0%
Source: KSE & AKD Research
Source: KSE & AKD Research
S.# Company Symbol 1Yr Avg Daily % of Total 1Yr Avg Value (US$mn) Market AD Value Volume (mn)
1 National Bank of Pakistan NBP 40.98 10.1% 10.242 Oil & Gas Development Co. Ltd. OGDC 33.32 8.2% 16.763 Pakistan Petroleum Limited PPL 29.41 7.2% 7.494 Pak Oilfields POL 26.67 6.5% 4.85
5 MCB Bank MCB 22.81 5.6% 4.586 Lucky Cement LUCK 20.65 5.1% 11.477 DG Khan Cement DGKC 18.79 4.6% 11.478 Arif Habib Securities AHSL 17.93 4.4% 7.429 Bank of Punjab BOP 16.19 4.0% 10.6610 Engro Chemical ENGRO 15.78 3.9% 4.0911 Pakistan State Oil PSO 13.71 3.4% 2.2412 Adamjee Insurance AICL 12.65 3.1% 2.6813 Askari Bank Limited AKBL 10.28 2.5% 6.6914 Habib Bank Limited HBL 9.78 2.4% 2.19
15 J.O.V. & Company Ltd. JOVC 9.24 2.3% 4.4016 Attock Refinery ATRL 8.24 2.0% 2.6017 Nishat Mills NML 8.19 2.0% 4.2818 Bank Al-Falah BAFL 7.67 1.9% 9.1919 Fauji Fertilizer Bin Qasim FFBL 7.02 1.7% 11.1020 PTCL (A) PTC 6.65 1.6% 7.69

11
AKD Securities LimitedJanuary 2008 Pakistan Market: 2007 - 2008
AKD Universe - PER Band (FY08F)
Source: KSE & AKD Research
AKD Universe - PB Band (FY08F)
Source: KSE & AKD Research
Jul-03 May-04 Apr-05 Mar-06 Feb-07 Jan-08
(x)
11.5
10.0
8.5
7.0
Jul-03 May-04 Apr-05 Mar-06 Feb-07 Jan-08
(x)
3.0
2.5
2.0
1.5
*AKD Universe comprises 71% of KSE-100 Index capitalization

12
AKD Securities LimitedJanuary 2008 Pakistan Market: 2007 - 2008
AKD Universe Valuation
AKD Fundamental Ratios (%)
January 04, 2008 FY05A FY06A FY07A/F FY08F FY09F
EPS (PkR) 7.59 9.24 9.30 11.20 12.46EPS Chg (%) 34.29 21.69 0.66 20.44 11.23Price to Earnings (x) 15.56 12.79 12.70 10.55 9.48Price to Book (x) 4.24 3.52 3.08 2.64 2.29Price to CF (x) 11.92 12.55 11.87 10.01 8.54Earnings Yield (%) 6.43 7.82 7.87 9.48 10.55Dividend Yield (%) 3.7 4.7 4.4 4.9 5.5Payout (%) 57.80 59.78 55.65 52.04 52.22EV / EBITDA (x) 7.64 6.59 6.91 5.87 5.41FCFE Yield (%) 4.8% 4.3% 5.9% 7.3% 9.5%Price to Sales (x) 2.48 1.92 1.72 1.49 1.37Book Value per Share (PkR) 27.86 33.52 38.34 44.75 51.69Return on Equity (%) 27.24 27.56 24.25 25.02 24.10Return on Assets (%) 5.40 5.67 5.11 5.51 5.63Chg in Sales (%) 29.69 29.49 11.46 15.39 9.16Gross Margin (%) 34.63 32.75 30.57 31.41 31.44Operating Margin (%) 22.90 21.90 19.68 21.22 21.53Net Margin (%) 15.95 14.99 13.54 14.13 14.40
Non-Financial Sector 2005A 2006A 2007A/E 2008F 2009F
Sales Growth 24% 27% 9% 16% 10%Gross Margin 25% 23% 20% 21% 21%Operating Margin 19% 18% 15% 16% 16%Net Margin 14% 12% 11% 11% 11%LT Debt / Equity 19% 19% 21% 20% 18%CA/CL (x) 1.98 1.81 1.97 1.98 0.27Growth in Operating CF 20% -5% 6% 19% 17%ROE 29% 29% 24% 25% 25%
Banking Sector 2005A 2006A 2007E 2008F 2009F
Asset Growth 17% 15% 13% 10% 9%Deposits Growth 15% 11% 14% 9% 7%Loan Growth 31% 17% 7% 13% 11%Net Int Inc. Growth 76% 32% 11% 13% 11%Fee Inc. Growth 14% 27% 12% 16% 13%Net Int Inc./Total Income 80% 80% 84% 79% 79%L/D Ratio 67% 71% 66% 69% 71%ROA 2.0% 2.5% 2.3% 2.6% 2.7%
Source: AKD Research

13
Pakistan Market: 2007 - 2008 AKD Securities Limited January 2008
Qasim Anwar Technical Analyst [email protected]
Major Support 13,146~13,350 levels Short Term Target 14,480~17,580 levels Intermediate Target 16,280~16,400 levels Long Term Target 15,300~15,500 levels Moving Averages 004-Week 14,561.76 006-Week 14,453.24 020-Week 13,727.41 030-Week 13,659.87 100-Week 11,825.12 DEMAND / SUPPORT LEVEL S1 13,146~13,350 S2 12,800~12,950 S3 12,076~12,337 SUPPLY / RESISTANCE LEVEL R1 14,200~14,290 R2 14,908 R3 15,320 R4 16,415~16,500 R5 16,930~17,000 R6 17,480~17,580
§ During the year 2007, KSE 100-index posted a whooping gain of 40.2% or 4,035 points to settle at 14,075 levels from 10,040 levels on year ended December 29, 2006. Looking at the Index’s movement over the last three years, the series of successively higher peaks and troughs along with the rising OBV (On Balance Volume) suggests that the primary bullish trend is intact, despite high volatility witnessed in recent months.
§ The rising long-term channel on weekly chart is leading towards our
December 2008 objective of 17,480~17,574 levels – anticipated around 123.6% Fibonacci Projection (9,696-14,290). Recent movements suggest that a breakout above the formidable resistance around 14,200~14,290 levels would push the index to hit its short-term target of 15,300~15,500 levels (76.4% Fibonacci Projection (9,696-14,290). Once these levels are achieved, a smoother rally could be constructed toward the Index’s intermediate target of 16,280~16,400 levels around 100% Fibonacci Projection (9,696-14,290), which if also breached (on weekly closing basis) then our 2008 objective will be on cards.
§ On the down side, two major supports exist between 13,399~13,550 levels
and 12,800~12,881 levels if market takes any near-term dip. § INVESTMENT PERSPECTIVE: Take selective positions in fundamentally
strong scrips at weekly close above 14,290 levels for the KSE-100 Index. Short-term trading oriented investors are suggested to cut positions if Index slips below 14,100~14,200 levels (on weekly closing basis). For investors with 3-month horizon strategy of buy on dips up to 13,548 levels should yield positive results.
KSE-100 Index Closing Index: 14,259.60
Pakistan Stock Market

14
AKD Securities LimitedJanuary 2008 Pakistan Market: 2007 - 2008
AKD Universe - PER versus EPS Growth (2008)
Source: AKD Research
PER (x) EPS GrowthHCAR 48.5 -159%AICL 16.0 -46%CHCC 9.2 131%SHEL 11.7 176%SSGC 10.2 509%NESTLE 38.0 31%
4.0
6.1
8.2
10.3
12.4
14.5
16.6
18.7
20.8
4% 11% 18% 25% 33% 40% 47% 54%
EPS Growth 2008F
PPL
ACPL
FFCINDU
ULEVER
THALL
PTC
PSOOGDC
LUCK
PSMC
SNGPUBL
DGKC
ENGRO
GADT
NMLFFBL
PICT
AKBL
PKGS
HBL
MTLFCCLAGTL
BAFL HUBC
MCB
AKD Universe
POL
NBPKAPCO
ABL ICI
Priced on January 04, 2008
AKD Universe - PB versus ROE (2008)
P/BVS (x) ROEULEVER 15.23 91%NESTLE 20.62 54%
Source: AKD Research
0.4
0.7
1.1
1.4
1.8
2.2
2.5
2.9
3.2
3.6
4.0
4.3
4.7
5.0
4% 7% 11% 14% 17% 21% 24% 27% 30% 34% 37% 40% 44% 47%
Return on Equity 2008F
PPL
ACPL
FFC
INDU
MLCF
THALL
PTC
PSO
OGDC
LUCKPSMC
SNGP
UBL
DGKC
ENGRO
FFBL
PICT
AKBL
PKGS
HBL
MTL
FCCL
BAFL
HUBC
AICL
AGTL
KAPCOSHELHCAR
PIOC
CHCC
AKD Universe
MCB
SSGC
ICINBP
POLABL
GADTNML
Priced on January 04, 2008
15
AKD Securities LimitedJanuary 2008 Pakistan Market: 2007 - 2008
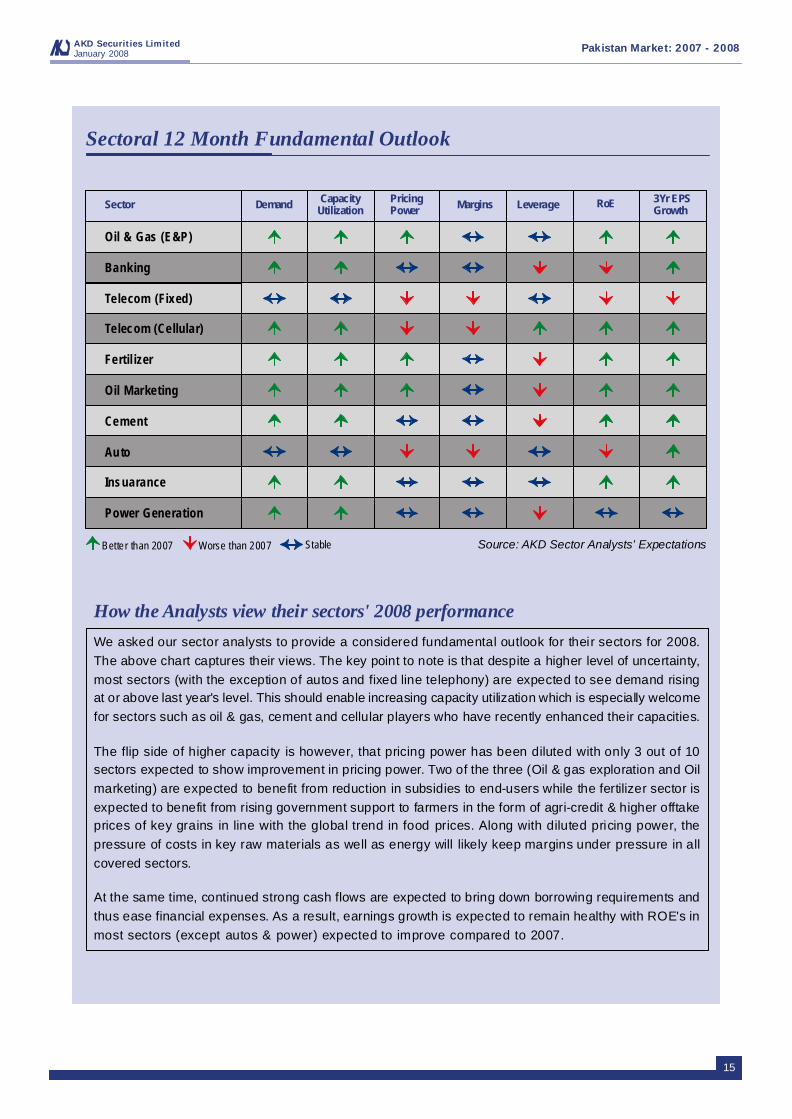
Sectoral 12 Month Fundamental Outlook
Source: AKD Sector Analysts’ Expectations
Sector Demand CapacityUtilization
PricingPower Margins Leverage RoE 3Yr EPS
Growth
Oil & Gas (E&P)
Banking
Telecom (Fixed)
Telecom (Cellular)
Fertil izer
Oil Marketing
Cement
Au to
Insuarance
Power Generation
Better than 2007 Worse than 2007 Stable
How the Analysts view their sectors' 2008 performance
We asked our sector analysts to provide a considered fundamental outlook for their sectors for 2008.The above chart captures their views. The key point to note is that despite a higher level of uncertainty,most sectors (with the exception of autos and fixed line telephony) are expected to see demand risingat or above last year's level. This should enable increasing capacity utilization which is especially welcomefor sectors such as oil & gas, cement and cellular players who have recently enhanced their capacities.
The flip side of higher capacity is however, that pricing power has been diluted with only 3 out of 10sectors expected to show improvement in pricing power. Two of the three (Oil & gas exploration and Oilmarketing) are expected to benefit from reduction in subsidies to end-users while the fertilizer sector isexpected to benefit from rising government support to farmers in the form of agri-credit & higher offtakeprices of key grains in line with the global trend in food prices. Along with diluted pricing power, thepressure of costs in key raw materials as well as energy will likely keep margins under pressure in allcovered sectors.
At the same time, continued strong cash flows are expected to bring down borrowing requirements andthus ease financial expenses. As a result, earnings growth is expected to remain healthy with ROE's inmost sectors (except autos & power) expected to improve compared to 2007. .

16
AKD Securities LimitedJanuary 2008 Pakistan Market: 2007 - 2008
FY08
Provisional Original SBP
FY07 targets projection
Growth rates (percent)
GDP 7.0 7.2 6.6 - 7.0
Inflation 7.8 6.5 6.5 - 7.5
Monetary assets (M2) 19.3 13.7* 13.5 - 14.5
billion US Dollars
Exports (fob-BoP data) 17.1 18.9 18.3
Imports (fob-BoP data) 27.0 29.6 28.9
Exports (fob-Customs data) 17.0 19.2 19.2
Imports (cif-Customs data) 30.5 32.3 32.3
Workers' remittances 5.5 5.8 6.0 - 6.5
percent of GDP
Budgetary balance -4.3 -4.0** -4.0
Current account balance -0.5 -5.0 -5.2(*) Announced in MPS Jul-Dec FY08: (**) Budget estimates. Source: State Bank of Pakistan
Selected Economic Indicators FY06 FY07 FY08
Growth rate (percent)
Large scale manufacturing Jul-Sep 9.0 10.4 6.9
Exports (FOB) Jul-Oct 14.6 4.1 10.9
Imports (FOB) Jul-Oct 37.4 14.5 3.4
Tax revenue (CBR) Jul-Oct 20.8 17.9 14.4
CPI (12 month MA) Nov 9.0 7.9 7.6
Private sector credit Jul- 1st Dec 12.2 7.0 5.4
Money supply (M2) Jul- 1st Dec 3.4 4.2 4.2
million US Dollars
Total liquid reserves -1 End-Nov 11,255 12,298 15,778
Home remittances Jul-Oct 1,372 1,644 2,081
Foreign private investment Jul-Oct 696 1,741 1,642
percent of GDP -2
Fiscal deficit Jul-Sep 0.5 1.0 1.6
Trade deficit Jul-Oct 2.1 2.5 2.0
Current a/c deficit Jul-Oct 1.7 2.4 1.81- With SBP & commercial banks.2- Based on full-year GDP in the denominator. For FY08 estimated full year GDP has been used. Source: State Bank of Pakistan
Fiscal Performance Indicators (Jul-Sep) as percent of GDP (1) FY06 FY07 FY08
Fiscal balance -0.5 -1.0 -1.6
Primary balance 0.1 -0.3 -0.5
Revenue balance 0.2 0.1 -0.31 Based on projected full-year GDP Source: State Bank of Pakistan
Economic Snapshot

17
AKD Securities LimitedJanuary 2008 Pakistan Market: 2007 - 2008
AKD Universe Companies’ Fundamental Performance
Sales Growth Gross Operating Operating EPS Growth Net (%) Margin Profit Margin (%) Margin
Pakistan Telecom Company -7% n.a -46% 22% -43% 17%Cherat Cement Company 2% 6% -97% 1% -97% 0%DG Khan Cement 21% 17% -61% 14% -45% 12%Lucky Cement 19% 27% -12% 21% 53% 20%Maple Leaf Cement Factory -30% 10% -78% 5% -97% 0%Fauji Cement -23% 20% -71% 16% -77% 7%Pioneer Cement 40% 5% -155% -5% n.a -12%Attock Cement Pakistan Limited -10% 25% -59% 21% -72% 8%Oil & Gas Development Company 10% 66% 3% 63% 0% 44%Pakistan Petroleum Limited 17% n.a. 25% 68% 26% 47%Pak Oilfields Limited -8% 61% -3% 60% 3% 51%Sui Southern Gas Company -2% 9% 32% 7% -21% 2%Sui Northern Gas Piplines 13% 13% 18% 3% 30% 3%Pakistan State Oil 21% 4% 444% 3% 271% 2%Shell Pakistan Limited -5% 7% -442% 3% n.a 2%Hub Power Company Limited 13% 8% 2% 8% -16% 5%Kot Addu Power Company 16% 23% 17% 22% 17% 13%Pakistan Int'l Container Terminal 28% 41% 31% 33% 37% 17%Millat Tractors Limited 3% 12% -4% 6% -3% 6%Indus Motors 11% 13% 45% 11% 46% 9%Nishat Mills -1% 19% 5% 11% 14% 11%Gadoon Textile 2% 11% -32% 7% -37% 3%
Source: Company Reports
Non-Banking Companies with year-end June (1QFY08 vs 1QFY07)
Sales Growth Gross Margin Operating Profit Operating Margin EPS Growth (%) Net Margin
(%) 2007 2007 2007 2007 (%) 2007 2007
Pakistan Telecom Company -6% n.a -38% 26% -25% 24%Cherat Cement Company 4% 18% -60% 13% -66% 7%DG Khan Cement -19% 32% -51% 29% -33% 25%Lucky Cement 55% 29% 11% 24% 32% 20%Maple Leaf Cement Factory -27% 12% -82% 9% -96% 1%Fauji Cement -21% 35% -48% 30% -46% 19%Pioneer Cement 10% 18% -61% 13% -114% -3%Attock Cement Pakistan Limited 28% 36% -8% 29% -12% 18%Oil & Gas Development Company 4% 39% -6% 11% -1% 7%Pakistan Petroleum Limited 21% n.a 23% 11% 25% 6%Pak Oilfields Limited 20% 33% 24% 11% 29% 7%Sui Southern Gas Company 6% 9% 47% 4% -67% 0%Sui Northern Gas Piplines 6% 15% 7% 5% -28% 2%Pakistan State Oil 17% 4% -35% 2% -38% 1%Shell Pakistan Limited -2% 6% -81% 1% -77% 1%Hub Power Company Limited 12% 14% 1% 13% -4% 8%Kot Addu Power Company -4% 26% -16% 26% -6% 16%Pakistan Int'l Container Terminal 22% 42% 36% 35% 14% 16%Millat Tractors Limited 2% 12% 4% 10% 5% 8%Indus Motors 22% 11% 9% 9% 4% 6%Nishat Mills 5% 17% -15% 9% 3% 10%Gadoon Textile 13% 12% -13% 8% -21% 4%
Non-Banking Companies with year-end June Results (FY2007-06)
Source: Company Reports

18
AKD Securities LimitedJanuary 2008 Pakistan Market: 2007 - 2008
AKD Universe Companies’ Fundamental Performance
Non-Banking Companies with year-end December Results (FY2007-06)Sales Growth Gross Margin Operating Profit Operating Margin EPS Growth (%) Net Margin
(%) 2006 2006 2006 2006 (%) 2006 2006Fauji Fertilizer Company 18% 32% 2% 23% -5% 15%
Engro Chemical -4% 24% 4% 16% 10% 14%
Fauji Fertilizer Bin Qasim Ltd. 3% 32% -3% 20% 0% 17%
Unilever Pakistan Limited 19% 38% 4% 13% 3% 8%
Nestle Pakistan Limited 29% 28% 24% 12% 18% 6%
Al-Ghazi Tractor 17% 18% 2% 17% 16% 14%
ICI Pakistan 6% 21% 35% 13% -35% 7%
Pak Suzuki Motors 33% 12% 50% 12% 50% 7%
Honda Atlas Car 55% 5% 974% 3% 335% 3%
Adamjee Insurance Co. Limited 32% 9% 40% 40% 36% 30%
Packages Limited 11% 16% -16% 10% 20% 16%Source: Company Reports
Source: Company Reports
Non-Banking Companies with year-end December (9MCY07 vs 9MCY06)Sales Growth Gross Operating Operating EPS Growth Net
(%) Margin Profit Margin (%) Margin
Fauji Fertil izer Company -3% 39% 24% 21% 27% 21%
Engro Chemical 33% 24% 18% 12% 17% 12%
Fauji Fertil izer Bin Qasim Ltd. -9% 34% 37% 20% 16% 20%
Unilever Pakistan Limited 10% 40% 11% 8% 4% 8%
Nestle Pakistan Limited 28% 29% 64% 7% 74% 7%
Al-Ghazi Tractor 1% 18% 1% 14% 4% 14%
ICI Pakistan 11% 20% 10% 7% 19% 7%
Pak Suzuki Motors 8% 11% -10% 7% -14% 7%
Honda Atlas Car -13% 4% -151% 1% n.a 1%
Adamjee Insurance Co. Limited 5% 10% 21% 41% 20% 38%
Packages Limited 13% 16% 12% 10% -9% 10%
19
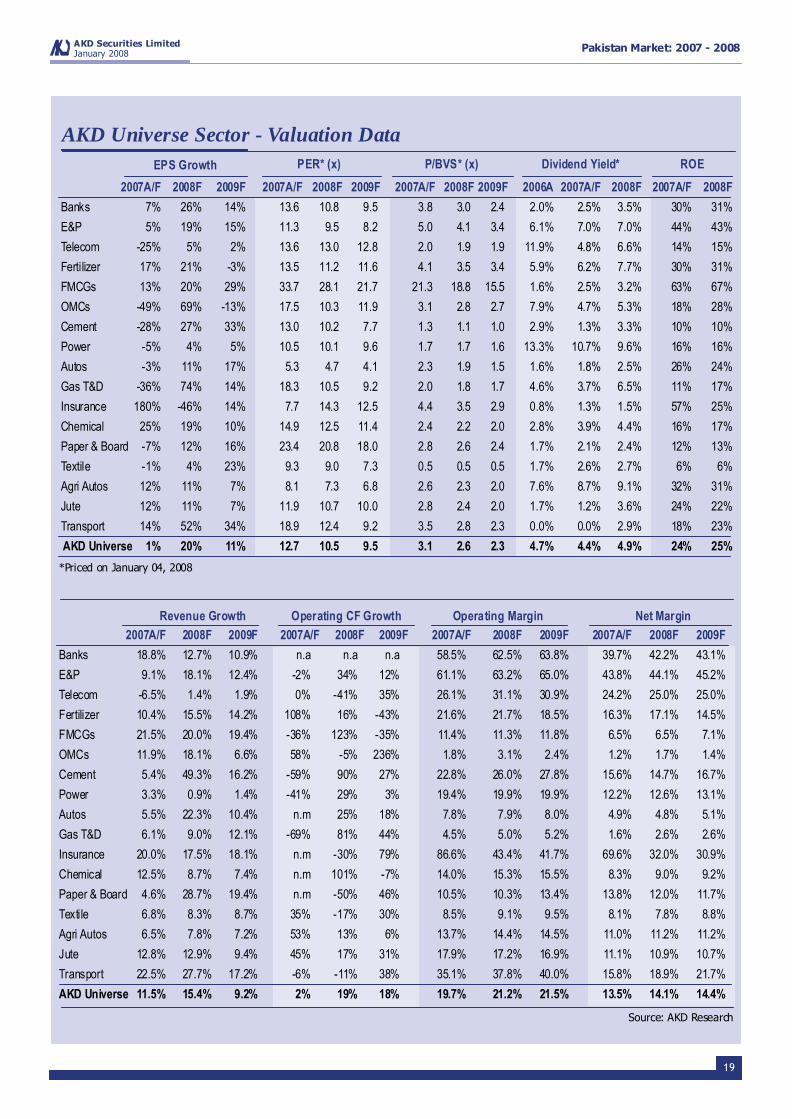
AKD Securities LimitedJanuary 2008 Pakistan Market: 2007 - 2008
2007A/F 2008F 2009F 2007A/F 2008F 2009F 2007A/F 2008F 2009F 2006A 2007A/F 2008F 2007A/F 2008F
Banks 7% 26% 14% 13.6 10.8 9.5 3.8 3.0 2.4 2.0% 2.5% 3.5% 30% 31%
E&P 5% 19% 15% 11.3 9.5 8.2 5.0 4.1 3.4 6.1% 7.0% 7.0% 44% 43%
Telecom -25% 5% 2% 13.6 13.0 12.8 2.0 1.9 1.9 11.9% 4.8% 6.6% 14% 15%
Fertilizer 17% 21% -3% 13.5 11.2 11.6 4.1 3.5 3.4 5.9% 6.2% 7.7% 30% 31%
FMCGs 13% 20% 29% 33.7 28.1 21.7 21.3 18.8 15.5 1.6% 2.5% 3.2% 63% 67%
OMCs -49% 69% -13% 17.5 10.3 11.9 3.1 2.8 2.7 7.9% 4.7% 5.3% 18% 28%
Cement -28% 27% 33% 13.0 10.2 7.7 1.3 1.1 1.0 2.9% 1.3% 3.3% 10% 10%
Power -5% 4% 5% 10.5 10.1 9.6 1.7 1.7 1.6 13.3% 10.7% 9.6% 16% 16%
Autos -3% 11% 17% 5.3 4.7 4.1 2.3 1.9 1.5 1.6% 1.8% 2.5% 26% 24%
Gas T&D -36% 74% 14% 18.3 10.5 9.2 2.0 1.8 1.7 4.6% 3.7% 6.5% 11% 17%
Insurance 180% -46% 14% 7.7 14.3 12.5 4.4 3.5 2.9 0.8% 1.3% 1.5% 57% 25%
Chemical 25% 19% 10% 14.9 12.5 11.4 2.4 2.2 2.0 2.8% 3.9% 4.4% 16% 17%
Paper & Board -7% 12% 16% 23.4 20.8 18.0 2.8 2.6 2.4 1.7% 2.1% 2.4% 12% 13%
Textile -1% 4% 23% 9.3 9.0 7.3 0.5 0.5 0.5 1.7% 2.6% 2.7% 6% 6%
Agri Autos 12% 11% 7% 8.1 7.3 6.8 2.6 2.3 2.0 7.6% 8.7% 9.1% 32% 31%
Jute 12% 11% 7% 11.9 10.7 10.0 2.8 2.4 2.0 1.7% 1.2% 3.6% 24% 22%
Transport 14% 52% 34% 18.9 12.4 9.2 3.5 2.8 2.3 0.0% 0.0% 2.9% 18% 23%
AKD Universe 1% 20% 11% 12.7 10.5 9.5 3.1 2.6 2.3 4.7% 4.4% 4.9% 24% 25%
EPS Growth PER* (x) P/BVS* (x) Dividend Yield*
*Priced on January 04, 2008
AKD Universe Sector - Valuation DataROE
2007A/F 2008F 2009F 2007A/F 2008F 2009F 2007A/F 2008F 2009F 2007A/F 2008F 2009F
Banks 18.8% 12.7% 10.9% n.a n.a n.a 58.5% 62.5% 63.8% 39.7% 42.2% 43.1%
E&P 9.1% 18.1% 12.4% -2% 34% 12% 61.1% 63.2% 65.0% 43.8% 44.1% 45.2%
Telecom -6.5% 1.4% 1.9% 0% -41% 35% 26.1% 31.1% 30.9% 24.2% 25.0% 25.0%
Fertilizer 10.4% 15.5% 14.2% 108% 16% -43% 21.6% 21.7% 18.5% 16.3% 17.1% 14.5%
FMCGs 21.5% 20.0% 19.4% -36% 123% -35% 11.4% 11.3% 11.8% 6.5% 6.5% 7.1%
OMCs 11.9% 18.1% 6.6% 58% -5% 236% 1.8% 3.1% 2.4% 1.2% 1.7% 1.4%
Cement 5.4% 49.3% 16.2% -59% 90% 27% 22.8% 26.0% 27.8% 15.6% 14.7% 16.7%
Power 3.3% 0.9% 1.4% -41% 29% 3% 19.4% 19.9% 19.9% 12.2% 12.6% 13.1%
Autos 5.5% 22.3% 10.4% n.m 25% 18% 7.8% 7.9% 8.0% 4.9% 4.8% 5.1%
Gas T&D 6.1% 9.0% 12.1% -69% 81% 44% 4.5% 5.0% 5.2% 1.6% 2.6% 2.6%
Insurance 20.0% 17.5% 18.1% n.m -30% 79% 86.6% 43.4% 41.7% 69.6% 32.0% 30.9%
Chemical 12.5% 8.7% 7.4% n.m 101% -7% 14.0% 15.3% 15.5% 8.3% 9.0% 9.2%
Paper & Board 4.6% 28.7% 19.4% n.m -50% 46% 10.5% 10.3% 13.4% 13.8% 12.0% 11.7%
Textile 6.8% 8.3% 8.7% 35% -17% 30% 8.5% 9.1% 9.5% 8.1% 7.8% 8.8%
Agri Autos 6.5% 7.8% 7.2% 53% 13% 6% 13.7% 14.4% 14.5% 11.0% 11.2% 11.2%
Jute 12.8% 12.9% 9.4% 45% 17% 31% 17.9% 17.2% 16.9% 11.1% 10.9% 10.7%
Transport 22.5% 27.7% 17.2% -6% -11% 38% 35.1% 37.8% 40.0% 15.8% 18.9% 21.7%
AKD Universe 11.5% 15.4% 9.2% 2% 19% 18% 19.7% 21.2% 21.5% 13.5% 14.1% 14.4%
Operating CF GrowthRevenue Growth Operating Margin Net Margin
Source: AKD Research

20
AKD Securities LimitedJanuary 2008 Pakistan Market: 2007 - 2008
Source: AKD Research
AKD Universe Companies - Price PerformanceMkt. Cap 6M AD Val Price (PkR) % Chg. 12M (Price-PkR) 3M (Price-PkR) 1W (Price-PkR)* Chg from 1 Year
Company (US$mn) (US$mn) 4-Jan-08 in CY07 High Low High Low High Low All Time High STD
MCB 4,091 20.79 398.80 86% 433.00 222.17 433.00 338.00 399.95 363.45 -8% 16%
NBP 3,109 34.50 233.50 20% 278.85 201.74 278.85 214.10 233.50 214.10 -16% 5%
HBL 2,656 9.78 235.80 -19% 298.70 218.00 298.70 218.00 239.90 218.00 -21% 6%
UBL 2,429 3.78 183.80 50% 224.25 123.68 205.70 157.65 183.80 166.00 -18% 13%
ABL 1,175 1.35 133.60 71% 145.45 77.58 141.25 120.40 137.45 128.00 -8% 15%
BAFL 572 6.43 53.90 68% 65.10 33.15 62.10 48.80 53.90 49.40 -17% 15%
AKBL 511 7.83 104.05 49% 105.95 71.67 105.95 84.60 104.05 98.60 -2% 9%
OGDC 8,528 31.13 121.45 6% 132.80 104.90 132.80 113.40 121.45 113.40 -36% 4%
PPL 3,066 26.63 248.95 18% 276.82 212.73 276.82 233.00 248.95 233.00 -13% 5%
POL 1,080 27.15 335.50 -4% 373.95 280.25 363.85 305.55 335.50 307.40 -29% 6%
PTC 3,485 4.54 41.85 -6% 61.35 38.75 56.00 38.75 42.05 38.75 -53% 9%
FFC 995 3.27 123.50 17% 129.15 103.70 127.00 114.85 125.20 118.75 -14% 5%
ENGRO 829 20.13 262.50 66% 296.70 158.65 296.70 241.00 265.75 241.00 -12% 17%
FFBL 658 6.77 43.15 51% 48.30 28.40 48.30 39.50 43.15 39.50 -11% 15%
NESTLE 1,348 0.01 1,820 74% 1,855 1,036 1,855 1,480 1,820 1,800 -2% 12%
ULEVER 525 0.04 2,420 21% 2,625 2,000 2,625 2,280 2,420 2,280 -8% 7%
PSO 1,166 13.11 416.50 42% 434.00 297.85 434.00 373.00 416.50 387.00 -15% 9%
SHEL 373 0.37 417.00 5% 499.10 370.00 460.00 394.90 417.00 394.90 -38% 7%
LUCK 510 19.64 118.70 98% 143.05 58.00 143.05 107.70 118.70 107.70 -17% 22%
DGKC 389 13.39 94.00 49% 120.00 62.25 117.10 85.50 94.70 85.50 -23% 14%
ACPL 123 0.12 104.70 58% 126.90 65.80 126.10 90.00 104.70 95.00 -21% 12%
MLCF 118 1.09 19.45 18% 25.90 14.82 24.40 18.05 19.45 18.05 -54% 13%
FCCL 329 1.64 15.55 0% 19.50 14.45 17.95 14.45 15.55 14.45 -31% 10%
PIOC 86 0.53 31.00 39% 51.50 21.20 38.55 28.55 31.60 28.55 -54% 20%
CHCC 64 0.09 40.90 0% 63.85 37.45 48.00 37.45 40.90 38.80 -57% 13%
KAPCO 721 0.77 50.15 23% 62.55 40.50 56.75 47.00 50.80 48.45 -20% 11%
HUBC 718 1.29 31.40 28% 36.15 24.64 36.15 29.25 31.40 30.20 -25% 8%
PSMC 434 0.69 327.75 17% 429.00 272.70 429.00 311.00 329.65 311.00 -24% 11%
INDU 393 0.78 306.00 57% 406.00 193.25 406.00 297.00 319.20 297.00 -25% 18%
HCAR 62 0.40 52.80 58% 81.40 31.08 81.40 48.85 54.10 48.85 -35% 27%
SNGP 592 1.18 66.00 1% 86.20 58.50 71.40 61.50 66.00 61.50 -41% 8%
SSGC 294 0.98 26.85 14% 31.70 24.00 29.15 25.45 26.85 25.45 -42% 6%
AICL 556 15.32 333.00 121% 417.00 152.15 417.00 310.90 358.35 323.45 -20% 27%
ICI 441 3.30 194.60 68% 234.30 117.40 234.30 162.65 196.65 177.55 -17% 18%
PKGS 432 3.83 360.95 80% 416.20 193.81 416.20 340.00 363.80 340.00 -13% 21%
NML 267 5.14 102.40 17% 133.75 88.30 132.90 95.00 105.20 95.00 -23% 11%
GADT 23 0.00 59.10 -6% 84.45 56.05 74.00 56.10 59.10 56.10 -52% 11%
AGTL 199 0.03 283.95 30% 293.00 199.90 291.50 250.00 283.95 268.10 -3% 12%
MTL 89 0.05 290.00 3% 342.45 256.50 320.00 256.50 290.00 270.50 -15% 7%
THALL 144 0.17 290.00 198% 303.00 97.04 303.00 238.00 290.00 275.00 -4% 24%
PICT 85 0.32 68.95 21% 84.80 50.70 75.45 58.50 70.40 64.75 -40% 14%
*1week: Dec 27, 07 - Jan 04, 2008
21
AKD Securities LimitedJanuary 2008 Pakistan Market: 2007 - 2008
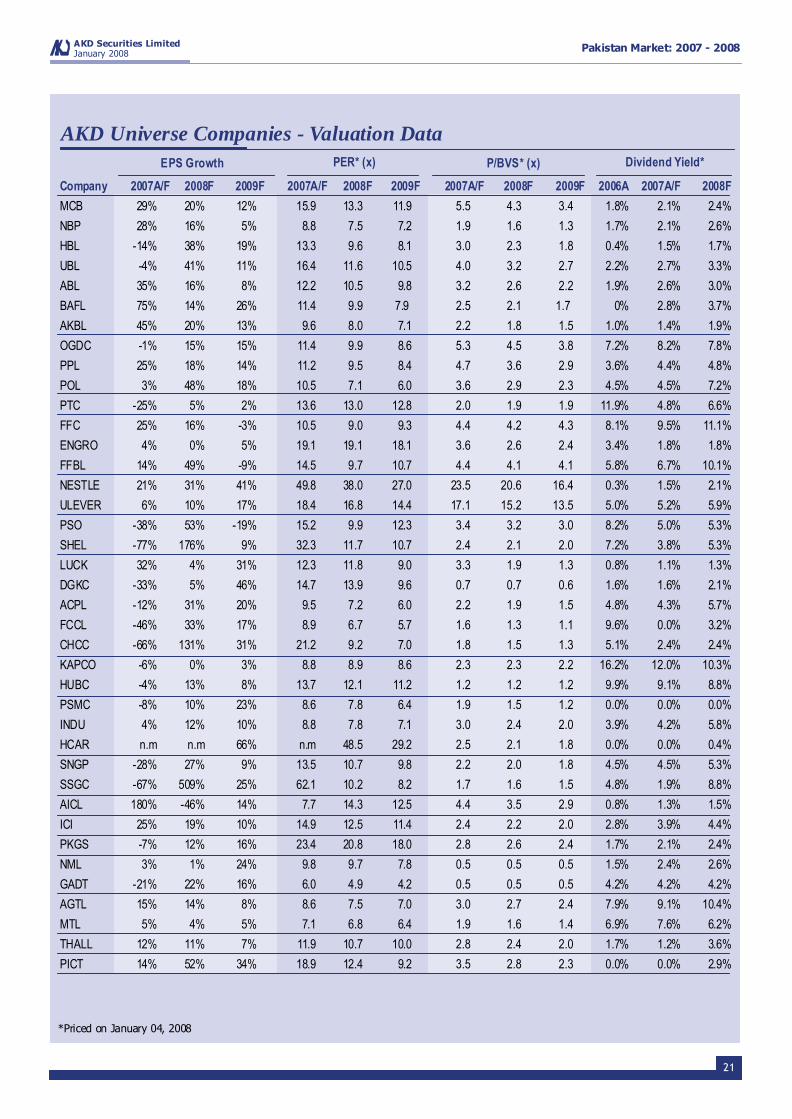
Company 2007A/F 2008F 2009F 2007A/F 2008F 2009F 2007A/F 2008F 2009F 2006A 2007A/F 2008F
MCB 29% 20% 12% 15.9 13.3 11.9 5.5 4.3 3.4 1.8% 2.1% 2.4%
NBP 28% 16% 5% 8.8 7.5 7.2 1.9 1.6 1.3 1.7% 2.1% 2.6%
HBL -14% 38% 19% 13.3 9.6 8.1 3.0 2.3 1.8 0.4% 1.5% 1.7%
UBL -4% 41% 11% 16.4 11.6 10.5 4.0 3.2 2.7 2.2% 2.7% 3.3%
ABL 35% 16% 8% 12.2 10.5 9.8 3.2 2.6 2.2 1.9% 2.6% 3.0%
BAFL 75% 14% 26% 11.4 9.9 7.9 2.5 2.1 1.7 0% 2.8% 3.7%
AKBL 45% 20% 13% 9.6 8.0 7.1 2.2 1.8 1.5 1.0% 1.4% 1.9%
OGDC -1% 15% 15% 11.4 9.9 8.6 5.3 4.5 3.8 7.2% 8.2% 7.8%
PPL 25% 18% 14% 11.2 9.5 8.4 4.7 3.6 2.9 3.6% 4.4% 4.8%
POL 3% 48% 18% 10.5 7.1 6.0 3.6 2.9 2.3 4.5% 4.5% 7.2%
PTC -25% 5% 2% 13.6 13.0 12.8 2.0 1.9 1.9 11.9% 4.8% 6.6%
FFC 25% 16% -3% 10.5 9.0 9.3 4.4 4.2 4.3 8.1% 9.5% 11.1%
ENGRO 4% 0% 5% 19.1 19.1 18.1 3.6 2.6 2.4 3.4% 1.8% 1.8%
FFBL 14% 49% -9% 14.5 9.7 10.7 4.4 4.1 4.1 5.8% 6.7% 10.1%
NESTLE 21% 31% 41% 49.8 38.0 27.0 23.5 20.6 16.4 0.3% 1.5% 2.1%
ULEVER 6% 10% 17% 18.4 16.8 14.4 17.1 15.2 13.5 5.0% 5.2% 5.9%
PSO -38% 53% -19% 15.2 9.9 12.3 3.4 3.2 3.0 8.2% 5.0% 5.3%
SHEL -77% 176% 9% 32.3 11.7 10.7 2.4 2.1 2.0 7.2% 3.8% 5.3%
LUCK 32% 4% 31% 12.3 11.8 9.0 3.3 1.9 1.3 0.8% 1.1% 1.3%
DGKC -33% 5% 46% 14.7 13.9 9.6 0.7 0.7 0.6 1.6% 1.6% 2.1%
ACPL -12% 31% 20% 9.5 7.2 6.0 2.2 1.9 1.5 4.8% 4.3% 5.7%
FCCL -46% 33% 17% 8.9 6.7 5.7 1.6 1.3 1.1 9.6% 0.0% 3.2%
CHCC -66% 131% 31% 21.2 9.2 7.0 1.8 1.5 1.3 5.1% 2.4% 2.4%
KAPCO -6% 0% 3% 8.8 8.9 8.6 2.3 2.3 2.2 16.2% 12.0% 10.3%
HUBC -4% 13% 8% 13.7 12.1 11.2 1.2 1.2 1.2 9.9% 9.1% 8.8%
PSMC -8% 10% 23% 8.6 7.8 6.4 1.9 1.5 1.2 0.0% 0.0% 0.0%
INDU 4% 12% 10% 8.8 7.8 7.1 3.0 2.4 2.0 3.9% 4.2% 5.8%
HCAR n.m n.m 66% n.m 48.5 29.2 2.5 2.1 1.8 0.0% 0.0% 0.4%
SNGP -28% 27% 9% 13.5 10.7 9.8 2.2 2.0 1.8 4.5% 4.5% 5.3%
SSGC -67% 509% 25% 62.1 10.2 8.2 1.7 1.6 1.5 4.8% 1.9% 8.8%
AICL 180% -46% 14% 7.7 14.3 12.5 4.4 3.5 2.9 0.8% 1.3% 1.5%
ICI 25% 19% 10% 14.9 12.5 11.4 2.4 2.2 2.0 2.8% 3.9% 4.4%
PKGS -7% 12% 16% 23.4 20.8 18.0 2.8 2.6 2.4 1.7% 2.1% 2.4%
NML 3% 1% 24% 9.8 9.7 7.8 0.5 0.5 0.5 1.5% 2.4% 2.6%
GADT -21% 22% 16% 6.0 4.9 4.2 0.5 0.5 0.5 4.2% 4.2% 4.2%
AGTL 15% 14% 8% 8.6 7.5 7.0 3.0 2.7 2.4 7.9% 9.1% 10.4%
MTL 5% 4% 5% 7.1 6.8 6.4 1.9 1.6 1.4 6.9% 7.6% 6.2%
THALL 12% 11% 7% 11.9 10.7 10.0 2.8 2.4 2.0 1.7% 1.2% 3.6%
PICT 14% 52% 34% 18.9 12.4 9.2 3.5 2.8 2.3 0.0% 0.0% 2.9%
EPS Growth PER* (x) P/BVS* (x) Dividend Yield*
*Priced on January 04, 2008
AKD Universe Companies - Valuation Data
22
AKD Securities LimitedJanuary 2008 Pakistan Market: 2007 - 2008
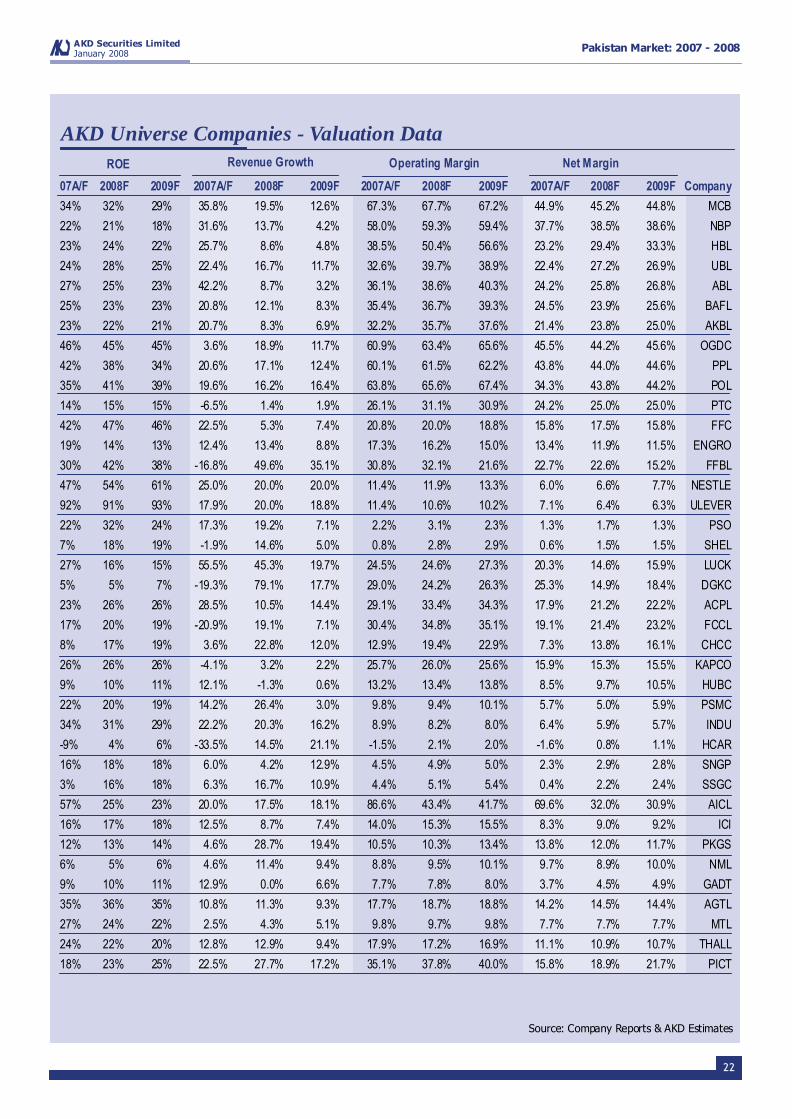
07A/F 2008F 2009F 2007A/F 2008F 2009F 2007A/F 2008F 2009F 2007A/F 2008F 2009F Company
34% 32% 29% 35.8% 19.5% 12.6% 67.3% 67.7% 67.2% 44.9% 45.2% 44.8% MCB
22% 21% 18% 31.6% 13.7% 4.2% 58.0% 59.3% 59.4% 37.7% 38.5% 38.6% NBP
23% 24% 22% 25.7% 8.6% 4.8% 38.5% 50.4% 56.6% 23.2% 29.4% 33.3% HBL
24% 28% 25% 22.4% 16.7% 11.7% 32.6% 39.7% 38.9% 22.4% 27.2% 26.9% UBL
27% 25% 23% 42.2% 8.7% 3.2% 36.1% 38.6% 40.3% 24.2% 25.8% 26.8% ABL
25% 23% 23% 20.8% 12.1% 8.3% 35.4% 36.7% 39.3% 24.5% 23.9% 25.6% BAFL
23% 22% 21% 20.7% 8.3% 6.9% 32.2% 35.7% 37.6% 21.4% 23.8% 25.0% AKBL
46% 45% 45% 3.6% 18.9% 11.7% 60.9% 63.4% 65.6% 45.5% 44.2% 45.6% OGDC
42% 38% 34% 20.6% 17.1% 12.4% 60.1% 61.5% 62.2% 43.8% 44.0% 44.6% PPL
35% 41% 39% 19.6% 16.2% 16.4% 63.8% 65.6% 67.4% 34.3% 43.8% 44.2% POL
14% 15% 15% -6.5% 1.4% 1.9% 26.1% 31.1% 30.9% 24.2% 25.0% 25.0% PTC
42% 47% 46% 22.5% 5.3% 7.4% 20.8% 20.0% 18.8% 15.8% 17.5% 15.8% FFC
19% 14% 13% 12.4% 13.4% 8.8% 17.3% 16.2% 15.0% 13.4% 11.9% 11.5% ENGRO
30% 42% 38% -16.8% 49.6% 35.1% 30.8% 32.1% 21.6% 22.7% 22.6% 15.2% FFBL
47% 54% 61% 25.0% 20.0% 20.0% 11.4% 11.9% 13.3% 6.0% 6.6% 7.7% NESTLE
92% 91% 93% 17.9% 20.0% 18.8% 11.4% 10.6% 10.2% 7.1% 6.4% 6.3% ULEVER
22% 32% 24% 17.3% 19.2% 7.1% 2.2% 3.1% 2.3% 1.3% 1.7% 1.3% PSO
7% 18% 19% -1.9% 14.6% 5.0% 0.8% 2.8% 2.9% 0.6% 1.5% 1.5% SHEL
27% 16% 15% 55.5% 45.3% 19.7% 24.5% 24.6% 27.3% 20.3% 14.6% 15.9% LUCK
5% 5% 7% -19.3% 79.1% 17.7% 29.0% 24.2% 26.3% 25.3% 14.9% 18.4% DGKC
23% 26% 26% 28.5% 10.5% 14.4% 29.1% 33.4% 34.3% 17.9% 21.2% 22.2% ACPL
17% 20% 19% -20.9% 19.1% 7.1% 30.4% 34.8% 35.1% 19.1% 21.4% 23.2% FCCL
8% 17% 19% 3.6% 22.8% 12.0% 12.9% 19.4% 22.9% 7.3% 13.8% 16.1% CHCC
26% 26% 26% -4.1% 3.2% 2.2% 25.7% 26.0% 25.6% 15.9% 15.3% 15.5% KAPCO
9% 10% 11% 12.1% -1.3% 0.6% 13.2% 13.4% 13.8% 8.5% 9.7% 10.5% HUBC
22% 20% 19% 14.2% 26.4% 3.0% 9.8% 9.4% 10.1% 5.7% 5.0% 5.9% PSMC
34% 31% 29% 22.2% 20.3% 16.2% 8.9% 8.2% 8.0% 6.4% 5.9% 5.7% INDU
-9% 4% 6% -33.5% 14.5% 21.1% -1.5% 2.1% 2.0% -1.6% 0.8% 1.1% HCAR
16% 18% 18% 6.0% 4.2% 12.9% 4.5% 4.9% 5.0% 2.3% 2.9% 2.8% SNGP
3% 16% 18% 6.3% 16.7% 10.9% 4.4% 5.1% 5.4% 0.4% 2.2% 2.4% SSGC
57% 25% 23% 20.0% 17.5% 18.1% 86.6% 43.4% 41.7% 69.6% 32.0% 30.9% AICL
16% 17% 18% 12.5% 8.7% 7.4% 14.0% 15.3% 15.5% 8.3% 9.0% 9.2% ICI
12% 13% 14% 4.6% 28.7% 19.4% 10.5% 10.3% 13.4% 13.8% 12.0% 11.7% PKGS
6% 5% 6% 4.6% 11.4% 9.4% 8.8% 9.5% 10.1% 9.7% 8.9% 10.0% NML
9% 10% 11% 12.9% 0.0% 6.6% 7.7% 7.8% 8.0% 3.7% 4.5% 4.9% GADT
35% 36% 35% 10.8% 11.3% 9.3% 17.7% 18.7% 18.8% 14.2% 14.5% 14.4% AGTL
27% 24% 22% 2.5% 4.3% 5.1% 9.8% 9.7% 9.8% 7.7% 7.7% 7.7% MTL
24% 22% 20% 12.8% 12.9% 9.4% 17.9% 17.2% 16.9% 11.1% 10.9% 10.7% THALL
18% 23% 25% 22.5% 27.7% 17.2% 35.1% 37.8% 40.0% 15.8% 18.9% 21.7% PICT
ROE Revenue Growth Operating Margin Net Margin
Source: Company Reports & AKD Estimates
AKD Universe Companies - Valuation Data

23
AKD Securities LimitedJanuary 2008 Pakistan Market: 2007 - 2008
Sectors

24
AKD Securities LimitedJanuary 2008 Pakistan Market: 2007 - 2008
Commercial Banks
Beyond Provisioning!
Advances growth, at an estimated 5% in CY07 has been sharply slower this year. Depositshowever, have continued to show solid growth, at 30%YoY in 3QCY07. Going forward, the bankingsector is well poised to take advantage of expected demand pickup from the corporate side whilethe potential in SME and consumer financing is high as well.
The banking sector was again one of the better performers in the Pakistani market in 2007, itsmarket cap growing by 48.6%YoY. On a relative basis, the listed banking sector outperformed thebenchmark KSE-100 Index by 8.6%YoY in 2007.
The Forced Sale Value (FSV) regulation, while reducing systemic risk in the banking system willlead to one-off higher provisions in 2007 confining sector EPS growth to 7% We expect the bottomline to make a strong comeback next year with estimated EPS growth of 26% in CY08. .
The AKD Banking Universe is trading at a CY08 Tier-I P/B of 3.0x and PER of 10.8x, againstmarket CY08 P/B of 2.6x and PER of 10.55x. We remain Overweight on the banking sector inview of attractive growth opportunities. Our top picks are HBL and BAFL with upsides of 50.6%and 41.2% to their respective target prices of PkR355 and PkR76.10.
Sector Valuation & Relative Performance
Banking - Valuation Multiples
Sector Market cap. (US$mn) 12,8391M 3M 6M 12M
Absolute (%) 1.5 (0 .9) (3.2) 48.6Rel. Index (%) (0.1) (2 .0) (6.0) 8.6
PkR/USD61.25
Banking Sector vs KSE-100 Index
-8%
3%
14%
25%
36%
47%
Dec-06 Mar-07 Jun-07 Sep-07 Jan-08
KSE-100 Index Commercial Banks
Companies Covered
AKBL BAFL HBL UBL ABL
MCB NBP (Under Restriction)
CY06A CY07E CY08F CY09FEPS (PkR) 13.83 14.76 18.63 21.28EPS growth 42% 7% 26% 14%PER (x) 14.5 13.6 10.8 9.4Tier I BVS (PkR) 44.7 52.4 66.5 82.7PB (Tier I) (x) 4.5 3.8 3.0 2.4PB (Total Equity) (x) 3.6 3.2 2.6 2.1ROE/PB Tier-I (x) 8.2 7.9 10.4 11.7Loan to Deposit 71% 66% 69% 71%Market Cap to Deposits 42% 37% 34% 31%Growth in Loan Book 17% 7% 13% 11%Cost/Income 39% 41% 37% 36%ROE (Tier-I) 37% 30% 31% 29%ROE (Total Equity) 28% 25% 26% 25%ROA 2.5% 2.3% 2.6% 2.7%Sec. Topline Inc. as % of AKD Universe 14% 15% 15% 15%Sector NPAT as % of AKD Universe 29% 31% 33% 34%
33.3% weight in KSE-100 Index

25
AKD Securities LimitedJanuary 2008 Pakistan Market: 2007 - 2008
Oil & Gas Exploration
Fast Track Development!
The E&P sector gained 7.3%YoY in absolute terms and thus underperformed the benchmarkKSE-100 Index by 33% during CY07.
Going forward, we expect the sector to outperform against the market as exploration activity picksups and subsequent discovery news flow comes in, especially in an environment of record highoil prices.
For FY08, we expect the Exploration and Production sector to post a bottomline growth of 19%YoYthrough fast track development of new discoveries, production ramp ups from company portfoliosand higher price environment. We recommend OGDC as our top pick on the back of managementefficacy, offering an upside of 20.6% to our target price of PkR146.50.
The E&P sector trades at a forward PER of 9.5x which is at discount to the market multiple of10.55x. The sector also offers an attractive dividend yield of 7% against the market's averagedividend yield of 5%.
We remain Overweight on the sector, and believe that, given E&P sector’s 2nd highest weight inthe KSE-100 Index, its performance will underpin index performance in 2008. .
Sector Valuation & Relative Performance
E&P Sector - Valuation Multiples
Sector Market Cap. (US$mn) 12,8391M 3M 6M 12M
Absolute (%) (0.7) (2.5) 1.1 7.3Rel. Index (%) (2.3) (3.6) (1.7) (32.7)
FY06A FY07A FY08F FY09FEPS (PkR) 12.47 13.08 15.57 17.93EPS growth 45% 5% 19% 15%PER (x) 11.9 11.3 9.5 8.2ROE 47% 44% 43% 41%ROA 35% 33% 34% 34%BVS (PkR) 26.6 29.7 36.3 43.9P/BVS (x) 5.6 5.0 4.1 3.4CFS (PkR) 14.4 14.1 19.0 21.2P/CFS (x) 10.3 10.5 7.8 7.0DPS (PkR) 9.0 10.3 10.4 12.0Dividend yield 6% 7% 7% 8%Payout Ratio 72% 79% 67% 67%EV/EBITDA (x) 7.03 5 .78 5.01 4 .29Sector Sales as % of AKD Universe 10% 10% 10% 11%Sector NPAT as % of AKD Universe 31% 33% 32% 34%
PkR/USD61.25
E&P Sector vs KSE-100 Index
-10%
1%
12%
23%
34%
45%
Dec-06 Mar-07 Jun-07 Sep-07 Jan-08
KSE-100 Index Oil & Gas Expl
Companies Covered
OGDC PPL POL - Under review
21.0% weight in KSE-100 Index

26
AKD Securities LimitedJanuary 2008 Pakistan Market: 2007 - 2008
Fertilizer
Strong prices looking for volumetric growth
The fertilizer sector gained 36.7% over the past one year, but was still short of the index’s gainof 40%YoY. While Engro and FFBL performed above the market, FFC, the sector heavy weight,pulled the average down.
With 19.2% outperfromance relative to the index, Engro has been the main driver for the overallsector’s performance followed by FFBL which generated interest on the back of the company’sDAP expansion plans combined with continuously increasing DAP prices. FFC, with its defensivenature was sidelined by investors looking for growth in 2007.
Sector’s performance in CY08 is l ikely to be a function of strong DAP and urea prices withexpansions likely to drive volumetric growth in a supply starved sector. With an additional advantageof being well diversified, Engro is likely to dominate the sector’s performance on the back ofnewsflow regarding separate listing of Engro Polymer and Engro Foods. .
Fertilizer sector trades at a marginal premium to the index, which we believe is justified owingto sector average dividend yield of 7.7% as well as 21%YoY earnings growth in CY08 whichshould lead to outperformance against the market in CY08. We remain overweight on the sector.
Sector Valuation & Relative Performance
Fertilizer Sector - Valuation MultiplesCY06A CY07E CY08F CY09F
EPS (PkR) 5.94 6.93 8 .36 8.09EPS growth 0% 17% 21% -3%PER (x) 15.8 13.5 11.2 11.6ROE 31% 30% 31% 29%ROA 14% 14% 14% 12%BVS (PkR) 19.0 22.9 26.9 27.9P/BVS (x) 4.9 4.1 3.5 3.4CFS (PkR) 2.0 7.6 8.4 6.1P/CFS (x) 46.9 12.4 11.2 15.5DPS (PkR) 5.6 5.8 7.2 6.8Dividend yield 5.9% 6.2% 7.7% 7.3%Payout Ratio 94% 84% 87% 84%EV/EBITDA (X) 10.0 8.1 7.9 6.9Sector Sales as % of AKD Universe 4% 4% 4% 5%Sector NPAT as % of AKD Universe 5% 5% 5% 5%
Sector Market cap. (US$mn) 3,030 1M 3M 6M 12M
Absolute (%) (3.3) (5 .2) 3 .9 36.7Rel. Index (%) (4.9) (6 .3) 1 .1 (3.3)
PkR/USD61.25
Fertilizer Sector vs KSE-100 Index
-10%
1%
12%
23%
34%
45%
Dec-06 Mar-07 Jun-07 Sep-07 Jan-08
KSE-100 Index Fertilizer
Companies Covered
ENGRO FFBL FFC
5.0% weight in KSE-100 Index

27
AKD Securities LimitedJanuary 2008 Pakistan Market: 2007 - 2008
Telecom Sector
Harder the fall, faster the rise!
The telecom sector underperformed the index by 50% over the past one year, making it the worstperforming major sector in the KSE-100.
PTCL has been marred by disappointing quarterly results on the back of plunging fixed line revenues.The company saw a continuous decline in not only its topline but also its bottomline which had beenhit by high bad debt provisioning as well as Technical Assistance fee of 3% of Revenues. .
We believe that PTCL’s earnings are likely to trough in 2008 because of declining fixed line revenuesand also owing to PkR17bn worth of VSS payments, which should translate into an EPS of PkR3.21for FY08. However, efficiency gains are likely to start positively impacting the bottomline from 1HFY09onwards which should be further supported with growth in i ts cellular subsidiary. .
While the company may seem expensive on FY08 valuations (PER:13.03x), we consider this atransition phase and believe investors still need to price in the impact of broadband, VSS and Ufoneinto its stock price. However, except for its cellular subsidiary, Ufone, other initiatives are unlikelyto fully show their positive impact on the bottom line until FY10.
Sector Valuation & Relative Performance
Telecom Sector - Valuation MultiplesFY06A FY07A FY08F FY09F
EPS (PkR) 4.07 3.07 3.21 3.27EPS growth -22% -25% 5% 2%PER (x) 10.27 13.65 13.03 12.79ROE 20% 14% 15% 15%ROA 14% 9% 10% 10%BVS (PkR) 20.7 21.2 21.6 22.1P/BVS (x) 2.0 2.0 1.9 1.9CFS (PkR) 6.9 6.9 4.1 5.5P/CFS (x) 6.1 6.1 10.2 7.6DPS (PkR) 5.0 2.0 2.8 2.8Dividend yie ld 11.9% 4.8% 6.6% 6.6%Payout Ratio 123% 65% 86% 84%EV/EBITDA (X) 4.5 6.1 5.6 5.7Sector Sales as % of AKD Universe 5% 4% 4% 3%Sector NPAT as % of AKD Universe 10% 7% 6% 6%
Sector Market Cap. (US$mn) 3,1211M 3M 6M 12M
Absolute (%) (5.3) (25.0) (26.9) (9.8)Rel. Index (%) (6.9) (26.1) (29.7) (49.8)
PkR/USD61.25
PTC vs KSE-100 Index
-15%
-5%
5%
15%
25%
35%
45%
Dec-06 Mar-07 Jun-07 Sep-07 Jan-08
KSE-100 Index Telecom
Company Covered
PTC
4.5% weight in KSE-100 Index

28
AKD Securities LimitedJanuary 2008 Pakistan Market: 2007 - 2008
Insurance
Premiums unjustified
The AKD non-life insurance sector universe handsomely outperformed the benchmark KSE-100Index by 78% during CY07 on the back of strong underwriting portfolios and favorable capitalmarket conditions.
For CY08, we expect the bottom line to contract by 46%YoY as compared with CY07. Thiscontraction is a result of a higher base effect under the head of investment income in CY07 asthe sector continued to aggressively book unrealized capital gains ahead of the exemption ofcapital gains tax expiring in CY07. Furthermore, core underwriting profitability is expected to beimpacted in CY08 following the recent acts of arson in the country.
With non-life insurance penetration at 0.5% compared with insurance penetration in emergingmarkets average of 1.3%, non-life insurers of Pakistan are poised to increase penetration byidentifying profitable opportunities and building attractive new general insurance businesses.Expectation of at least 6% real economic growth and introduction of broad retail products underpinthe likelihood of increased penetration.
The insurance sector trades at a forward CY08 PER of 14.3x versus the market PER of 10.55x.We maintain our Neutral stance on the sector.
Sector Valuation & Relative Performance
Insurance Sector - Valuation Multiples
CY06A CY07E CY08F FY09FEPS (PkR) 15.43 43.16 23.30 26.57EPS growth 36% 180% -46% 14%PER (x) 21.59 7.71 14.29 12.53ROE 42% 57% 25% 23%ROA 14% 25% 11% 11%BVS (PkR) 37.06 75.98 94.43 115.49P/BVS (x) 8.98 4.38 3.53 2.88CFS (PkR) (2.77) 8.24 5.74 10.28P/CFS (x) (120.14) 40.43 57.96 32.38DPS (PkR) 2.80 4.25 4.85 5.50Dividend yield 0.8% 1.3% 1.5% 1.7%Payout Ratio 18% 10% 21% 21%Sector Sales as % of AKD Universe 0.4% 0.4% 0.4% 0.5%Sector NPAT as % of AKD Universe 0.8% 2.1% 0.9% 1.0%
Sector Market cap. (US$mn) 2,9231M 3M 6M 12M
Absolute (%) (9.8) (10.5) 4.5 117.9Rel. Index (%) (11.3) (11.6) 1.7 77.8
PkR/USD61.25
AICL vs KSE-100 Index
-15%
15%
45%
75%
105%
135%
165%
Dec-06 Mar-07 Jun-07 Sep-07 Jan-08
KSE-100 Index Insurance
Company Covered
AICL
4.0% weight in KSE-100 Index

29
AKD Securities LimitedJanuary 2008 Pakistan Market: 2007 - 2008
Consumer Wave!
Sector Valuation & Relative Performance
FMCGs
Sector Market cap. (US$mn) 2,6331M 3M 6M 12M
Absolute (%) (0.7) 10.3 15.1 50.4Rel. Index (%) (2.2) 9.1 12.3 10.4
FMCGs - Valuation MultiplesCY06A CY07E CY08F CY09F
EPS (PkR) 51.28 57.99 69.72 90.14EPS growth 9% 13% 20% 29%PER (x) 38.14 33.73 28.06 21.70ROE 69% 63% 67% 71%ROA 16% 15% 16% 18%BVS (PkR) 74.37 91.96 104.28 126.29P/BVS (x) 26.30 21.27 18.76 15.49CFS (PkR) 64.04 40.80 91.07 58.79P/CFS (x) 30.54 47.95 21.48 33.27DPS (PkR) 31.52 49.67 62.35 72.75Dividend yield 1.6% 2.5% 3.2% 3.7%Payout Ratio 61% 86% 89% 81%EV/EBITDA (x) 1.4 1.4 0.9 12.4Sector Sales as % of AKD Universe 3% 3% 4% 4%Sector NPAT as % of AKD Universe 1% 2% 2% 2%
PkR/USD61.25
FMCGs Sector vs KSE-100 Index
-10%
1%
12%
23%
34%
45%
56%
67%
78%
Dec-06 Mar-07 Jun-07 Sep-07 Jan-08
KSE-100 Index FMCGs
Riding the consumer wave, the FMCG sector was able to outperform the index by 10.4%. In absoluteterms the sector gained 50.4%.
The sector’s performance was mainly led by Unilever and Nestle which reported an impressivegrowth of 32%YoY in their combined bottomlines in 9MCY07 on the back of aggressive marketingand deeply penetrating distribution network.
Going forward, we expect the FMCG sector to continue marketing aggressively which can slightlyimpact operating margins but will continue to pay off in terms of increasing topline going forward.For CY08, we expect the FMCG sector to report a bottomline growth of 20%. .
While the sector may seem expensive on valuations when compared to the AKD universe valuations,it still trades at a discount to its regional counterparts. The fact that FMCG sector has an RoE of67% and and companies like Unilever and Nestle are perceived to be run on global managementstandards justify the sector’s premium to the market valuations. While Nestle trades near our fairvalue, at current price, Unilever is our top pick with a fair value of PkR2,472. .
Companies Covered
NESTLE ULEVER
3.9% weight in KSE-100 Index

30
AKD Securities LimitedJanuary 2008 Pakistan Market: 2007 - 2008
OMCs
The year of Inventory Gains!
The Oil Marketing Sector gained 28.2%YoY in absolute terms; however the sector underperformedthe KSE-100 by 11.8% in 2007.
Over the past three months, the OMC sector has outperformed the KSE-100 by 6% on the backof growth witnessed in overall sales volumes and expectations of windfall inventory gains due torising international and refined product prices.
Volume growth is the key long term driver in the OMC Sector where we estimate a 3-year volumeCAGR of 7% with PSO as our top pick offering an upside of 12.7% to our target price of PkR469.5.Our liking for PSO is premised upon volume outperformance through aggressive retail level initiativesand long term industrial supply contracts, particularly for power sector as well as several largeprojects expected to commence in CY09.
On estimated FY08 EPS, the sector is trading at 10.31x which is slightly below the market multipleof 10.55x. On forward P/BVS, the sector is at a slight premium trading at 2.85x versus the marketFY08 P/BVS of 2.6x. We maintain our Overweight stance on the sector.
Overweight
Sector Valuation & Relative Performance
OMCs Sector - Valuation MultiplesFY06A FY07A FY08F FY09F
EPS (PkR) 46.98 23.85 40.40 35.01EPS growth 31% -49% 69% -13%PER (x) 8.87 17.47 10.31 11.90ROE 34% 18% 28% 22%ROA 11% 5% 7% 6%BVS (PkR) 136.85 134.33 146.33 155.82P/BVS (x) 3.04 3.10 2.85 2.67CFS (PkR) 10.71 16.92 16.02 53.87P/CFS (x) 38.90 24.63 26.01 7.73DPS (PkR) 33.03 19.79 22.00 24.48Dividend yie ld 7.9% 4.7% 5.3% 5.9%Payout Ratio 70% 83% 54% 70%EV/EBITDA (x) 6 .2 11.9 6.2 7 .6Sector Sales as % of AKD Universe 30% 30% 31% 30%Sector NPAT as % of AKD Universe 5% 3% 4% 3%
Sector Market Cap. (US$mn) 2,8881M 3M 6M 12M
Absolute (%) (2.6) 7.3 1.4 28.2Rel. Index (%) (4.2) 6.1 (1 .4) (11.8)
PkR/USD61.25
OMCs Sector vs KSE-100 Index
-5%
5%
15%
25%
35%
45%
Dec-06 Mar-07 Jun-07 Sep-07 Jan-08
KSE-100 Index OMCs
Companies Covered
PSO SHEL
3.3% weight in KSE-100 Index

31
AKD Securities LimitedJanuary 2008 Pakistan Market: 2007 - 2008
Cement
Light at the end of the tunnel
Even though the cement sector has underperformed the index over the past three months by 17%,it managed to report outperformance of 15.1% against the index for 2007 as a whole. .
The sector’s performance has been a function of cement prices as well as newsflow regardingcement export to India. After the resumption of price agreement in Feb 07, stock prices began tomove up, resulting in the overall sector perfromance outpacing index performance in 1HCY07.However decline in output prices followed by disappointing 1QFY08 results dampened the sector’sperformance in 2HCY07.
Cement prices have started moving upwards again from Oct/Nov 2007, driving interest back intothe sector. We believe that price concensus among manufacturers combined with greater exportopportunities on the export front should drive the sector’s earnings in CY08. .
The sector trades at a PER of 10.52x, which is at a slight discount to the market PER of 10.55x.The sector trades at a cheap EV/MT of US$82.36 and FY08 P/B of 1.1x, 58% discount to themarket P/B of 2.64x.
Sector Valuation & Relative Performance
Cement Sector - Valuation MultiplesFY06A FY07A FY08F FY09F
EPS (PkR) 5.47 3.60 5.05 6.67EPS growth 60% -34% 40% 32%PER (x) 9.71 14.77 10.52 7.96ROE 20% 9% 11% 12%ROA 9% 5% 6% 8%BVS (PkR) 27.7 39.6 46.5 54.5P/BVS (x) 1.9 1 .3 1.1 1.0CFS (PkR) 8.3 3 .4 6.4 8.1P/CFS (x) 6.4 15.8 8.3 6.6DPS (PkR) 1.6 0 .7 1.7 2.0Dividend yield 2.9% 1.3% 3.3% 3.8%Payout Ratio 28% 20% 35% 30%EV/EBITDA (x) 6.20 8.52 6.27 5.42Sector Sales as % of AKD Universe 3% 2% 3% 3%Sector NPAT as % of AKD Universe 4% 3% 3% 4%
Sector Market Cap. (US$mn) 2,3841M 3M 6M 12M
Absolute (%) (3.3) (15.9) (19.0) 55.1Rel. Index (%) (4.9) (17.0) (21.8) 15.1
PkR/USD61.25
Cement Sector vs KSE-100 Index
-20%
-5%
10%
25%
40%
55%
70%
Dec-06 Mar-07 Jun-07 Sep-07 Jan-08
KSE-100 Index Cement
Companies Covered
ACPL CHCC DGKC FCCL
LUCK MLCF PIOC
3.2% weight in KSE-100 Index

32
AKD Securities LimitedJanuary 2008 Pakistan Market: 2007 - 2008
Power Generation
Horizon of the expansion chapter!
The AKD Universe power sector gained 18.8%YoY in absolute terms but underperformed thebenchmark KSE-100 Index by 21.2% in CY07.
For FY08, we forecast the sector to post a bottomline growth of 4%YoY in line with pre-definedtariff structures.
Pakistan's electricity infrastructure is under tremendous pressure with power consumption expectedto grow at 8%-9% p.a. The existing demand and supply gap in power consumption is estimatedto grow at 1,000MW/year and is expected to reach approximately 5,550MW by CY10 unless newgeneration capacity is brought on line on a fast-track basis.
We are now beginning to see some real signs of investment activity in the power sector with therecent signing of Implementation Agreements (IAs) with seven companies totaling 1,210MWs ofpower generation capacity and financial close by six companies. This brightens expansion prospectsfor companies under our coverage.
The power sector trades at a forward FY08 PER of 10.08x versus the market at 10.55x and providesa dividend yield of 9.6%. We maintain our Overweight stance on the sector. .
Sector Valuation & Relative Performance
Power Sector - Valuation MultiplesFY06A FY07A FY08F FY09F
EPS (PkR) 3.97 3.75 3.92 4.12EPS growth -40% -5% 4% 5%PER (x) 9.95 10.53 10.08 9.58ROE 16% 16% 16% 17%ROA 10% 10% 11% 12%BVS (PkR) 24.59 23.62 23.76 24.18P/BVS (x) 1.61 1.67 1.66 1.63CFS (PkR) 6.88 4.08 5.27 5.44P/CFS (x) 5.74 9.69 7.49 7.26DPS (PkR) 5.26 4.21 3.79 3.97Dividend yie ld 13.3% 10.7% 9.6% 10.1%Payout Ratio 133% 112% 97% 96%EV/EBITDA (x) 4 .8 4.6 5.3 5.9Sector Sales as % of AKD Universe 4.4% 4.1% 3.5% 3.3%Sector NPAT as % of AKD Universe 3.9% 3.6% 3.2% 3.0%
Sector Market Cap. (US$mn) 1,7911M 3M 6M 12M
Absolute (%) 0.2 (9.3) (15.7) 18.8Rel. Index (%) (1.4) (10.4) (18.5) (21.2)
PkR/USD61.25
Power Sector vs KSE-100 Index
-6%
4%
14%
24%
34%
44%
Dec-06 Mar-07 Jun-07 Sep-07 Jan-08
KSE-100 Index Power
Companies Covered
HUBC KAPCO
2.7% weight in KSE-100 Index

33
AKD Securities LimitedJanuary 2008 Pakistan Market: 2007 - 2008
Autos
Shrinking margins reduce speed
Having gained by 36.6%YoY, the auto sector underperformed the index by 3.4% in CY07. Theincrease in JPY/USD and steel prices coupled with plans to lower production kept price performancelimited.
While most auto companies reported an increase in their quarterly earnings, higher input costs (fromJune onwards) drove investor interest out of the sector even as volumes posted a marginal improvementof 0.4%YoY.
We believe that the impact of JPY appreciation and higher steel prices, which is likely to becomeobvious in 4QCY07 and 1QCY08 results, is likely to be further priced in by investors. The sectorunderperformed the index by 15% over the past one month and is likely to lose more market cap.However, we think PSMC is worth looking at on the back of increasing volumes through low endmarket positioning.
Auto sector is trading at a discount to the market PER of 10.55x. However, keeping in mind higherinput costs as well as lower volumes, we expect the auto sector to underperform the index, justifyingthe discount on valuations.
Sector Valuation & Relative Performance
Auto Sector - Valuation Multiples
FY06A FY07A/E FY08F FY09FEPS (PkR) 22.17 18.43 21.93 25.91EPS growth 73% -17% 19% 18%PER (x) 8.68 10.44 8.77 7 .42ROE 34% 22% 21% 21%ROA 14% 11% 11% 11%BVS (PkR) 65.73 83.23 102.28 124.80P/BVS (x) 2.93 2 .31 1.88 1 .54CFS (PkR) (14.33) 17.44 21.87 25.77P/CFS (x) (13.42) 11.03 8.79 7 .46DPS (PkR) 3.12 3 .38 4.74 5 .46Dividend yield 1.6% 1.8% 2.5% 2.8%Payout Ratio 14% 18% 22% 21%EV/EBITDA (x) 3.6 4.0 3.3 3.1Sector Sales as % of AKD Universe 7.8% 7.4% 7.8% 7.9%Sector NPAT as % of AKD Universe 3.2% 2.7% 2.6% 2.8%
Sector Market Cap. (US$mn) 1,6041M 3M 6M 12M
Absolute (%) (13.7) (11.2) (6.7) 36.6Rel. Index (%) (15.3) (12.3) (9.5) (3.4)
PkR/USD61.25
Autos Sector vs KSE-100 Index
-6%
4%
14%
24%
34%
44%
54%
64%
74%
Dec-06 Mar-07 Jun-07 Sep-07 Jan-08
KSE-100 Index Autos
Companies Covered
HCAR INDU PSMC
1.6% weight in KSE-100 Index

34
AKD Securities LimitedJanuary 2008 Pakistan Market: 2007 - 2008
Capex to lead earnings growth!
Sector Valuation & Relative Performance
Gas T&D
Gas T&D - Valuation Multiples
FY06A FY07A FY08F FY09FEPS (PkR) 3.78 2.43 4.23 4.84EPS growth 23% -36% 74% 14%PER (x) 12.58 19.54 11.25 9.83ROE 18% 11% 17% 18%ROA 4% 2% 4% 4%BVS (PkR) 20.86 22.40 24.33 26.29P/BVS (x) 2.28 2.12 1.95 1.81CFS (PkR) 18.37 5.67 10.27 14.80P/CFS (x) 2.59 8.39 4.63 3.21DPS (PkR) 2.06 1.62 2.88 3.43Dividend yield 4.3% 3.4% 6.1% 7.2%Payout Ratio 55% 67% 68% 71%EV/EBITDA (x) 3.8 3.7 3 .3 2.9Sector Sales as % of AKD Universe 12.5% 11.9% 11.3% 11.6%Sector NPAT as % of AKD Universe 2.2% 1.4% 2.0% 2.1%
Sector Market Cap. (US$mn) 849 1M 3M 6M 12M
Absolute (%) (4.3) (1.3) (9.5) (0.0)Rel. Index (%) (5.9) (2.4) (12.3) (40.0)
PkR/USD61.25
Gas T&D vs KSE-100 Index
-15%
-5%
5%
15%
25%
35%
45%
Dec-06 Mar-07 Jun-07 Sep-07 Jan-08
KSE-100 Index Gas
The Gas Transmission and Distribution companies underperformed the benchmark KSE-100Index by a massive 40% over the past 12 months while remaining unchanged in terms of marketcapitalization.
The companies’ lackluster fundamental performance has largely been driven by extensive linelosses or unaccounted for gas to the tune of PkR2bn recorded by both gas utilities over pre-settargets by the regulator, OGRA. As a result, aggressive capex to enhance the asset return basehas failed to translate into higher earnings this year.
We expect price performance to improve going forward at par with the market. Last announcedresults have shown improvement in bottomline with sector profitability growing by 14%YoY.Aggressive capex and efforts to lower line losses undertaken by both companies should translateinto further earnings growth.
SNGP is currently under our active coverage and the scrip trades at a forward PER of 9.8x andP/BVS of 1.8x. We recommend an Accumulate stance on the stock with a target price of PkR68.90.
Companies Covered
SNGP SSGC
1.4% weight in KSE-100 Index

35
AKD Securities LimitedJanuary 2008 Pakistan Market: 2007 - 2008
Chemicals
Industrial expansions & construction sector to support growth
The chemicals sector has outperformed the benchmark KSE-100 Index by 25%YoY on the backof surge in sales volume and capacity expansions coming online earlier in the year, as a resultof which quarterly EPS growth momentum has been improving, underpinning share price performance.
We forecast the sector to post EPS growth of 19%YoY during CY08 as demand is expected toincrease from an expanding industrial sector and as further expansions come online. The slowdownin earnings growth rate in 2008 versus 2007 largely factors in higher input costs and the dragcreated by sharp slow down in the auto sector where ICI supplies paint, its highest margin product.
The chemicals sector trades at a CY08E PER of 12.5x versus the market PER of 10.55x. We thinkthis premium is justified on the back of strong earnings growth represented by a PEG of 0.7.
We maintain our Overweight stance on the sector.
Sector Valuation & Relative Performance
Chemical Sector - Valuation Multiples
CY06A CY07E CY08F CY09FEPS (PkR) 10.49 13.09 15.57 17.09EPS growth -35% 25% 19% 10%PER (x) 18.56 14.86 12.50 11.39ROE 13% 16% 17% 18%ROA 9% 11% 12% 13%BVS (PkR) 82.05 80.98 89.30 97.64P/BVS (x) 2 .37 2.40 2.18 1.99CFS (PkR) (80.51) 10.69 21.50 19.93P/CFS (x) (2.42) 18.21 9.05 9.77DPS (PkR) 5.50 7.50 8.50 10.00Dividend yie ld 2.8% 3.9% 4.4% 5.1%Payout Ratio 52% 57% 55% 59%EV/EBITDA (x) 8.0 6.5 5.7 5.1Sector Sales as % of AKD Universe 1.4% 1.4% 1.3% 1.3%Sector NPAT as % of AKD Universe 0.7% 0.9% 0.9% 0.8%
Sector Market Cap. (US$mn) 1,2941M 3M 6M 12M
Absolute (%) (9.4) 19.6 14.1 65.0Rel. Index (%) (11.0) 18.5 11.3 25.0
PkR/USD61.25
ICI vs KSE-100 Index
-15%
15%
45%
75%
105%
Dec-06 Mar-07 Jun-07 Sep-07 Jan-08
KSE-100 Index Chemical
Company Covered
ICI
1.4% weight in KSE-100 Index

36
AKD Securities LimitedJanuary 2008 Pakistan Market: 2007 - 2008
Textiles
Exports to cushion cost burden
The AKD textile sector universe underperformed the KSE-100 Index by 26.2% during CY07,and was up 13.8% in absolute terms.
We expect the sector to post a marginal bottomline growth of 4%YoY during FY08 as costefficiencies are achieved and topline shows capacity driven growth rather than price drivengrowth.
Cost of production is expected to remain high during FY08 but the export oriented companiesare expected to survive the current business cycle downturn through their large export baseand economies of scale.
Among recent developments, FTAs have been signed with China and Malaysia to boost marketaccess. Duties on various textile categories are expected to be zero-rated on January 1st, '08under FTA with China, where NML in particular should see benefits in terms of better marginson its yarn exports to China.
The sector trades at a FY08E PER of 8.98x compared to market PER of 10.55x and at a cheapP/BVS of 0.5x. We maintain our Overweight stance on the sector.
Sector Valuation & Relative Performance
Textile Sector - Valuation
FY06A FY07A FY08F FY09FEPS (PkR) 10.51 10.41 10.79 13.27EPS growth -7% -1% 4% 23%PER (x) 9.22 9 .31 8.98 7.30ROE 8% 6% 6% 7%ROA 11% 12% 11% 13%BVS (PkR) 128.1 177.3 185.6 196.1P/BVS (x) 0.8 0.5 0.5 0.5CFS (PkR) 10.0 13.5 11.2 14.5P/CFS (x) 9.7 7.2 8.7 6.7DPS (PkR) 1.6 2.5 2.6 2.7Dividend yield 1.7% 2.6% 2.7% 2.8%Payout Ratio 15% 24% 24% 21%EV/EBITDA (x) 6.92 6 .38 6.51 6.03Sector Sales as % of AKD Universe 1.6% 1.5% 1.4% 1.4%Sector NPAT as % of AKD Universe 0.9% 0.9% 0.8% 0.9%
Sector Market Cap. (US$mn) 1,5801M 3M 6M 12M
Absolute (%) (7.9) (18.1) (23.2) 13.8Rel. Index (%) (9.5) (19.2) (26.0) (26.2)
PkR/USD61.25
Textile vs KSE-100 Index
-10%
0%
10%
20%
30%
40%
50%
Dec-06 Mar-07 Jun-07 Sep-07 Jan-08
KSE-100 Index Textile
Companies Covered
GADT NML
0.9% weight in KSE-100 Index

37
AKD Securities LimitedJanuary 2008 Pakistan Market: 2007 - 2008
Handling volumes on the rise!
Sector Valuation & Relative Performance
Transport
Transport Sector - Valuation MultiplesFY06A FY07A FY08F FY09F
EPS (PkR) 3.20 3.64 5.55 7.47EPS growth 29% 14% 52% 34%PER (x) 21.53 18.94 12.42 9.24ROE 19% 18% 23% 25%ROA 8% 7% 9% 12%BVS (PkR) 16.44 19.95 24.47 30.08P/BVS (x) 4 .19 3.46 2.82 2.29CFS (PkR) 6.21 5.84 5.18 7.17P/CFS (x) 11.11 11.81 13.30 9.62DPS (PkR) - - 2.00 3.00Dividend yie ld 0.0% 0.0% 2.9% 4.4%Payout Ratio 0% 0% 36% 40%EV/EBITDA (x) 10.4 7.7 5.9 4.9Sector Sales as % of AKD Universe 0.1% 0.1% 0.1% 0.2%Sector NPAT as % of AKD Universe 0.1% 0.2% 0.2% 0.2%
Sector Market Cap. (US$mn) 5391M 3M 6M 12M
Absolute (%) (6.0) 9.4 (16.5) 25.4Rel. Index (%) (7.6) 8.3 (19.3) (14.6)
PkR/USD61.25
Despite gaining 25.4% in absolute terms, the transport sector underperformed the KSE-100Index by 14.6% over the past year. However, over the past three months, the transport sectorhas outperformed the KSE by 8.3%.
Price outperformance over the past three months has largely been driven by higher volumestranslating into improving profitability. Within the transport sector, PICT has posted an impressivegrowth of 37%YoY (35%QoQ) in 1QFY08 on the back of higher handling volumes, up 27%YoY.
PICT is likely to continue posting bottomline growth particularly with deepening of the KarachiPort Channel by the Karachi Port Trust in 2008. As a result, PICT will be able to handle largervessels increasing overall handling volumes.
We recommend an Accumulate stance on PICT with a target price of PkR72.0 offering anupside of 4.4% to our target price. On valuations, PICT trades at a forward PER12.4x versusthe market PER of 10.55x.
PICT vs KSE-100 Index
-10%
0%
10%
20%
30%
40%
50%
Dec-06 Mar-07 Jun-07 Sep-07 Jan-08
KSE-100 Index Transport
Company Covered
PICT
0.9% weight in KSE-100 Index
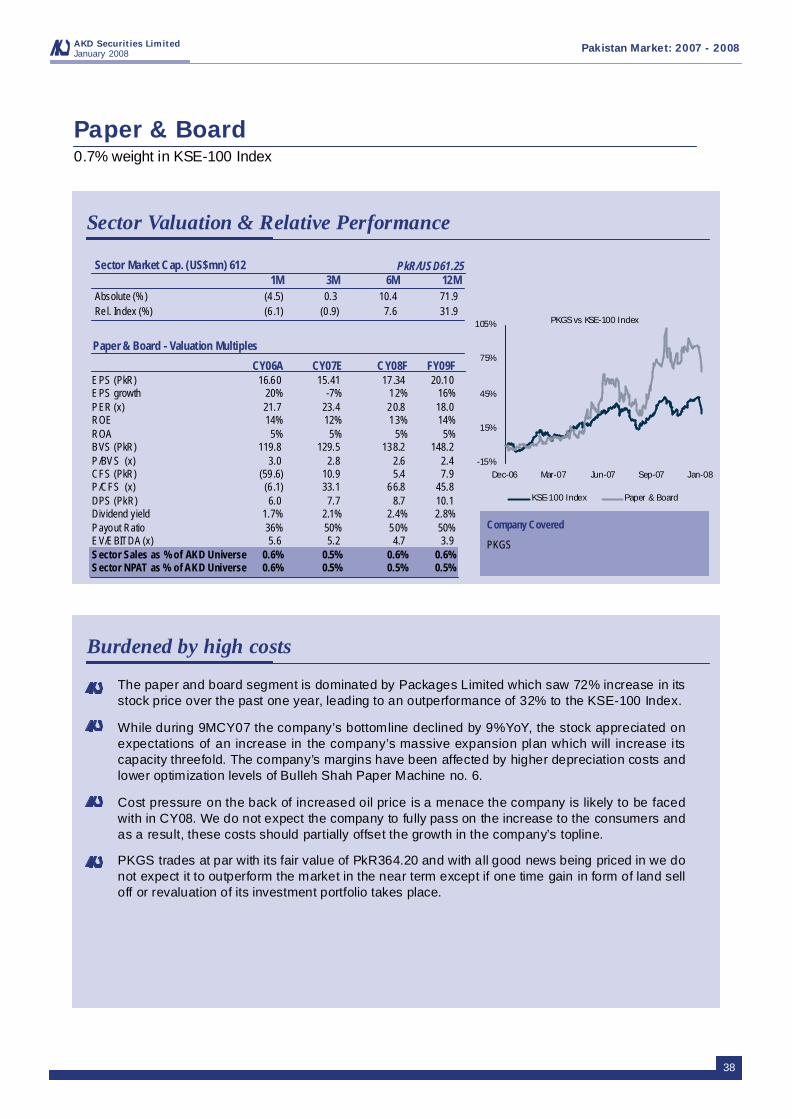
38
AKD Securities LimitedJanuary 2008 Pakistan Market: 2007 - 2008
Burdened by high costs
Sector Valuation & Relative Performance
Paper & Board
Paper & Board - Valuation Multiples
CY06A CY07E CY08F FY09FEPS (PkR) 16.60 15.41 17.34 20.10EPS growth 20% -7% 12% 16%PER (x) 21.7 23.4 20.8 18.0ROE 14% 12% 13% 14%ROA 5% 5% 5% 5%BVS (PkR) 119.8 129.5 138.2 148.2P/BVS (x) 3.0 2.8 2.6 2.4CFS (PkR) (59.6) 10.9 5.4 7.9P/CFS (x) (6 .1) 33.1 66.8 45.8DPS (PkR) 6.0 7.7 8.7 10.1Dividend yield 1.7% 2.1% 2.4% 2.8%Payout Ratio 36% 50% 50% 50%EV/EBITDA (x) 5.6 5.2 4.7 3.9Sector Sales as % of AKD Universe 0.6% 0.5% 0.6% 0.6%Sector NPAT as % of AKD Universe 0.6% 0.5% 0.5% 0.5%
Sector Market Cap. (US$mn) 6121M 3M 6M 12M
Absolute (%) (4.5) 0.3 10.4 71.9Rel. Index (%) (6.1) (0 .9) 7.6 31.9
PkR/USD61.25
PKGS vs KSE-100 Index
-15%
15%
45%
75%
105%
Dec-06 Mar-07 Jun-07 Sep-07 Jan-08
KSE-100 Index Paper & Board
The paper and board segment is dominated by Packages Limited which saw 72% increase in itsstock price over the past one year, leading to an outperformance of 32% to the KSE-100 Index..
While during 9MCY07 the company’s bottomline declined by 9%YoY, the stock appreciated onexpectations of an increase in the company’s massive expansion plan which will increase itscapacity threefold. The company’s margins have been affected by higher depreciation costs andlower optimization levels of Bulleh Shah Paper Machine no. 6.
Cost pressure on the back of increased oil price is a menace the company is likely to be facedwith in CY08. We do not expect the company to fully pass on the increase to the consumers andas a result, these costs should partially offset the growth in the company’s topline. .
PKGS trades at par with its fair value of PkR364.20 and with all good news being priced in we donot expect it to outperform the market in the near term except if one time gain in form of land selloff or revaluation of its investment portfolio takes place.
Company Covered
PKGS
0.7% weight in KSE-100 Index
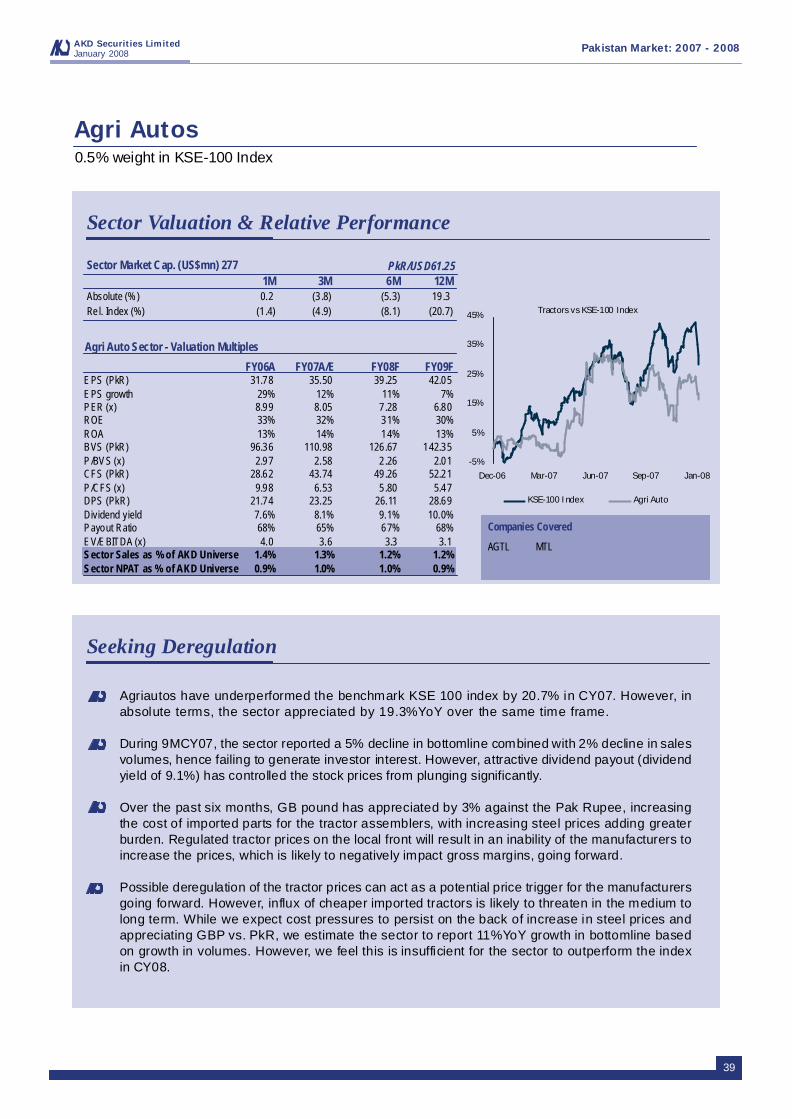
39
AKD Securities LimitedJanuary 2008 Pakistan Market: 2007 - 2008
Seeking Deregulation
Sector Valuation & Relative Performance
Agri Autos
Agri Auto Sector - Valuation Multiples
FY06A FY07A/E FY08F FY09FEPS (PkR) 31.78 35.50 39.25 42.05EPS growth 29% 12% 11% 7%PER (x) 8.99 8.05 7 .28 6.80ROE 33% 32% 31% 30%ROA 13% 14% 14% 13%BVS (PkR) 96.36 110.98 126.67 142.35P/BVS (x) 2.97 2.58 2 .26 2.01CFS (PkR) 28.62 43.74 49.26 52.21P/CFS (x) 9.98 6.53 5 .80 5.47DPS (PkR) 21.74 23.25 26.11 28.69Dividend yield 7.6% 8.1% 9.1% 10.0%Payout Ratio 68% 65% 67% 68%EV/EBITDA (x) 4.0 3.6 3.3 3.1Sector Sales as % of AKD Universe 1.4% 1.3% 1.2% 1.2%Sector NPAT as % of AKD Universe 0.9% 1.0% 1.0% 0.9%
Sector Market Cap. (US$mn) 2771M 3M 6M 12M
Absolute (%) 0.2 (3 .8) (5.3) 19.3Rel. Index (%) (1.4) (4 .9) (8.1) (20.7)
PkR/USD61.25
Tractors vs KSE-100 Index
-5%
5%
15%
25%
35%
45%
Dec-06 Mar-07 Jun-07 Sep-07 Jan-08
KSE-100 Index Agri Auto
Companies Covered
AGTL MTL
Agriautos have underperformed the benchmark KSE 100 index by 20.7% in CY07. However, inabsolute terms, the sector appreciated by 19.3%YoY over the same time frame. .
During 9MCY07, the sector reported a 5% decline in bottomline combined with 2% decline in salesvolumes, hence failing to generate investor interest. However, attractive dividend payout (dividendyield of 9.1%) has controlled the stock prices from plunging significantly.
Over the past six months, GB pound has appreciated by 3% against the Pak Rupee, increasingthe cost of imported parts for the tractor assemblers, with increasing steel prices adding greaterburden. Regulated tractor prices on the local front will result in an inability of the manufacturers toincrease the prices, which is likely to negatively impact gross margins, going forward. .
Possible deregulation of the tractor prices can act as a potential price trigger for the manufacturersgoing forward. However, influx of cheaper imported tractors is likely to threaten in the medium tolong term. While we expect cost pressures to persist on the back of increase in steel prices andappreciating GBP vs. PkR, we estimate the sector to report 11%YoY growth in bottomline basedon growth in volumes. However, we feel this is insufficient for the sector to outperform the indexin CY08.
0.5% weight in KSE-100 Index

40
AKD Securities LimitedJanuary 2008
Pakistan Market: 2007 - 2008
Top Picks for2008

Priced on January 4, 2008
KATS Code BAFL
Bloomberg Code BAFL PA
Price PkR 53.90
Market Cap (PkRmn) 35,035
Market Cap (US$mn) 572
Shares (mn) 650
1M High (PkR) 57.80
1M Low (PkR) 49.40
1Yr High (PkR) 65.10
1Yr Low (PkR) 33.15
3M Avg D Vol (shares) '000 6,539
1 Yr Avg Turnover '000 9,189
3M AD Value (US$mn) 6.0
Pakistan Market: 2007 - 2008
41
BAFL - Stock performance
1M 3M 12M
Absolute (%) -0.9 -4.3 62.6
Rel. Index (%) -2.5 -5.5 22.6
Absolute (PkR) -0.5 -2.5 20.8
PakistanBanking Sector
Bank Al-Falah Limited
Raza JafriInvestment [email protected]
January 2008AKD Securities Limited
Price-PkR53.9; target Price-PkR76.1; Potential Upside to target Price:41.2%
Buy
Deposits continue to show robust growth, exhibiting 21%YoY growth to reachPkR260bn at Sep ‘07. However, YTD deposits have grown by 9% while depositsin Sep’07 actually declined by 4%QoQ. We expect deposit growth to continueshowing slightly moderated growth going forward while management has indicatedthat focus on branch expansion is to remain for the next two years at least (additionof 40 branches p.a.).
On the advances front, growth of 12%YoY has been witnessed in Sep’07 althoughadvances have declined by PkR6.5bn from Jun ‘07 to reach PkR149bn at end3QCY07. Management believes that potential in the consumer segment is stillhigh and that the current downturn in this segment is temporary. We expect loangrowth to recover in CY08F, on the back of a resurgent corporate cycle andrecovery on the consumer side, with the ADR to inch to 61%. .
Accelerated deposit growth in tandem with high funding costs (>6%) haveunderstandably led to spreads just below 4%. Going forward, we expect fundingcosts to come down as existing branches mature and new branches enhance the‘convenience’ factor for BAFL. On this basis, we expect spreads to breach the4% barrier in CY08F and show consistent improvement going forward. We thusexpect net interest income to show CY06-CY09 CAGR of 28%.
Fee income continues to display impressive growth, increasing by 39%YoY toreach PkR643mn in 3QCY07. Growth over nine months is even more impressive;growing by 43%YoY in 9MCY07. Aided by the consumer business, we expect feeincome to further rally the bottom line, even as core income rises through improvingspreads. On a cautionary note, the normalized cost/income ratio reached a high75% in 3QCY07. If the issue is ignored, rising expenses have the potential to eatinto improving topline income but we expect management to address the matter.With regards to the new Forced Sale Value (FSV) regulation, we estimate an EPSimpact for BAFL of close to PkR0.88 for full-year CY07 due to estimated incrementalprovisioning amounting to PkR880mn.
In 3QCY07, BAFL recorded capital gains of PkR1.789bn on the sale of 48.8mnshares of Warid Telecom to Singtel. The ace up the sleeve for BAFL is theremaining stake (12.38%) in Warid Telecom where the remaining 267.957mnshares are held at a book cost of PkR2.19bn. Using the terms of the current sell-off as a proxy, these shares are potentially worth PkR12.55bn. As it stands, BAFLis sitting on a potential capital gain of PkR10.4bn, translating into a post-tax gainof PkR11.76/share!
BAFL is currently trading at a CY08F Tier-I P/B multiple of 2.1x and a CY08FPER of 9.97x. The remaining stake in Warid, if sold, represents a potential totalTier-I BVPS of PkR32.6 on which basis BAFL is trading at a Tier-I P/B multipleof just 1.7x. The scrip has outperformed the KSE-Index by 22.6% over the past12 months. As it stands, BAFL offers 41.2% upside to our target price of PkR76.10.
BAFL - Valuation MultiplesCY06A CY07E CY08F CY09F
EPS (PkR) 2.71 4.75 5.41 6.79EPS growth 4% 75% 14% 26%PER (x) 19.88 11.35 9.97 7.94P/B Tier I (x) 3.3 2.5 2.1 1.69P/B (Tier I + Tier II) (x) 2.86 2.21 1.87 1.57Tier I to Assets 3.8% 4.6% 5% 6%Market Cap to Deposits 15% 13% 12% 11%ROE (average) 17% 22% 20% 21%ROA (average) 1% 1% 1% 1%
BAFL Price & Volume Chart
20
35
50
65
Jan-07 May-07 Aug-07 Jan-08
PkR Vol (mn)
-10
2030
40
50
Vo l (mn) (RHS) BAFL (LHS)
8.0
10
20
30
40
50
60
70
Jan-05 Aug-05 Mar-06 Oct-06 May-07 Jan-08
12.0
10.0
6.0
BAFL - PER Band CY08F (x)(PkR)

42
Bank Alfalah - Annual Databank
BAFL - Valuation MultiplesYear End Dec 31 CY06A CY07E CY08F CY09FEPS (PkR) 2.71 4.75 5.41 6.79EPS growth 4% 75% 14% 26%PER (x) 19.88 11.35 9.97 7.94Tier I BVS (PkR) 16.27 21.82 26.23 31.81P/B Tier I (x) 3.3 2.5 2.1 1.69Tier II BVS (PkR) 2.57 2.57 2.57 2.57BVS (PkR) 18.83 24.39 28.80 34.38P/B (Tier I + Tier II) (x) 2.86 2.21 1.87 1.57Tier I to Assets 3.8% 4.6% 5% 6%Tier I + Tier II to Assets 4.4% 5.1% 5.6% 6.1%Loan to Deposit 63% 59% 61% 63%Yield on earning assets 9.5% 10.2% 10.1% 10.0%Cost of Funds 6.2% 6.3% 6.1% 5.9%Growth in Loan Book 26% 4% 13% 11%Growth in Deposits 8% 11% 8% 8%Spread 3.3% 3.9% 4.0% 4.1%Market Cap to Deposits 15% 13% 12% 11%Cost/Income 69% 64% 62% 59%ROE (average) 17% 22% 20% 21%ROA (average) 1% 1% 1% 1%DPS (PkR) - 1.5 2.0 2.5Dividend yield 0% 3% 4% 5%Payout Ratio 0% 32% 37% 37%
BAFL- Income Statement
AKD Securities LimitedJanuary 2008 Pakistan Market: 2007 - 2008
(In PkRmn) CY06A CY07E CY08F CY09FMark-up / return / interest earned 21,191 25,609 28,721 31,101Mark-up / return / interest expensed 15,233 16,787 17,981 18,602Net Mark-up / interest income 5,959 8,823 10,740 12,500Provision against non-performing loans and advances - net 698 2,103 966 972Bad debts written off directly 2 5 14 42Provisions 699 2,107 979 1,014Net mark-up / Interest Income after provisions 5,259 6,716 9,760 11,486Fee, commission and brokerage income 1,805 2,346 3,050 3,661Dividend income 37 47 51 57Income from dealing in foreign currencies 387 445 534 641Other income 985 1,035 1,086 1,141Total non mark-up / return / interest income 3,225 5,883 4,923 5,720Administrative expenses 5,875 8,048 9,115 10,072Other Charges 43 89 182 374Total non mark-up / interest expenses 5,918 8,137 9,297 10,446NPBT 2,566 4,461 5,386 6,760Total Tax 803 1,374 1,872 2,349NPAT 1,763 3,087 3,514 4,411

43
AKD Securities LimitedJanuary 2008
Pakistan Market: 2007 - 2008
BAFL - Balance Sheet(In PkRmn) CY06A CY07E CY08F CY09FCash and balances with treasury bank 27,859 19,295 19,630 21,343Balances with other banks 12,732 15,309 18,316 23,504Lending to financial institutions 12,457 13,834 15,047 16,339Investments 56,502 85,730 88,250 90,401Performing loans and advances 149,999 155,744 175,557 194,431Other Assets 5,633 6,889 7,493 8,136Fixed Assets 10,503 11,635 12,655 13,741Total Assets 275,686 308,437 336,948 367,896Bills payable 3,091 3,400 3,740 4,114Borrowings from financial institutions 8,394 9,234 9,926 10,671Deposits and Other Accounts 239,509 265,448 287,516 310,558Sub-ordinated loans 3,222 3,544 3,899 4,289Other Liabil ites 7,305 9,132 11,415 14,269Deferred Liabilites 1,921 1,825 1,734 1,647Total Liabilities 263,444 292,583 318,229 345,547Net Assets 12,242 15,854 18,718 22,349Share Capital 5,000 6,500 6,500 6,500Reserves 2,750 3,590 4,680 6,020Unappropriated Profits 2,823 4,095 5,869 8,160Total Tier I Equity 10,573 14,185 17,049 20,680Surplus on Revaluation of assets 1,669 1,669 1,669 1,669Total Tier II Equity 1,669 1,669 1,669 1,669Total SHEQ 12,242 15,854 18,718 22,349Total SHEQ and Liabil ities 275,686 308,437 336,948 367,896

Priced on January 4, 2008
KATS Code DGKC
Bloomberg Code DGKC PA
Price PkR 94.00
Market Cap (PkRmn) 23,832.86
Market Cap (US$mn) 389.11
Shares (mn) 253.54
1M High (PkR) 104.40
1M Low (PkR) 85.50
1Yr High (PkR) 120.00
1Yr Low (PkR) 62.25
3M Avg D Vol (shares) '000 7,991
1 Yr Avg Turnover '000 11,472
3M AD Value (US$mn) 13.41
44
Furqan AyubInvestment [email protected]
DGKC - Stock performance
1M 3M 12M
Absolute (%) -5.2 -18.5 51.0
Rel. Index (%) -6.8 -19.6 11.0
Absolute (PkR) -5.2 -21.3 31.8
PakistanCement Sector
D.G. Khan Cement
Pakistan Market: 2007 - 2008January 2008AKD Securities Limited
Price-PkR94; target Price-PkR124; Potential Upside to target Price:31.9%
Buy
Cement sector is completing an expansionary phase with annual capacity in FY08expected to reach 38mn tpa versus 30mn tpa in FY07. The recent demand trendhas remained robust with total dispatches in the industry surging by 32%YoY in5MFY08. DGKC's total dispatches in 5MFY08 amounted to 1.64mn tons, depictinga growth rate of 71%YoY. Domestic demand is likely to remain robust over themedium term considering Pakistan's low capita consumption, large populationand 6% plus GDP growth. Exports should continue to elevate the growth rate asconstruction boom coupled with infrastructure developments in India, Middle Eastand Afghanistan are likely to keep Pakistani cement manufacturers busy in thelong run
While the 1HFY08 results are likely to be a dampener on the stock price owingto increased costs and low retention prices, the real impact of increase in pricesis likely to become obvious in 3QFY08 onwards. Furthermore, with DGKC expectedto take export exposure to complement the company's domestic lionshare, weexpect a 3-year volume CAGR of 25%. With volumes taking care of their end ofthe equation, we expect a "price consensus" to take care of the rising input costand improve overall margins.
In November 07, DGKC sold nearly 40k tons to India and has targeted 300k tonsof export to India for FY08. This will help in improving gross margin since averageretention prices from Indian sales are around US$65/ton. We believe shortagein India is likely to persist till FY10 after which major capacity expansions comeonline. However for now cement manufacturers in Pakistan have enough idlecapacity to step in and contribute to reducing the demand supply gap in India.Prices on the local front have gradually improved by PkR35/ per bag as it wasbecoming increasingly difficult for cement manufacturers to absorb the rise ininput costs at previous prices. Retail prices have gone up to PkR225-PkR230 perbag in the North and PkR245-PkR250 per bag in South. We expect prices togradually improve as the demand rides a seasonal upturn from 3QFY08 onwards.
In line with the industry's price performance, over the past one year, DGKC's priceappreciated by 11% relative to the market. The performance could have beenmuch better was it not for the disappointing quarterly results, which resulted inthe company underperforming the index by 19.6% since the announcement ofthe 1HFY07 results. At current market price, the stock trades at FY08 PER of13.9x and P/B of 0.7x versus the regional average PER of 21x. However, DGKC'score EV/ton of US$47 is significantly less than the regional average of US$183.
DGKC - Valuation MultiplesFY06A FY07A FY08F FY09F
EPS (PkR) 9.54 6.40 6.74 9.82EPS growth 43.8% -33% 5% 46%PER (x) 9.9 14.7 13.9 9.6ROE 13% 5% 5% 7%P/BVS (x) 1.2 0.7 0.7 0.6Dividend yield 1.6% 1.6% 2.1% 2.7%EV/Ebitda (x) 3.2 5.6 4.0 3.3
DKGC - FY08F Per Band
20406080
100120140
Jul-04 Mar-05 Nov-05 Aug-06 Apr-07 Jan-08
(x)PkR
14 12 10 8
DKGC Price & Volume Chart
50
65
80
95
110
125
Jan-07 May-07 Aug-07 Jan-08
PkR Vol (mn)
10
20
30
40
50
60
Vol (mn) RHS DGKC (LHS)
-

45
Pakistan Market: 2007 - 2008January 2008AKD Securities Limited
DGKC - Cashflow Statement(In PkRmn) FY06A FY07A FY08F FY09F C.F from Operating Activities 4,196 1,587 2,625 3,407C.F from Investing Activities (8,945) (1,499) (12) 448C.F from Financing Activities 4,732 (64) (2,656) (3,202)Net change in cash (17) 24 (44) 652Beginning cash balance 94 77 101 57Ending cash balance 77 101 57 709
DGKC - Key Ratios FY06A FY07A FY08F FY09F
Sales growth 51% -19% 79% 18%Gross profit margin 50% 32% 27% 29%EBITDA margin 52% 37% 29% 30%Net profit margin 30% 25% 15% 18%L.T debt/Equity 38% 26% 27% 16%Current Ratio (x) 1.6 2.6 3.7 2.9ROE 13% 5% 5% 7%ROA 15% 9% 12% 14%
DGKC - Balance Sheet(In PkRmn) FY06A FY07A FY08F FY09F Current assets 9,910 10,161 10,165 10,973Operating assets 19,576 21,041 20,792 20,141Total assets 34,304 51,744 51,944 51,842Current liabil ities 6,015 4,868 4,045 3,371Long-term Debt 7,401 8,732 7,243 5,452Other long term liabilities 34 1,093 593 593Shareholders equity 19,268 21,327 23,895 26,515Total equity and libili ties 34,304 36,020 35,776 35,932
DGKC - Income Statement(In PkRmn) FY06A FY07A FY08F FY09FSales 7,956 7,776 9,716 11,444Cost of sales 3,993 4,660 5,485 6,206Gross profit 3,963 3,116 4,231 5,237Operating expenses 156 156 194 229Operating profit 3,807 2,960 4,037 5,008EBITDA 4,151 3,695 4,786 5,760Financial charges 460 1,121 1,013 1,115Other income/(expenses) 294 441 496 557Profit before tax 3,640 2,280 3,520 4,450Taxation 1,030 730 952 1,196Net Profit 2,418 1,551 2,568 3,254
D.G. Khan Cement - Annual Databank

Priced on January 4, 2008
KATS Code ENGRO
Bloomberg Code ENGRO PA
Price PkR 262.50
Market Cap (PkRmn) 50,786
Market Cap (US$mn) 829
Shares (mn) 193.47
1M High (PkR) 281.50
1M Low (PkR) 241.00
1Yr High (PkR) 296.70
1Yr Low (PkR) 158.65
3M Avg D Vol (shares) '000 5,040
1 Yr Avg Turnover '000 4,089
3M AD Value (US$mn) 23
Pakistan Market: 2007 - 2008
46
Faiza NaeemInvestment [email protected]
ENGRO - Stock performance
1M 3M 12M
Absolute (%) -5.0 -11.5 59.2
Rel. Index (%) -6.6 -12.7 19.2
Absolute (PkR) -14.0 -34.2 97.6
PakistanFertilizer Sector
Engro Chemical Limited
Urea demand reported flat growth during CY07 as a result of carryover inventory atdealer level at the beginning of the year. During the year, the local companies benefitedfrom r is ing international prices as well as strong pricing power on the local frontHowever, going forward, in a supply constrained market local fertilizer companies arelikely to benefit from increasing urea prices which while subsidized following theinternational trend for CY08, we expect 4%YoY increase in urea prices. Strong pricingpower and improved other income for most fertilizer companies is likely to drive earningsgrowth of the fertilizer sector.
Engro Chemicals is well placed to encash upon its status as a conglomerate throughexploiting the growth in demand for urea, FMCG and power segments through aggressiveexpansions. Furthermore the company is also increasing the capacity of Engro Polymer,Engro's 80% owned subsidiary which is likely to come online in the 2HCY08. EngroPolymer is expected to be listed separately after the company issues an IPO in March08. While this may not change the fundamental value of Engro Chemicals, it is likelyto act as a significant price trigger for the stock.
Strong pricing power of the companies is likely to allow them to pass on input cost (gasprices increased by 6% in January 08) increases to consumers. As a result, we expectthe margins to remain stable for most fertilizer companies if not improve any further.
4QCY07 results are likely to act as a potential short term trigger for the stock. Engro's4QCY07 bottomline is likely to be enhanced on the back of higher dividend from EngroEximp, Engro's subsidiary involved in marketing DAP. Increased sales of DAP as wellas inventory gains as a result of continuous rise in the international DAP prices arelikely to result in enhanced 4QCY07 results (Engro will book dividends from both thequarters in the 4QCY07), translating into higher dividends for Engro Chemicals. As aresult, Engro Chemicals can potentially report an EPS of PkR6.5 to PkR7.5, the highestever being reported by the company in a quarter. Furthermore, plant shut down ofFFBL during 1QCY07 should provide opportunity for Engro to import greater quantityof DAP and cash upon inventory gains on the back of expected continuous increasein DAP prices.
Engro outperformed the benchmark KSE-100 index by 19.2% over the past 12 monthsand should continue to perform on the back of the value the stock holds in form ofEngro Foods as well as news flow regarding the IPO of Engro Polymer. While thecompany's NPAT is likely to grow at a meager rate of 3% till CY09, once the expansioncomes online Engro's 4-year (CY09-CY15) earnings CAGR is likely to increase up to25%, translating into a PEG ratio of 0.81.
January 2008AKD Securities Limited
Price-PkR262.5; target Price-PkR350; Potential Upside to target Price:33.3%
Buy
ENGRO - Valuation MultiplesCY06A CY07E CY08F CY09F
EPS (PkR) 13.17 13.73 13.77 14.51EPS growth 9.8% 4.3% 0.3% 5.4%PER (x) 19.9 19.1 19.1 18.1ROE 27% 19% 14% 13%P/BVS (x) 5.4 3.6 2.6 2.4Dividend yield 3.4% 1.8% 1.8% 1.9%EV/Ebitda (x) 8.2 7.2 6.7 6.4
ENGRO - PER Band (CY08F)
70100130160190220250280
Jan-04 Oct-04 Aug-05 Jun-06 Mar-07 Jan-08
(x)(PkR)
18 16 14 12
ENGRO Price & Volume Chart
120
160
200
240
280
320
Jan-07 May-07 Aug-07 Jan-08
PkR Vol (mn)
-2
6
10
14
18
Vol (mn) RHS ENGRO (LHS)

Pakistan Market: 2007 - 2008
47
January 2008AKD Securities Limited
Engro Chemicals - Annual Databank
ENGRO - Income Statement(In PkRmn) CY06A CY07E CY08F CY09FNet Revenues 17,602 19,789 22,434 24,410COGS 13,365 14,762 17,017 18,814Gross Profit 4,237 5,027 5,417 5,596Distribution expenses 1,482 1,609 1,778 1,926Other expenses 287 321 347 354Other income 1,339 1,159 1,311 1,374
Financial charges 363 626 961 879Profit before tax 3,445 3,630 3,642 3,811Taxation 897 974 978 1,003Net Profit 2,547 2,656 2,664 2,808
ENGRO - Balance Sheet(In PkRmn) CY06A CY07E CY08F CY09FCurrent assets 5,684 9,898 8,597 8,389Operating assets 10,296 15,683 30,762 48,773
Total assets 15,981 25,581 39,359 57,161Current liabilities 3,642 2,434 1,732 4,038Long term liabili ties 2,968 9,168 18,350 32,009Shareholders equity 9,370 13,978 19,276 21,114Total equity and liabili ties 15,981 25,581 39,359 57,161
ENGRO - Cashflow Statement(In PkRmn) CY06A CY07E CY08F CY09FCashflow from Operating Activities 1,380 2,713 1,568 1,973
Cashflow from Investing Activities (689) (4,713) (14,627) (17,444)Cashflow from Financing Activities (1,238) 6,564 10,991 14,863Net change in cash (547) 4,564 (2,067) (608)Ending cash balance 1,805 6,369 4,302 3,694
ENGRO - Key RatiosCY06A CY07E CY08F CY09F
Sales growth -4% 12% 13% 9%Gross profit margin 24% 25% 24% 23%Net profit margin 14% 13% 12% 12%EBITDA margin 25% 24% 23% 21%Return on assets 16% 10% 7% 5%
Return on equity 27% 19% 14% 13%LT debt/Equity 19% 57% 89% 129%Debt/Equity Ratio 45% 64% 90% 140%Current Ratio (x) 1.56 4.07 4.96 2.08
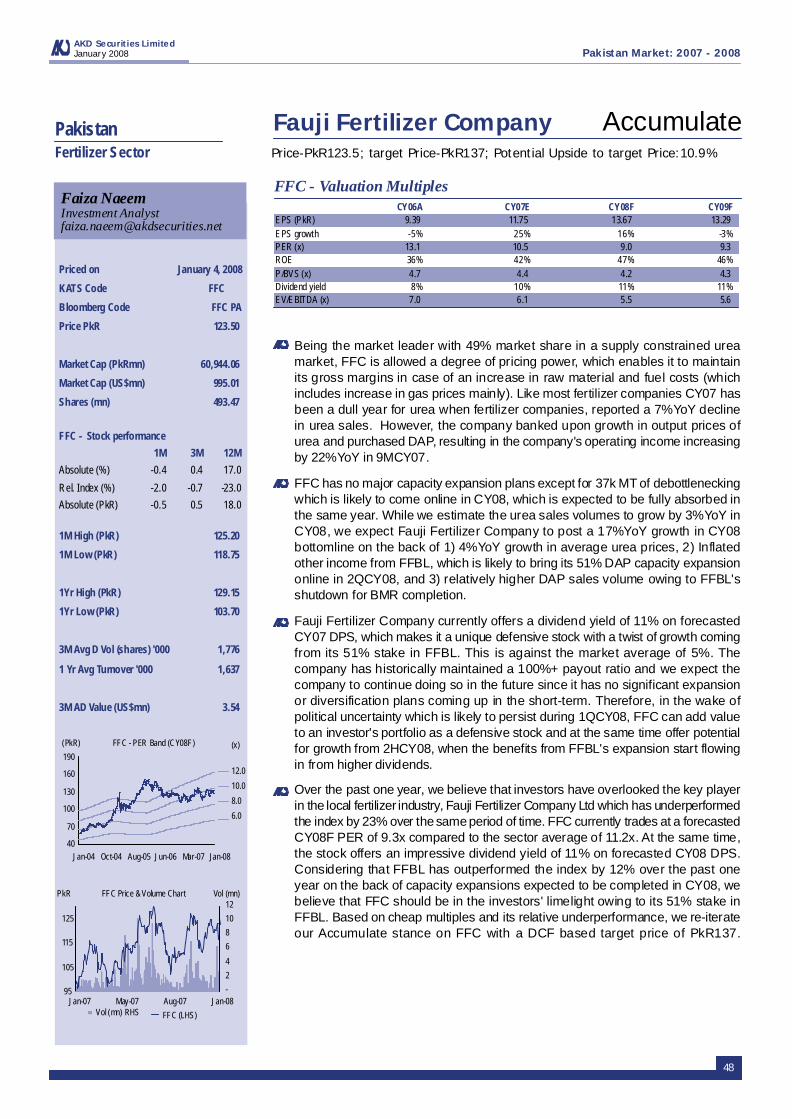
Priced on January 4, 2008
KATS Code FFC
Bloomberg Code FFC PA
Price PkR 123.50
Market Cap (PkRmn) 60,944.06
Market Cap (US$mn) 995.01
Shares (mn) 493.47
1M High (PkR) 125.20
1M Low (PkR) 118.75
1Yr High (PkR) 129.15
1Yr Low (PkR) 103.70
3M Avg D Vol (shares) '000 1,776
1 Yr Avg Turnover '000 1,637
3M AD Value (US$mn) 3.54
48
Faiza NaeemInvestment [email protected]
FFC - Stock performance
1M 3M 12M
Absolute (%) -0.4 0.4 17.0
Rel. Index (%) -2.0 -0.7 -23.0
Absolute (PkR) -0.5 0.5 18.0
PakistanFertilizer Sector
Fauji Fertilizer Company
Pakistan Market: 2007 - 2008January 2008AKD Securities Limited
Price-PkR123.5; target Price-PkR137; Potential Upside to target Price:10.9%
Accumulate
FFC - Valuation MultiplesCY06A CY07E CY08F CY09F
EPS (PkR) 9.39 11.75 13.67 13.29EPS growth -5% 25% 16% -3%PER (x) 13.1 10.5 9.0 9.3ROE 36% 42% 47% 46%P/BVS (x) 4.7 4.4 4.2 4.3Dividend yield 8% 10% 11% 11%EV/EBITDA (x) 7.0 6.1 5.5 5.6
Being the market leader with 49% market share in a supply constrained ureamarket, FFC is allowed a degree of pricing power, which enables it to maintainits gross margins in case of an increase in raw material and fuel costs (whichincludes increase in gas prices mainly). Like most fertilizer companies CY07 hasbeen a dull year for urea when fertilizer companies, reported a 7%YoY declinein urea sales. However, the company banked upon growth in output prices ofurea and purchased DAP, resulting in the company's operating income increasingby 22%YoY in 9MCY07.
FFC has no major capacity expansion plans except for 37k MT of debottleneckingwhich is likely to come online in CY08, which is expected to be fully absorbed inthe same year. While we estimate the urea sales volumes to grow by 3%YoY inCY08, we expect Fauji Fertilizer Company to post a 17%YoY growth in CY08bottomline on the back of 1) 4%YoY growth in average urea prices, 2) Inflatedother income from FFBL, which is likely to bring its 51% DAP capacity expansiononline in 2QCY08, and 3) relatively higher DAP sales volume owing to FFBL'sshutdown for BMR completion.
Fauji Fertilizer Company currently offers a dividend yield of 11% on forecastedCY07 DPS, which makes it a unique defensive stock with a twist of growth comingfrom its 51% stake in FFBL. This is against the market average of 5%. Thecompany has historically maintained a 100%+ payout ratio and we expect thecompany to continue doing so in the future since it has no significant expansionor diversification plans coming up in the short-term. Therefore, in the wake ofpolitical uncertainty which is likely to persist during 1QCY08, FFC can add valueto an investor's portfolio as a defensive stock and at the same time offer potentialfor growth from 2HCY08, when the benefits from FFBL's expansion start flowingin from higher dividends.
Over the past one year, we believe that investors have overlooked the key playerin the local fertilizer industry, Fauji Fertilizer Company Ltd which has underperformedthe index by 23% over the same period of time. FFC currently trades at a forecastedCY08F PER of 9.3x compared to the sector average of 11.2x. At the same time,the stock offers an impressive dividend yield of 11% on forecasted CY08 DPS.Considering that FFBL has outperformed the index by 12% over the past oneyear on the back of capacity expansions expected to be completed in CY08, webelieve that FFC should be in the investors' limelight owing to its 51% stake inFFBL. Based on cheap multiples and its relative underperformance, we re-iterateour Accumulate stance on FFC with a DCF based target price of PkR137.
FFC - PER Band (CY08F)
40
70
100
130
160
190
Jan-04 Oct-04 Aug-05 Jun-06 Mar-07 Jan-08
(x)(PkR)
12.0
10.0
8.0
6.0
FFC Price & Volume Chart
95
105
115
125
Jan-07 May-07 Aug-07 Jan-08
PkR
Vol (mn) RHS FFC (LHS)
Vol (mn)
-
2
4
6
8
10
12

Pakistan Market: 2007 - 2008
49
January 2008AKD Securities Limited
Fauji Fertilizer Company - Annual Databank
FFC - Balance Sheet(In PkRmn) CY06A CY07E CY08F CY09FCurrent assets 9,765 10,591 9,306 9,501Operating assets 17,666 17,456 18,491 18,148Total assets 27,430 28,047 27,797 27,648Current liabil ities 10,884 11,586 11,201 11,465Long term liabilities 3,590 2,531 2,191 1,872Shareholders equity 12,957 13,930 14,405 14,311Total equity and liabilities 27,430 28,047 27,797 27,648
FFC- Income Statement(In PkRmn) CY06A CY07E CY08F CY09FNet Revenues 29,951 36,695 38,627 41,492COGS 20,242 25,693 27,213 29,607Gross Profit 9,709 11,002 11,414 11,885Distribution expenses 2,747 3,353 3,694 4,087Other expenses 735 755 776 797Other income 1,276 1,896 2,864 2,562Financial charges 517 507 380 301Profit before tax 6,985 8,283 9,427 9,263Taxation 2,349 2,486 2,681 2,704Net Profit 4,636 5,796 6,747 6,559
FFC - Cashflow Statement(In PkRmn) CY06A CY07E CY08F CY09FCashflow from Operating Activites (396) 4,698 4,745 4,833Cashflow from Investing Activities (354) 3,770 985 2,047Cashflow from Financing Activites (2,555) (6,060) (7,340) (7,028)Net change in cash (3,305) 2,408 (1,610) (148)Ending cash balance 1,623 4,031 2,421 2,273
FFC - Key RatiosCY06A CY07E CY08F CY09F
Sales growth 18% 23% 5% 7%Operating margin 25% 24% 25% 23%Net profit margin 15% 16% 17% 16%LT debt/Equity 9% 4% 7% 3%Current Ratio (x) 90% 91% 83% 83%ROE 36% 42% 47% 46%ROA 17% 21% 24% 24%

50
Raza JafriInvestment [email protected]
PakistanBanking Sector
Habib Bank Limited
Habib Bank Ltd.Listed on main KSE on September 24, 2007
Priced on January 4, 2008
KATS Code HBL
Bloomberg Code HBL PA
Price PkR 235.80
Market Cap (PkRmn) 162,702.00
Market Cap (US$mn) 2,656.36
Shares (mn) 690.00
Data since Listing:
Avg Turnover '000 2,193
Avg Daily T.D Val (US$mn) 7.5
High (PkR) 298.70
Low (PkR) 218.00
Pakistan Market: 2007 - 2008January 2008AKD Securities Limited
Price-PkR235.8; target Price-PkR355; Potential Upside to target Price:50.6%
Buy
HBL - Stock performance
1M 3M
Absolute (%) -8.4 -20.7
Rel. Index (%) -10.0 -21.9
Absolute (PkR) -21.6 -61.7
HBL - Valuation MultiplesCY06A CY07E CY08F CY09F
EPS (PkR) 20.69 17.97 24.37 28.11EPS growth 60% -13% 36% 15%PER (x) 11.40 13.12 9.67 8.39PB Tier I (x) 3.6 3.7 2.8 2.2P/B (Tier I + Tier I I) (x) 3.1 3.1 2.4 2.0Tier I to Assets 8% 7% 8% 10%Market Cap to Deposits 37% 32% 30% 28%ROE 31% 24% 28% 26%ROA 3% 2% 3% 3%
As characterized by the rest of the sector, deposit growth at 23%YoY has beenstrong for HBL this year, deposits having reached PkR506bn in Sep’07. Advancesgrowth has been relatively modest, at 6.17%YoY in the nine months to Sep’07.Advances have reached PkR327bn in 3QCY07, leaving the ADR at 65%. Goingforward, we expect HBL to be a prime beneficiary as the corporate borrowingcycle picks speed, as the Bank’s high equity size implies high per-party exposure.In tandem with further expansion in the consumer financing space (through creditcards), we expect the ADR to reach close to 70% by CY08F end. .
A strong deposit franchise continues to manifest through the largest branchnetwork in Pakistan (more than 1400 domestic branches). As a result, HBLcontinues to enjoy high spreads of close to 6%. With growth focus on retail depositsand recent entry into high-yielding consumer segments, we expect spreads to bemaintained above 6% going forward. On the non-core income side, HBL’ feeincome has declined by 5.5%YoY in 9MCY07. We expect a significant improvementon this front as the bank develops its consumer financing portfolio. .
Recent poor price performance of HBL (the scrip has underperformed the KSE-100 Index by 10.0% over the last month) is attributable in part to asset qualityfears, with the bank expected to face incremental provisioning of more thanPkR4bn in full-year CY07, due to the new FSV regulation. However, investorsentiment also seems to have been damaged due to the bank reversing a sizeablecapital gain (of PkR9.8bn) of mark-to-market of an associate in 3QCY07. Thatsaid, the FSV rule has no cash-flow impact, leaving fundamentals intact and thecapital gain u-turn in 3QCY07 simply reverses the gain booked in 2QCY07. Withstrong provisions built-in, we expect the quality of 2008 earnings to significantlyimprove, especially as HBL looks to flex its lending muscle.
The story of HBL is all about the restructuring process. We expect expenses tonormalize on the back of completed Voluntary Separation Scheme (for CY06 andCY05 the pre-tax VSS expense per share has been PkR2.5 and PkR2.3respectively). At the same time, we remain admirers of HBL’s solid topline wherebyan efficient deposit base leads to high spreads and consequently high profitability.Further penetration of the consumer financing space through credit cards andmore focus on SMEs represent potentially high-reward growth areas. Executionefficiency is key for HBL whereby the Bank is ahead of other newly-privatizedpeer banks in the upgrade of IT infrastructure.
In light of recent poor price performance, we expect a turnaround as HBL’s distinctadvantages such as low funding costs (<4%), large customer base (more than5mn customers, translating into significant cross-sell opportunities) and a solidbrand name manifest themselves going forward. HBL is currently trading at aCY08F Tier-I P/B multiple of 2.8x and a CY08F PER of 9.67x. The scrip offers50.6% upside to our target price of PkR355. Buy!
HBL Price & Volume Chart
200215230245260275290
305
24-Sep 22-Oct 14-Nov 6-Dec 3-Jan
PkR
-
Vol (mn)(RHS) HBL (LHS)
Vol (mn)
2468101214
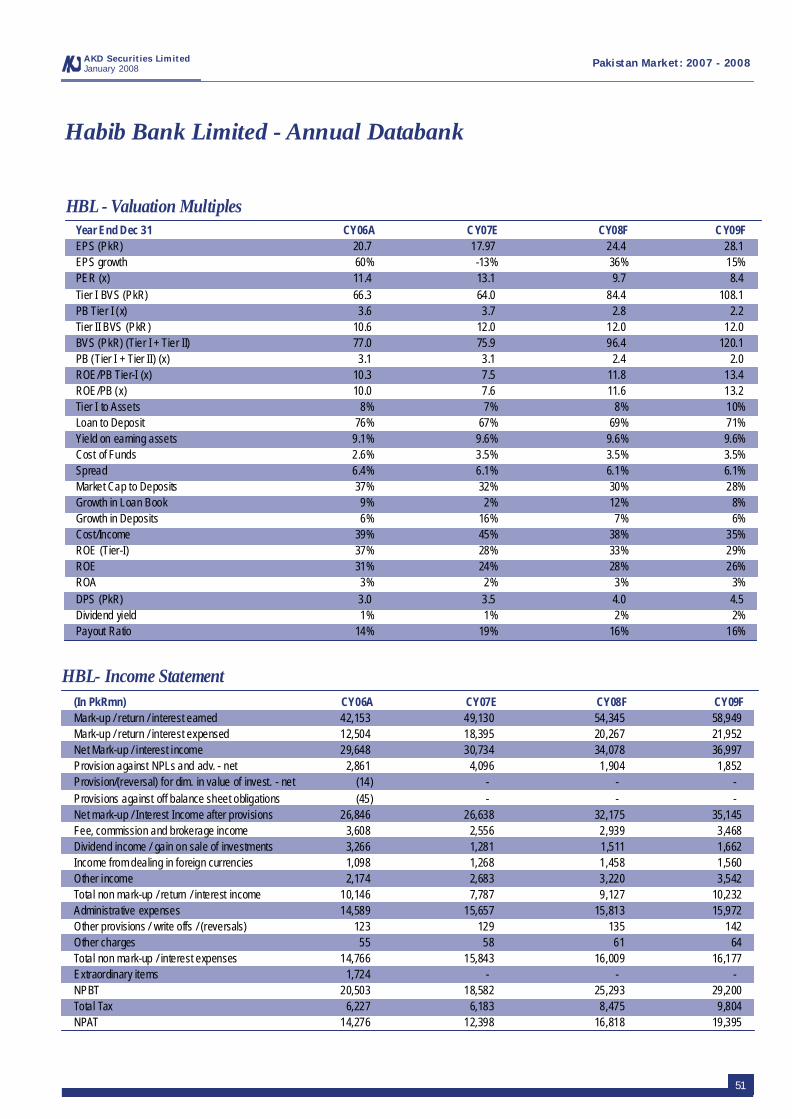
51
Habib Bank Limited - Annual Databank
HBL - Valuation MultiplesYear End Dec 31 CY06A CY07E CY08F CY09FEPS (PkR) 20.7 17.97 24.4 28.1EPS growth 60% -13% 36% 15%PER (x) 11.4 13.1 9.7 8.4Tier I BVS (PkR) 66.3 64.0 84.4 108.1PB Tier I (x) 3.6 3.7 2.8 2.2Tier II BVS (PkR) 10.6 12.0 12.0 12.0BVS (PkR) (Tier I + Tier II) 77.0 75.9 96.4 120.1PB (Tier I + Tier II) (x) 3.1 3.1 2.4 2.0ROE/PB Tier-I (x) 10.3 7.5 11.8 13.4ROE/PB (x) 10.0 7.6 11.6 13.2Tier I to Assets 8% 7% 8% 10%Loan to Deposit 76% 67% 69% 71%Yield on earning assets 9.1% 9.6% 9.6% 9.6%Cost of Funds 2.6% 3.5% 3.5% 3.5%Spread 6.4% 6.1% 6.1% 6.1%Market Cap to Deposits 37% 32% 30% 28%Growth in Loan Book 9% 2% 12% 8%Growth in Deposits 6% 16% 7% 6%Cost/Income 39% 45% 38% 35%ROE (Tier-I) 37% 28% 33% 29%ROE 31% 24% 28% 26%ROA 3% 2% 3% 3%DPS (PkR) 3.0 3.5 4.0 4.5Dividend yield 1% 1% 2% 2%Payout Ratio 14% 19% 16% 16%
AKD Securities LimitedJanuary 2008 Pakistan Market: 2007 - 2008
HBL- Income Statement(In PkRmn) CY06A CY07E CY08F CY09FMark-up / return / interest earned 42,153 49,130 54,345 58,949Mark-up / return / interest expensed 12,504 18,395 20,267 21,952Net Mark-up / interest income 29,648 30,734 34,078 36,997Provision against NPLs and adv. - net 2,861 4,096 1,904 1,852Provision/(reversal) for dim. in value of invest. - net (14) - - -Provisions against off balance sheet obligations (45) - - -Net mark-up / Interest Income after provisions 26,846 26,638 32,175 35,145Fee, commission and brokerage income 3,608 2,556 2,939 3,468Dividend income / gain on sale of investments 3,266 1,281 1,511 1,662Income from dealing in foreign currencies 1,098 1,268 1,458 1,560Other income 2,174 2,683 3,220 3,542Total non mark-up / return / interest income 10,146 7,787 9,127 10,232Administrative expenses 14,589 15,657 15,813 15,972Other provisions / write offs / (reversals) 123 129 135 142Other charges 55 58 61 64Total non mark-up / interest expenses 14,766 15,843 16,009 16,177Extraordinary items 1,724 - - -NPBT 20,503 18,582 25,293 29,200Total Tax 6,227 6,183 8,475 9,804NPAT 14,276 12,398 16,818 19,395
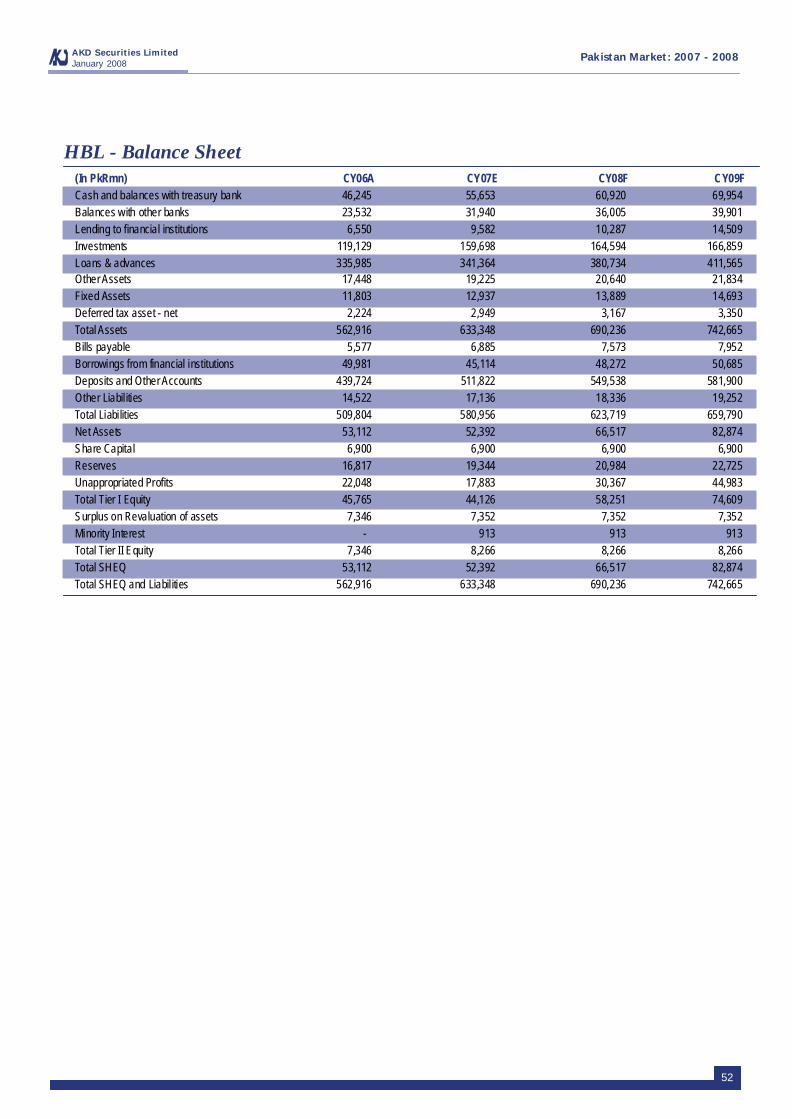
52
AKD Securities LimitedJanuary 2008
Pakistan Market: 2007 - 2008
HBL - Balance Sheet(In PkRmn) CY06A CY07E CY08F CY09FCash and balances with treasury bank 46,245 55,653 60,920 69,954Balances with other banks 23,532 31,940 36,005 39,901Lending to financial institutions 6,550 9,582 10,287 14,509Investments 119,129 159,698 164,594 166,859Loans & advances 335,985 341,364 380,734 411,565Other Assets 17,448 19,225 20,640 21,834Fixed Assets 11,803 12,937 13,889 14,693Deferred tax asset - net 2,224 2,949 3,167 3,350Total Assets 562,916 633,348 690,236 742,665Bills payable 5,577 6,885 7,573 7,952Borrowings from financial institutions 49,981 45,114 48,272 50,685Deposits and Other Accounts 439,724 511,822 549,538 581,900Other Liabil ities 14,522 17,136 18,336 19,252Total Liabilities 509,804 580,956 623,719 659,790Net Assets 53,112 52,392 66,517 82,874Share Capital 6,900 6,900 6,900 6,900Reserves 16,817 19,344 20,984 22,725Unappropriated Profits 22,048 17,883 30,367 44,983Total Tier I Equity 45,765 44,126 58,251 74,609Surplus on Revaluation of assets 7,346 7,352 7,352 7,352Minority Interest - 913 913 913Total Tier II Equity 7,346 8,266 8,266 8,266Total SHEQ 53,112 52,392 66,517 82,874Total SHEQ and Liabil ities 562,916 633,348 690,236 742,665
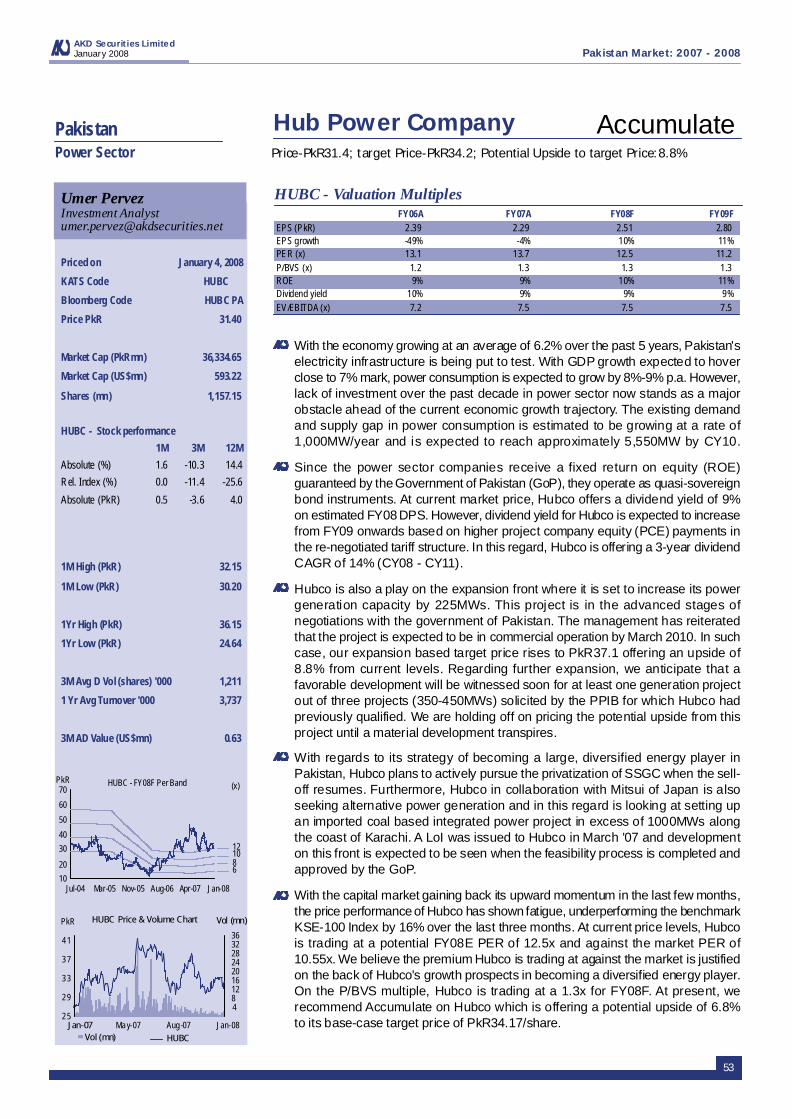
Priced on January 4, 2008
KATS Code HUBC
Bloomberg Code HUBC PA
Price PkR 31.40
Market Cap (PkRmn) 36,334.65
Market Cap (US$mn) 593.22
Shares (mn) 1,157.15
1M High (PkR) 32.15
1M Low (PkR) 30.20
1Yr High (PkR) 36.15
1Yr Low (PkR) 24.64
3M Avg D Vol (shares) '000 1,211
1 Yr Avg Turnover '000 3,737
3M AD Value (US$mn) 0.63
53
Umer PervezInvestment [email protected]
HUBC - Stock performance
1M 3M 12M
Absolute (%) 1.6 -10.3 14.4
Rel. Index (%) 0.0 -11.4 -25.6
Absolute (PkR) 0.5 -3.6 4.0
PakistanPower Sector
Hub Power Company
Pakistan Market: 2007 - 2008January 2008AKD Securities Limited
Price-PkR31.4; target Price-PkR34.2; Potential Upside to target Price:8.8%
Accumulate
HUBC - Valuation MultiplesFY06A FY07A FY08F FY09F
EPS (PkR) 2.39 2.29 2.51 2.80EPS growth -49% -4% 10% 11%PER (x) 13.1 13.7 12.5 11.2P/BVS (x) 1.2 1.3 1.3 1.3ROE 9% 9% 10% 11%Dividend yield 10% 9% 9% 9%EV/EBITDA (x) 7.2 7.5 7.5 7.5
With the economy growing at an average of 6.2% over the past 5 years, Pakistan'selectricity infrastructure is being put to test. With GDP growth expected to hoverclose to 7% mark, power consumption is expected to grow by 8%-9% p.a. However,lack of investment over the past decade in power sector now stands as a majorobstacle ahead of the current economic growth trajectory. The existing demandand supply gap in power consumption is estimated to be growing at a rate of1,000MW/year and is expected to reach approximately 5,550MW by CY10.
Since the power sector companies receive a fixed return on equity (ROE)guaranteed by the Government of Pakistan (GoP), they operate as quasi-sovereignbond instruments. At current market price, Hubco offers a dividend yield of 9%on estimated FY08 DPS. However, dividend yield for Hubco is expected to increasefrom FY09 onwards based on higher project company equity (PCE) payments inthe re-negotiated tariff structure. In this regard, Hubco is offering a 3-year dividendCAGR of 14% (CY08 - CY11).
Hubco is also a play on the expansion front where it is set to increase its powergeneration capacity by 225MWs. This project is in the advanced stages ofnegotiations with the government of Pakistan. The management has reiteratedthat the project is expected to be in commercial operation by March 2010. In suchcase, our expansion based target price rises to PkR37.1 offering an upside of8.8% from current levels. Regarding further expansion, we anticipate that afavorable development will be witnessed soon for at least one generation projectout of three projects (350-450MWs) solicited by the PPIB for which Hubco hadpreviously qualified. We are holding off on pricing the potential upside from thisproject until a material development transpires.
With regards to its strategy of becoming a large, diversified energy player inPakistan, Hubco plans to actively pursue the privatization of SSGC when the sell-off resumes. Furthermore, Hubco in collaboration with Mitsui of Japan is alsoseeking alternative power generation and in this regard is looking at setting upan imported coal based integrated power project in excess of 1000MWs alongthe coast of Karachi. A LoI was issued to Hubco in March '07 and developmenton this front is expected to be seen when the feasibility process is completed andapproved by the GoP.
With the capital market gaining back its upward momentum in the last few months,the price performance of Hubco has shown fatigue, underperforming the benchmarkKSE-100 Index by 16% over the last three months. At current price levels, Hubcois trading at a potential FY08E PER of 12.5x and against the market PER of10.55x. We believe the premium Hubco is trading at against the market is justifiedon the back of Hubco's growth prospects in becoming a diversified energy player.On the P/BVS multiple, Hubco is trading at a 1.3x for FY08F. At present, werecommend Accumulate on Hubco which is offering a potential upside of 6.8%to its base-case target price of PkR34.17/share.
HUBC - FY08F Per Band
10
20
30
40
50
60
70
Jul-04 Mar-05 Nov-05 Aug-06 Apr-07 Jan-08
(x)PkR
12 10 8 6
HUBC Price & Volume Chart
25
29
33
37
41
Jan-07 May-07 Aug-07 Jan-08
PkR Vol (mn)
Vol (mn) HUBC
4812162024283236

Pakistan Market: 2007 - 2008
54
January 2008AKD Securities Limited
Hub Power Company - Annual Databank
HUBC - Balance Sheet(In PkRmn) FY06A FY07A FY08F FY09FCurrent assets 10,186 13,126 10,278 10,638Operating assets 33,325 31,862 30,392 29,042Total assets 43,515 44,994 40,865 39,885Current liabil ities 4,265 7,652 4,775 4,775Long-term Debt 9,250 8,271 7,292 6,313Other Liabil ities 15 18 18 20Shareholders equity 29,985 29,052 28,780 28,778Total equity and libilities 43,515 44,994 40,865 39,885
HUBC- Income Statement(In PkRmn) FY06A FY07A FY08F FY09FNet sales 27,911 44,131 30,881 31,067Cost of sales 23,564 39,967 26,403 26,418Gross profit 4,348 4,164 4,478 4,649Operating expenses 270 253 326 358Operating profit 4,078 3,911 4,152 4,291Financial charges 1,577 1,417 1,279 1,133Other income/(expenses) 268 161 37 80Profit before tax 2,768 2,654 2,910 3,238Net Profit 2,768 2,654 2,910 3,238
HUBC - Cashflow Statement(In PkRmn) FY06A FY07A FY08F FY09FCashflow from Operating Activities 3,889 78 8,319 4,601Cashflow from Financial Activities (6,648) (4,568) (6,252) (4,217)Net change in cash (2,675) (4,710) 1,910 350Beginning cash balance 6,038 3,363 743 2,653Ending cash balance 3,363 (1,347) 2,653 3,002
HUBC - Key Ratios FY06A FY07A FY08F FY09F
Sales growth 64% 58% -30% 1%Operating profit margin 15% 9% 13% 14%Net profit margin 10% 6% 9% 10%Current ratio(X) 2.4 1.7 2.2 2.2Return on operating assets 8% 8% 10% 11%Return on equity 9% 9% 10% 11%LT debt/Equity 31% 28% 25% 22%

55
Furqan AyubInvestment [email protected]
PakistanCement Sector
Lucky Cement
Priced on January 4, 2008
KATS Code LUCK
Bloomberg Code LUCK PA
Price PkR 118.70
Market Cap (PkRmn) 31,262.61
Market Cap (US$mn) 510.41
Shares (mn) 263.38
1M High (PkR) 124.50
1M Low (PkR) 107.70
1Yr High (PkR) 143.05
1Yr Low (PkR) 58.00
3M Avg D Vol (shares) '000 8,506
1 Yr Avg Turnover '000 11,469
3M AD Value (US$mn) 17.71
Pakistan Market: 2007 - 2008January 2008AKD Securities Limited
Price-PkR118.7; target Price-PkR151.6; Potential Upside to target Price:27.7%
Buy
With the price agreement falling apart in December 06, cement manufacturerslost their pricing power to competition and undercutting with excess capacity lyingwith most cement manufacturers. However, unlike others, Lucky was able tobenefit from greater exposure on the export front, which enabled it to report bestgross margins in the industry owing to better retention prices on the export front.With prices on the local front falling, exports became a viable option for mostmanufacturers. Having presence in both the north and the south, Lucky was ableto grab a lion's share on exports front with India being the avenue explored recentlyand demand in Afghanistan and Middle East staying robust. During 5MCY08,lucky was able to capture 38% in the exports market.
Average retention prices have dropped to PkR2,633 per ton in 1QFY08 ascompared to PkR3,347 per ton in the corresponding period last year, a declineof 21%YoY. Plunging retention prices combined with rising coal prices have keptthe gross margins under pressure. During 1QFY08, Lucky's gross margins fellto 27% from 37% in 4QFY07, but still higher than the industry's average marginof 19%. With input prices increasing at a rapid pace, cement manufacturersresumed a price consensus in late November 07.
With resumption of price consensus, we witnessed a PkR30/bag increase duringNovember and December 07. We expect average retention prices for the industryto settle at PkR2,900 per ton for the full year FY08. Lucky's prices are howeverexpected to be further supported by an increasing concentration of exports in theoverall sales mix. While higher coal prices should keep margins under pressure,healthy demand domestically as well as regionally should enable Lucky to post4-year earnings CAGR of 19%.
Despite the fact that Lucky has underperformed the benchmark KSE 100 Indexby 15% over the past three months, mainly because of disappointing results ofthe cement sector, over the past one year Lucky has managed to outperform theKSE-100 index by 65%. However, resumption of price agreement amongmanufacturers as well as robust demand on the export front warrants anoutperfromance of Lucky. While 1HFY08 results are likely to keep cement stockprices under pressure, once the full impact of increase in output prices becomesobvious and volumes take off post winter season, we are likely to see an uptrendin 2HFY08. Therefore, even though the YoY growth of 4% may not fully reflectthe positives, 31%YoY growth in FY09 should lure the investor interest into thescrip. At current market price, the stock trades at FY08 PER of 11.8x, P/B of 1.9xand EV/ton of US$100.
LUCK - Valuation MultiplesFY06A FY07A FY08F FY09F
EPS (PkR) 7.35 9.67 10.08 13.18EPS growth 134% 32% 4% 31%PER (x) 16.1 12.3 11.8 9.0ROE 27% 27% 16% 15%P/BVS (x) 4.4 3.3 1.9 1.3Dividend yield 1% 1% 1% 2%EV/EBITDA (x) 12.7 10.3 7.5 6.0
LUCK - Stock performance
1M 3M 12M
Absolute (%) -4.0 -13.7 104.7
Rel. Index (%) -5.6 -14.8 64.6
Absolute (PkR) -4.9 -18.8 60.7
LUCK - FY08F Per Band
20406080
100120140160
Jul-04 Mar-05 Nov-05 Aug-06 Apr-07 Jan-08
(x)PkR
15 13 11 9
LUCK Price & Volume Chart
50
6580
95110
125
140
155
Jan-07 May-07 Aug-07 Jan-08
PkR
Vol (mn) RHS LUCK (LHS)
Vol (mn)
-
10
20
30
40

Pakistan Market: 2007 - 2008
56
January 2008AKD Securities Limited
Lucky Cement - Annual Databank
LUCK - Balance Sheet(In PkRmn) FY06A FY07A FY08F FY09FCurrent assets 4,455 5,403 8,518 9,468Operating assets 16,364 20,116 19,908 19,628Total assets 23,623 25,724 30,631 35,300Current liabil ities 4,752 6,353 6,356 7,227Long term liabilities 11,801 10,018 8,096 4,449Shareholders equity 7,070 9,354 16,179 23,624Total equity and liabilities 23,623 25,724 30,631 35,301
LUCK - Income Statement(In PkRmn) FY06A FY07A FY08F FY09FNet sales 8,054 12,522 18,195 21,778Cost of sales 4,918 8,845 12,482 14,129Gross profit 3,136 3,677 5,713 7,649EBITDA 3,188 3,949 5,374 6,696Operating profit 2,770 3,066 4,474 5,944Financial charges 83 863 1,145 710Profit before tax 2,553 2,690 3,123 4,960Taxation 657 206 468 1,488Net Profit 1,936 2,547 2,655 3,472
LUCK - Cashflow Statement(In PkRmn) FY06A FY07A FY08F FY09FCashflow from Operating Activities 2,724 1,850 2,613 3,675Cashflow from Investing Activities (6,053) (2,037) (2,692) (4,471)Cashflow from Financing Activites 6,038 (637) 1,885 859Net change in cash 2,709 (825) 1,805 63Beginning cash balance (645) 2,064 983 3,044Ending cash balance 2,064 983 3,044 3,107
LUCK - Key Ratios FY06A FY07A FY08F FY09F
Sales growth 102% 55% 45% 20%EBITDA margin 40% 32% 30% 31%Net margin 24% 20% 15% 16%LT debt/Equity 167% 107% 50% 19%D/E Ratio 30% 36% 53% 67%Current ratio 94% 85% 134% 131%ROA 8% 10% 9% 10%ROE 27% 27% 16% 15%

57
NML - Stock performance
1M 3M 12M
Absolute (%) -8.1 -18.1 15.9
Rel. Index (%) -9.7 -19.2 -24.1
Absolute (PkR) -9.0 -22.6 14.1
PakistanTextile Sector
Nishat Mills
Priced on January 4, 2008
KATS Code NML
Bloomberg Code NML PA
Price PkR 102.40
Market Cap (PkRmn) 16,362
Market Cap (US$mn) 267
Shares (mn) 160
1M High (PkR) 115.00
1M Low (PkR) 95.00
1Yr High (PkR) 133.75
1Yr Low (PkR) 88.30
3M Avg D Vol (shares) '000 2,460
1 Yr Avg Turnover '000 4,277
3M AD Value (US$mn) 5
Pakistan Market: 2007 - 2008January 2008AKD Securities Limited
Price-PkR102.4; target Price-PkR144; Potential Upside to target Price:40.6%
Umer PervezInvestment [email protected]
Buy
Nishat Mills Ltd. (NML) posted an earnings growth of 14%YoY in 1QFY08 whereEPS came in at PkR3.03. The topline decreased marginally by 2%YoY to reachPkR4.27bn in 1QFY08 as compared with PkR4.36bn reported in the same periodlast year. As NML buys the bulk of its cotton during September to December, theincrease in the price of cotton in 1QFY08 did not have a significant impact onmargins. Gross margins remained stable at 19% in 1QFY08. Other incomechanneling in from associate companies posted a growth of 5%YoY to furthersupplement the bottomline. In FY07, the company posted a 3%YoY earningsgrowth while topline grew by 3%YoY. However, higher raw material costs (cotton)and overheads (especially utilities) decreased the gross margin to 16.5% in FY07versus 17.7% in FY06. The growth in earnings was achieved on the back of capitalgains from its investment portfolio as other income surged 102%YoY in FY07,and represented 31% of pre-tax profits.
The current shortage of cotton in the country continues to drive up cotton priceswhich have risen 19%YoY in the first five months of the current fiscal year(5MFY08). The shortfall continues to be concentrated in Punjab, where arrivalsare down 25%YoY as of December 15th, ’07. In FY08 and FY09, we estimateNML will buy cotton at an average rate of PkR2,800/maund which will compressgross margins further. Being predominantly export oriented, NML has the abilityto pass on the higher cost of production but competition from the region will keepprice hikes checked. We have forecasted gross margins to be 15.8% and 16.1%in FY08 and FY09, respectively. Going forward gross margins should average16.8% p.a. during FY10-FY12 as cost efficiencies are achieved and topline isfurther bolstered by exports.
China is the largest importer of cotton and cotton yarn in the world. We expectthe regional environment to change in the shape of greater yarn demand fromChina as quota imposition from the EU is set to expire in Dec ‘07. Pakistan enjoysspecial market access to China under the Free Trade Agreement (FTA) that givesPakistan zero-rated access to many textile products. NML is expected to benefitas Hong Kong and China are the major markets for its cotton yarn. Duty on cottonyarn, which is currently at 5%, will be zero rated under the FTA with China onJanuary 1st, '08, in contrast to the 15% duty imposed on other countries.
Over the last year, the AKD textile universe has failed to show a stellar performance,underperfoming the benchmark KSE-100 Index by 26%YoY. Similarly, NML hasunderperformed the benchmark index by 24%YoY in the same time frame. Webelieve that the hike in cotton prices and the unclear impact of the pest attackaffecting the cotton crop have been largely overplayed by investors. At currentmarket levels, NML is trading at a forward PER of 9.7x on FY08 expected earningsas compared with the market PER at 10.55x. Furthermore, the company is alsotrading below its book value of PkR195/share which makes NML an attractivebuy on the FY08 P/B multiple of 0.5x. We maintain our Buy stance on the scripwhich is offering an upside of 40.6% to our Sum-of-the-Parts (SOP) based targetprice of PkR144/share.
NML - Valuation MultiplesFY06A FY07A FY08F FY09F
EPS (PkR) 10.22 10.48 10.60 13.15EPS growth -13% 3% 1% 24%PER (x) 10.0 9.8 9.7 7.8ROE 8% 6% 5% 6%P/BVS (x) 0.8 0.5 0.5 0.5Dividend yield 1% 2% 3% 3%EV/EBITDA (x) 7.5 6.8 6.9 6.4
NML- FY08F Per Band
20406080
100120140
Mar-05 Nov-05 Aug-06 Apr-07 Jan-08
(x)PkR
10 9 8 7
Jul-04
75
90
105
120
135
150
Jan-07 May-07 Aug-07 Jan-08
PkR
Vol (mn) RHS NML (LHS)
NML Price & Vo lume Chart Vol (mn)
-3691215182124273033

Pakistan Market: 2007 - 2008
58
January 2008AKD Securities Limited
Nishat Mills - Annual Databank
NML - Balance Sheet(In PkRmn) FY06A FY07A FY08F FY09FCurrent assets 9,758 13,309 16,164 16,465Operating assets 8,398 10,310 10,194 10,115Other Assets 2,213 277 - -Total assets 31,179 39,381 41,843 42,065Current liabilities 7,052 7,649 9,128 8,598Long-term Loans 2,982 1,774 1,484 574Other long term liabili ties 33 - - -Shareholders equity 21,112 29,957 31,232 32,893Total equity and l iabilities 31,179 39,381 41,843 42,065
NML - Cashflow Statement(In PkRmn) FY06A FY07A FY08F FY09FCashflow from Operating Activities 1,673 2,041 1,605 2,111Cashflow from Investing Activities (2,605) (1,263) (495) (800)Cashflow from Financing Activities 461 (701) 372 (1,150)Net change in cash (471) 77 1,482 161Beginning cash balance 521 50 70 1,552Ending cash balance 50 127 1,552 1,713
NML - Key Ratios(In PkRmn) FY06A FY07A FY08F FY09FSales growth 44% 5% 11% 9%EBITA margin 16% 14% 14% 14%Net profit margin 10% 10% 9% 10%LT Debt/Equity 14% 6% 5% 2%Total Debt/Equity 41% 27% 29% 23%Current Ratio (x) 1.38 1.74 1.77 1.92ROA 5% 4% 4% 5%ROE 8% 6% 5% 6%
NML - Income Statement(In PkRmn) FY06A FY07A FY08F FY09FNet sales 16,417 17,180 19,136 20,940Cost of sales 13,702 14,335 16,172 17,577Gross profit 2,716 2,845 2,965 3,363Operating expenses 940 1,341 1,148 1,256Operating Profit 1,776 1,504 1,816 2,107EBITDA 2,563 2,487 2,703 2,986Other Income 278 563 368 436Financial charges 755 881 822 685Other Expenses 67 2 27 46Profit before tax 1,759 1,819 1,885 2,311Taxation 126 145 191 209Net Profit 1,633 1,674 1,694 2,101

Priced on January 4, 2008
KATS Code OGDC
Bloomberg Code OGDC PA
Price PkR 121.45
Market Cap (PkRmn) 522,347.75
Market Cap (US$mn) 8,528.13
Shares (mn) 4,300.93
1M High (PkR) 127.10
1M Low (PkR) 113.40
1Yr High (PkR) 132.80
1Yr Low (PkR) 104.90
3M Avg D Vol (shares) '000 19,104
1 Yr Avg Turnover '000 16,765
3M AD Value (US$mn) 38.64
Pakistan Market: 2007 - 2008
59
Naveed VakilInvestment [email protected]
OGDC - Stock performance
1M 3M 12M
Absolute (%) -0.7 -2.8 6.1
Rel. Index (%) -2.3 -4.0 -33.9
Absolute (PkR) -0.8 -3.6 7.0
PakistanE&P Sector
Oil & Gas Development Co. LtdPrice-PkR121.45; target Price-PkR146.5; Potential Upside to target Price:20.6%
January 2008AKD Securities Limited
Buy
OGDC - Valuation MultiplesFY06A FY07A FY08F FY09F
EPS (PkR) 10.69 10.61 12.25 14.12EPS growth 39% -1% 15% 15%PER (x) 11.4 11.4 9.9 8.6ROE 49% 46% 45% 45%P/BVS (x) 5.5 5.3 4.5 3.8Dividend yield 7% 8% 7.8% 9.1%EV / EBITDA (x) 7.2 7.6 6.2 5.4
Guidance estimates targeting production of 10-11% over the next three years forOGDC seems achievable in our view. Fast track development of new discoveriesand production ramp for the portfolio adds credence to guidance estimates (seeAKD OGDC Epigram: Fast Track Guidance! dated: November 15, 2007).
Production driven earnings growth (15%YoY) in FY08, coupled with reserveaddition and increasing confidence in the company's ability to deliver on explorationprospects reinforce our positive stance on the stock. OGDC has targeted 41 wellsin FY08 with an additional 9 wells pending security clearance. In FY08, thecompany has announced one small discovery at Moolan 1 exploration well.However drilling update available on PPIS indicates discovery news flow to come.
OGDC's management while streaming online new discoveries has shifted focustowards fast track development. In FY08, out of the 41 well spudding target, OGDCis planning to spud 24 appraisal/development wells versus 16 targeted last year.As a result, the wildcat target has dropped to 17 for FY08.
OGDC is slated to show improvement in overall margins where volume growthand improved price environment should have its impact on the topline while astable drilling target similar to last year should keep the surge in explorationexpenditure limited.
While OGDC continues to add to its offshore portfolio, the company is also makingefforts to take its onshore portfolio global. OGDC has qualified for operator statusin Libya and is in the bidding process for exploration licenses. .
OGDC repeated last year's 1Q financial performance by recording NPAT ofPkR12.336bn in 1QFY08 against NPAT of PkR12.327bn in the correspondingperiod last year translating into an EPS of PkR2.87. The company was able torecord an increase of 9.8%YoY in topline emanating from growth in oil and gasproduction despite lower realized prices. The company's fast track developmentand streaming online new discoveries led oil and gas volumes to increase by15.7%YoY and 13.9%YoY respectively. Growth in gas volumes however, has alsobeen driven by a lower base recorded last year due to prolonged turnaround timeat key production assets. With volume growth coming through, the company'sbottomline remained flat due to higher royalty payments relating to prior yearadjustments on condensate and LPG production from Dhodak and Dakhni fields.While adjustment has taken place, we expect a marginal adjustment relating tothe aforementioned head to be witnessed in 2QFY08. That said, with the surgein exploration expenditure expected to remain in check in FY08, the company isslated to show improvement QoQ and YoY.
At 10.3x forward earnings, OGDC is trading lower than its historic valuation rangeand with forecasted EPS growth of 15%, OGDC has clearly been overlooked byinvestors in the recent bull run. At current market price OGDC offers an upsideof 20.6% to our target price of PkR146.50 - Accumulate
OGDC - FY08F Per Band
35
75
115
155
195
Jul-04 Mar-05 Nov-05 Aug-06 Apr-07 Jan-08
(x)PkR
1513119
OGDC Price & Volume Chart
100
115
130
145
Jan-07 May-07 Aug-07 Jan-08
PkR Vol (mn)
-
15
30
45
60
75
90
Vol (mn) RHS OGDC (LHS)

Pakistan Market: 2007 - 2008
60
January 2008AKD Securities Limited
Oil & Gas Development Co. Ltd - Annual Databank
OGDC - Cashflow Statement(In PkRmn) FY06A FY07A FY08F FY09F Cashflow from operations 57,990 50,538 72,469 80,069Cashflow from Investing Activities (7,140) (13,002) (9,562) 639Cashflow from Financing Activities (41,445) (38,154) (38,660) (49,461)Net change in cash 9,406 (618) 24,247 31,247Beginning cash balance 37,799 32,178 17,995 23,991Ending cash balance 47,205 31,560 42,242 55,238
OGDC - Key Ratios FY06A FY07A FY08F FY09F
Sales growth 31% 4% 19% 12%Gross profit margin 68% 62% 65% 67%EBITDA margin 74% 68% 70% 71%Net profit margin 48% 46% 44% 46%L.T debt/Equity 0% 0% 0% 0%Current Ratio (x) 6.7 6.2 7.3 7.9Return on equity 49% 45% 45% 47%Return on assets 38% 36% 37% 39%
OGDC - Balance Sheet(In PkRmn) FY06A FY07A FY08F FY09F Current assets 72,677 68,519 78,160 94,963Operating assets 44,458 56,716 62,796 58,513Other Assets 4,179 4,104 4,104 4,104Total assets 121,315 129,338 145,060 157,579Current liabilities 10,891 11,123 10,723 11,976Long-term Liabilities (Other) 15,653 17,599 17,599 17,599Paid up capital 43,009 43,009 43,009 43,009Reserves and Unappropriated Profits 51,761 57,607 73,728 84,995Total Equity 94,770 98,179 114,299 125,566Total equity and l ibil ities 121,315 129,338 145,060 157,579
OGDC - Income Statement(In PkRmn) FY06A FY07A FY08F FY09FNet sales 96,755 100,261 119,222 133,153Cost of sales 30,541 37,869 42,118 44,134Gross profit 66,214 62,392 77,105 89,019Operating Expenses 1,072 1,285 1,467 1,629Operating Profit 65,142 61,107 75,637 87,389Financial charges 10 450 454 459WPPF 3,469 3,214 3,971 4,585Other Income - net 4,248 3,615 4,044 4,408Profit before tax 65,911 61,059 75,255 86,754EBITDA 71,758 68,145 83,173 95,052Taxation 19,944 15,429 22,577 26,026Net Profit 45,968 45,630 52,679 60,728
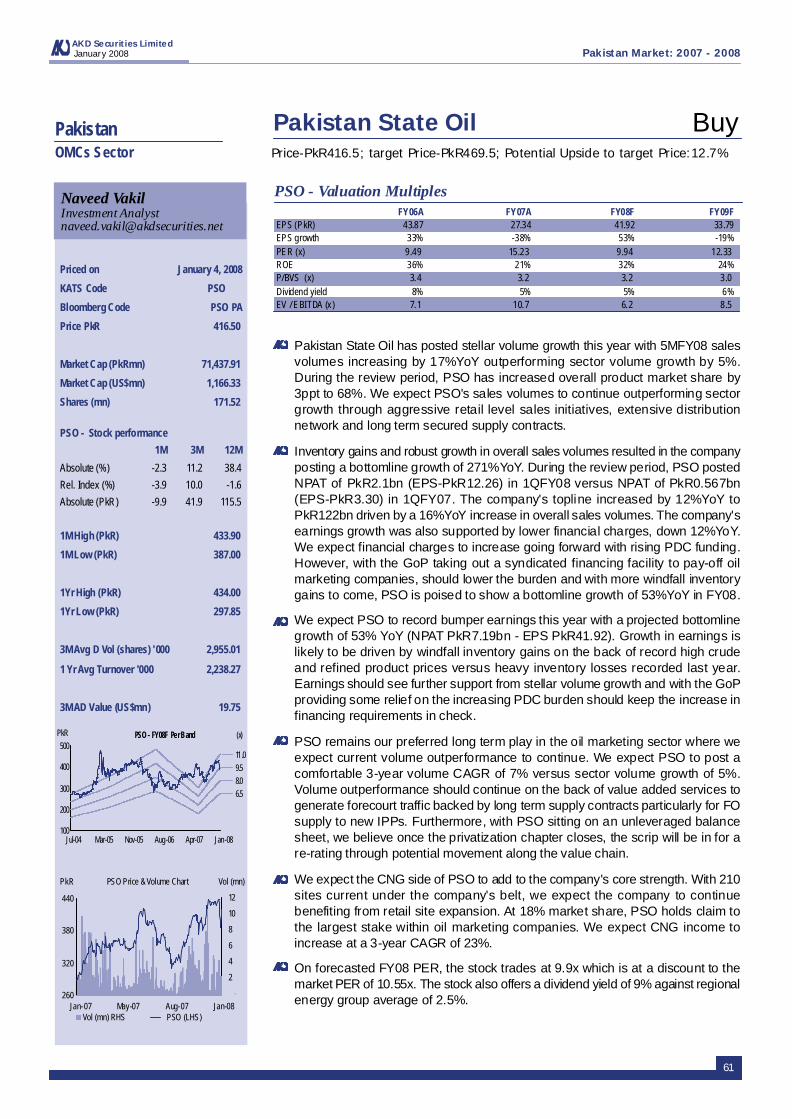
Priced on January 4, 2008
KATS Code PSO
Bloomberg Code PSO PA
Price PkR 416.50
Market Cap (PkRmn) 71,437.91
Market Cap (US$mn) 1,166.33
Shares (mn) 171.52
1M High (PkR) 433.90
1M Low (PkR) 387.00
1Yr High (PkR) 434.00
1Yr Low (PkR) 297.85
3M Avg D Vol (shares) '000 2,955.01
1 Yr Avg Turnover '000 2,238.27
3M AD Value (US$mn) 19.75
61
Naveed VakilInvestment [email protected]
PSO - Stock performance
1M 3M 12M
Absolute (%) -2.3 11.2 38.4
Rel. Index (%) -3.9 10.0 -1.6
Absolute (PkR) -9.9 41.9 115.5
PakistanOMCs Sector
Pakistan State Oil
Pakistan Market: 2007 - 2008January 2008AKD Securities Limited
Price-PkR416.5; target Price-PkR469.5; Potential Upside to target Price:12.7%
Buy
Pakistan State Oil has posted stellar volume growth this year with 5MFY08 salesvolumes increasing by 17%YoY outperforming sector volume growth by 5%.During the review period, PSO has increased overall product market share by3ppt to 68%. We expect PSO's sales volumes to continue outperforming sectorgrowth through aggressive retail level sales initiatives, extensive distributionnetwork and long term secured supply contracts.
Inventory gains and robust growth in overall sales volumes resulted in the companyposting a bottomline growth of 271%YoY. During the review period, PSO postedNPAT of PkR2.1bn (EPS-PkR12.26) in 1QFY08 versus NPAT of PkR0.567bn(EPS-PkR3.30) in 1QFY07. The company's topline increased by 12%YoY toPkR122bn driven by a 16%YoY increase in overall sales volumes. The company'searnings growth was also supported by lower financial charges, down 12%YoY.We expect financial charges to increase going forward with rising PDC funding.However, with the GoP taking out a syndicated financing facility to pay-off oilmarketing companies, should lower the burden and with more windfall inventorygains to come, PSO is poised to show a bottomline growth of 53%YoY in FY08.
We expect PSO to record bumper earnings this year with a projected bottomlinegrowth of 53% YoY (NPAT PkR7.19bn - EPS PkR41.92). Growth in earnings islikely to be driven by windfall inventory gains on the back of record high crudeand refined product prices versus heavy inventory losses recorded last year.Earnings should see further support from stellar volume growth and with the GoPproviding some relief on the increasing PDC burden should keep the increase infinancing requirements in check.
PSO remains our preferred long term play in the oil marketing sector where weexpect current volume outperformance to continue. We expect PSO to post acomfortable 3-year volume CAGR of 7% versus sector volume growth of 5%.Volume outperformance should continue on the back of value added services togenerate forecourt traffic backed by long term supply contracts particularly for FOsupply to new IPPs. Furthermore, with PSO sitting on an unleveraged balancesheet, we believe once the privatization chapter closes, the scrip will be in for are-rating through potential movement along the value chain.
We expect the CNG side of PSO to add to the company's core strength. With 210sites current under the company's belt, we expect the company to continuebenefiting from retail site expansion. At 18% market share, PSO holds claim tothe largest stake within oil marketing companies. We expect CNG income toincrease at a 3-year CAGR of 23%.
On forecasted FY08 PER, the stock trades at 9.9x which is at a discount to themarket PER of 10.55x. The stock also offers a dividend yield of 9% against regionalenergy group average of 2.5%.
PSO - Valuation MultiplesFY06A FY07A FY08F FY09F
EPS (PkR) 43.87 27.34 41.92 33.79EPS growth 33% -38% 53% -19%PER (x) 9.49 15.23 9.94 12.33ROE 36% 21% 32% 24%P/BVS (x) 3.4 3.2 3.2 3.0Dividend yield 8% 5% 5% 6%EV / EBITDA (x) 7.1 10.7 6.2 8.5
PSO - FY08F Per Band
100
200
300
400
500
Jul-04 Mar-05 Nov-05 Aug-06 Apr-07 Jan-08
(x)PkR
11.0 9.5 8.0 6.5
Vol (mn) RHS
PSO Price & Volume Chart
260
320
380
440
Jan-07 May-07 Aug-07 Jan-08
PkR Vol (mn)
-
2
4
6
8
10
12
PSO (LHS)

Pakistan Market: 2007 - 2008
62
January 2008AKD Securities Limited
Pakistan State Oil - Annual Databank
PSO - Cashflow Statement(In PkRmn) FY06A FY07A FY08F FY09F Cash from Operating Activities 1,599 3,691 1,067 9,544Cash from Investing Activities (139) (708) 249 (1,401)Cash from Financial Activities (4,104) (1,566) 1,230 (9,388)Net Cash Balance 1,899 1,522 4,069 2,823
PSO - Key Ratios FY06A FY07A FY08F FY09F
Sales Growth 40% 17% 19% 7%Gross Margin 6% 4% 4% 3%EBITDA Margin 3.2% 1.8% 2.6% 1.7%Net Profit Margin 3% 1% 2% 1%Current Ratio (x) 1.24 1.22 1.22 1.25ROE 36% 22% 32% 24%ROA 11% 6% 8% 6%
PSO - Balance Sheet(In PkRmn) FY06A FY07A FY08F FY09F Current Assets 58,119 62,513 80,579 79,825Fixed Assets 7,639 8,139 6,721 6,853Other Assets 4,410 4,086 4,092 4,099Total Assets 70,169 74,737 91,393 90,777Current Liabilities 47,057 51,386 66,268 64,086Other Liabil ites 2,299 2,412 2,655 2,886Total Share Holders Equity (SHEQ) 20,813 20,939 22,469 23,805Tot. Liabilities and SHEQ 70,169 74,737 91,393 90,777
PSO - Income Statement(In PkRmn) FY06A FY07A FY08F FY09FNet Sales 298,250 349,706 416,806 446,240COGS 281,043 337,447 398,913 431,470Gross Profit 17,207 12,259 17,893 14,770Operating Expenses 7,102 6,013 6,273 6,694Operating Profit 11,499 7,526 13,043 10,166Other Income 1,394 1,279 1,423 2,090EBIT 12,893 8,804 14,465 12,257Financial and other charges 884 1,158 2,311 1,580Taxation 4,129 2,432 3,872 3,121Net Profit 7,525 4,690 7,190 5,796

63
Pakistan Market: 2007 - 2008January 2008AKD Securities Limited
RISK FACTORS
Political risk between now and elections and anypost election disturbance.
Economic risk due to slowdown in economic growthor imbalance in external accounts, inflation, etc.
Sectoral risk related to demand slowdown, highenergy / input costs.
Specific company related risks.
Regulatory risks related to the market or corporatesector regulation changes.
Any or all of the above risk factors can adverselyimpact companies financial & price performancethereby negating share price targets .

64
AKD Securities LimitedJanuary 2008
Pakistan Market: 2007 - 2008
TechnicalAnalysis
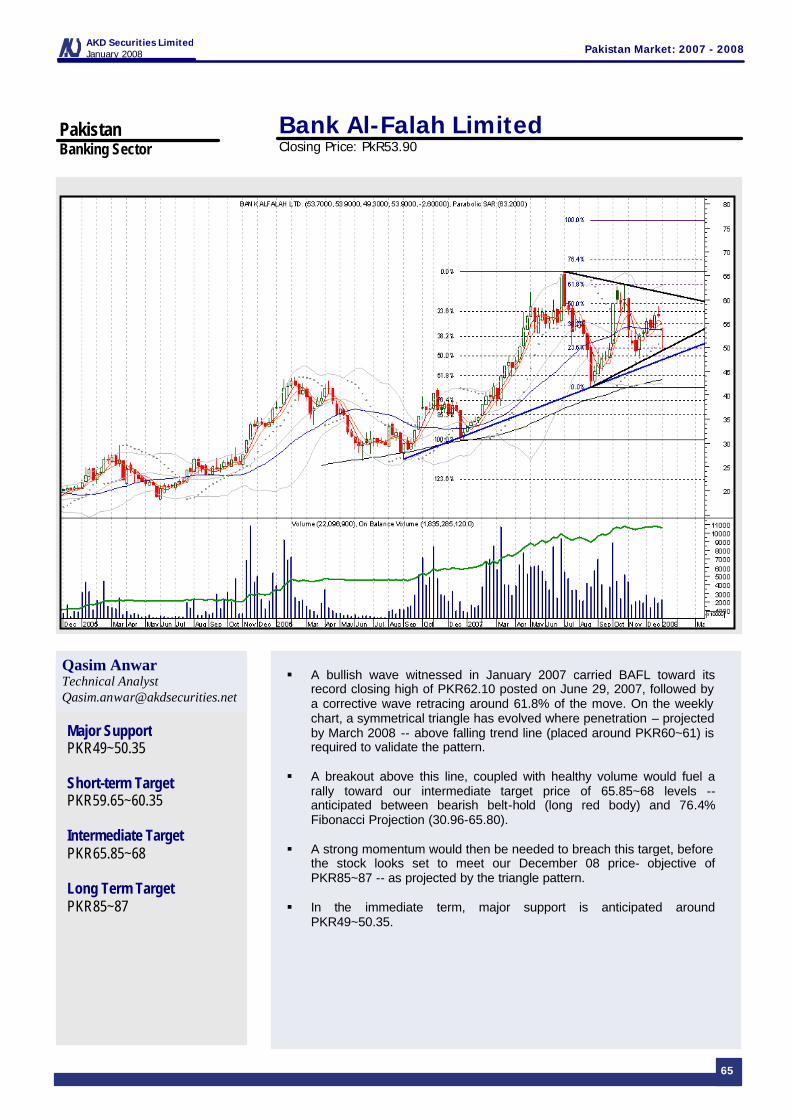
65
Pakistan Market: 2007 - 2008 AKD Securities Limited January 2008
Qasim Anwar Technical Analyst [email protected]
Major Support PKR49~50.35 Short-term Target PKR59.65~60.35 Intermediate Target PKR65.85~68 Long Term Target PKR85~87
§ A bullish wave witnessed in January 2007 carried BAFL toward its record closing high of PKR62.10 posted on June 29, 2007, followed by a corrective wave retracing around 61.8% of the move. On the weekly chart, a symmetrical triangle has evolved where penetration – projected by March 2008 -- above falling trend line (placed around PKR60~61) is required to validate the pattern.
§ A breakout above this line, coupled with healthy volume would fuel a rally toward our intermediate target price of 65.85~68 levels -- anticipated between bearish belt-hold (long red body) and 76.4% Fibonacci Projection (30.96-65.80).
§ A strong momentum would then be needed to breach this target, before the stock looks set to meet our December 08 price- objective of PKR85~87 -- as projected by the triangle pattern.
§ In the immediate term, major support is anticipated around
PKR49~50.35.
Bank Al-Falah Limited Closing Price: PkR53.90
Pakistan Banking Sector
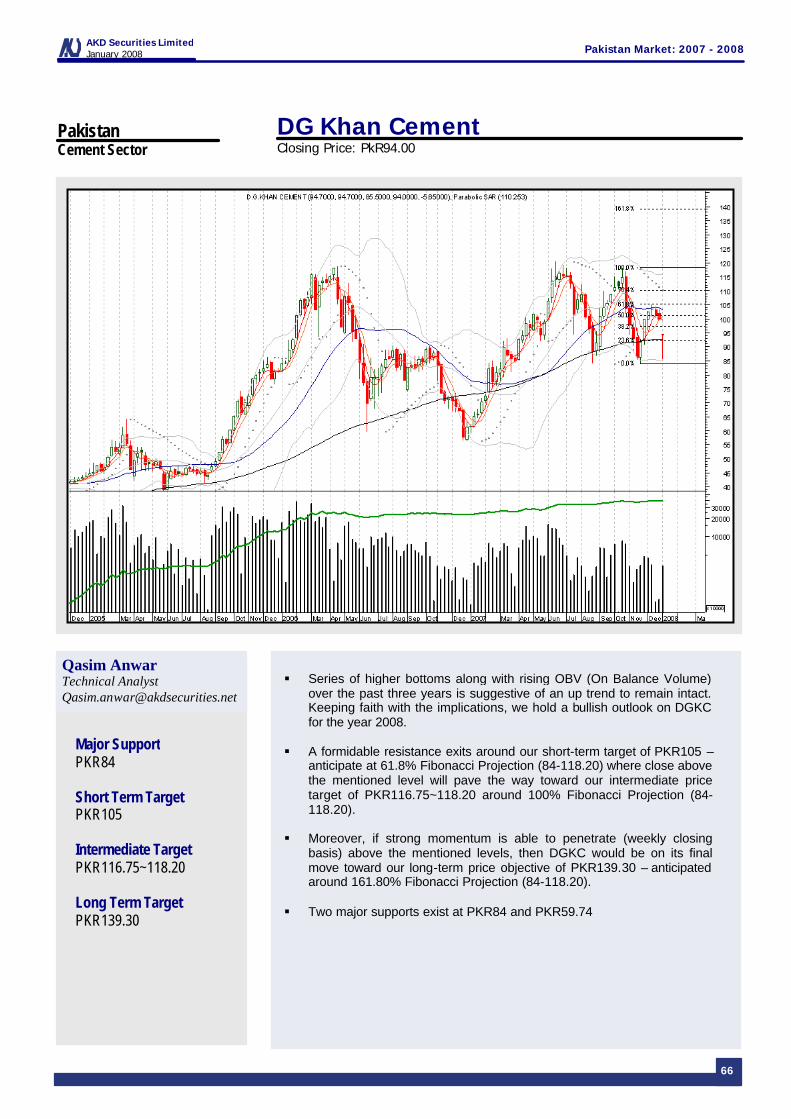
66
Pakistan Market: 2007 - 2008 AKD Securities Limited January 2008
Qasim Anwar Technical Analyst [email protected]
Major Support PKR84 Short Term Target PKR105 Intermediate Target PKR116.75~118.20 Long Term Target PKR139.30
§ Series of higher bottoms along with rising OBV (On Balance Volume) over the past three years is suggestive of an up trend to remain intact. Keeping faith with the implications, we hold a bullish outlook on DGKC for the year 2008.
§ A formidable resistance exits around our short-term target of PKR105 –
anticipate at 61.8% Fibonacci Projection (84-118.20) where close above the mentioned level will pave the way toward our intermediate price target of PKR116.75~118.20 around 100% Fibonacci Projection (84-118.20).
§ Moreover, if strong momentum is able to penetrate (weekly closing
basis) above the mentioned levels, then DGKC would be on its final move toward our long-term price objective of PKR139.30 – anticipated around 161.80% Fibonacci Projection (84-118.20).
§ Two major supports exist at PKR84 and PKR59.74
DG Khan Cement Closing Price: PkR94.00
Pakistan Cement Sector

67
Pakistan Market: 2007 - 2008 AKD Securities Limited January 2008
Qasim Anwar Technical Analyst [email protected]
Major Support PKR238 Short Term Target PKR296~300 Intermediate Target PKR348~350 Long Term Target PKR390~400
§ ENGRO’s price activity remained largely flat during the period July -December 2006, before commencing its northward trend by the fag end of December 2006. The stock then achieved a new milestone on October 4, 2007 – settling at an all-time high of PKR294.70 -- followed by a reaction rally, which dragged the share sharply lower to bottom an intraweek-low PKR248.50 on the week ended November 16, 2007. The case is prime example of Eliot Wave – sans the temporary downward spike seen between December 31st2007- January 3rd 2008.
§ Our analysis suggests, that a fifth Eliot Wave is on the cards, where
ENGRO seems quite strong to breach (on weekly basis) its formidable resistance around our short-term target of PKR296~300 levels – seen at 161.8% Fibonacci Projection (98.3-197.7). A continuing rally can then pull the stock toward our intermediate target of PKR348~350 anticipated around 123.6% Fibonacci Projection (163.60-272.50).
§ A successful penetration on weekly close backed by strong momentum
would then be required above our medium-term target, to drive the scrip to its 161% Fibonacci Projection (163.60-272.50) of PKR390~400 – our December 2008 technical price objective.
§ Two major supports exist at PKR238 and PKR215~216
Engro Chemicals Closing Price: PkR262.50
Pakistan Fertilizer Sector

68
Pakistan Market: 2007 - 2008 AKD Securities Limited January 2008
Qasim Anwar Technical Analyst [email protected]
Major Support PKR111~112 Short Term Target PKR126.65~128 Intermediate Target PKR140.80 Long Term Target PKR160~163
§ The story of FFC looks bittersweet, where looking at higher troughs amid rising OBV (On Balance Volume) over the past three years; we hold a strong view on the stock. However, the upper black line of the ascending triangle – formed in three years of price action- is just as strong of a resistance at the same time.
§ Given this, we feel the key to FFC rally lies in the completion of the
triangle pattern in the form of a break out above the upper black line. A close above PKR126.65~128 (breakout) along with healthy volumes would fuel a bullish rally toward our medium-term target of PKR140.80 – seen at 61.8% Fibonacci Projection (66.15-125.38).
§ This when breached on a weekly closing basis, will carry the stock to its
December 2008 price objective of PKR160~163 -- anticipated around 100% Fibonacci Projection (66.15-125.38).
§ On the demand side, major support exists around PKR111~112
Fauji Fertilizer Company Closing Price: PkR123.50
Pakistan Fertilizer Sector
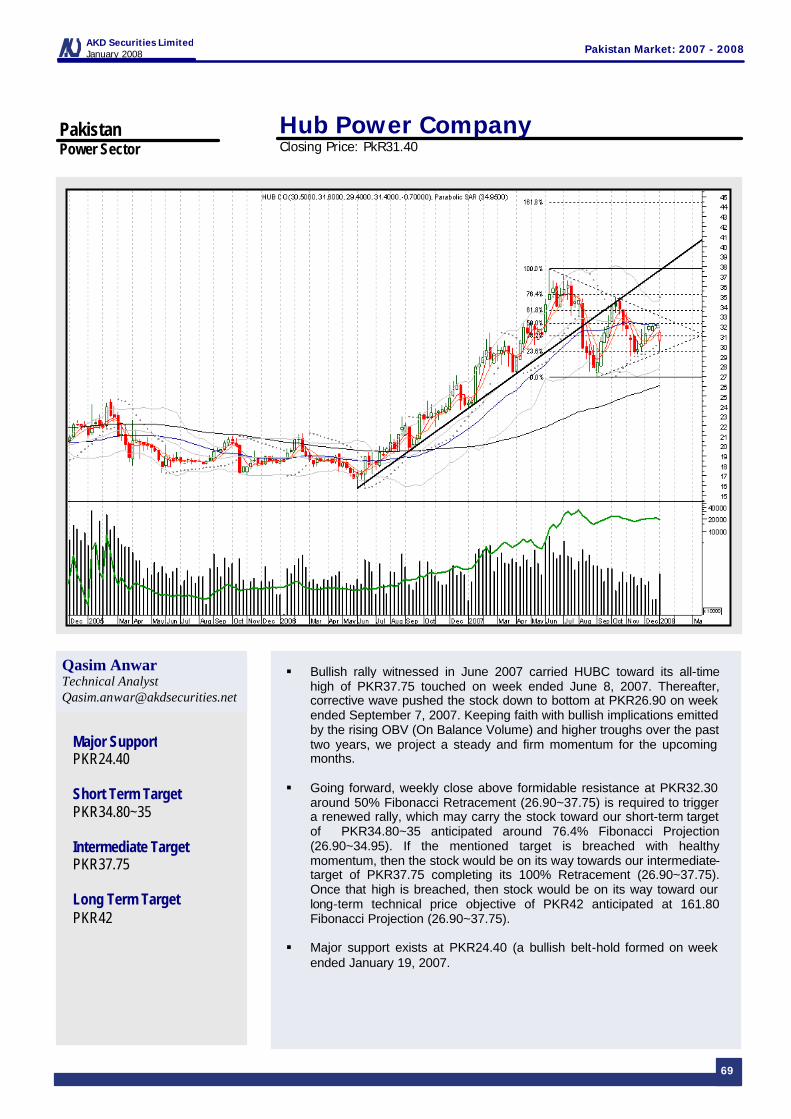
69
Pakistan Market: 2007 - 2008 AKD Securities Limited January 2008
Qasim Anwar Technical Analyst [email protected]
Major Support PKR24.40 Short Term Target PKR34.80~35 Intermediate Target PKR37.75 Long Term Target PKR42
§ Bullish rally witnessed in June 2007 carried HUBC toward its all-time high of PKR37.75 touched on week ended June 8, 2007. Thereafter, corrective wave pushed the stock down to bottom at PKR26.90 on week ended September 7, 2007. Keeping faith with bullish implications emitted by the rising OBV (On Balance Volume) and higher troughs over the past two years, we project a steady and firm momentum for the upcoming months.
§ Going forward, weekly close above formidable resistance at PKR32.30
around 50% Fibonacci Retracement (26.90~37.75) is required to trigger a renewed rally, which may carry the stock toward our short-term target of PKR34.80~35 anticipated around 76.4% Fibonacci Projection (26.90~34.95). If the mentioned target is breached with healthy momentum, then the stock would be on its way towards our intermediate-target of PKR37.75 completing its 100% Retracement (26.90~37.75). Once that high is breached, then stock would be on its way toward our long-term technical price objective of PKR42 anticipated at 161.80 Fibonacci Projection (26.90~37.75).
§ Major support exists at PKR24.40 (a bullish belt-hold formed on week
ended January 19, 2007.
Hub Power Company Closing Price: PkR31.40
Pakistan Power Sector

70
Pakistan Market: 2007 - 2008 AKD Securities Limited January 2008
Qasim Anwar Technical Analyst [email protected]
Major Support PKR104.70 Short Term Target PKR130 Intermediate Target PKR139.95~141.80 Long Term Target PKR154
§ LUCK’s rising OBV (On Balance Line) along with higher troughs over the past three years is projecting a steady and firm trend. However, the stock holds a crucial price-barrier around its 2007- closing-high of PKR143.05 seen on October 18th, following which it saw a reaction rally where it retraced the move by 76.4% on daily chart.
§ For the immediate term, a break above minor resistance at PKR116.50 is
required to generate a rally toward our price target of PKR130 -- seen at 76.4% Fibonacci Projection (30.25~130.05). A weekly closing above this formidable resistance will take the stock towards our medium-term target of PKR139.95~141.80.
§ Once this target is achieved, a sharp breakout backed by a strong
momentum would then confirm a smooth rally until our long-term price objective is met at PKR54 -- anticipated around 100% Projection (30.25~130.05).
§ Major support exists around PKR104.70.
Lucky Cement Closing Price: PkR118.70
Pakistan Cement Sector

71
Pakistan Market: 2007 - 2008 AKD Securities Limited January 2008
Qasim Anwar Technical Analyst [email protected]
Major Support PKR97.25 Short Term Target PKR120~121.30 Intermediate Target PKR132.35~135 Long Term Target PKR145.50
§ Looking at NML’s movement over the past three years, the series of successively higher troughs along with steady OBV (On Balance Volume), suggests that the primary trend is up and firm.
§ In immediate term, weekly penetration above formidable resistance
anticipated around PKR110.70 is likely to ignite a rally toward our short-term target of PKR120~121.30 levels anticipated around 50% Fibonacci Projection (86~135). Which if breached on weekly closing basis, then it is likely that the stock would then be on its move toward our intermediate target of PKR132~135 levels anticipated between upper black line (major resistance) and 76.4% Fibonacci Projection (86-135).
§ And if the stock is successful in breaching the mentioned levels, backed
by healthy momentum, which is not going to be an easy task, will pave the way towards our long-term price objective of PKR145.50 – anticipated at 100% Fibonacci Projection (86-135).
§ Major support exists around PKR97.25.
Nishat Mills Closing Price: PkR102.40
Pakistan Textile Sector
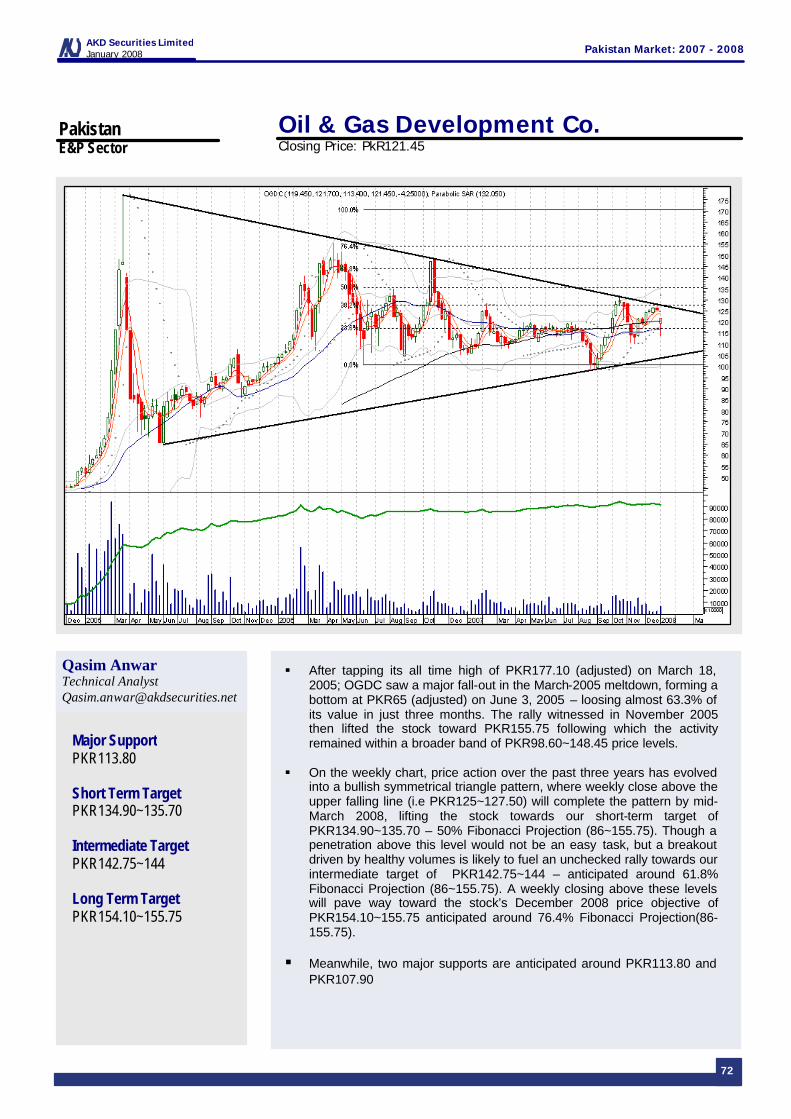
72
Pakistan Market: 2007 - 2008 AKD Securities Limited January 2008
Qasim Anwar Technical Analyst [email protected]
Major Support PKR113.80 Short Term Target PKR134.90~135.70 Intermediate Target PKR142.75~144 Long Term Target PKR154.10~155.75
§ After tapping its all time high of PKR177.10 (adjusted) on March 18, 2005; OGDC saw a major fall-out in the March-2005 meltdown, forming a bottom at PKR65 (adjusted) on June 3, 2005 – loosing almost 63.3% of its value in just three months. The rally witnessed in November 2005 then lifted the stock toward PKR155.75 following which the activity remained within a broader band of PKR98.60~148.45 price levels.
§ On the weekly chart, price action over the past three years has evolved
into a bullish symmetrical triangle pattern, where weekly close above the upper falling line (i.e PKR125~127.50) will complete the pattern by mid-March 2008, lifting the stock towards our short-term target of PKR134.90~135.70 – 50% Fibonacci Projection (86~155.75). Though a penetration above this level would not be an easy task, but a breakout driven by healthy volumes is likely to fuel an unchecked rally towards our intermediate target of PKR142.75~144 – anticipated around 61.8% Fibonacci Projection (86~155.75). A weekly closing above these levels will pave way toward the stock’s December 2008 price objective of PKR154.10~155.75 anticipated around 76.4% Fibonacci Projection(86-155.75).
§ Meanwhile, two major supports are anticipated around PKR113.80 and
PKR107.90
Oil & Gas Development Co. Closing Price: PkR121.45
Pakistan E&P Sector

73
Pakistan Market: 2007 - 2008 AKD Securities Limited January 2008
Qasim Anwar Technical Analyst [email protected]
Major Support PKR376 Short Term Target PKR436~438.50 Intermediate Target PKR490~495 Long Term Target PKR550
§ Over the last 18-months, the series of higher bottoms along with rising OBV (On Balance Volume) suggest that the primary trend is up and firm. An ascending triangle pattern has evolved during the last two years where the price level of PKR412~415 holds the key in the form of an upper line. Although, heavy and unsymmetrical battering seen last week has pushed the stock price below the upper line, we feel it is but inevitable for the stock to breakout and re-validate the pattern it showed earlier on September 23, 2007.
§ The breakout would then trigger a rally to lead PSO toward its short-term
target placed at PKR436~438.50 around 76.4% Fibonacci Projection (176-412). Keeping aside the fact that these levels would prove a tough barrier to cross, we believe that a strong momentum can carry the stock toward its intermediate target of PKR490~495 -- anticipated around 100% Fibonacci Projection (176-412). The stock would then be awaiting a trigger to push it through the gap until the level of PKR550, which would be our December-2008 technical price objecive for the stock – seen at 123.6% Fibonacci Projection (176~412).
§ Major support exists around PKR376~380.
Pakistan State Oil Closing Price: PkR416.50
Pakistan OMCs Sector

AKD SECURITIES LIMITEDMember: Karachi Stock Exchange
PAKISTAN
January 2008
The information and opinion contained in this report have been complied by our research department from sources believed by it to be reliable and in good faith, but no representation or warranty,express or implied, is made as to their accuracy, completeness or correctness. All opinions and estimates contained in the document constitute the department's judgment as of the date of this documentand are subject to change without notice an are provided in good faith but without legal responsibility.
This report is not, and should not be construed as, an offer to sell or a solicitation of an offer to buy any securities. AKD Securities (the company) or persons connected with it may from time to timehave an investment banking or other relationship, including but not limited to, the participation or investment in commercial banking transaction (including loans) with some or all of the issuers mentionedtherein, either for their own account or the account of their customers. Persons connected with the company may provide corporate finance and other services to the issuer of the securities mentionedherein, including the issuance of options on securities mentioned herein or any related investment and may make a purchase and/or sale of the securities or any related investment from time to timein the open market or otherwise, in each case either as principal or agent.
Neither the company or any of its affiliates, nor any other person, accepts any liability whatsoever for any director or consequential loss arising from any use of this report or the information containedtherein.
Subject to any applicable laws and regulations, AKD, its associate or group companies or individuals connected with AKD may have used the information contained herein before publication and mayhave positions in, may from time to time purchase or sell or have a materia l interest in any of the securities mentioned or related securities or may currently or in future have or have had a relationshipwith, or may provide or to have provided investment banking, capital markets and or other services to, the entities referred to herein, their advisor s and/or any other connected parties.
This document is being distributed in the United State solely to "major institutional investors" as defined in Rule 15a-6 under the U.S. Securities Exchange Act of 1934, and may not be furnished toany other person in the United States. Each U.S. person that receives this document by its acceptance hereof represents and agrees that it: is a "major intuitional investor", as so defined; understandsdocument wishing to follow-up any of the information or to effect a transaction in such securities should do so by contacting a r egistered representative of AKD Securities L imited.
The securities discussed in this report may not be eligible for sale in some states in the U.S. or in some countries.
Any recipient, other than a U.S. recipient that whishes further information should contact the company.
This report may not be reproduced, distributed or published, in whole or in part, by any recipient hereof for any purpose.
Muhammad Farid AlamDeputy Chief Executive OfficerTel: (9221) 111 253 111 (Ext:695)[email protected]
Mustafa IqbalHead of Institutional SalesTel: (9221) 537 [email protected]
Domestic Sales Team
Faiza NaeemInvestment AnalystSector: Telecom, Fertilizer, Autos & Paper & BoardTel: (9221) 111 253 111 (Ext:664)[email protected]
Naveed VakilInvestment AnalystSector: E&P, Oil & Gas MarketingTel: (9221) 111 253 111 (Ext:692)[email protected]
International Sales
AKD Sales Team
AKD Research Team
Aqib Elahi MehboobDirector, International Sales & Business DevelopmentTel: (9221) 111 253 111 (Ext:704)[email protected]
Samira OmerInternational SalesTel: (9221) 111 253 111 (Ext:705)[email protected]
Umer PervezInvestment AnalystSector: Power, Insurance, Chemicals & TextilesTel: (9221) 111 253 111 (Ext:693)[email protected]
Tahir NaqviInstitutional SalesTel: (9221) 111 253 111 (Ext:696)[email protected]
Aisha KirmaniInternational SalesTel: (9221) 111 253 111 (Ext:705)[email protected]
Raza JafriInvestment AnalystSector: Commercial BanksTel: (9221) 111 253 111 (Ext:693)[email protected]
Furqan AyubInvestment AnalystSector: CementTel: (9221) 111 253 111 (Ext:693)[email protected]
Zulqarnain KhanInstitutional SalesTel: (9221) 111 253 111 (Ext:696)[email protected]
Fahad Muhammed AliInstitutional SalesTel: (9221) 111 253 111 (Ext:696)[email protected]
Fauz JamalInstitutional SalesTel: (9221) 111 253 111 (Ext:696)[email protected]
Khaldoon Bin LatifDeputy Head of Institutional SalesTel: (9221) 111 253 111 (Ext:696)[email protected]