pakistan institute of development …pide.org.pk/pdf/cphsp/pide-cphsp-2.pdfpopulation & health...
TRANSCRIPT

Population & Health Working Paper Series
PIDE-CPHSP-2
PA K I S TA N I N S T I T U T E O F D E V E L O P M E N T E C O N O M I C S
Prevalence and Determinants of Overweight and Obesity
Among Adults in Pakistan
Maryam Naeem Satti
Durr-e-Nayab
Mahmood Khalid

Population & Health Working Paper Series
PIDE-CPHSP-2
Prevalence and Determinants of Overweight and Obesity Among
Adults in Pakistan
Maryam Naeem Satti
Pakistan Institute of Development Economics, Islamabad
Durr-e-Nayab Pakistan Institute of Development Economics, Islamabad
and
Mahmood Khalid Pakistan Institute of Development Economics, Islamabad
PAKISTAN INSTITUTE OF DEVELOPMENT ECONOMICS
ISLAMABAD
2015

All rights reserved. No part of this publication may be reproduced, stored in a retrieval system or
transmitted in any form or by any means electronic, mechanical, photocopying, recording or
otherwise without prior permission of the Publications Division, Pakistan Institute of Development
Economics, P. O. Box 1091, Islamabad 44000.
© Pakistan Institute of Development
Economics, 2015.
Pakistan Institute of Development Economics
Islamabad, Pakistan
E-mail: [email protected]
Website: http://www.pide.org.pk
Fax: +92-51-9248065
Designed, composed, and finished at the Publications Division, PIDE.

C O N T E N T S
Page
Abstract v
1. Introduction 1
2. Theoretical Foundation and Review of Literature 2
3. Data and Methodology 4
4. Prevalence of Overweight and Obesity 6
5. Determinants of Overweight and Obesity 7
6. Multivariate Regression Results 14
7. Conclusions 16
Appendix 18
References 19
List of Tables
Table 1. Percentage of Overweight and Obese by Work Status and
Occupation 10
Table 2. Percentage of Overweight and Obese by Eating Out 12
Table 3. Percentage having Excess Weight by Food Consumption 14
Table 4. Result of Binary Logistic Regression for Determinants of
Overweight and Obesity 15
List of Figures
Figure 1. Classification of Body Mass Index among Adults 6
Figure 2. Prevalence of Overweight and Obesity by Gender 7
Figure 3. Prevalence of Overweight and Obesity by Age 7
Figure 4. Percentage of Overweight and Obese by Region 8

(iv)
Page
Figure 5. Percentage of Overweight and Obese Adults by Province 8
Figure 6. Percentage of Overweight and Obesity by Wealth Status 8
Figure 7. Percentage of Overweight and Obese Adults by Marital
Status 9
Figure 8. Percentage of Overweight and Obese Adults by Education 9
Figure 9. Percentage of Overweight and Obese Adults by Number
of Overweight Persons in the Family other than the
Respondent 11
Figure 10. Percentage of Overweight and Obesity by Transport and
Entertainment Facility 12
Figure 11. Percentage of Overweight and Obesity by Domestic
Labour Saving Techniques Facility 13

ABSTRACT
The imbalance between energy gained and consumed contributes to
weight gain and fat accumulation in the body. The Body Mass Index when
equalled and increased above 25 kg/m2 is classified as overweight and equalled
and above 30 kg/m2 as obesity. Overweight and obesity is a global problem
carrying immense consequences on individuals’ lives. In the context of Pakistan,
which is facing double burden of malnutrition, carrying out a study on excess
weight is of utmost importance. The present study ascertains the prevalence and
possible causes of overweight and obesity among adult population using
Pakistan Panel Household Survey for 2010. The results of the present research
show there are 30percentoverweight adults in Pakistan. Furthermore, along with
certain underlying demographic and social characteristics, the study identifies
physical activity to be the significant determinant of excess weight. Being
overweight also increases the number of other excess weight individuals in the
family. Interestingly, poverty and most of the food consumption variables turn
out to be insignificant risk factors for overweight and obesity. By adopting
certain prevention strategies which focus on the promotion of physical activity
can help in lessening its prevalence and negative impact on adults.
JEL Classification: I12, I15
Keywords: Overweight, Obesity, Physical Activity

1. INTRODUCTION*
Malnutrition, either in the form of underweight or excess body weight, is
associated with increased morbidity for human lives. Having excess body weight
was once perceived as a phenomenon of industrialised world. However, lately it
has also extended to the developing countries. This problem of excess weight is
not only highly prevalent but has also increased more than three folds since
the1980s both in developed and developing countries [Branca, Nikogosian, and
Lobstein (2007)].Presently the developing economies of the world are not only
facing the problem of underweight population but are also at risk of excess weight;
contributing to the double burden of malnutrition [Schmidhuber and
Shetty(2005)].
Excess weight over the normal can be in the form of overweight or more
dangerously being obese. Imbalance between energy gained and exhausted
results in abnormal fat accumulation in the tissues of human body and
ultimately leads to obesity. In the literature, Body Mass Index [BMI] => 25
kg/m2is defined as overweight and=>30kg/m2is defined as obesity
[WHO(2000)]. Excess weight is common in both children and adults, but,
adults are the most vulnerable group to excess weight and its health
implications. Worldwide, the percentage of excess weight is 37 in men and 38
in women in 2013, while it is 24 percent for boys and 23 percent for girls [Ng,
et al.(2014)].
The increased prevalence of excess weight is not the only concern for
nations, rather inequalities in its prevalence among population groups is another
concern. Research across the countries shows that various economic and non-
economic factors are responsible for having more body weight than normal
[Popkin, Kim, Rusev, Du and Zizza (2006), Butland, et al. (2007)]. Income
inequality within a country leads to insufficient diet pattern in one group and high
caloric fast food in another group. It leads to the prevalence of malnutrition in
both forms among people. Apart from it, various other factors are responsible for
excess weight; more prominent among them are sedentary lifestyle, physical
activity, and dietary intake.
According to a global disease burden research, Pakistan is ranked 9th
among 188 countries in carrying obese population, in terms of absolute numbers
Acknowledgements: The study completed with the financial support from the GIZ, Health
Sector Support Programme, Pakistan.

2
[Ng, et al. (2014)]. Recent figures for Pakistan suggest that 40 percent of Pakistani
women of reproductive age are either overweight or obese [Pakistan Demographic
and Health Survey (PDHS) (2012-13)]. Although Pakistan is still considered as
an undernourished country in the context of children [National Nutrition Survey
(NNS) (2011)] but given high proportion of overweight adults and limited
consideration to subject matter, creates an alarming situation in the country.
Additionally, its risk factors especially in adult age are important to target
intervention related to its control and prevention that can reduce its long term
negative impact.
2. THEORETICAL FOUNDATION AND
REVIEW OF LITERATURE
Human behaviour is very complex and economics provides us with the
basic tools to understand it. In what way a person behaves in achieving an ideal
body weight along with keeping the desired utility level of consuming food and
enjoying sedentariness, can be studied with the help of economics. For the said
purpose, household production function theory in economic literature has proved
to be a road map for studying it [Chou, Grossman and Saffer (2002); Cawley
(2004); Rashad, Grossman, and Chou (2006); Mann (2008)].
Households not only consume goods and services but also produce
certain more essential commodities using their time and market goods. Among
these essential commodities produced by households, good nutrition is very
important which ultimately leads to good health. Households produce their
own nutrition and health to gain utility subject to time and resources
constraints. Given limited time during a day and limited resources of income,
individuals have to choose about what type of food to eat, how to distribute
time between work and leisure, and how to invest in health etc. [Becker
(1965)].
Hence utility function of the household can be constructed as:
U = U (N, H, F, C, L, O)
Where N stands for nutrition, H for health, F for food intake, C for non-food
consumption, L for leisure, and O for other goods and services which increase the
wellbeing of households. A household gains utility by achieving ideal body
weight, but, at the same time they gain utility by eating. Because food is not only
a biological need for human beings but also a source of pleasure. Therefore,
excess weight is the consequence of achieving other aims [Chou, et al. (2002)]. A
trade-off is to be made here between food consumption and achievement of
healthy body weight. The determinants of nutritional status can be shown from
the function below:
N = N (F, E, I, HH; Ԑ)

3
It expresses that nutritional status depends on food intake (F), energy
consumed (E) through physical activity whether at work or during leisure time
and other individual (I) and household (HH) characteristics [Cawley (2004)].
Now, it is individual decisions and circumstances that decide about a person’s
nutrition status. Due to this reason certain people are more vulnerable to being
overweight and obese than others.
Different factors might be responsible for this differential in body weight
among the population. These include demographic, socio-economic, food
consumption, physical activity and hereditary factors. Age and gender are strong
demographic predictors of overweight and obesity. Research shows that
prevalence of obesity by age displays the U-shape trend i.e. obesity firstly
increases with age and then it starts decreasing [Haslam, Sattar, and Lean (2006)].
Literature also shows that women are more prone to excess weight which might
be due to lack of physical activity being confined at homes [Khan, et al. (2008)].
Like several other health issues, excess weight is also linked with being married
[Janghorbani, et al. (2008).Similarly, social and cultural environment of a residing
area is an important predictor of excess weight due to the diversity of lifestyles.
For instance urban areas have more comforts and facilities than rural areas making
space for a sedentary and inactive routine [Dennis, et al. (2006); Ahmed, Laghari,
Naseer and Mehraj (2013)].
Studies in developing countries like Pakistan provided evidence that
individuals belonging to well-off households are heavier than poor families
[Mushtaq, et al. (2011)]. The reason can be the changing lifestyle of the affluent
class in terms of eating fast foods, easy mode of transportation in cars and reduced
physical activity at home due to nonstop television and access to social media.
However, literature from the developed countries of the world portrays a contrary
concept of poverty and obesity. According to the work on industrialised countries,
obesity occurs through eating low cost junk food containing high calories and
poor nutrients [Drewnowski and Darmon (2005)]. Similarly, education is viewed
as a high socio-economic status in society, which leads to luxurious and sedentary
lifestyle which is an immediate contributor to obesity [Devaux, Sassi, Church,
Cecchini, and Borgonovi (2011)].
Along with these accompanying characteristics, the most immediate causes
of overweight and obesity are food intake and the intensity of physical activity in
daily routine life [Popkin, et al. (2006)]. Popkin, et al. (2006) claim that
individuals consuming high caloric diet compared with low caloric consumption
are more at risk of being overweight and obese. Moreover, fast food intensifies
the fat and caloric intake which is unhealthy for the body. A study shows that an
increase in the trend of eating in restaurants leads to the increase in BMI [Rashad,
et al. (2006)]. Khan, et al. (2008) stated that obese subjects in their study were
leading sedentary lives with little physical activity. As eating habits for both obese
and non-obese subjects were similar it can be seen that there is no association of
food intake with obesity. This shows the critical importance of physical activity

4
in relation to dietary patterns. This energy imbalance created by excess energy
intake and less energy utilisation leads to excess weight [Bleich, Cutler, Murray,
and Adams (2007)].
Genetics also plays an important role in determining overweight and
obesity as shown by various studies. According to a study children are more likely
to be obese if any one of their parents is obese [Whitaker, Wright, Pepe, Seidel,
and Dietz (1997)]. While contradictory results against hereditary factors are also
reported in some of the studies. Antonanzas and Rodriguez (2010) believe that
genetic factors do not play much role in obesity and contribute only 1 percent in
it. A few studies have noted that the environment of the home and family lifestyle
are play a greater role in weight gain than genetics [Crowle and Turner (2010)].
Certain other factors are also associated with overweight and obesity in
worldwide literature including ethnicity [Booth, et al.(2001)], pregnancy and high
parity [Heliovaara and Aromaa (1981)], childhood obesity [Whitaker, et
al.(1997)], breastfeeding behaviour [Kries, et al.(1999)], parental smoking
[Leary, et al.(2006) or more specifically maternal smoking during pregnancy
[Kries, Toschke, Koletzko and Slikker (2002)] and sleep duration [Vorona, et
al.(2005)] etc.
3. DATA AND METHODOLOGY
For the attainment of the study’s objectives, data from Pakistan Panel
Household Survey (PPHS) has been used. It was conducted by Pakistan
Institute of Development Economics in 2010. The dataset contains nutritional
information i.e. weight and height measured for both sexes and for every age
group. The centre of interest in the present study are adults of age 18 years
and above. The reason for using adults is that they are more susceptible to
excess weight and its related co-morbidities [Haslam, et al. (2006); Janssen
(2012)]. Out of a total29744 individuals surveyed, 16819 individuals were of
age 18 years and above. The profile of these adults is given in appendix Table
1A. For estimating the prevalence of overweight and obesity among adults,
the most frequent adopted measure in the literature i.e. Body Mass Index has
been used. It is defined as weight in kilograms divided by the square of the
height in metres.
BMI = Weight (kg)
Height (m2)
BMI scores, yielded from the formula classified in WHO defined
categories are: BMI < 18.5 is classified as underweight; between 18.5 to 24.9is
regarded as healthy weight; ≥ 25 is classified as overweight and ≥ 30 as obese,
which is further subdivided into 3 classes according to the severity of obesity
[WHO (2000)].

5
These BMI cut-offs are internationally accepted, although it is believed that
certain factors are responsible for higher body fat of Asians as compared to
Europeans. That is why a lower BMI cut-off is used for Asian population i.e. 23-
24.9 kg/m2 for overweight and >25 kg/m2 for obesity [WHO expert consultation
(2004)]. For comparing the estimates with worldwide literature, a few studies on
Pakistan and its nationally representative surveys, use international cut-offs
[Dennis, et al.(2006); NNS (2011); PDHS (2012-13)]. Moreover, Asian cut-offs
provide higher estimates compared to the current. As the present study is also
using a nationally representative survey data, therefore the intention is to use
international cut-offs.
Despite the worldwide acceptance and its computational ease, BMI also
holds certain limitations [WHO (1995)]. Critics argue that it does not differentiate
between lean body mass and body fat, hence it cannot be applied to persons with
athletic built. In addition, it does not tell about the distribution of body fat in
different parts of the human body which is more appropriate to detect morbidity
due to obesity.
For working out the differentials and contributing factors for excess weight
in adults, relevant socioeconomic, demographic and behavioural information is
obtained from the dataset. Demographic variables include age, gender and marital
status of the adult. Socio-economic factors incorporated in the study are
education, poverty status, type and place of residence. The physical activity and
food consumption of the adult can be incorporated as the behavioural factors. Due
to lack of particular data, physical activity can be measured indirectly using
variables like work status, type of work, availability of transport facility,
availability of entertainment and availability of labour saving techniques1.
Two Indicators are taken for measuring food consumption pattern. The first
indicator is the number of times household members have eaten out at a restaurant.
The second indicator includes consumption of the following items by a household
during the last week: grains, pulses, oil, sugar, dairy products,2 eggs, meat,
vegetables and fruits, and soft drinks. For vicariate analysis, the quantity of
consumption for each food item is divided into two groups; consumption below
the median and consumption above the median.3 For multivariate analysis, their
consumption is taken in continuous form. Due to lack of individual level data
these variables are taken at household level which is also helpful because mostly
household members share the same eating habits [Crowle and Turner (2010)].
Direct information about hereditary factor which is another important
contributing factor in over-weight and obesity, is missing from the data. For
1Transport facility includes availability of car or motorcycle at home; Entertainment includes
television, computer/laptop or internet connection; and Domestic labour saving techniques includes
washing machine, refrigerator, cooking range or microwave oven. 2Dairy Products includes: milk, yoghurt, lassi, cheese and butter. 3Median value is included in below median category.

6
capturing this input, a variable is constructed having a number of overweight and
obese individuals in a household exempting the overweight and obese individual
itself.
Both vicariate and multivariate analyses are performed for studying the
determinants. For the purpose of multivariate analysis, binary logistic regression
is performed for which the dependent variable, that is the individual’s BMI is
converted into dichotomous variable i.e. BMI<25 and BMI=>25; where BMI
=>25 which is classified as excess weight by WHO. The model equation for
multivariate analysis is given as:
Y = α + β1X1 + β2X2 + …… + βkXk
Where Y is the dependent variable BMI; βs are the co-efficients; k is the number
of independent variables and Xs are the relevant independent variables identified
from the literature.
4. PREVALENCE OF OVERWEIGHT AND OBESITY
The study shows the prevalence of overweight adults in Pakistan is 21
percent while that of obesity is 9 percent, that is we have 30 percent of our adult
population is excess weight index (Figure 1). These results show a high
prevalence of overweight and obesity in Pakistan which is a crucial finding of the
present study.
Fig. 1. Classification of Body Mass Index among Adults
Source: Authors’ Computation from PPHS dataset, 2010.
5. DETERMINANTS OF OVERWEIGHT AND OBESITY
Underweight
13%
Normal weight
57%
Overweight
21%
Obese
9%

7
Results show a strong association between gender and excess weight. A
higher proportion of females have excess weight i.e. 32 percent as compared to
26 percent of males (Figure 2). Similar findings in literature show that women
gain more weight compared to men [Dennis, et al. (2006)]. Women 7410might be
more susceptible to weight gain because of lesser physical activity remaining
confined to homes, as men go out to make a living.
Source: Authors’ Computation from PPHS dataset, 2010.
Age-wise results indicate that excess weight is highly prevalent among
middle aged adults. It is lower in early adulthood, rising from that stage to 40
percent between the ages 35 to 54 and then declining at the elderly stage group to
depict a U shape trend (Figure 3). Similar trend can be seen in another study by
Dennis et al in 2006, where weight increase occurs up to 50 years before starting
to decline.
In the present analysis, the type of residence is taken into account, region
and province-wise. Regionally overweight and obesity is more dominant in urban
areas compared to the rural. Figure 4 indicates excess weight adults at 34 percent
in urban areas and 28 percent in rural areas. Findings of Dennis, et al. (2006)
corroborate the present results. This is so because life styles are starkly different
in urban and rural areas. The pattern and composition of food intake, means of
transportation, and easy access to facilities leads to a sedentary lifestyle
discouraging physical activity that leads to increased weight in urban areas
[Sherin (2013)].
Beside regional differences, provinces too have their own characteristics
according to their socioeconomic and cultural norms leading to nutritional
differences.

8
Source: Authors’ Computation from PPHS dataset, 2010.
Khyber Pakhtunkhwa (KPK) has the highest percentage of excess
weight individuals i.e. 56 percent followed by Punjab and Balochistan where
there is 29 percent occurrence of excess weight. Obesity is more prevalent in
Punjab than overweight which is higher in Balochistan. Sind has the lowest
prevalence of excess weight i.e. 19 percent compared to other provinces
(Figure 5).
The wealth status of individuals shows contradictory results in literature.
According to some researchers the poor are more prone to obesity due to
consumption of unhealthy low cost food [Darmon, Briend, and Drewnowski
(2003); Drewnowski and Darmon (2005)]. Other studies argue that high
socioeconomic status brings ease and access to high caloric food that combined
to a sedentary lifestyle leads to weight gain [Pampel, Denney, and Krueger
(2012)].
Source: Authors’ Computation from PPHS dataset, 2010.
Figure 6: Percentage of Overweight and Obesity by Wealth Status

9
The present results are consistent with studies that favour the notion of
higher obesity among the rich. According to their data the percentage of the over-
weight and the obese is 22 and 9 in rich or middle income groups compared to 17
and 5 percent among the poor (Figure 6).
Further analysis puts currently married adults at 23 and 10 percent
overweight and obese respectively. Following them are those once married having
19 and 11 percentages for overweight and obesity (Figure 7). The lowest
percentage of overweight and obese is among then ever married category i.e. 15
and 4 percent respectively.
Source: Authors’ Computation from PPHS dataset, 2010.
There are similar findings in literature of higher weight among the
currently or formally married than unmarried persons. The reason can be a change
in dietary habits or physical activity, attaching lesser importance to physical
appearance etc. after marriage, and child bearing in case of women [Janghorbani,
et al. (2008)].
Higher education is an indicator of better socioeconomic position of an
individual in society which increases the likelihood of being over-weight [Branca,
et al.(2007)]. These results are shown in Figure 8 where 32 and 35 percent of the
adults in secondary and higher education groups respectively have weight that is
above normal. These percentages are 29 and 27 for no education and primary
education categories respectively.
Work status and type of work are indicators of physical activity which are
an immediate contributing factor to weight gain.
According to the results, highest percentage of overweight (32 percent) and
obesity (13 percent) are among those who are in non-manual or desk jobs.
Meanwhile, persons in manual jobs have low percent of overweight (19 percent)
and obesity (6 percent) because of the labour intensive nature of their work (Table
1). Among those not working, housewives have the highest percent of overweight
(25 percent) and obesity (13 percent), while students have the lowest rates i.e. 13
and 6 percent respectively.

10
Table 1
Percentage of Overweight and Obese by Work Status and Occupation
Work Status/Occupation
BMI Categories
Underweight Normal
Weight
Overweight Obese Total
Work Status
Housewives 12.0 50.4 24.8 12.8 100
Students 21.5 60.2 12.8 5.5 100
Others not in labour force 15.2 62.0 17.5 5.2 100
Unemployed 17.4 58.9 15.8 7.9 100
Non-manual workers 4.5 50.4 32.2 12.9 100
Manual workers 13.8 61.6 18.6 5.9 100
Occupation
Legislators/Senior officials/Managers 11.1 55.6 22.2 11.1 100
Professionals 7.1 50.3 29.0 13.5 100
Technicians/Associate professionals 0.7 55.3 32.6 11.3 100
Clerks 6.1 41.5 39.0 13.4 100
Service and sales workers 12.5 63.9 17.2 6.4 100
Skilled agriculture and fishery workers 11.7 64.7 18.0 5.6 100
Crafts and related trades workers 23.3 52.9 15.4 8.3 100
Plant and machine operators 6.0 57.8 28.9 7.3 100
Elementary occupations 14.9 60.8 19.0 5.2 100
Armed forces 3.0 51.5 30.3 15.2 100
Total 13.3 56.9 21.1 8.7 100
Chi-square value: 0.00.
Note: Others no in the labour force includes elderly, unmarried women and men not working neither
looking for work
Source: Authors’ Computation from PPHS dataset, 2010.
The results are consistent with the present literature [King, et al.
(2001)].Housewives have limited physical activity while staying at home.
Conversely, students being thoroughly engaged in studies might eat less and
consume more through mental and physical exertion resulting in lower weight.
Similar trend of higher rates of overweight and obesity for office or clerical work
and lower rates for manual jobs can be seen in occupation wise analysis. For
example, occupations like senior officials, managers, professionals and clerks
have more percentage of excess weight. Occupations like sales workers,
agriculture, machine operators and elementary occupations have lower rates
(Table 1).
To check whether weight of other family members affects the likelihood of
being overweight, the variable of familial obesity is constructed. Familial obesity
is hence defined as the number of other overweight and obese individuals in the
family.

11
Fig. 9. Percentage of Overweight and Obese Adults by Number of
Overweight Persons in the Family other than the Respondent
Source: Authors’ Computation from PPHS dataset, 2010.
Results show, the, higher the number of excess weight individuals in the
family, the more is the chance of getting overweight and obese. For example, 21
percent of excess weight individuals have no other overweight and obese in the
family. However, 37 percent of excess weight individuals have one to two other
excess weight individuals in the family. More prominently, 55 percent of excess
weight individuals have three or more other overweight and obese in the
household (Figure 9). Similar results can be seen from the literature which
associates it with mutual eating habits and family life style [Whitaker, et al.
(1997); Crowle and Turner (2010)].
Table 2 indicates high occurrence of obesity i.e. 10 percent among those
who have taken meals outside homes as compared to those that haven’t i.e. 8
percent. The rationale behind it is that food outsides homes can be more energy
dense and caloric. Moreover, portion sizes and quantity of servings are large in
restaurants compared to homes where one does not generally overeat. Similar
trend is suggested by Rashad, et al. (2006). These results are also seen in
accordance with both rural and urban areas separately (Table 2). It also shows
similar results i.e. high obesity in those eating-out as compared to their
counterparts. However, more prominent differential in obesity rates is seen
between urban areas and rural areas. Results specify only 1 percent differential
for rural and 9 percent for urban areas between both groups. Urban areas have
more prominent differential in results because eating-out and hostelling is an
urban phenomenon.
0
5
10
15
20
25
30
35
40
No Overweight One or Two Three or More
15.1
25.5
37.3
5.4
11.2
17.8
Overweight Obese
12
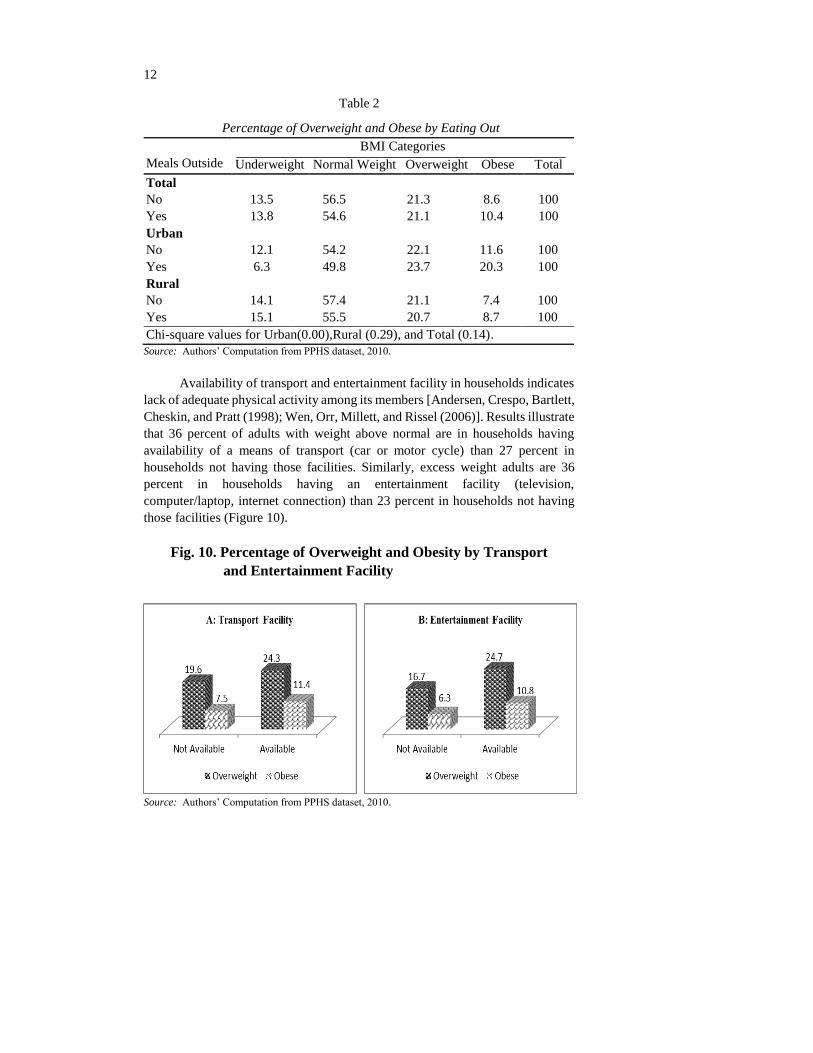
Table 2
Percentage of Overweight and Obese by Eating Out
Meals Outside
BMI Categories
Underweight Normal Weight Overweight Obese Total
Total
No 13.5 56.5 21.3 8.6 100
Yes 13.8 54.6 21.1 10.4 100
Urban
No 12.1 54.2 22.1 11.6 100
Yes 6.3 49.8 23.7 20.3 100
Rural
No 14.1 57.4 21.1 7.4 100
Yes 15.1 55.5 20.7 8.7 100
Chi-square values for Urban(0.00),Rural (0.29), and Total (0.14).
Source: Authors’ Computation from PPHS dataset, 2010.
Availability of transport and entertainment facility in households indicates
lack of adequate physical activity among its members [Andersen, Crespo, Bartlett,
Cheskin, and Pratt (1998); Wen, Orr, Millett, and Rissel (2006)]. Results illustrate
that 36 percent of adults with weight above normal are in households having
availability of a means of transport (car or motor cycle) than 27 percent in
households not having those facilities. Similarly, excess weight adults are 36
percent in households having an entertainment facility (television,
computer/laptop, internet connection) than 23 percent in households not having
those facilities (Figure 10).
Fig. 10. Percentage of Overweight and Obesity by Transport
and Entertainment Facility
Source: Authors’ Computation from PPHS dataset, 2010.

13
The Households using electric appliances like refrigerator, microwave
oven, cooking range and washing machine etc. are more prone to overweight and
obesity. Percentages of overweight and obesity is 27 and 14 in households having
electric appliances than 15 and 7 percent respectively in households without these
appliances (Figure 11). Literature shows that owning electric appliances indicates
reduced time and labour on domestic chores, leading to reduced physical activity
and weight gain [Lanningham-Foster, et al.(2003)].
Fig. 11. Percentage of Overweight and Obesity by Domestic
Labour Saving Techniques Facility
Source: Authors’ Computation from PPHS dataset, 2010.
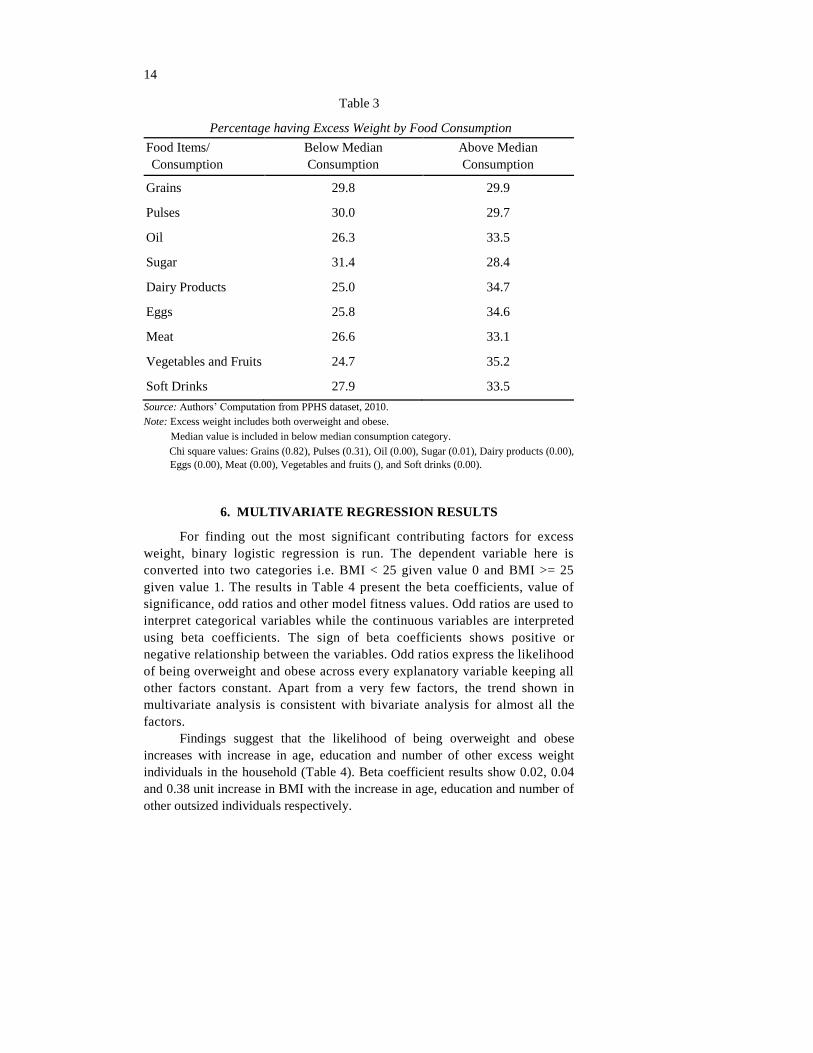
Food consumption is another immediate contributing factor of weight gain
along with physical activity. If the diet composition is made up of food items
comprising more fats and sugar, it contributes to increased weight gain [Guo,
Warden, Paeratakul, and Bray (2004); Branca, et al. (2007)]. According to results
households that consume above median quantity of oil, dairy products, eggs, meat,
and soft drinks have high frequency of excess weight members. Comparatively,
households consuming above median quantity of nutritious diet like grains and
pulses have less proportion of excess weight individuals (Table 3).
Conflicting results are seen in families consuming fruit and vegetables yet
having more excess weight individuals. This might be due to the reason that only
rich people, who are more prone to overweight and obesity (as indicated by
previous results), can afford to consume more fruits. Similarly, another opposing
result comes from sugar consumption i.e. high consumption of sugar households
have less excess weight individuals (Table 3). This can be linked to the fact that
poor people consume more sugar compared to rich class which has access to more
costly alternatives to sugar.
14
Table 3
Percentage having Excess Weight by Food Consumption
Food Items/
Consumption
Below Median
Consumption
Above Median
Consumption
Grains 29.8 29.9
Pulses 30.0 29.7
Oil 26.3 33.5
Sugar 31.4 28.4
Dairy Products 25.0 34.7
Eggs 25.8 34.6
Meat 26.6 33.1
Vegetables and Fruits 24.7 35.2
Soft Drinks 27.9 33.5
Source: Authors’ Computation from PPHS dataset, 2010.
Note: Excess weight includes both overweight and obese.
Median value is included in below median consumption category.
Chi square values: Grains (0.82), Pulses (0.31), Oil (0.00), Sugar (0.01), Dairy products (0.00),
Eggs (0.00), Meat (0.00), Vegetables and fruits (), and Soft drinks (0.00).
6. MULTIVARIATE REGRESSION RESULTS
For finding out the most significant contributing factors for excess
weight, binary logistic regression is run. The dependent variable here is
converted into two categories i.e. BMI < 25 given value 0 and BMI >= 25
given value 1. The results in Table 4 present the beta coefficients, value of
significance, odd ratios and other model fitness values. Odd ratios are used to
interpret categorical variables while the continuous variables are interpreted
using beta coefficients. The sign of beta coefficients shows positive or
negative relationship between the variables. Odd ratios express the likelihood
of being overweight and obese across every explanatory variable keeping all
other factors constant. Apart from a very few factors, the trend shown in
multivariate analysis is consistent with bivariate analysis for almost all the
factors.
Findings suggest that the likelihood of being overweight and obese
increases with increase in age, education and number of other excess weight
individuals in the household (Table 4). Beta coefficient results show 0.02, 0.04
and 0.38 unit increase in BMI with the increase in age, education and number of
other outsized individuals respectively.

15
Table 4
Result of Binary Logistic Regression for Determinants of
Overweight and Obesity
Explanatory Variables B Coefficient Significance Value Odd Ratio
Age (in Single Years) 0.015* 0.00 1.015
Female adults1 0.264* 0.00 1.302
Province – Sindh2 –0.464* 0.00 0.629
Province – KPK 0.774* 0.00 2.169
Province – Balochistan –0.042 0.65 0.959
Rural residents3 –0.246* 0.00 0.782
Poor wealth status4 –0.023 0.76 0.977
Currently married5 0.750* 0.00 2.117
Separated/Divorced/Widowed 0.330* 0.02 1.391
Education (in single years) 0.037* 0.00 1.037
Work status –Students6 –1.056* 0.00 0.348
Work status – Other not in labour force –0.401* 0.00 0.670
Work status –Unemployed –0.272 0.11 0.762
Work status –Non-manual workers –0.041 0.77 0.960
Work status – Manual workers –0.125 0.11 0.882
Car availability7 0.232* 0.02 1.261
Motorcycle availability8 0.037 0.52 1.038
Entertainment availability9 0.000 1.00 1.000
Labour saving techniques availability10 0.264* 0.00 1.302
Number of meals eaten-out –0.002 0.77 0.998
Consumption of Grains (in kg) –0.008 0.36 0.992
Consumption of Pulses (in kg) –0.014 0.94 0.987
Consumption of Oil (in litres) 0.482* 0.00 1.619
Consumption of Dairy Products (in litres) 0.007 0.51 1.007
Consumption of Meat (in kg) –0.115 0.23 0.891
Consumption of Eggs (in numbers) 0.065* 0.01 1.067
Consumption of Soft Drinks (in numbers) 0.092 0.11 1.096
Consumption of Sugar (in kg) –0.025 0.73 0.975
Consumption of Vegetables and Fruits (in kg) 0.093* 0.01 1.097
Other overweight family members (numbers) 0.381* 0.00 1.463
Constant –2.657* 0.00 0.070
Model Chi-square 1545.941
Model Significance 0.00
Log likelihood 10340.536
Cox and Snell R2 0.147
Nagelkerke R2 0.208
Predicted Percentage 73.4
Source: Authors’ Computation from PPHS dataset, 2010.
Reference Categories: 1Male adults, 2Adults in Punjab province, 3Urban residents, 4Adults of non-
poor wealth status, 5Adults who are never married, 6Housewives, 7Individuals of households not
owning a car, 8 Individuals of households not owning a motorcycle, 9 Individuals of households not
owning an entertainment facility, 10Individuals of households not owning any labour saving
techniques.
*Indicates significance of a variable; Variables in Continuous form are in Italics.

16
The results also show that females are 1.3 times more likely to be
overweight and obese as compared to males. Among provinces, data assigns KPK
as the province having highest proportion of excess weight individuals i.e. the
likelihood of individuals being 2.2 times more overweight and obese in KPK than
in Punjab. The other two provinces have a lower likelihood of overweight and
obesity as compared to Punjab. Similarly, adults living in rural areas are 0.8 times
less likely to weight gain than the urban residents.
Results regarding association between wealth status and weight shows less
weight i.e. 0.97 times less, for poor people than the non-poor. For marital status,
currently married adults have highest (2.1 times) likelihood of being overweight
followed by ever married adults (1.4 times) as compared to the category of never
married individuals (Table 4). The work status of the individuals indicates that
housewives have the highest likelihood of being overweight and obese. Moreover,
adults having the availability of car, motorcycle, entertainment facilities and
labour saving devices have 1.26, 1.04, 1.0, and 1.3 times greater probability of
weight gain respectively than those deprived of these facilities.
The results for meals taken outside home are inconsistent with the bivariate
results (Table 4). Here, the results display a decrease in weight with the increase
in number of meals taken outside homes. However, these results are not
significant. According to the findings regarding consumption of different food
items, BMI decreases by 0.01, 0.01, 0.12, and 0.03 points with one kg increase in
grains, pulses, meat and sugar respectively. Conversely, with the increase in the
consumption of one unit (litre, number and kg) of oil, dairy products, eggs, soft
drinks, vegetables and fruits, BMI will also increase by 0.48, 0.01, 0.07, 0.09 and
0.09 points correspondingly. Nevertheless, food consumption results are
significant only for oil, eggs and vegetables and fruits. The rest of the food
consumption variables are insignificant.
Significant results for multivariate analysis show that the most significant
contributing factors for overweight and obesity are age, gender, province, region,
marital status, education, work status, car availability, labour saving devices,
consumption of oil, eggs, vegetables and fruits, and familial obesity (Table 4). On
the other hand, insignificant factors include poverty, availability of motorcycle
and entertainment facility, eating out, and consumption of grains, pulses, dairy
products, meat, sugar and soft drinks. Additionally, the p-value of 0.00 for the
significant model shows that the overall model is statistically significant. The
explanatory variables chosen for the model predict 73 percent of variation in the
dependent variable, that is overweight and obesity.
7. CONCLUSIONS
After afflicting the developed world, overweight and obesity is now on the
increase in developing countries also. Its increased prevalence and continuous
rise, has become the present concern of nations. The evidence suggests that
17
Pakistan is among those nations having high prevalence of excess weight. The
findings of the present study yield 21 and 9 percent prevalence of overweight and
obesity respectively in Pakistani adults.
Literature shows that various socio-economic characteristics and sedentary
lifestyle is responsible for overweight and obesity. The results show high
prevalence of excess weight in middle age adults, females, in province KPK,
among urban residents, married, educated, and rich adults, in non-manual workers
and housewives, and among those eating meals outside homes. It is also found
high in those having other excess weight family members, having availability of
different time and energy saving devices and among those taking fatty diet. Along
with certain demographic and social characteristics, results of multivariate
analysis reveal physical activity variables to be the significant determinants of
excess weight instead of food consumption variables. This highlights the
importance of energy balance in terms of spending more energy than consuming.
Familial obesity is also a significant factor for excess weight which draws
attention to the mutual eating habits and life style of the family. Interestingly,
poverty turns out to be an insignificant factor.
The study provides a comprehensive understanding of the pandemic of
overweight and obesity amongst adults in Pakistan. It gives evidence of high
prevalence of overweight and obesity; however, strategies to overcome it are not
incorporated in the health plans of the country. In this backdrop, there is a need
for policies and interventions for tackling this issue. Policies should not only focus
on the obese individuals to control excess weight rather prevention strategies
should also be made for those at risk of being overweight and obese. The most
vulnerable group should be targeted for intervention prior to the rest of the
population. Policy makers should target families instead of individuals for their
intervention. Lack of physical activity came out to be the most significant cause
of weight gain in the present research. To overcome it, adoption of active lifestyle
should be advocated. Instead of using transport facilities for short distances,
walking should be promoted. Advocacy should be directed at importance of
exercise in daily routine especially if one is involved in a physical inactive
occupation. Adoption of the strategies to overcome excess weight can aid in
reducing its negative implications and attaining a sustainable health care sector.

18
Appendix
Table 1A
Basic Characteristics of the Sampled Population Background Characteristics Frequency Percentage
Population Children <18 12925 43.5
Adults =>18 16819 56.5
Gender Male 8788 52.3
Female 8031 47.7
Region Urban 4824 28.7
Rural 11995 71.3
Province Punjab 6816 40.5
Sind 4974 29.6
Khyber Pakhtunkhaw 3119 18.5
Balochistan 1910 11.4
Age 18-24 4641 27.6
25-34 4508 26.8
35-44 2831 16.8
45-54 2074 12.3
55-64 1437 8.5
65+ 1328 7.9
Education No education 9315 56.7
Primary 2047 12.4
Secondary 3166 19.3
Higher 1914 11.6
Marital Status Never married 4846 28.8
Currently married 10804 64.2
Separated/widowed/divorced 1167 6.9
Poverty Non poor 13545 81.7
Poor 3044 18.3
Work Status Housewives 4828 29.4
Students 791 4.8
Persons not in the labour force 2113 12.9
Unemployed 422 2.6
Non-manual work 884 5.4
Manual work 7364 44.9
Occupation Legislators, senior officials and managers 27 0.3
Professionals 252 3
Technicians and associate professionals 247 3
Clerks 225 2.7
Service workers, shop and market sales workers 864 10.5
Skilled agriculture and fishery workers 2324 28.1
Crafts and related trades workers 690 8.3
Plant and machine operators and assemblers 487 5.9
Elementary occupations 3014 36.5
Armed forces 134 1.6
Transport Facility Not available 11091 66.1
Available 5691 33.9
Entertainment Facility Not available 7116 42.4
Available 9664 57.6
Domestic Labour Saving
Devices
Not available 6982 41.7
Available 9773 58.3
Eating-out No 13169 85.7
Yes 2194 14.3
Familial Obesity Having no other obese in the family 7717 47.9
Having 1 to 2 other obese 7007 43.5
Having 3 or more obese 1396 8.7
Frequency Mean
Food Consumption Consumption of Grains (kg) 16813 3.52
Consumption of Pulses (kg) 16809 0.15
Consumption of Oil (kg) 16805 0.27
Consumption of Dairy Products (litre) 16805 1.99
Consumption of Meat (kg) 16795 0.18
Consumption of Eggs (numbers) 16782 0.55
Consumption of Soft Drinks (bottles) 16782 0.12
Consumption of Sugar (kg) 16780 0.45
Consumption of Vegetables and Fruits (kg) 16801 0.87
Nutritional Status Weight (kg) 11513 56.84
Height (cm) 11554 153.18

19
REFERENCES
Ahmed, J., A. Laghari, M. Naseer, and V. Mehraj (2013) Prevalence of and
Factors Associated with Obesity among Pakistani School Children: A School-
based, Cross-sectional Study. Eastern Mediterranean Health Journal 19:3,
242–247.
Andersen, R. E., C. J. Crespo, D. J. Bartlett, L. J. Cheskin, and M. Pratt (1998)
Relationship of Physical Activity and Television Watching with Body Weight
and Level of Fatness among Children. Journal of American Medical
Association 279, 938–942.
Antonanzas, F. and R. Rodriguez (2010) Feeding the Economics of Obesity in
the EU in a Healthy Way. The European Journal of Health Economics 11:4,
351–353.
Becker, G. S. (1965) A Theory of the Allocation of Time. The Economic Journal
75:299, 493–517.
Bleich, S., D. Cutler, C. Murray, and A. Adams (2007) Why is the Developed
World Obese? National Bureau of Economic Research, (Working Paper,
12954).
Booth, M. L., M. Wake, T. Armstrong, T. Chey, K. Hesketh, and S. Mathur
(2001) The Epidemiology of Overweight and Obesity among Australian
Children and Adolescents, 1995-97. Australian and New Zealand Journal of
Public Health 25:2, 162–9.
Branca, F., H. Nikogosian, and T. Lobstein (eds.) (2007) The Challenge of
Obesity in the WHO European Region and the Strategies for Response. World
Health Organisation: Europe.
Butland, B., S. Jebb, P. Kopelman, K. McPherson, S. Thomas, J. Mardell, and
V. Parry (2007) Foresight, Tackling Obesities: Future Choices, Project Report
2nd Edition, UK Government Office for Science.
Cawley, J. (2004) An Economic Framework for Understanding Physical Activity
and Eating Behaviours. American Journal of Preventive Medicine 27:3S, 117–
125.
Chou, S. Y., M. Grossman, and H. Saffer (2002) An Economic Analysis of
Adult Obesity: Results from the Behavioural Risk Factor Surveillance System.
National Bureau of Economic Research Massachusetts Avenue: Cambridge.
(Working Paper 9247).
Crowle, J. and E. Turner (2010) Childhood Obesity: An Economic Perspective.
The Productivity Commission, Commonwealth of Australia. (Staff Working
Paper).
Darmon, N., A. Briend, and A. Drewnowski (2003) Energy-dense Diets are
Associated with Lower Diet Costs: A Community Study of French Adults.
Public Health Nutrition 7:1, 21–27.
Dennis, B., K. Aziz, L. She, A. Faruqui, C. Davis, T. Manolio, G. Burke, and S.
Aziz (2006) High Rates of Obesity and Cardiovascular Disease Risk Factors

20
in Lower Middle Class Community in Pakistan: The Metroville Health Study.
Journal of Pakistan Medical Association 56:6, 267–272.
Devaux, M., F. Sassi, J. Church, M. Cecchini, and F. Borgonovi (2011)
Exploring the Relationship Between Education and Obesity. OECD Journal:
Economic Studies 1, 121–159.
Drewnowski, A. and N. Darmon (2005) The Economics of Obesity: Dietary
Energy Density and Energy Cost. The American Journal of Clinical Nutrition
82, 265S–273S.
Guo, X., B. A. Warden, S. Paeratakul, and G. A. Bray (2004) Healthy Eating
Index and Obesity. European Journal of Clinical Nutrition 58, 1580–1586.
Haslam, D., N. Sattar, and M. Lean (2006) ABC of Obesity: Obesity-Time to
Wake Up. British Medical Journal 333:7569, 640–642.
Heliovaara, M. and A. Aromaa (1981) Parity and Obesity. Journal of
Epidemiology and Community Health 35, 197–199.
Janghorbani, M., M. Amini, H. Rezvanian, M. Gouya, A. Delavari, S. Alikhan,
and A. Mahdavi (2008) Association of Body Mass Index and Abdominal
Obesity with Marital Status in Adults. Archives of Iranian Medicine 11:3,
274–281.
Janssen, I. (2012) Health Care Costs of Physical Inactivity in Canadian Adults.
Applied Physiology, Nutrition and Metabolism 37:4, 803–806.
Khan, M. H., H. Khan, G. Sarwar, B. Iftikhar, A. Jan, M. Naimat-ullah, and A.
Gul (2008) Study of Obese Persons Profile at D.I. Khan, NWFP, Pakistan.
Gomal Journal of Medical Sciences 6:2, 77–80.
King, G. A., E. C. Fitzhugh, D. R. Bassett, J. E. McLaughlin, S. J. Strath, A. M.
Swartz, and D. L. Thompson (2001) Relationship of Leisure-Time Physical
Activity and Occupational Activity to the Prevalence of Obesity. International
Journal of Obesity 25, 606–612.
Kries, R., A. M. Toschke, B. Koletzko, and W. Slikker (2002) Maternal Smoking
during Pregnancy and Childhood Obesity. American Journal of Epidemiology
156:10, 954–961.
Kries, R., B. Koletzko, T. Sauerwald, E. Mutius, D. Barnert, V. Grunert, and
H. Voss (1999). Breast Feeding and Obesity: Cross Sectional Study. British
Medical Journal 319, 147–50.
Lanningham-Foster, L., L. J. Nysse, and J. A. Levine (2003) Labour Saved,
Calories Lost: The Energetic Impact of Domestic Labour-saving Devices.
Obesity Research 11:10, 1178–1181.
Leary, S. D., G. D. Smith, I. S. Rogers, J. J. Reilly, J.C.K. Wells, and A. R. Ness
(2006) Smoking during Pregnancy and Offspring Fat and Lean Mass in
Childhood. Obesity (Silver Spring) 14:12, 2284–2293.
Mann, S. (2008) Framing Obesity in Economic Theory and Policy. Review of
Social Economy 66:2, 163–179.

21
Mushtaq, M. U., S. Gull, U. Shahid, M. M. Shafique, H. M. Abdullah, M.A.
Shad, and A.M. Siddiqui (2011) Family-based Factors Associated with
Overweight and Obesity among Pakistani Primary School Children. Bio
Medical Central Pediatrics 11:114.
National Institute of Population Studies (2013) Nutrition of Children and Women.
In Pakistan Demographic and Health Survey 20012-13 (pp. 163). Islamabad,
Pakistan: National Institute of Population Studies and Macro International Inc.
Ng, M. et al. (2014) Global, Regional, and National Prevalence of Overweight
and Obesity in Children and Adults during 1980–2013: A Systematic Analysis
for the Global Burden of Disease Study 2013. Lancet 384, 766–81.
Pakistan, Government of (2011) National Nutrition Survey 2011. Agha Khan
University, Medical Research Council and Nutrition Wing, Cabinet Division.
Pampel, F.C., J. T. Denney, and P. M. Krueger (2012) Obesity, Socio-economic
Status and Economic Development: A Test of the Reversal Hypothesis. Social
Science and Medicine 74:7, 1073–1081,
Popkin, B. M., S. Kim, E. R. Rusev, S. Du, and C. Zizza (2006) Measuring the
Full Economic Cost of Diet, Physical Activity and Obesity Related Chronic
Diseases. Obesity Reviews 7, 271–293.
Rashad, I., M., Grossman, and S. Chou (2006) The Super Size of America: An
Economic Estimation of Body Mass Index and Obesity in Adults. Eastern
Economic Journal 32:1, 133–148.
Schmidhuber, J., and P. Shetty (2005) Nutrition Transition, Obesity and Non-
communicable Diseases: Drivers, Outlook and Concerns. SCN News 29, 13–
19. Food and Agriculture Organisation of the UN.
Sherin, A. (2013) Obesity: How to Prevent Pakistani People from Getting
Heavier? Khyber Medical University Journal 5:2, 59–60.
Vorona, R. D., M. P. Winn, T. W. Babineau, B. P. Eng, H. R. Feldman, and J. S.
Ware (2005) Overweight and Obese Patients in a Primary Care Population
Report Less Sleep than Patients with a Normal Body Mass Index. Archives of
Internal Medicine 165, 25–30.
Wen, L. M., N. Orr, C. Millett, and C. Rissel (2006) Driving to Work and
Overweight and Obesity: Findings from the 2003 New South Wales Health
Survey, Australia. International Journal of Obesity 30, 782–786.
Whitaker, R. C., J. A. Wright, M.S. Pepe, K. S. Seidel, and W. A. Dietz (1997)
Predicting Obesity in Young Adulthood from Childhood and Parental Obesity.
The New England Journal of Medicine 337:13, 869–873.
World Health Organisation (1995) Physical Status: The Use and Interpretation of
Anthropometry. World Health Organisation, Geneva. (Technical Report
Series, 854).
World Health Organisation (2000) Obesity: Preventing and Managing the Global
Epidemic. World Health Organisation, Geneva. (Technical Report Series,
894).

22
World Health Organisation (2014) Global Data base on Body Mass Index. BMI
Distribution in Pakistan, 1994. World Health Organisation.
World Health Organisation Expert Consultation (2004) Appropriate Body Mass
Index for Asian Populations and its Implications for Policy and Intervention
Strategies. Lancet 363, 157–63.