pagerank for product image search - tamara berg
TRANSCRIPT
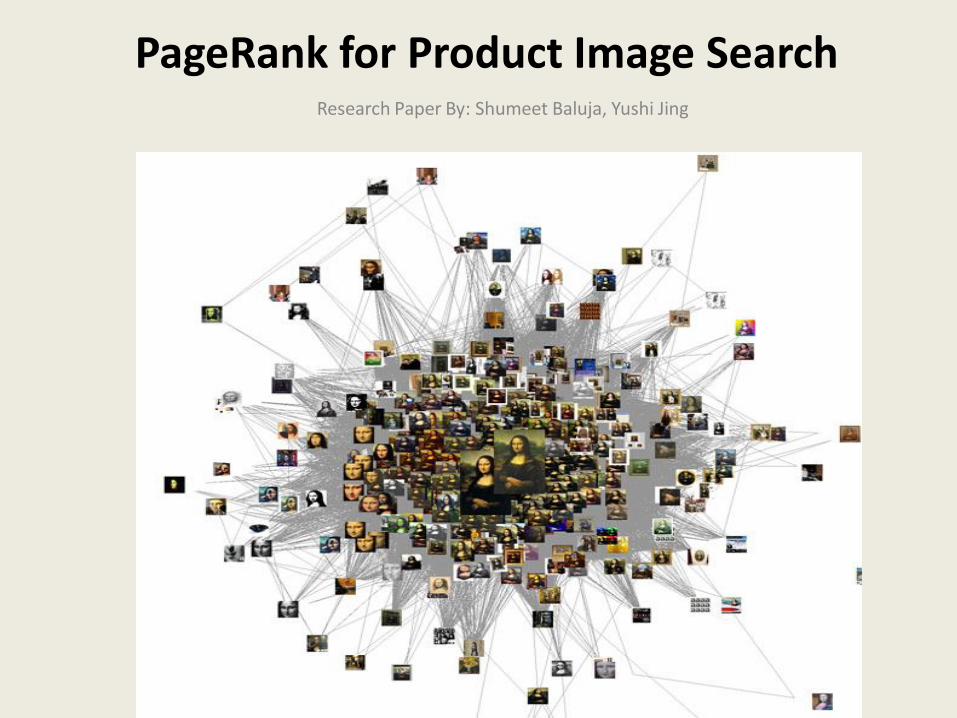
PageRank for Product Image SearchResearch Paper By: Shumeet Baluja, Yushi Jing
Topics
• Motivation
• What is PageRank?
• ImageRank Algorithm• Features generation & Similarity measure
• Concept of Centrality
• PageRank ImageRank
• IR - Mathematics
• Full retrieval system based on ImageRank
• Applications & Failure cases
• Questions?
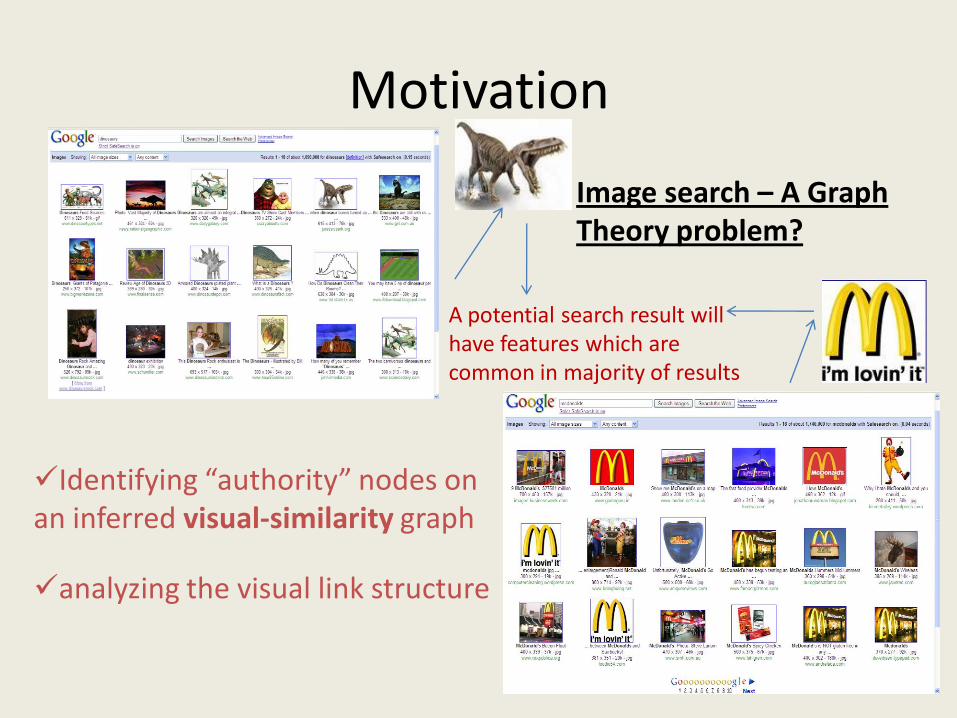
Motivation
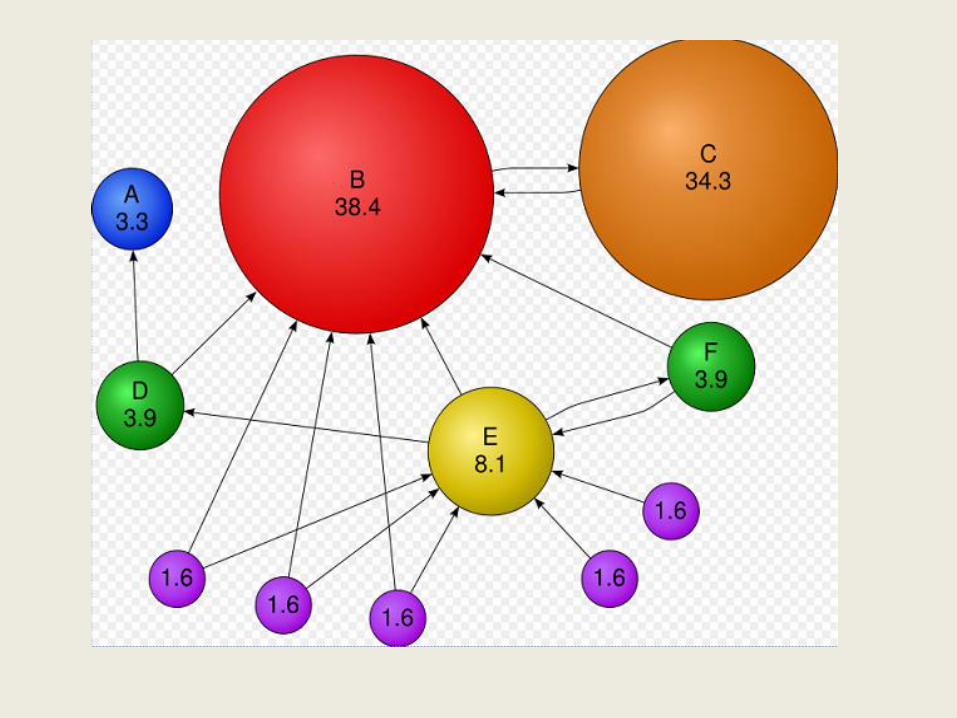
Identifying “authority” nodes on an inferred visual-similarity graph
analyzing the visual link structure
Image search – A Graph Theory problem?
A potential search result will have features which are common in majority of results
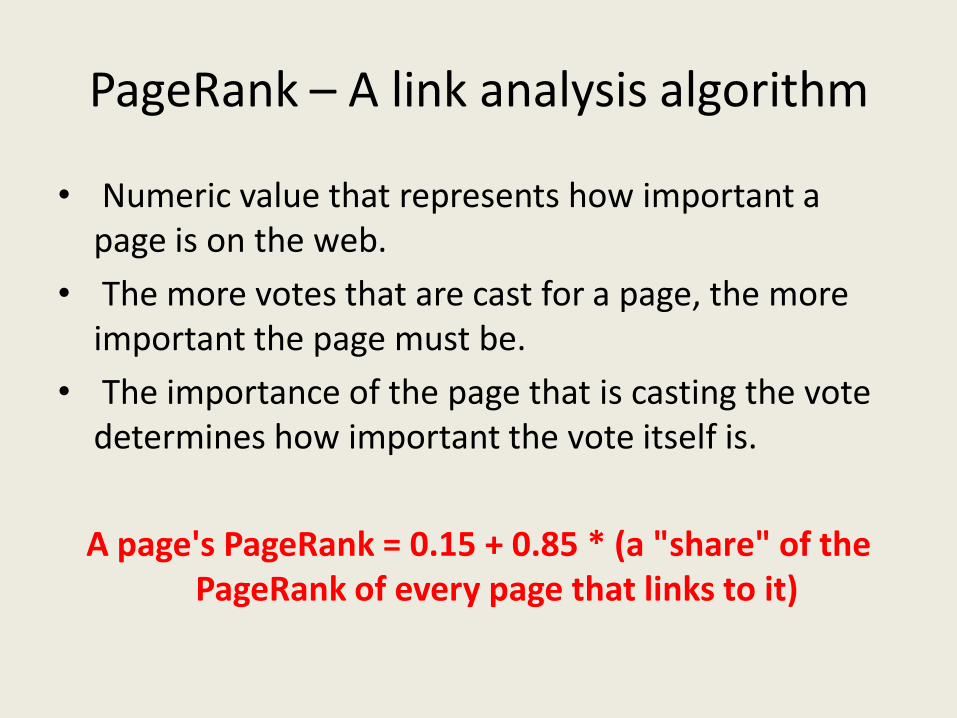
PageRank – A link analysis algorithm
• Numeric value that represents how important a page is on the web.
• The more votes that are cast for a page, the more important the page must be.
• The importance of the page that is casting the vote determines how important the vote itself is.
A page's PageRank = 0.15 + 0.85 * (a "share" of the PageRank of every page that links to it)
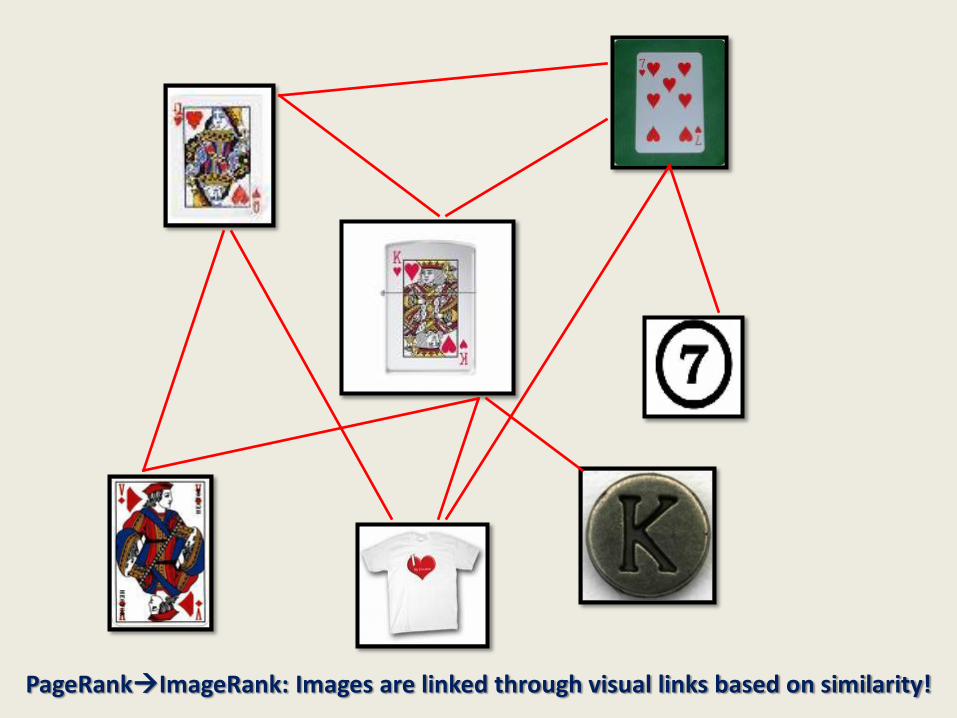
PageRankImageRank: Images are linked through visual links based on similarity!
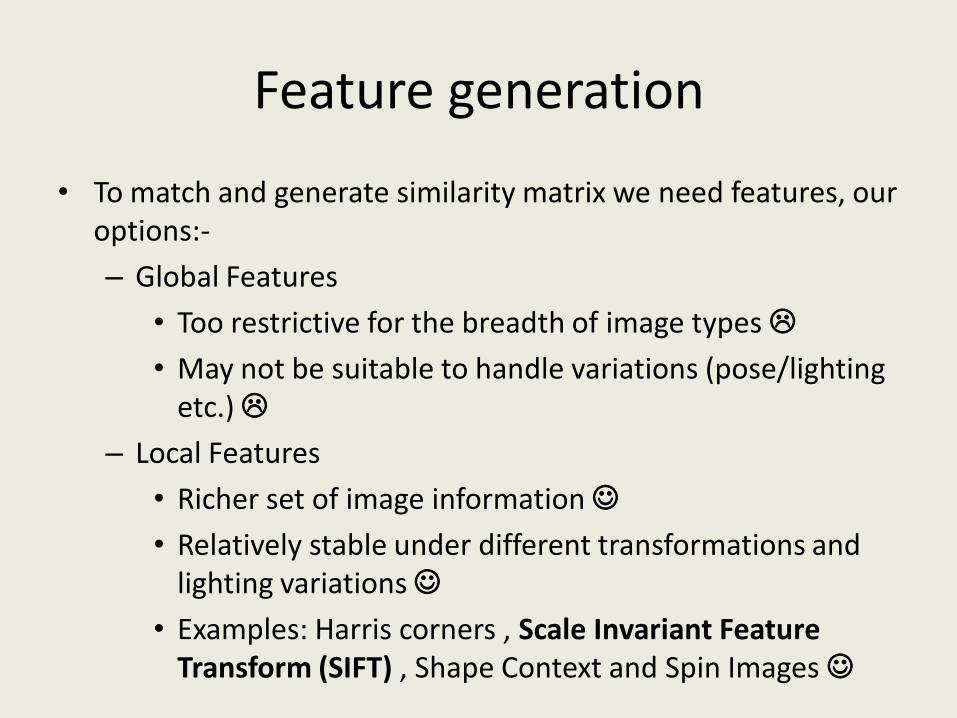
Feature generation
• To match and generate similarity matrix we need features, our options:-
– Global Features
• Too restrictive for the breadth of image types
• May not be suitable to handle variations (pose/lighting etc.)
– Local Features
• Richer set of image information
• Relatively stable under different transformations and lighting variations
• Examples: Harris corners , Scale Invariant Feature Transform (SIFT) , Shape Context and Spin Images
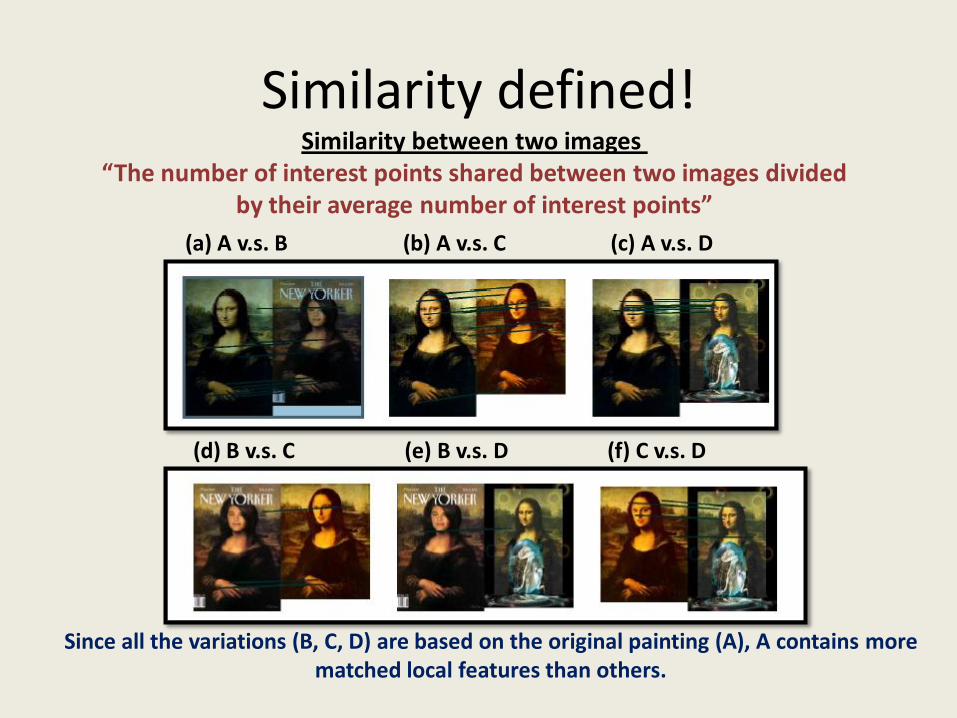
Similarity defined!Similarity between two images
“The number of interest points shared between two images dividedby their average number of interest points”
(a) A v.s. B (b) A v.s. C (c) A v.s. D
(d) B v.s. C (e) B v.s. D (f) C v.s. D
Since all the variations (B, C, D) are based on the original painting (A), A contains more matched local features than others.
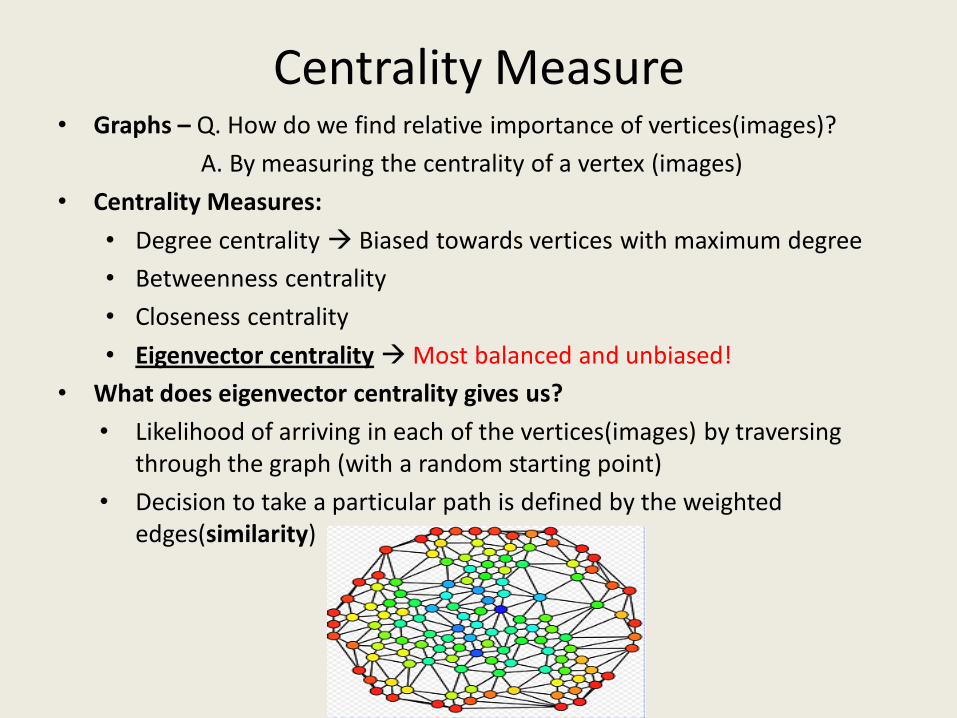
Centrality Measure• Graphs – Q. How do we find relative importance of vertices(images)?
A. By measuring the centrality of a vertex (images)
• Centrality Measures:
• Degree centrality Biased towards vertices with maximum degree
• Betweenness centrality
• Closeness centrality
• Eigenvector centralityMost balanced and unbiased!
• What does eigenvector centrality gives us?
• Likelihood of arriving in each of the vertices(images) by traversing through the graph (with a random starting point)
• Decision to take a particular path is defined by the weighted edges(similarity)
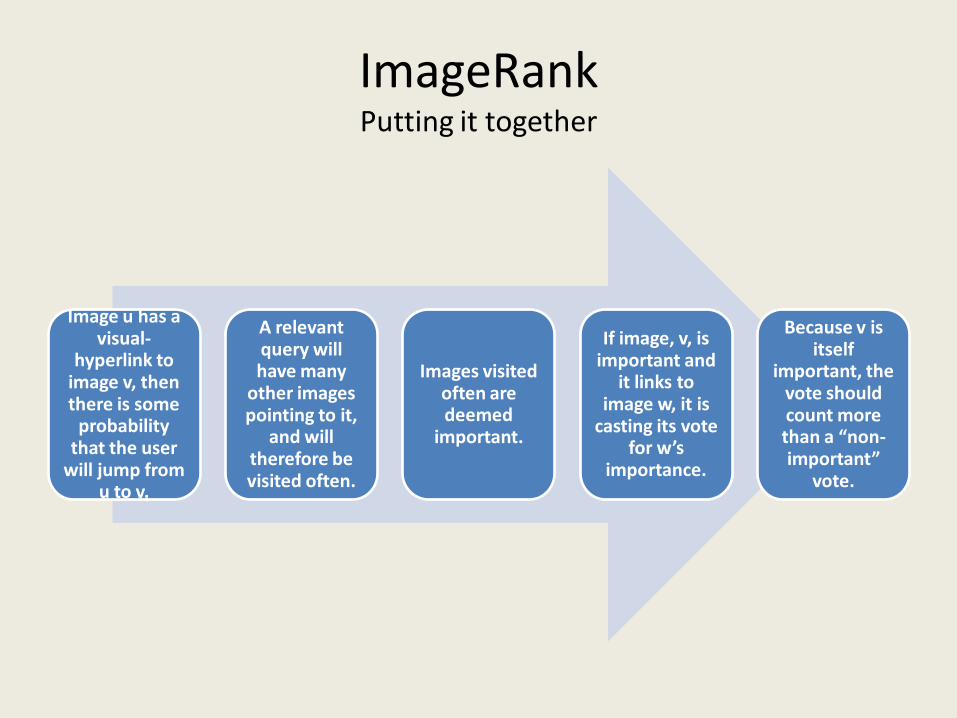
ImageRankPutting it together
Image u has a visual-
hyperlink to image v, then there is some
probability that the user
will jump from u to v.
A relevant query will have many
other images pointing to it,
and will therefore be visited often.
Images visited often are deemed
important.
If image, v, is important and
it links to image w, it is
casting its vote for w’s
importance.
Because v is itself
important, the vote should count more than a “non-important”
vote.

IR - The Mathematics• ImageRank is a variant of Eigen vector Centrality
• The Equation
– S* Column normalized, symmetrical adjacency matrix S
– Su,vMeasures the visual similarity between image u & v
– IR ImageRank
– d damping factor (d > 0.8 often chosen)
– n number of images
IR = dS* × IR + (1 − d)p, where p = *1/n+n×1
• A simple/understandable version:
PR(A) = (1-d) + d (PR(T1)/C(T1) + … + PR(Tn)/C(Tn))
• Role of damping factor (Two Reasons)
– To avoid some pages influencing the rank too much, we damp down the over all rank.
– For convergence! – It produces strong connectivity in the graph.
Full Retrieval System – Where do we win?
• Queries with homogeneous visual concepts
• System produces good results by identifying the vertices that are located at the “center” of weighted similarity graph.
• Example: Monalisa.
• Queries with heterogeneous visual concepts
• Approach is able to identify a relevant and diverse set of clusters there is no bias – how? Example: Jaguar, Apple
• Eigen vector centrality measure pays attention to ‘global’ structure of network/graph and ignores local patterns – that's how!
• Query Dependent Ranking
• Shall we generate the similarity graph S for the billions of images on web? NO!
• OR Precluster web images based using metadata such as text, anchor text.
• OR Use existing search engines to get initial result set.
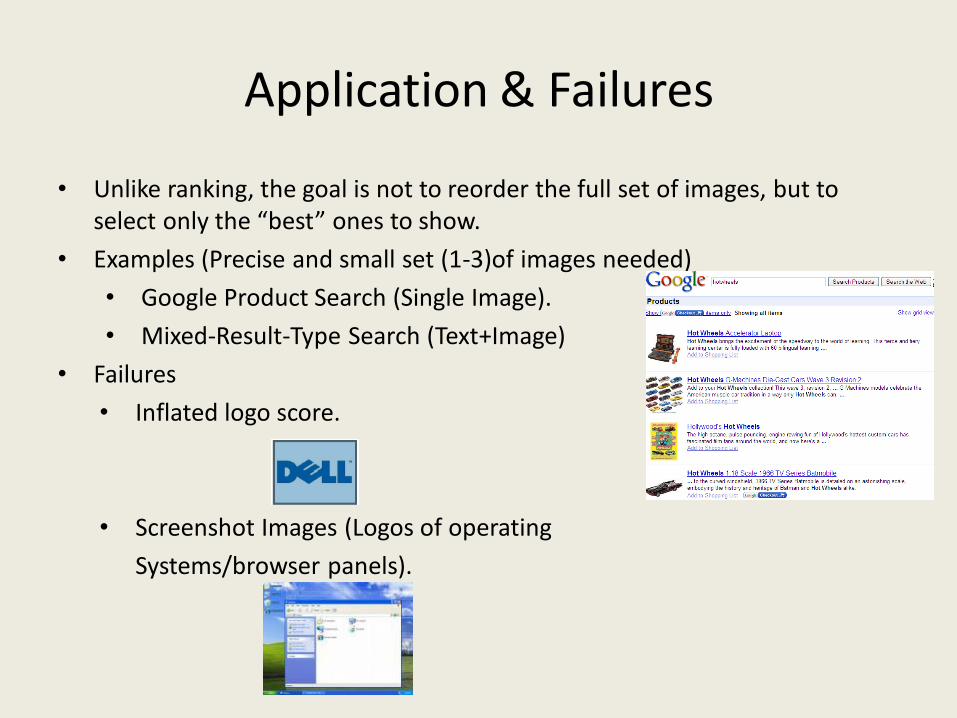
Application & Failures
• Unlike ranking, the goal is not to reorder the full set of images, but to select only the “best” ones to show.
• Examples (Precise and small set (1-3)of images needed)
• Google Product Search (Single Image).
• Mixed-Result-Type Search (Text+Image)
• Failures
• Inflated logo score.
• Screenshot Images (Logos of operating
Systems/browser panels).

Questions?