page 850 appendix 4 – sterman 1989 data 2. 3. 4. · page 851 9. dme charts – charts comparing...
TRANSCRIPT

Page 850
APPENDIX 4 – STERMAN 1989 DATA
Appendix 4 Sterman 1989 Data contains several documents:
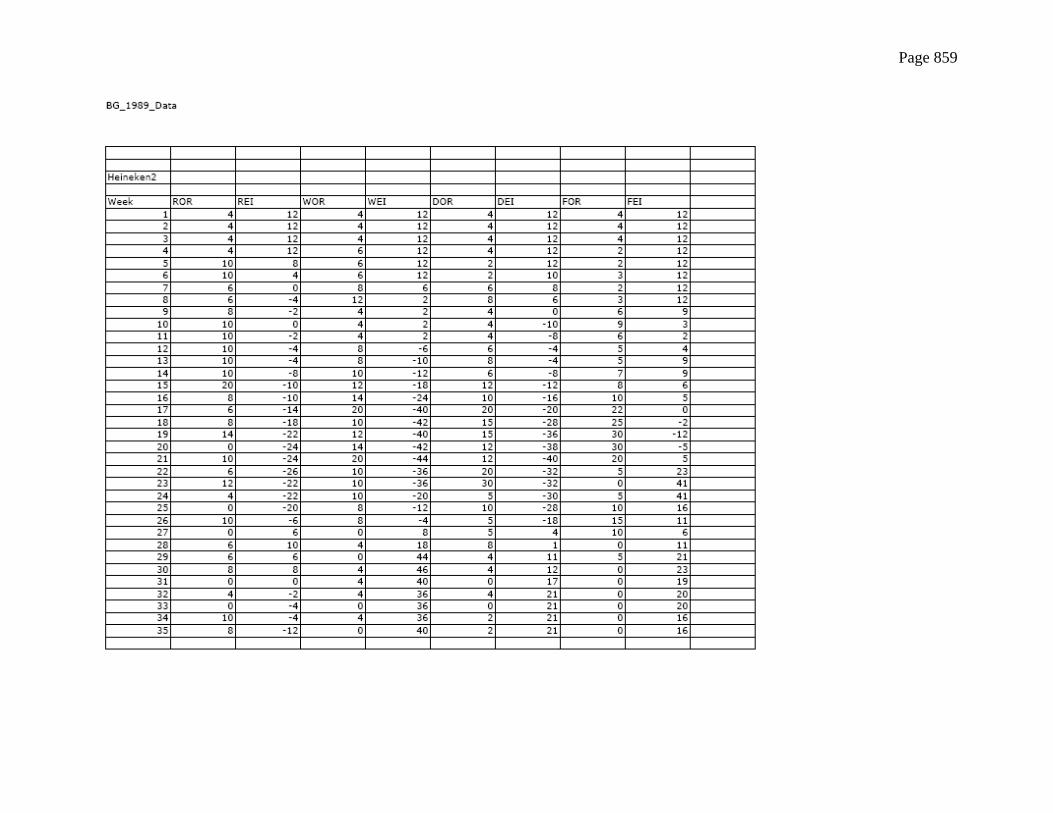
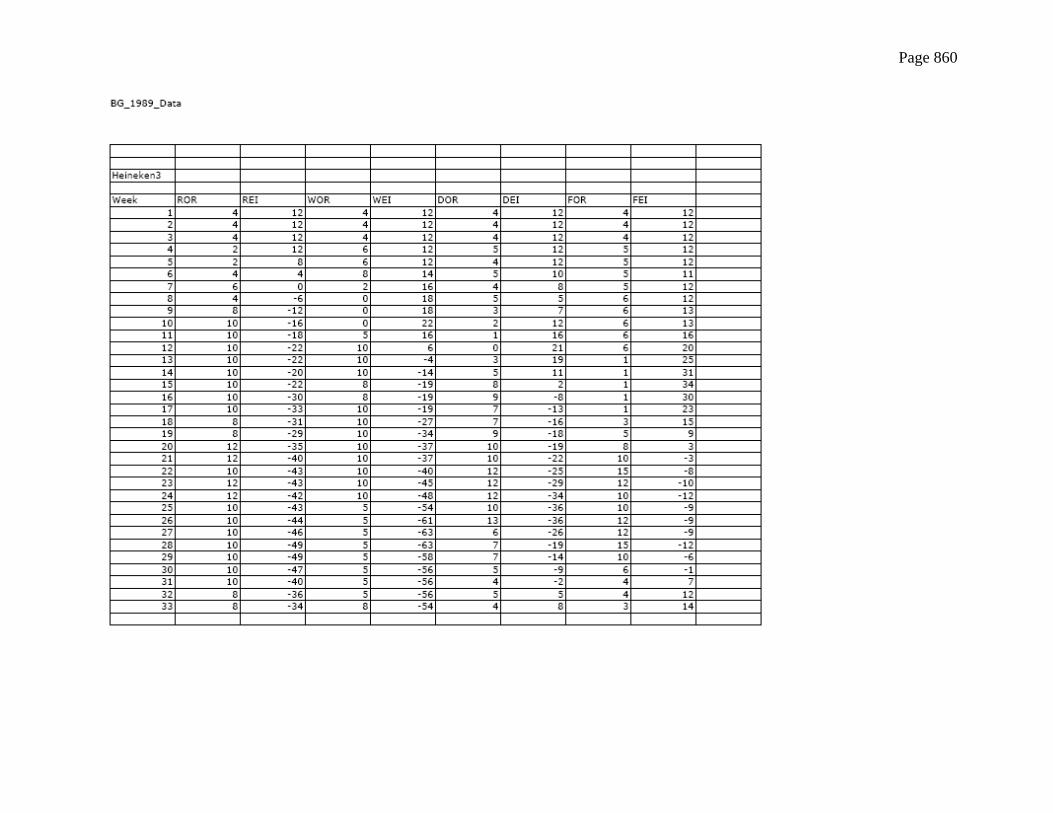
1. BG_1989_Data. The raw data from Sterman’s 1989 trials. (Pages 852 – 862)
2. True Basic Program to simulate the Beer Distribution Game. The simulation program Sterman used in 1989. (Pages 863 - 866)
3. Sterman Game Models includes 15 documents for each trial (Pages 867 – 1053)
1. RME Sterman – model calculations from Sterman’s original estimations for the retailer position in each trial
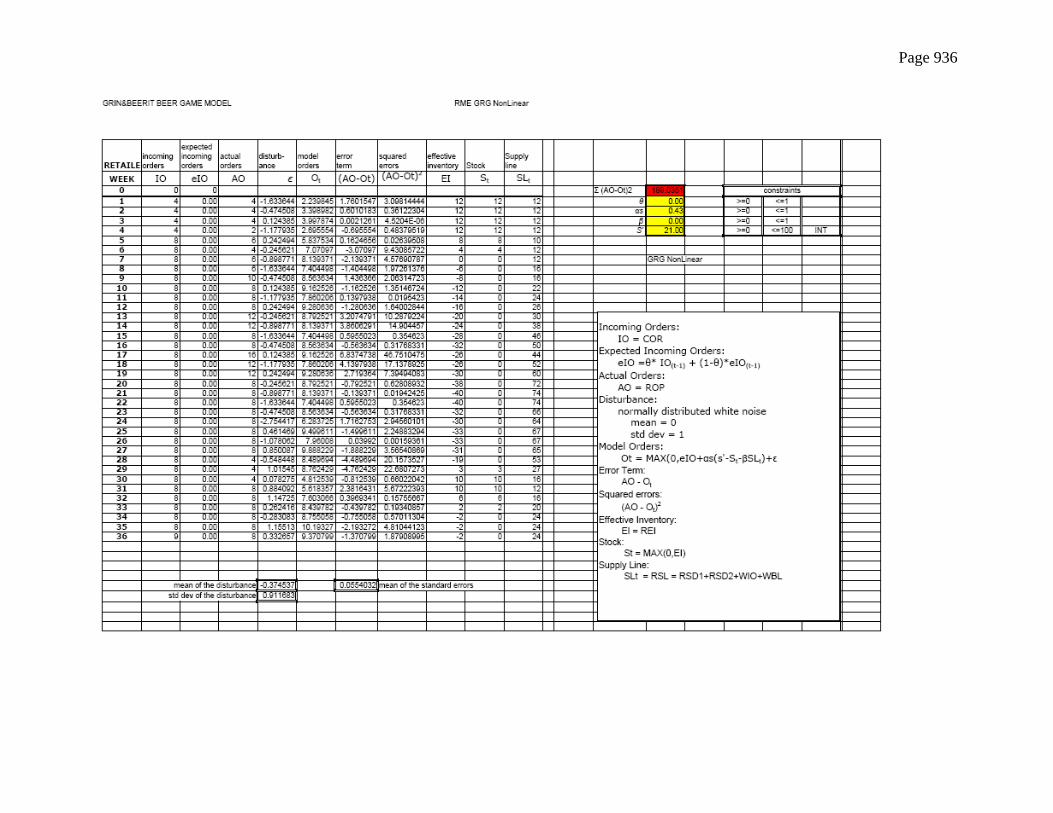
2. RME GRG Nonlinear – model calculations using GRG Nonlinear tool to estimate parameters for Sterman’s retailer
position.
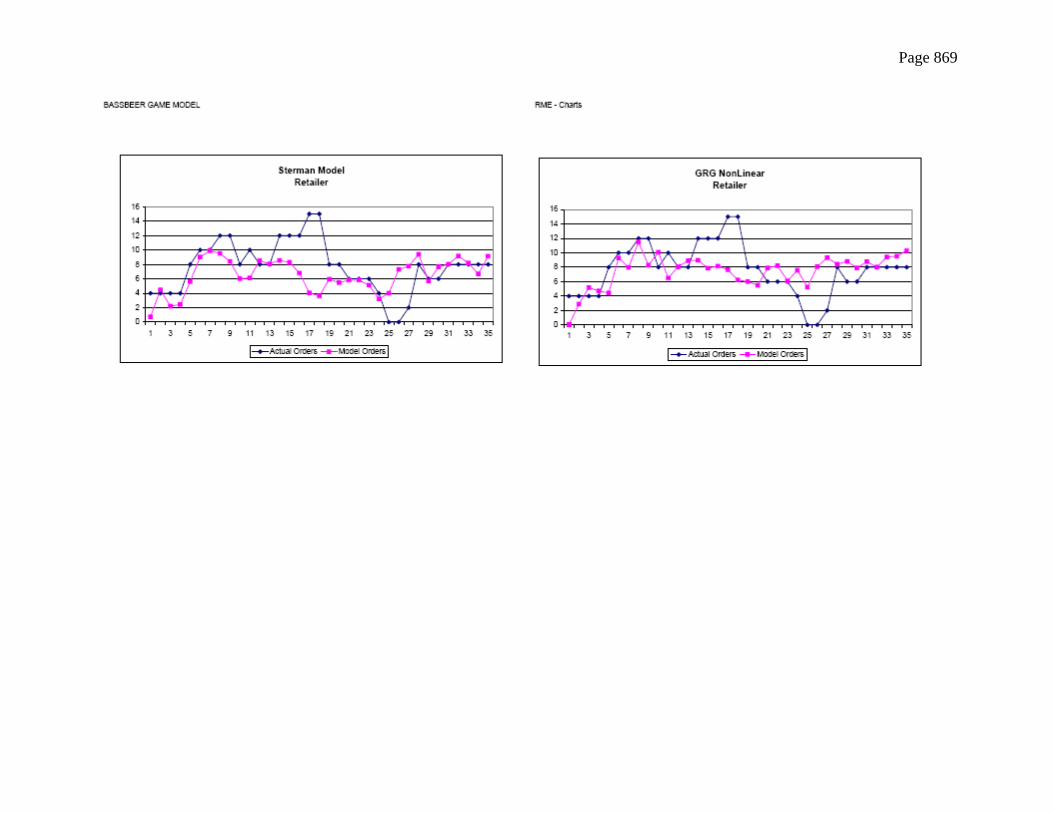
3. RME Charts – Charts comparing the Sterman model estimated retailer orders to the actual retailer orders, side by
side with the GRG Nonlinear model estimated retailer orders compared to the actual retailer orders.
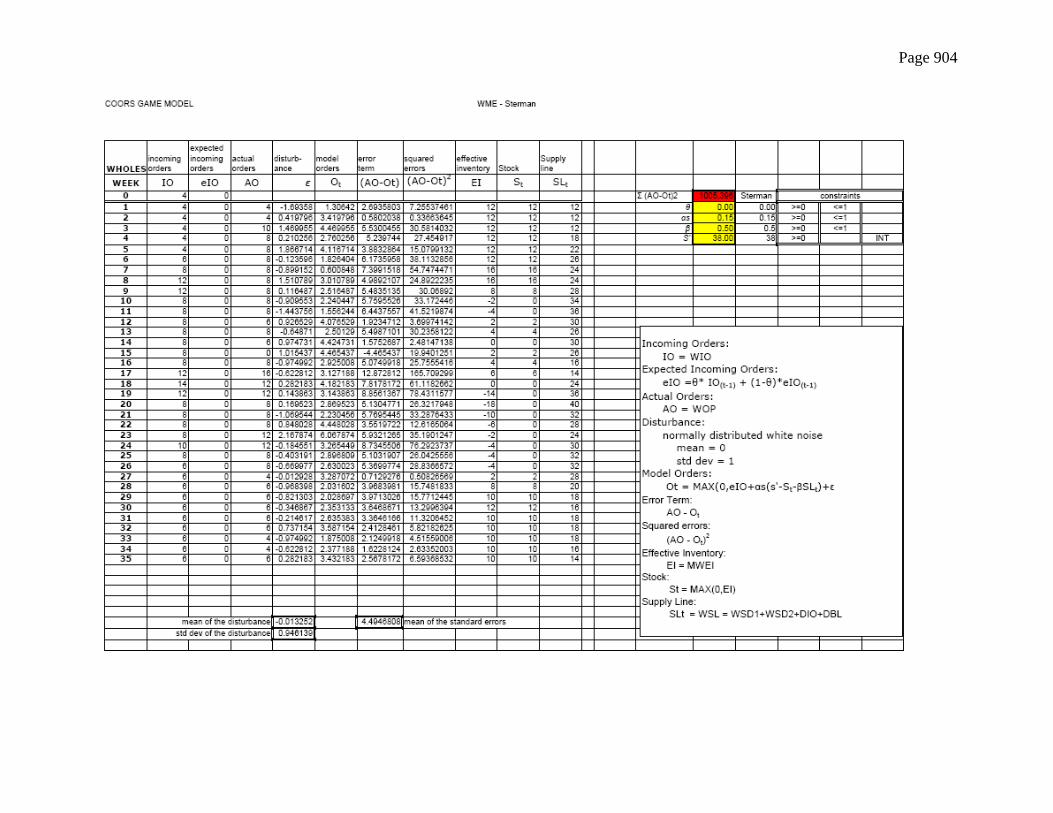
4. WME Sterman – model calculations from Sterman’s original estimations for the wholesaler position in each trial
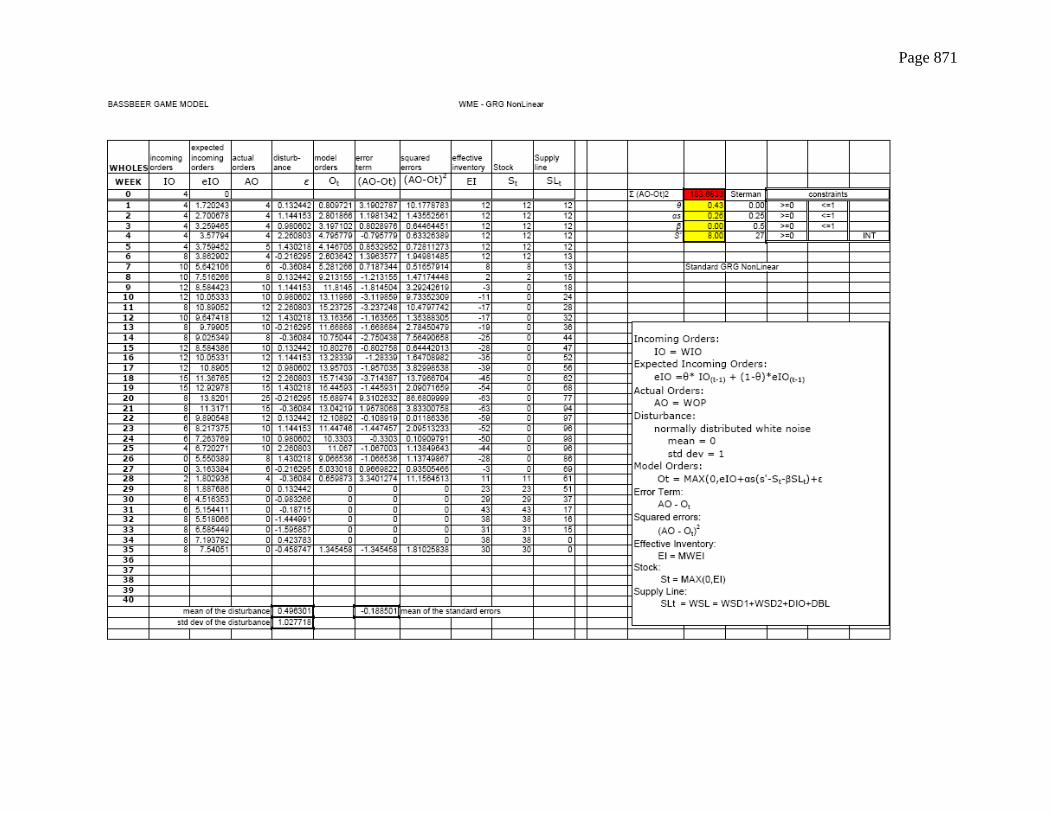
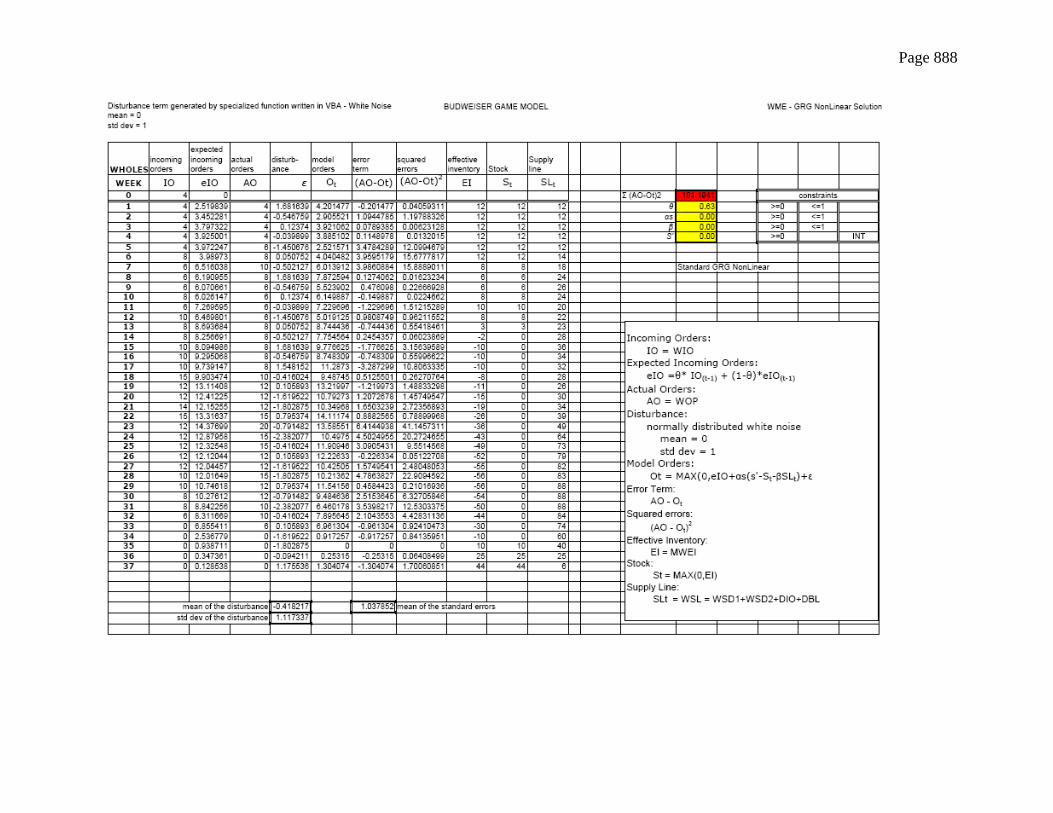
5. WME GRG Nonlinear – model calculations using GRG Nonlinear tool to estimate parameters for Sterman’s
wholesaler position.
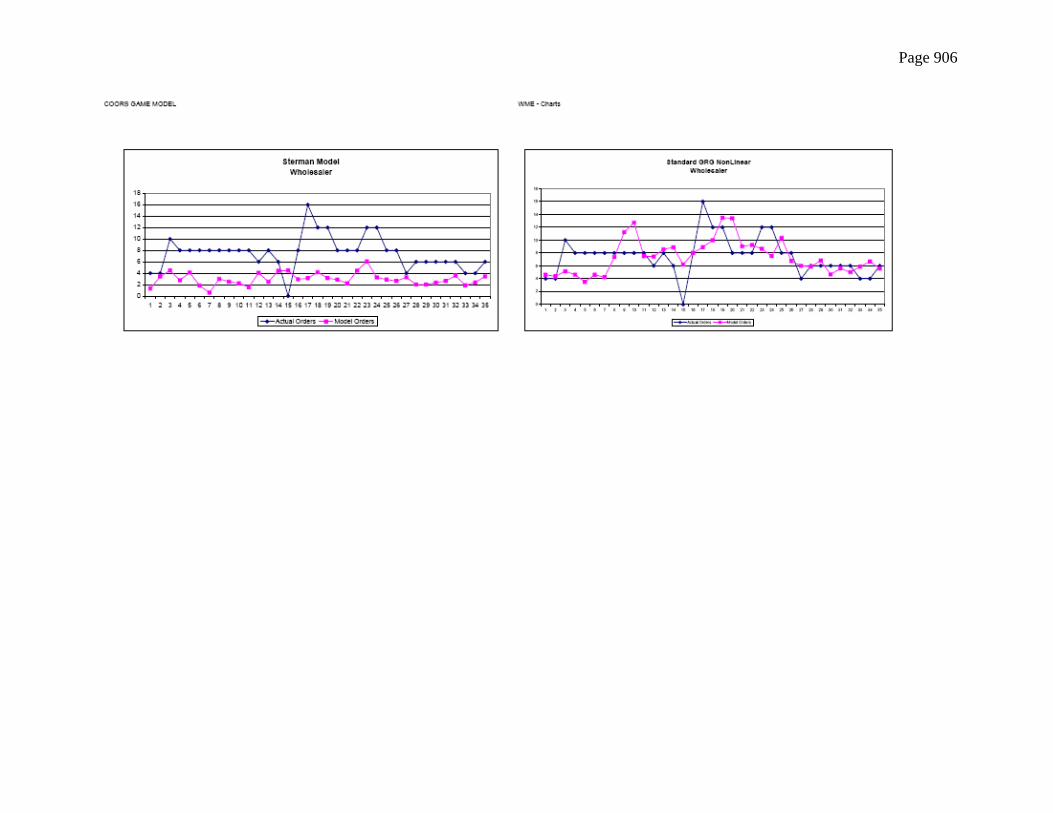
6. WME Charts – Charts comparing the Sterman model estimated wholesaler orders to the actual wholesaler orders,
side by side with the GRG Nonlinear model estimated wholesaler orders compared to the actual wholesaler orders.
7. DME Sterman – model calculations from Sterman’s original estimations for the distributor position in each trial
8. DME GRG Nonlinear – model calculations using GRG Nonlinear tool to estimate parameters for Sterman’s
distributor position.

Page 851
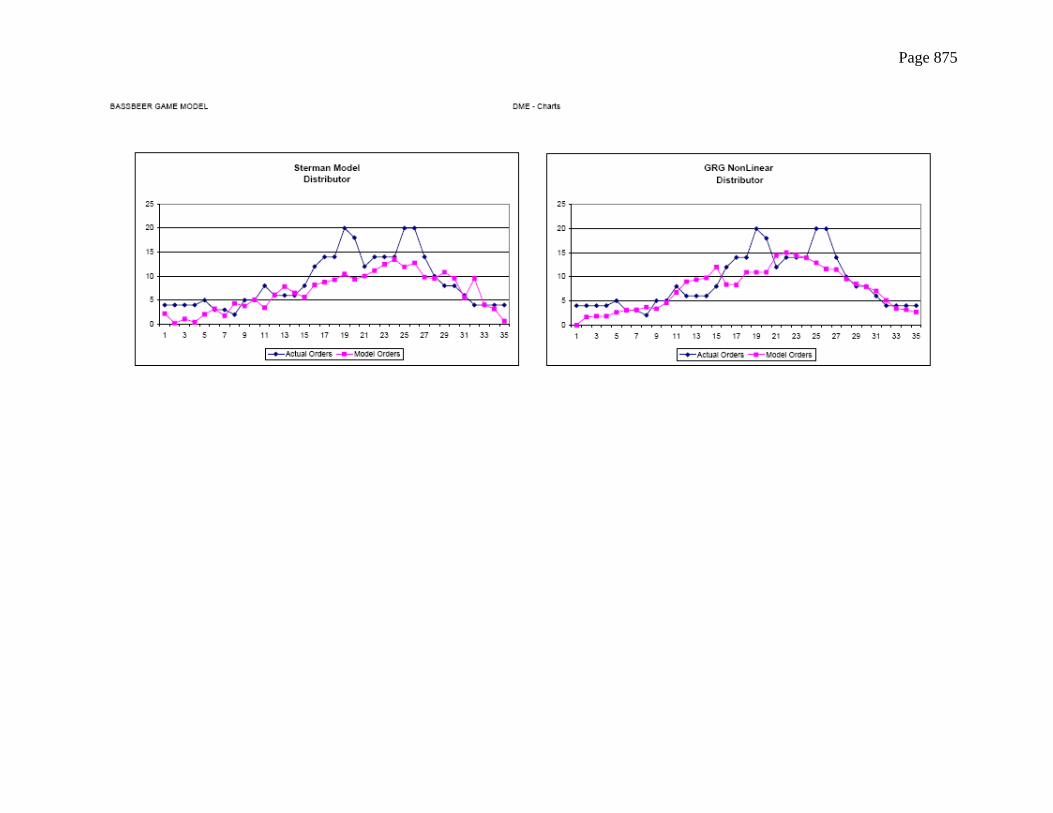
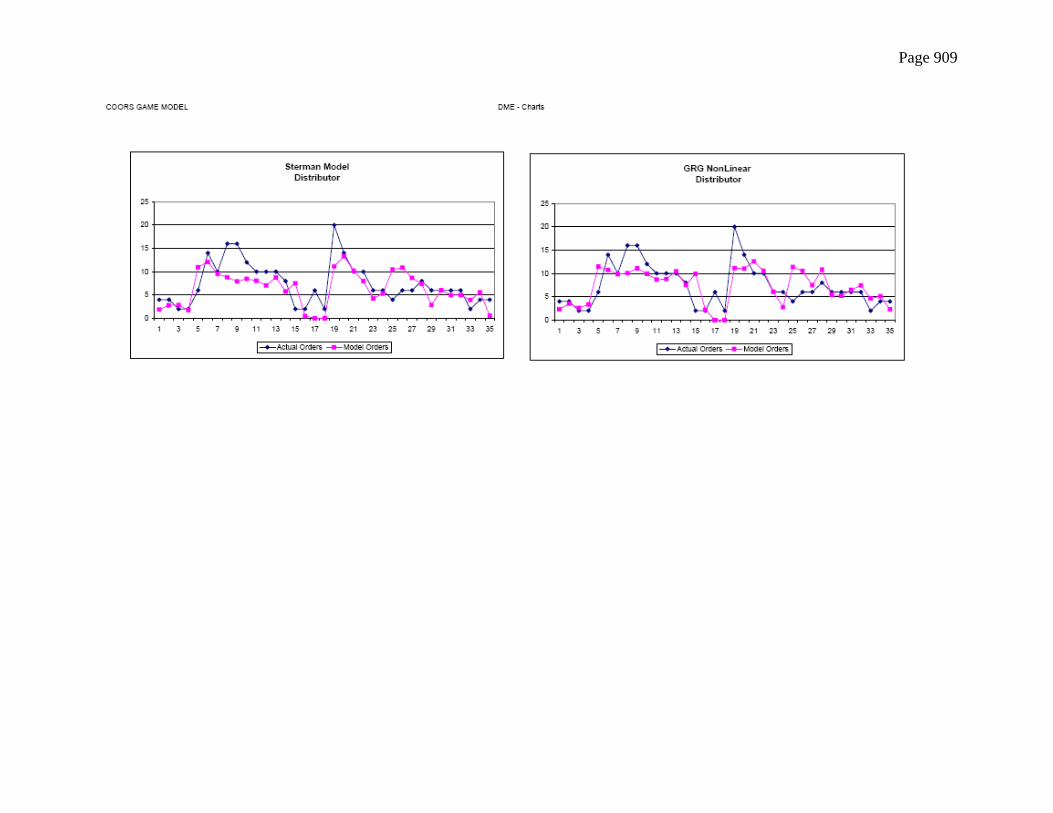
9. DME Charts – Charts comparing the Sterman model estimated distributor orders to the actual distributor orders,
side by side with the GRG Nonlinear model estimated orders distributor compared to the actual distributor orders.
10. DME Sterman – model calculations from Sterman’s original estimations for the distributor position in each trial
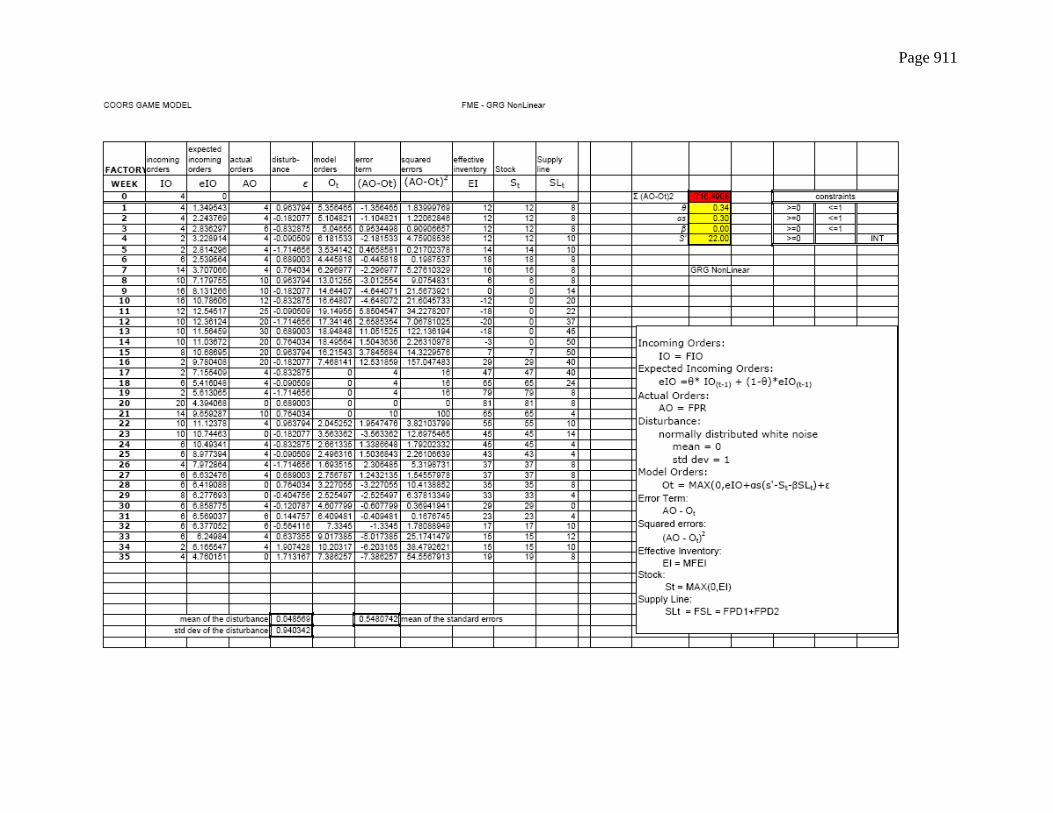
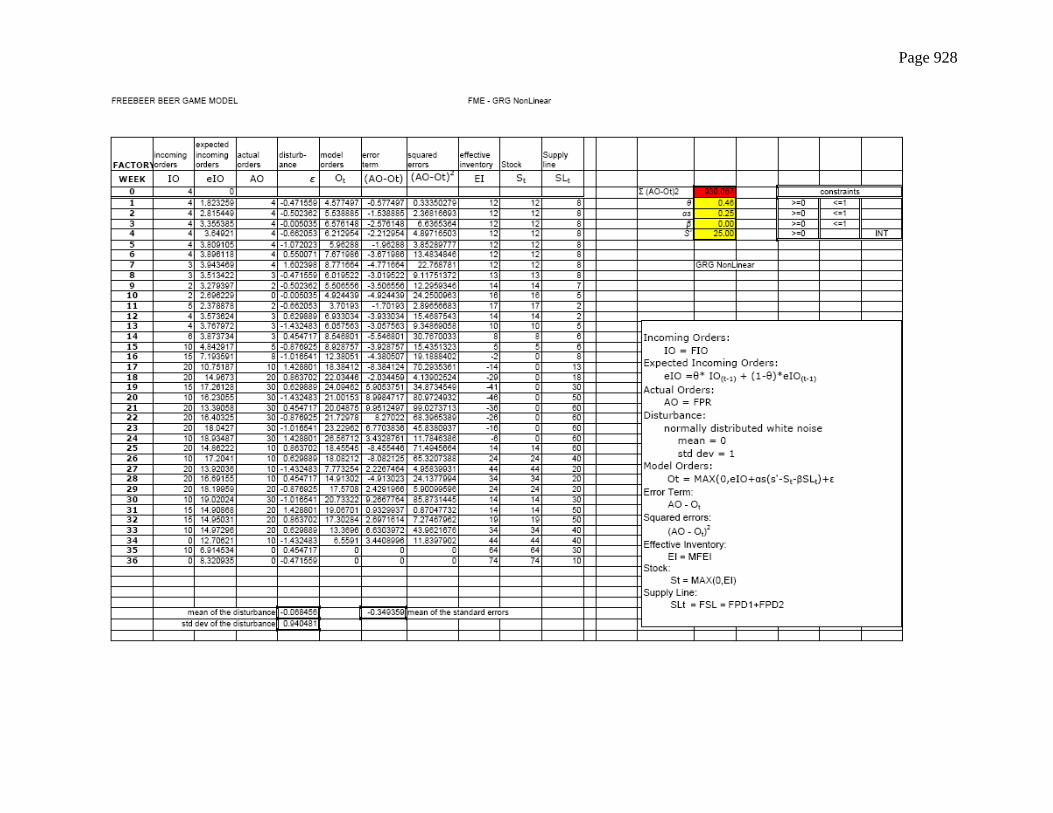
11. FME GRG Nonlinear – model calculations using GRG Nonlinear tool to estimate parameters for Sterman’s factory
position.
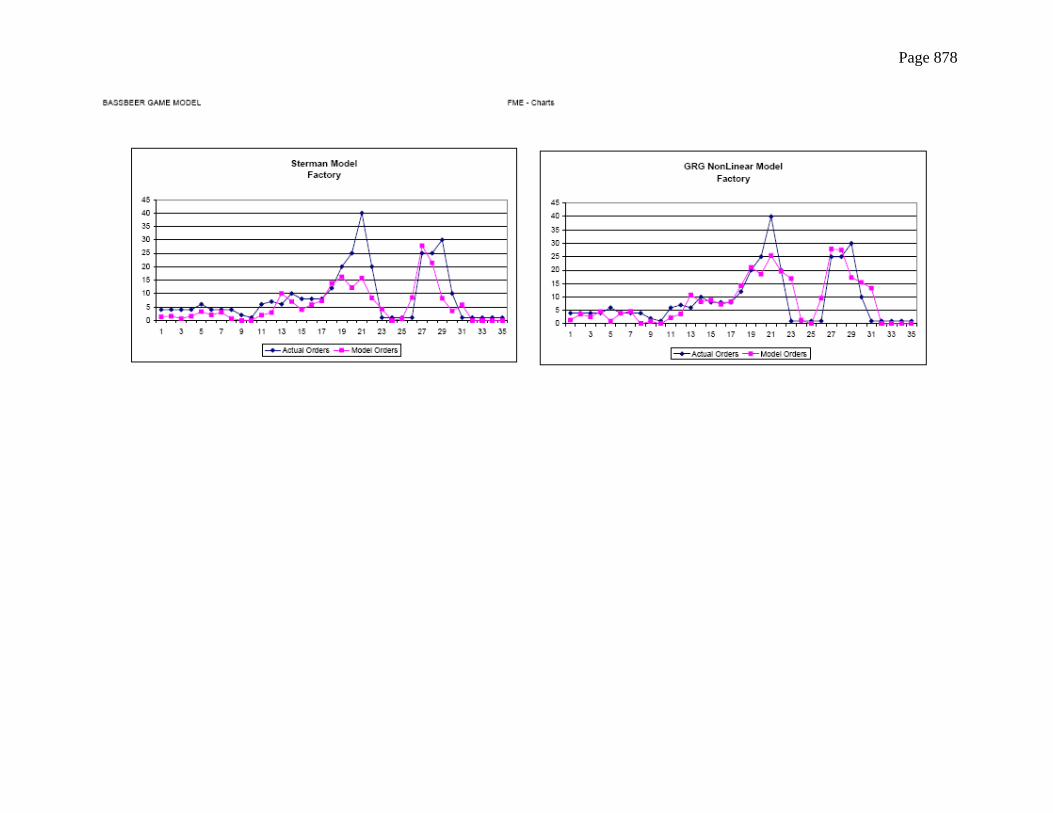
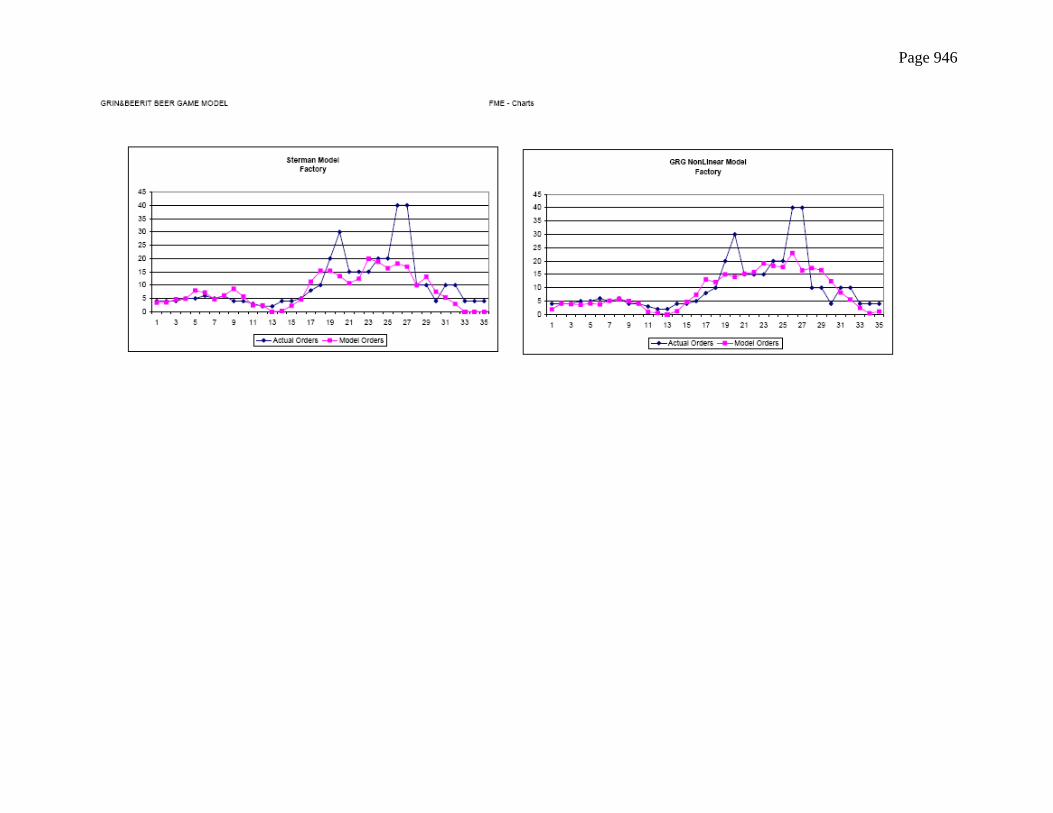
12. FME Charts – Charts comparing the Sterman model estimated factory orders to the actual factory orders, side by
side with the GRG Nonlinear model estimated factory orders compared to the actual factory orders.
13. Model Charts – Comparing the estimated orders with the actual orders.
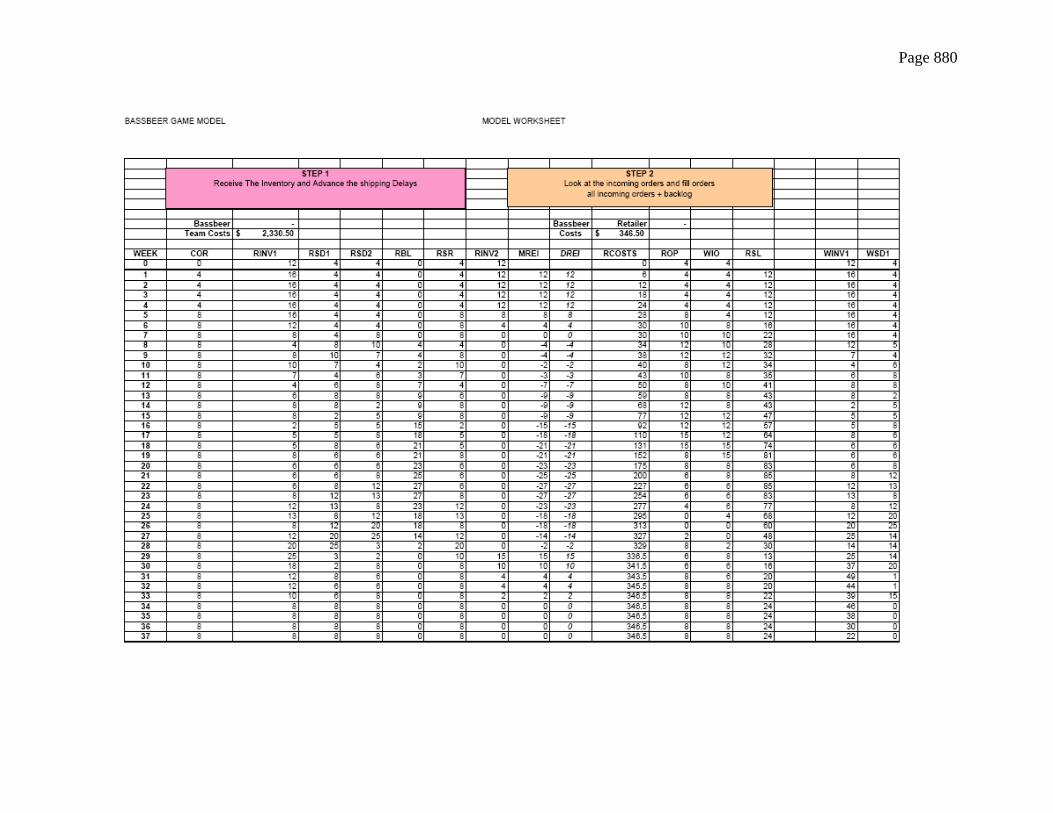
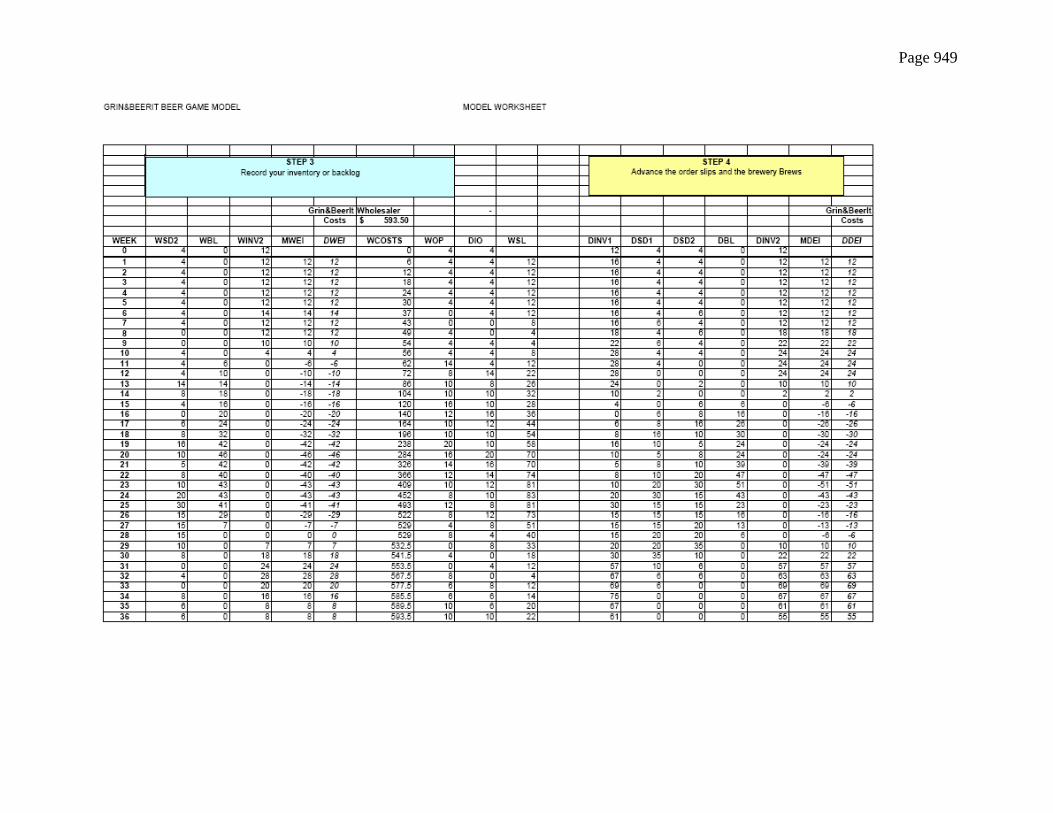
14. Model Worksheet
15. Model Data

Page 852

Page 853

Page 854

Page 855

Page 856

Page 857

Page 858
Page 859
Page 860

Page 861

Page 862

Page 863

Page 864

Page 865

Page 866

Page 867

Page 868
Page 869

Page 870
Page 871

Page 872

Page 873

Page 874
Page 875

Page 876

Page 877
Page 878

Page 879
Page 880

Page 881

Page 882

Page 883

Page 884

Page 885

Page 886

Page 887
Page 888

Page 889

Page 890

Page 891

Page 892

Page 893

Page 894

Page 895

Page 896

Page 897

Page 898

Page 899

Page 900

Page 901

Page 902

Page 903
Page 904

Page 905
Page 906

Page 907

Page 908
Page 909

Page 910
Page 911

Page 912

Page 913

Page 914

Page 915

Page 916

Page 917

Page 918

Page 919

Page 920

Page 921

Page 922

Page 923

Page 924

Page 925

Page 926

Page 927
Page 928

Page 929

Page 930

Page 931

Page 932

Page 933

Page 934

Page 935
Page 936

Page 937

Page 938

Page 939

Page 940

Page 941

Page 942

Page 943

Page 944

Page 945
Page 946

Page 947

Page 948
Page 949

Page 950

Page 951