page 25 page 37 inquirer natural inquirer volume 3, number 1 winter 2001 tropical forest edition...
TRANSCRIPT

That’sGrowth!
NATURAL VOLUME 3, NUMBER 1 • USDA FOREST SERVICE
INQUIRER
Swimming
Leaf Me
SSoommee TThhiinnggssWWiillll
The Trees Are I’ll HHuuffff and I’llPPuuffff and I’ll BlowYour Trees Down!
Page 6
Page 13
OO oo oo oo oo hh !!
Page 19
It’s a
Page 25
Please
Page 31
Page 37
Page 43
Page 50
GGaass!!Always
Change
ALONE!
JJooiinn UUssffoorr DDiinnnneerr
GGooiinnggBBaattttyy!!
Without a Ladder
Tropical Forest Edition
Tropical Forest Edition
That’sGrowth!That’s
Growth!
UpstreamUpstreamSwimming
Without a Ladder
Please
AlwaysChange

The Natural InquirerVolume 3, Number 1Winter 2001Tropical Forest Edition
Barbara McDonaldUSDA Forest Service,
Research and DevelopmentWashington Office
Wilson Gonzalez EspadaUniversity of Georgia,
Department of ScienceEducation
Athens, GA
Forest Service scientists high-lighted in the journal:John FrancisAndrew J. R. GillespieMichael KellerAriel LugoJohn ParrottaFrederick ScatenaPeter WeaverJoseph Wunderle
Non-Forest Service scientistshighlighted in the journal:Jonathan BensteadElvira CuevasOliver Henry KnowlesSteven LattaJames March
Sandra MolinaCatherine PringleOlga RamosMichael ReinersLinda L. Vélez Rodríguez
Produced by:USDA Forest ServiceDale Bosworth, Chief
Research and Development,Washington, DC
Robert Lewis, Deputy ChiefResource Valuation and Use
Research StaffFred Kaiser, Director
State and Private ForestryMichael Rains, Deputy ChiefConservation Education StaffAnn Loose, Director
With thanks to:USDA Forest ServiceOffice of CommunicationWashington, DC
USDA Forest ServiceInternational Institute of
Tropical ForestryRio Piedras, Puerto Rico
USDA Forest ServiceInternational ProgramsWashington, DC
Eugene OdumUniversity of GeorgiaAthens, GA
Jessica TannerAtlanta City Public SchoolsAtlanta, GA
Julie GarrisonBarrow County SchoolsAuburn, GA
Karen MurphyBarrow County SchoolsBethlehem, GA
George AvalosUSDA Design CenterWashington, DC
Katrina KrauseUSDA Forest ServiceAthens, GA
USDA Forest Service,Southern Research Station
Athens, GA
Linda RiesUSDA Forest ServiceOgden, UT
Lisa PerezUSDA Forest ServiceSalt Lake City, UT

1
EditorialReview Board
SpecialEditorialAssistants:
Mary Herman, Athens, GA
Melissa Hughes,Marion, NC
Ashley Mead, Jefferson, GA
Samantha Mead, Jefferson, GA
Hilde Sather-Wickster,Athens, GA
Mrs. Wilma Zapata’s 5th Grade ClassAcademia PresbiterianaSan German, Puerto Rico
2
Teacher’sNote
As teachers of science, oneof your goals is to teach stu-dents the scientific method,no matter what your area offocus—life sciences, Earth sci-ences, etc. The scientificmethod can best be taught byfocusing on hands-on andminds-on inquiry and investi-gation. This allows the learn-er to be independent and toseek answers to questionsthroughout the world we livein. As educators, you are con-stantly faced with engagingyour students in scientificinquiry in new and differentways. Standard teachingstrategies can become monot-onous to today’s learners inan age of abundant technolo-gy. The Natural Inquirer givesa fresh approach to scienceand a view of the outsideworld bigger than the class-room that can be used whilestill in the school setting.
The Natural Inquirer is ascience education resourcejournal to be used with learn-ers in Grade 5 and up. TheNatural Inquirer containsarticles describing environ-mental and natural resourceresearch conducted by ForestService scientists and theircooperators. These are scien-tific journal articles that havebeen reformatted to meet theneeds of an audience new toscience. The articles are easyto understand, are aesthetical-ly pleasing to the eye, containglossaries, and include hands-on activities. The goal of TheNatural Inquirer is to stimu-late critical reading and think-ing about scientific inquiryand investigation while learn-ing about ecology, the naturalenvironment, and naturalresources.
Past issues and articles fromThe Natural Inquirer areavailable by visiting the Website at http://www.naturalin-quirer.usda.gov.
Science EducationStandards:
In the back of the journal,you will find a matrix whichallows you to identify articlesby the national science educa-tion standards that theyaddress.
Questions or comments?Please contact:
Dr. Barbara McDonaldUSDA Forest Service320 Green St.Athens, GA [email protected]
Teacher’s Manual:Please visit The NaturalInquirer Web site athttp://www.naturalinquirer.usda.gov. From this site, youmay read the teacher’s manualonline, download it, orrequest a hard copy.
Visit http://www.naturalinquirer.usda.gov for previous issues of theNatural Inquirer, sample lesson plans, word games, the teacher’s
manual, information about the Forest Service, and other resources.

3
Page 31
Page 43
Page 50
Contents
Teacher’s Note . . . . . . . . . . . . . . . . . . . . . . . . . . . . . . . . . .2
About the Natural Inquirer . . . . . . . . . . . . . . . . . . . . . . . .4
What are Scientists? . . . . . . . . . . . . . . . . . . . . . . . . . . . . . .4
Welcome to the Natural InquirerTropical Forest Edition . . . . . . . . . . . . . . . . . . . . . . . . . . .5
Features
Swimming Upstream Without a Ladder:Dams and Pipes and River Shrimp Movements . . . . . . . .6
Leaf Me Alone!The Movement of Nutrients BetweenTrees and the Soil . . . . . . . . . . . . . . . . . . . . . . . . . . . . . . .13
Oooh! That’s Growth!Measuring Trees in Cinnamon Bay Watershed . . . . . . .19
It’s a Gas!The Exchange of Gases Between the Soil and the Atmosphere . . . . . . . . . . . . . . . . . . . . . . . . .25
Please Join Us for Dinner:Tropical Birds and Their Temporary Guests . . . . . . . . .31
Some Things Will Always Change:Land Use in a Dry Tropical Forest . . . . . . . . . . . . . . . . .37
The Trees Have Gone Batty!How Bat Scat Helped Restore a Tropical Forest . . . . . .43
I’ll Huff and I’ll Puff and I’ll Blow YourTrees Down!How Wind Speed Affected Trees During Hurricane Hugo . . . . . . . . . . . . . . . . . . . . . . . . . . . . . . . .50
Which National Science Education Standards Can Be Met by the Natural Inquirer? . . . . . . . . . . . . . . .57
What Is the Forest Service? . . . . . . . . . . . . . . .Back Cover
Web site Connections . . . . . . . . . . . . . . . . . . . .Back CoverThe Natural Inquirer is reproduced on recycled paper with soy-based inks.Please pass this journal along or recycle it when you have finished using it.

Scientists are people whocollect and evaluate infor-mation about a wide rangeof topics. Some scientistsstudy the natural environ-ment. To be a successfulenvironmental scientist, youmust:
• Be curious—You must beinterested in learning.
• Be enthusiastic—Youmust be interested in anenvironmental topic.
• Be careful—You must beaccurate in everythingthat you do.
• Be open minded—Youmust be willing to listento new ideas.
• Question everything—You must think aboutwhat you read andobserve.
What Are Scientists?
Scientists in this issueat work.
Scientists report their research in journals,which are special booklets that enable scien-tists to share information with one another.This journal, the Natural Inquirer, was creat-ed so that scientists can share their researchwith you and with other middle school stu-dents. Each article tells you about scientificresearch conducted by scientists in the ForestService. If you want to know more about theForest Service, you can read about it on theback cover of this journal, or you can visit theNatural Inquirer Web site at http://www.natu-ralinquirer.usda.gov.
All of the research in the Natural Inquirer isconcerned with nature, such as trees, forests,animals, insects, outdoor activities, and water.First, you will “meet the scientist” who con-ducted the research. Then you will read some-
thing special about science and about the nat-ural environment. You will also read about aspecific research project. This is written in theformat that scientists use when they publishtheir research in journals. Then, YOU willbecome the scientist when you conduct theFACTivity associated with each article. Don’tforget to look at the glossary and the sectioncalled “Thinking About Ecology.” By thinkingabout ecology, you will learn about principlesthat apply to all life, including yours!
At the end of each section of the article, youwill find a few questions to help you thinkabout what you have read. These questionsare not a test! They should help you to thinkmore about the research. Your teacher mayuse these questions in a class discussion.
4
About The Natural Inquirer

5
This edition of the NaturalInquirer describes forest andenvironmental research con-ducted in the tropical regionof the Western Hemisphere(See Figure 1). The tropics is aregion near the equator,between 23.5° north latitude,and 23.5° south latitude.
Natural Inquirer Tropical Forest EditionWelcome to the
Figure 1. This issue presents research conducted in PuertoRico, the U.S. Virgin Islands, Costa Rica, the DominicanRepublic, and Brazil.
Figure 2.Illustrationof the location ofthe sun inrelation tothe tropics.
Figure 3. InternationalInstitute of Tropical Forestry.
Latitude is measured by paral-lel imaginary lines ringing theEarth. The tropical region getsa lot of sunshine and is warmall year around, except in thehigh mountain regions (SeeFigure 2). The tropics are thehome of a variety of biomes(bi oms), or regions with dif-
ferent kinds of vegetation andother life. Tropical biomes arelargely defined by the amountof rainfall they get. In the trop-ics, you might find rain forests,dry forests, shrub lands, tropi-cal plains called savannahs (sävan uhs), and deserts.
The research in this NaturalInquirer was conducted by sci-entists working in theInternational (in tür na shanul) Institute of TropicalForestry, or IITF (Figure 3).IITF is located in Puerto Rico,a tropical island in theCaribbean Sea. The IITF con-ducts research to help keeptropical forests healthy nowand into the future, to helpprotect the animals that live inthe forests, and to take care ofstreams and rivers and theforests around them. IITF is apart of the Forest Service. Youcan learn about the ForestService on the back cover ofthe Natural Inquirer, or byvisiting http://www.naturalin-quirer.usda.gov and clickingon “About the Forest Service.”
Gulf of Mexico
Atlantic Ocean
Brazil
CostaRica
U.S. Virgin Islands
Puerto Rico
Dominican Republic
United States
Caribbean Sea
North
North pole
Equator
South pole
The tropics
SUN
}

Glossary:conserve (kän sürv): To avoidwasteful or destructive use ofsomething.
species (spe sez): Groups oforganisms that resemble one anotherin appearance, behavior, chemicalprocesses, and genetic structure.
migrate (mi grat): To move from oneplace to another.
larval (lär väl): Relating to thewormlike feeding form that hatchesfrom the egg of many insects oranimals that changes form when itbecomes an adult.
tropical (träp i käl): Of, in, or likethe tropics. The tropics is the regionof the earth near the equator.
maturity (muh toor uh te): The stateof being fully grown or developed.
ecosystem (e ko sis tem):Community of plant and animalspecies interacting with one anotherand with the nonliving environment.
dependent (duh pen dent): Relyingon.
algae (al je): Simple plants that haveno true root, stem, or leaf and thatusually grow in water or on dampsurfaces.
population (päp yoo la shun): Thewhole number of individuals of thesame type occupying an area.
life cycle (lif si kul): Stages in thedevelopment of an organism.
fish ladder (fish lad er): A series ofsmall dams built in streams or rivers.These function like steps to enableanimals to swim upstream.
simulate (sim yuh lat): To create theappearance or effect of somethingfor purposes of evaluation.
analyze (an uh liz): To study orexamine carefully.
Swimming UpstreamWithout a Ladder:
Dams and Pipesand River Shrimp
Movements
7
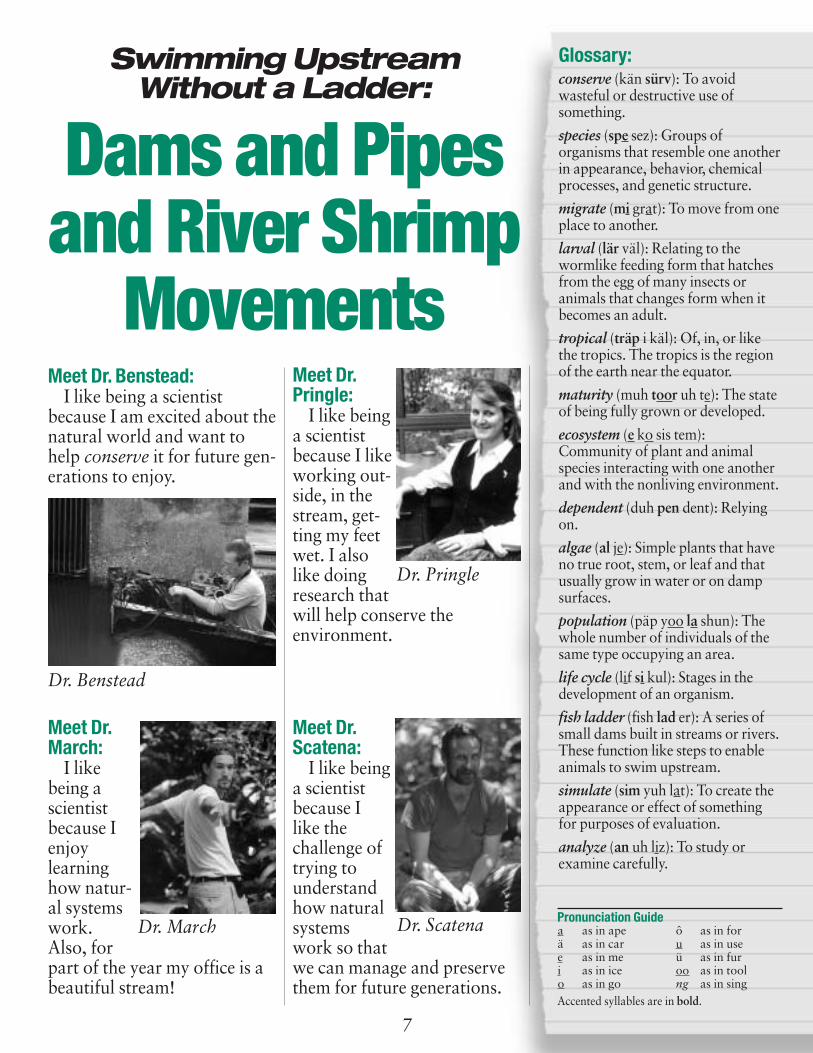
Meet Dr. Benstead:I like being a scientist
because I am excited about thenatural world and want tohelp conserve it for future gen-erations to enjoy.
Meet Dr.Pringle:
I like beinga scientistbecause I likeworking out-side, in thestream, get-ting my feetwet. I alsolike doingresearch thatwill help conserve the environment.
Pronunciation Guidea as in apeä as in care as in mei as in iceo as in go
ô as in foru as in useü as in furoo as in toolng as in sing
Accented syllables are in bold.
Meet Dr.March:
I likebeing a scientistbecause Ienjoy learninghow natur-al systemswork. Also, forpart of the year my office is abeautiful stream!
Meet Dr.Scatena:
I like beinga scientistbecause Ilike the challenge oftrying tounderstandhow naturalsystemswork so thatwe can manage and preservethem for future generations.
Dr. Benstead
Dr. Pringle
Dr. ScatenaDr. March

8
Thinking AboutScience
Although sci-entists some-times workalone, they usu-ally do their
research with other scientists.Even if they live in differentareas of the Nation or theworld, they find ways to worktogether. In this study, scien-tists from the University ofGeorgia worked together witha Forest Service scientist inPuerto Rico to study a specialkind of shrimp. In your class-room, you sometimes workwith other students. Whenyou do this, you are like a sci-entist who works with otherscientists. Can you name tworeasons why it is a good ideato work with others when youare learning something new?
Thinking About theEnvironment
Many animalspecies spendpart of their life
in one location and part of itin another place. When thathappens, the animal is said tobe migratory. Animals usuallymigrate to a place more favor-able for reproduction. Peopleoften think of birds when theythink of migratory animals. Inthis study, the migratory ani-mal is a river shrimp. When itis in its larval stage, theshrimp larvae drift fromstreams in high tropicalmountains to areas near thecoast. There they growbeyond the larval stage. Whenthey are ready to becomeadults and reproduce, thejuvenile shrimp swim backupstream to where they wereborn. When the juvenilesencounter barriers such as
waterfalls, they crawl overthem to continue theirupstream journey. When theyget upstream, they grow intoadult shrimp and reproduce.Their offspring drift backdownstream with the current,and the cycle begins again.
IntroductionTropical streams provide
many benefits to people andanimals. For river shrimp thatspend part of their life in themountain streams, the streamsprovide a place to reproduceand develop. River shrimp areimportant to the streams aswell. They eat the algae in thestreams and help to turn deadmatter, such as fallen leaves,into small particles. Whenthey swim and crawl in thestreams, they stir up the water.This enables the stream towash away any soil and otherthings that may have settledinto the stream bed.
In an area, theindividuals of aspecies live inclose relationshipwith other livingthings and withthe nonliving
environment. Thisrelationship determines howmany individuals there will be,how fast they will grow, andhow many individuals ofdifferent ages there will be atany one time. Livingcommunities plus the non-living environment make up
Thinking About Ecologywhat we call an ecosystem.Humans often alter thenonliving environment. Thisalteration can affect a speciesby changing their numbers,changing how fast they grow,and changing how manydifferent individuals there willbe of different ages. In thisresearch, a species of rivershrimp was studied. Theshrimp depend on bothmountain rivers and coastalwetlands to live andreproduce. Humans hadaltered the river environment
by building a dam and placinga pipe to carry water from theriver to provide water forhumans. Because all livingindividuals have a closerelationship with theirenvironment, any change inthe environment can cause achange in the life of theindividual and the group ofindividuals. The scientistswanted to know how the damand pipe were affecting theriver shrimp, which mustmove up and down the river tosurvive.

San Juan
Puerto Rico
Location ofRío Espíritu Santo
North
9
Tropical streams also pro-vide people with the freshwater they need for drinking,cooking, and washing.Because more and more peo-ple are living in tropical areas,more water is needed. To pro-vide water for people, smalldams are often built in tropi-cal streams (Figure 1). Thiscreates a small pool of water.The water is diverted from thesmall pool into a pipe that car-ries the water to cities wherepeople use it. Unfortunately,the pipe also carries many ofthe shrimp larvae out of thestream. That means fewer lar-vae are able to get down-stream to the coastal zone.When the juveniles swim backupstream, the dams can some-times prevent them fromswimming far enough. Whenthat happens, the shrimp can-not reproduce. In this way, thepopulation of shrimp isreduced more and more overtime. The scientists in thisstudy wanted to find a way toprotect the shrimp populationwhile continuing to providewater for people.
ReflectionSection• If the scien-tists do not finda way to protectthe shrimp pop-
ulation and still providewater for people, what doyou think will happen tothe shrimp population inthe future?
• If you were the scientist,how would you study thepopulation of migratingshrimp?
MethodThe scientists studied a
mountain stream near a damon the Rio (re o) Espiritu (ehsper eh tu) Santo (sän to) onthe Caribbean (kä rib e un)National Forest in PuertoRico (Figure 2). To find outhow many shrimp larvae were
flowing into the pipe, the scien-tists put nets into the water.First, they put nets in the waterabove the dam and counted thetotal number of larvae floatingdownstream. They also put anet in front of the pipe andcounted the number of larvae intheir net. From this method,they knew how many larvaewould have flowed into thepipe and how many would havefloated over the dam. To findout how many juvenile shrimpwere returning upstream, thescientists put a net into thewater below the dam. Theycounted the number of juvenilesbelow the dam by countinghow many were caught in thenet. Because shrimp larvae floatdownstream in the evening andat night, the scientists collectedtheir information in the eveningand at night. They collectedinformation every thirdevening, for a total of 24evenings.
ReflectionSection• Instead of col-lecting theirinformation onjust one evening,
the scientists counted thenumber of shrimp larvae on24 evenings. Why do youthink it is important to countthe number of larvae onmore than one evening?
• How do you think that thescientists knew that shrimplarvae float downstream dur-ing the evening and night,rather than during the day-time?
Figure 1. Dam on the Río Espíritu Santo in Puerto Rico.
Figure 2. Location of theRio Espiritu Santo.

10
ResultsThe scientists discovered
that most shrimp larvae floatdownstream between 8:00p.m. and 12:00 a.m. (Figure3). The average percentage oflarvae floating into the pipeswas 42 percent of the totalnumber of larvae floatingdownstream (Figure 4). Thescientists also found that thedam often prevented the juve-nile shrimp from swimmingupstream. This meant thatmany juvenile shrimp weretrapped below the dam, wait-ing for a chance to climb overthe dam. With so many wait-ing below the dam, fish whofeed on the juvenile shrimpwere able to eat larger num-bers of the young shrimp thanthey normally would have.
ReflectionSection• In what waysdid the dam andpipe disrupt thenormal life cycle
of river shrimp? What otherthings (animals, plants, orthe stream itself) wereimpacted as a result of this?
• How could the scientists’information be used to helpthe river shrimp? What doyou think the scientists rec-ommended?
ImplicationsThe scientists recommended
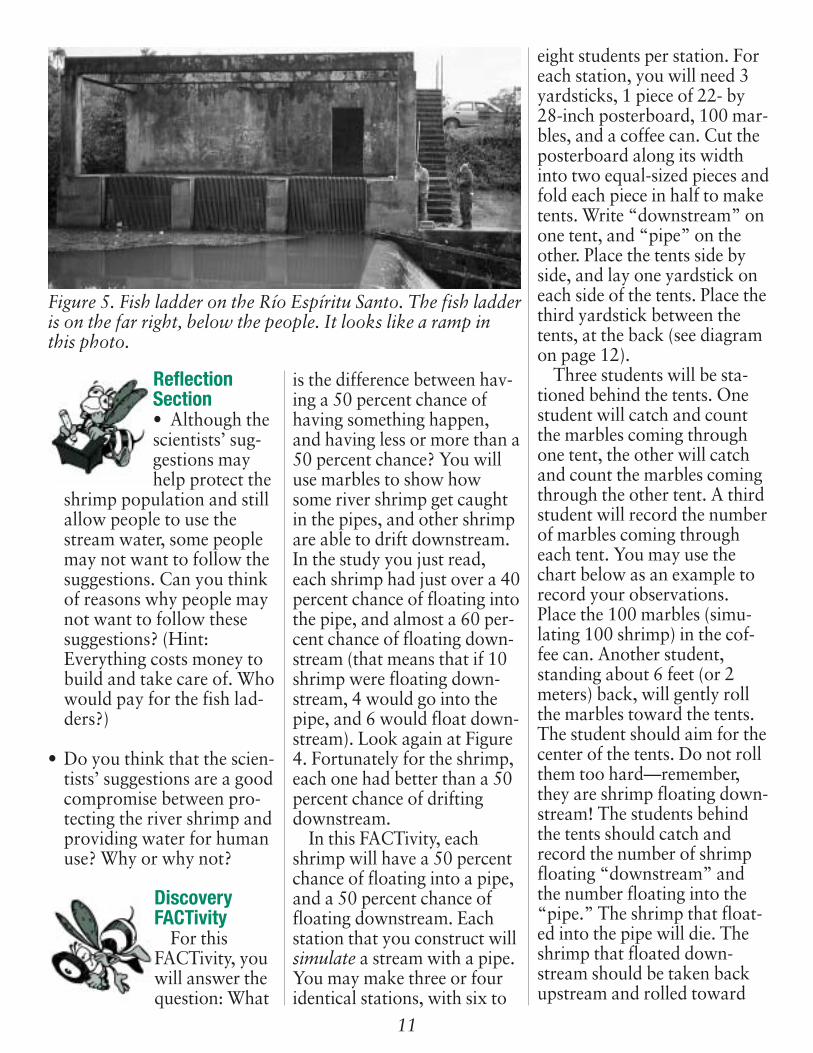
that the water pipe be closedevery evening between 8:00p.m. and 12:00 a.m., or atleast for some of the hourswhen most of the larvae arefloating downstream. Thatway, most of the shrimp larvaecould float downstream to thewetlands without gettingcaught in the pipe. In addi-tion, people would still be ableto use the water from thestreams. The scientists alsorecommended that the smallfish ladder that had been builtbe repaired so that rivershrimp could use it again(Figure 5). That way, the juve-nile shrimp could climb overthe fish ladder to get backupstream. If these recommen-dations are not followed, thepopulation of fresh watershrimp will probably continueto decline in tropical streamswhere dams exist.
Amount of larval shrimps going downstream
Average downstream flow of larval shrimps in a typical day. Each column represents hourly data beginning at 5:00 pm and ending at 7:00 am of the next day.
VerySmall
VerySmall
VerySmall
VerySmall
VerySmall
VeryLarge
VeryLarge
VeryLarge
Small Small Small SmallLargeAverage Average
6pm
5pm
7pm
8pm
9pm
10pm
11pm
12am
1am 2am
3am 4am
5am 6am 7am
Figure 3. The average amount of shrimp larvae floating downstream at different times of the day.
Figure 4. The average per-centage of shrimp larvaefloating into the pipe anddown to the wetlands.
42% shrimp larva floating into pipe
58% shrimp larva floating to wetlands
11
ReflectionSection• Although thescientists’ sug-gestions mayhelp protect the
shrimp population and stillallow people to use thestream water, some peoplemay not want to follow thesuggestions. Can you thinkof reasons why people maynot want to follow thesesuggestions? (Hint:Everything costs money tobuild and take care of. Whowould pay for the fish lad-ders?)
• Do you think that the scien-tists’ suggestions are a goodcompromise between pro-tecting the river shrimp andproviding water for humanuse? Why or why not?
DiscoveryFACTivity
For thisFACTivity, youwill answer thequestion: What
is the difference between hav-ing a 50 percent chance ofhaving something happen,and having less or more than a50 percent chance? You willuse marbles to show howsome river shrimp get caughtin the pipes, and other shrimpare able to drift downstream.In the study you just read,each shrimp had just over a 40percent chance of floating intothe pipe, and almost a 60 per-cent chance of floating down-stream (that means that if 10shrimp were floating down-stream, 4 would go into thepipe, and 6 would float down-stream). Look again at Figure4. Fortunately for the shrimp,each one had better than a 50percent chance of driftingdownstream.
In this FACTivity, eachshrimp will have a 50 percentchance of floating into a pipe,and a 50 percent chance offloating downstream. Eachstation that you construct willsimulate a stream with a pipe.You may make three or fouridentical stations, with six to
eight students per station. Foreach station, you will need 3yardsticks, 1 piece of 22- by28-inch posterboard, 100 mar-bles, and a coffee can. Cut theposterboard along its widthinto two equal-sized pieces andfold each piece in half to maketents. Write “downstream” onone tent, and “pipe” on theother. Place the tents side byside, and lay one yardstick oneach side of the tents. Place thethird yardstick between thetents, at the back (see diagramon page 12).
Three students will be sta-tioned behind the tents. Onestudent will catch and countthe marbles coming throughone tent, the other will catchand count the marbles comingthrough the other tent. A thirdstudent will record the numberof marbles coming througheach tent. You may use thechart below as an example torecord your observations.Place the 100 marbles (simu-lating 100 shrimp) in the cof-fee can. Another student,standing about 6 feet (or 2meters) back, will gently rollthe marbles toward the tents.The student should aim for thecenter of the tents. Do not rollthem too hard—remember,they are shrimp floating down-stream! The students behindthe tents should catch andrecord the number of shrimpfloating “downstream” andthe number floating into the“pipe.” The shrimp that float-ed into the pipe will die. Theshrimp that floated down-stream should be taken backupstream and rolled toward
Figure 5. Fish ladder on the Río Espíritu Santo. The fish ladderis on the far right, below the people. It looks like a ramp inthis photo.

12
Sample form for recording your observations. Begin with 100 marbles
1st roll
2nd roll
3rd roll
4th roll
10th roll9th roll8th roll
7th roll6th roll5th roll
# through pipe % through pipe # floatingdownstream
% floatingdownstream
32 (for example) 32 or .32 68 68 or .68
Begin with 68 marbles – Record #
# through pipedivided by 68
Subtract numberthrough pipe from68
Divide # floatingdownstream by 68
Begin with #floating down-stream
the tents again. Every timeyou roll the marbles, the mar-bles represent the offspring ofthe shrimp that successfullyreturned upstream to repro-duce. Continue to roll themarbles until all of the shrimphave died (rolled into thepipe). Now that you havemade and recorded yourobservations, you will need to
analyze them. Calculate thepercentage of shrimp goinginto the pipe each time. Howmany times does it take for allof the shrimp to drift into thepipe? Now calculate the aver-age percentage going throughthe pipe by adding the num-bers in second column anddividing them by the numberof rolls. This tells you the
overall average percentage ofshrimp drifting through thepipe.
Record the average percent-age of your shrimp driftingthrough the pipe. Compareyour percentage to the percent-age that the scientists found intheir study (42 percent). Whydo you think your percentageis different than 42 percent?What is different about yourexperiment and the stream’sflow? If you rolled your mar-bles straight down the middle,your overall percentage shouldhave been close to 50 percent.Was it? If not, what may havecaused your percentage to bedifferent? Why do you thinkeach shrimp in the Rio SpirituSanto had better than a 50 per-cent chance of drifting past thepipe?
From Benstead, Jonathan P., March, James G., Pringle, Catherine M. and Scatena, Frederick N. (1999). Effects of a low-headdam and water abstraction on migratory tropical stream biota. Ecological Applications, 9(2): 656-668.
Marbles rolled toward tents
13
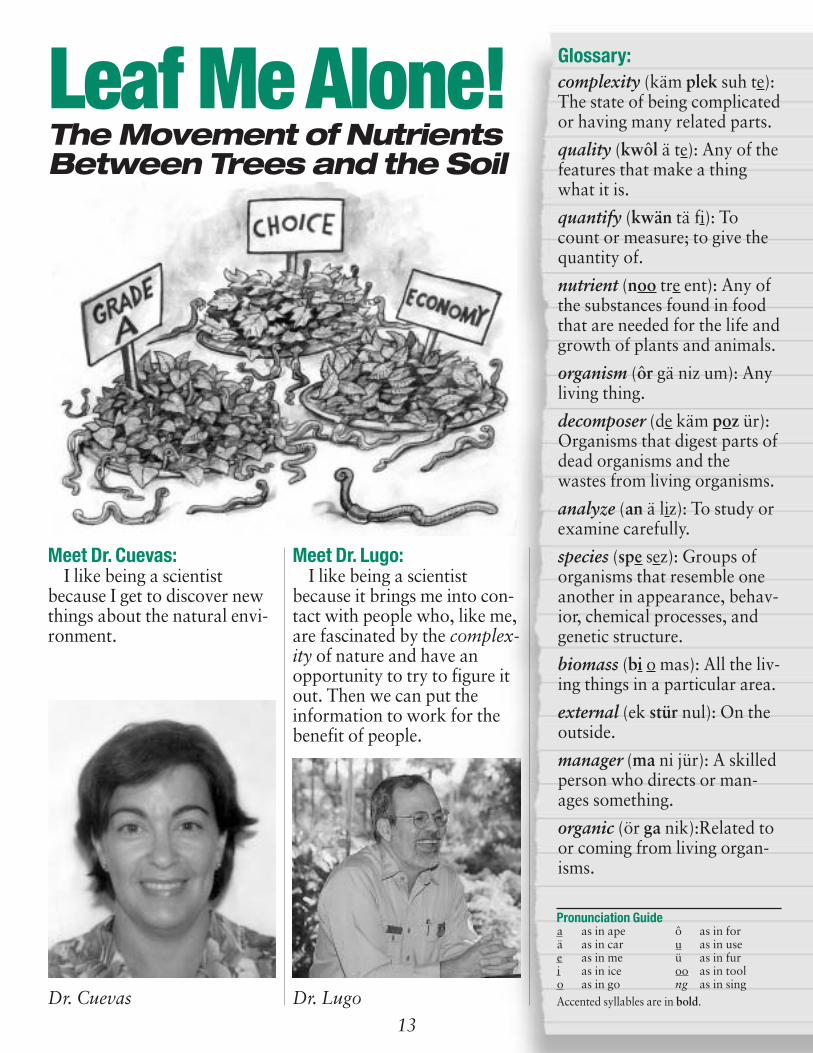
Meet Dr. Cuevas: I like being a scientist
because I get to discover newthings about the natural envi-ronment.
Meet Dr. Lugo:I like being a scientist
because it brings me into con-tact with people who, like me,are fascinated by the complex-ity of nature and have anopportunity to try to figure itout. Then we can put theinformation to work for thebenefit of people.
Glossary:complexity (käm plek suh te):The state of being complicatedor having many related parts.
quality (kwôl ä te): Any of thefeatures that make a thingwhat it is.
quantify (kwän tä fi): Tocount or measure; to give thequantity of.
nutrient (noo tre ent): Any ofthe substances found in foodthat are needed for the life andgrowth of plants and animals.
organism (ôr gä niz um): Anyliving thing.
decomposer (de käm poz ür):Organisms that digest parts ofdead organisms and thewastes from living organisms.
analyze (an ä liz): To study orexamine carefully.
species (spe sez): Groups oforganisms that resemble oneanother in appearance, behav-ior, chemical processes, andgenetic structure.
biomass (bi o mas): All the liv-ing things in a particular area.
external (ek stür nul): On theoutside.
manager (ma ni jür): A skilledperson who directs or man-ages something.
organic (ör ga nik):Related toor coming from living organ-isms.
Pronunciation Guidea as in apeä as in care as in mei as in iceo as in go
ô as in foru as in useü as in furoo as in toolng as in sing
Accented syllables are in bold.
Leaf Me Alone!The Movement of NutrientsBetween Trees and the Soil
Dr. Cuevas Dr. Lugo

What is energy?Energy is the abil-ity to do some-thing. Energyalways behaves inthe same way.The behavior of
energy is described by whatwe call the laws of energy.Energy can take many forms,and can be transferred from
Thinking About Ecologyone form to another. Whenenergy is transferred, its quan-tity decreases. That meansthat the amount of energyavailable to do something isless. The remainder of theenergy becomes scattered orspread out, usually in the formof heat. This heat energy isusually lost to the environ-ment. This means that when-ever we use energy, we always
end up with less useable ener-gy than we started with. Allliving things need a continualsource of high-quality energyto survive. As this energy isused, low-quality heat andother waste products areadded to the surroundings.Everything on Earth followsthe laws of energy, includingus! These are laws that no onecan break.
14
Thinking AboutScience
Scientists usemany ways todetermine thequality of athing. Most
often, scientists use numbersto determine the amount of aparticular quality a thing has.Sometimes, using numbers isnot the best way to determinesomething’s quality. Forexample, how could youdetermine how much better (aquality) your dinner tastesafter you add salt to it? Youwould taste it and make ajudgment. This judgmentwould be based on a compari-son with how it tasted beforeyou added salt. This is a wayof determining quality with-out using numbers. You couldquantify this quality of goodtaste by asking everyone inyour neighborhood to tasteyour dinner before and afteradding salt. Then, you couldcount the number of peoplewho said it tasted better.
Quality can be judged with orwithout numbers. Usually, sci-entists use numbers becausenumbers are less subject toindividual choice or opinion,as when they measure heightor weight. In this study, thescientists wanted to know thequality of leaves that fell fromtrees. Quality was determinedby the amount of nutrientsfound in the fallen leaves. Doyou think the scientists usednumbers to determine qualityin this case? Why or why not?
Thinking About theEnvironment
Food chainsdescribe theflow of energy
from one organism to another.A flow of energy occurs whenone organism digests another.When this happens, some ofthe energy is lost to the envi-ronment. The food chainstarts with green plants. Greenplants are the only type oforganism that can convert
sunlight into food by photo-synthesis (fo to sin thä sis). Inforests, some of the greenplants are consumed by ani-mals such as insects and deer,but most of them are con-sumed by decomposers asdead plant material.Decomposers include bacteria,fungi (fun ji), and small ani-mals such as earthworms.Decomposers move nutrientsfrom the dead plant materialto the soil. Once in the soil,plants can use the nutrientsfor new growth. The scientistsin this study wanted to knowwhether some kinds of fallenleaves have more nutrientsthan other kinds of leaves. Ifso, those leaves would providemore nutrients to the soil,making more nutrients avail-able to the plants.
IntroductionYou probably know that
trees depend on the soil inwhich they are rooted. But didyou know that the soildepends on trees also? By

15
shedding their leaves, treesprovide nutrients to the soil,which are made available tothe trees once again (Figure 1).In this study, the scientistsstudied trees growing onPuerto Rico, an island in theCaribbean (Figure 2). The sci-entists wanted to know if dif-ferent trees contributedifferent amounts of nutrientsto the soil. By learning if some
kinds of trees contribute morenutrients to the soil, the scien-tists could determine if thosekinds of trees should be plant-ed in areas where the soilneeds more nutrients. This isespecially important in thetropics, where the soil oftenhas fewer nutrients than inother forested areas of theworld.
ReflectionSection• What is oneof the problemsthe scientistswere trying tosolve?
• Do you think that it wouldbe good to plant trees thatcontribute more nutrientsto the soil? Why or whynot?
MethodsTrees contribute nutrients to
the soil in many ways. One ofthe primary ways they do thisis by shedding their leaves.When leaves fall to theground, bacteria, fungi, andanimals such as earthwormsdigest the leaves, moving thenutrients from the leaves tothe soil. The scientists decidedto collect falling leaves and toanalyze the leaves for nutrientcontent. They selected treesthat had been planted 23 to 26years earlier in the Luquillo(lu ke o) Experimental Forestin Puerto Rico (Figure 3).Puerto Rico is an island in theCaribbean (See Figure 2 andlocate Puerto Rico on themap).
The scientists chose to study10 types of trees that are usu-ally planted to produce woodproducts such as lumber, base-ball bats, and paper. The sci-entists randomly (ran dum le)selected six trees to study fromeach species. This means thatthe selection of trees was pure-ly by chance, like a drawing in
Gulf of Mexico
Atlantic Ocean
Brazil
CostaRica
U.S. Virgin Islands
Puerto Rico
Dominican Republic
United States
Caribbean Sea
North
Figure 2. The Caribbean
Leaves fall to ground
Roots take up the nutrients from thesoil
Waste products from earth worms and bacteria, which contain nutrients,become part of the soil
Earth worms and bacteriain the soil consumethe leaves
1
4
2
3
Figure 1. The tree nutrient cycle.

16
a lottery. For each type of treestudied, the scientists hung awire basket from the selectedtrees (Figure 4). The basketscaught some of the fallingleaves. Every 2 weeks, theleaves were collected,weighed, and a chemicalanalysis was done to deter-mine the amount of nutrientsin the fallen leaves. The scien-tists collected the leaves 29times over a period of 58weeks. How many total bas-kets of leaves did the scientistsanalyze? (Multiply 10 treespecies X 6 baskets X 29 col-lections.) Each time, the scien-tists weighed the leaves todetermine the quantity of bio-mass. They analyzed theleaves for the following nutri-ents: Nitrogen (N), phospho-rous (P), potassium (K),calcium (Ca), and magnesium(Mg). The amount of thesenutrients measured in theleaves helped the scientists todetermine their quality.
ReflectionSection• After leavesfall to theground, decom-posers, such as
bacteria and fungi, and ani-mals such as earthworms,help to move the nutrientsfrom the leaves to the soil.Do you think that the soilreceives the same amount ofenergy as was in the leaves?Why or why not? (Hint:Think about the laws ofenergy.)
• The scientists collectedleaves over the course of alittle over 1 year. Why doyou think that they wantedto collect leaves during dif-ferent times of the year?
ResultsThe scientists found that the
10 species studied differed inboth the number of fallenleaves and the quality of thenutrients. They also foundthat there was a relationshipbetween the number of fallenleaves and the quality of thenutrients. For example, if thenutrient content of individualleaves was low, there usuallywas a high quantity of bio-mass, or a lot of fallen leaves.If the nutrient quality of theleaves was high, not as manyleaves fell. That meant thatthe amount of overall nutri-ents available to the decom-posers in the soil was aboutthe same for most tree species(Figure 5).
The scientists also foundthat before the trees shed theirleaves, some of the trees tooknutrients back from theirleaves before shedding them.Those trees kept much of theirnutrients rather than con-tributing them to the soilthrough fallen leaves. The sci-entists concluded that therewere three groups of trees.The first group of trees kepttheir nutrients within the treeitself. The second groupcycled most of their nutrientsexternally, meaning that thenutrients were shed with theleaves and cycled into the soilfor later use by the tree andFigure 4. Wire mesh baskets were used to catch falling leaves.
Figure 3. LuquilloExperimental Forest.
17
other plants. The third groupused both kinds of nutrientcycling.
ReflectionSection• Think aboutall of the ani-mals and plantsin the forest.
What do you think mightbe the advantages of exter-nal nutrient cycling forother plants and animals?What might be some advan-tages for the trees whenthey take the nutrients backfrom their leaves beforeshedding them?
• In what ways is energy scat-tered or spread around dur-ing external nutrientcycling?
ImplicationsNot all trees cycle their
nutrients in exactly the sameway. If forest managers want
to enrich soil with a lot oforganic matter, they shouldplant trees that shed a lot ofleaves. If they want to put alot of nutrients into the soilquickly, they should planttrees that shed leaves with ahigh nutrient quality. Byknowing the nutrient qualityof fallen leaves, forest man-agers can help nature cycle
nutrients from trees to the soiland back to the trees again.
ReflectionSection• In the fall,many peoplerake the fallenleaves from
their yards. What happensto the nutrient cycle whenpeople remove the fallenleaves? How do some peo-ple make up for the loss ofnutrients available for plantgrowth? (Hint: What dopeople usually do in thespring to encourage treeand plant growth?)
• When people build a com-post bin, they are providinga special area for leaves andother organic wastes todecompose (Figure 6).What kind of organisms arecausing the organic matterto decompose in a compostbin? How is a compost binlike a forest floor? How is itdifferent?
Figure 6. Many people use a compost bin to recycle and reusetheir leftover, non-meat foods, fall leaves, and grass clippings.They then use the compost for their gardens and trees.
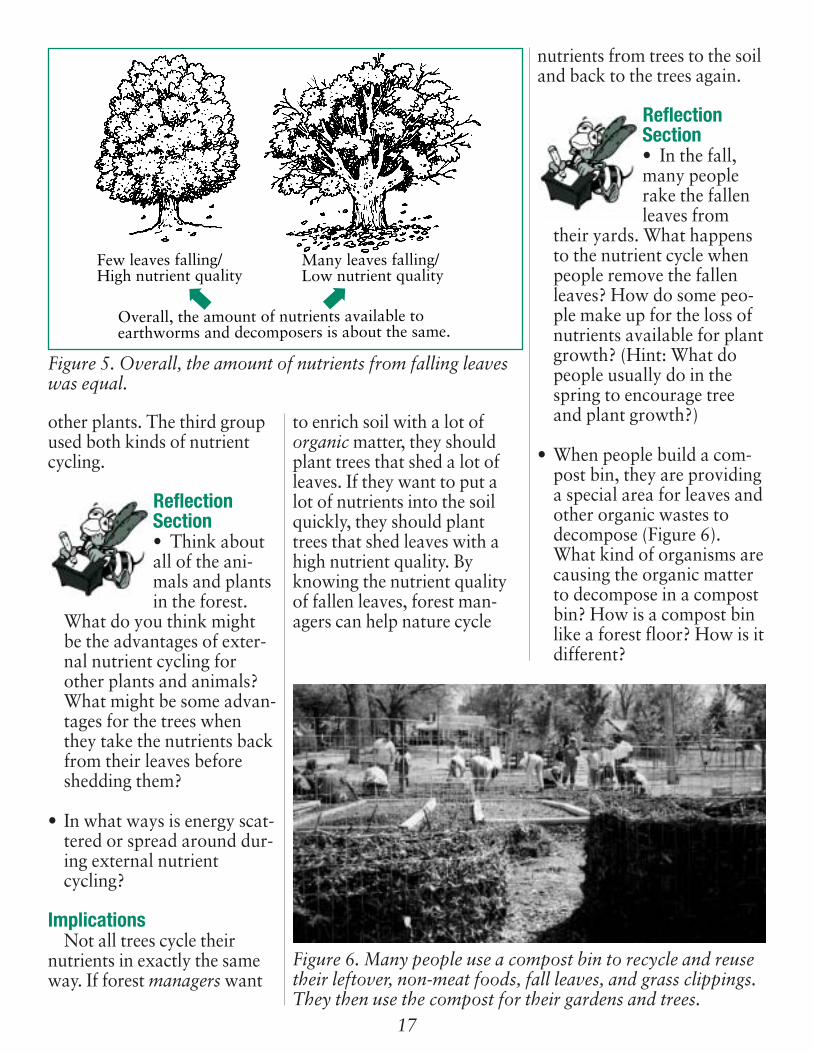
Few leaves falling/High nutrient quality
Many leaves falling/Low nutrient quality
Overall, the amount of nutrients available toearthworms and decomposers is about the same.
Figure 5. Overall, the amount of nutrients from falling leaveswas equal.

18
FACTivityIn this
FACTivity, youwill explore thebacteria livingin the soil near
your home or school. Thequestion you will be answer-ing is: What kind of bacterialive in different kinds of soil?It will take 3 to 4 weeks tocomplete this FACTivity, so bepatient. Bacteria need time togrow! You will need:
• 4 clear plastic 2-liter sodabottles with labels removed
• Enough clear, sturdy plasticwrap to cover the bottles
• four rubber bands• marker• masking tape• 2-gallon bucket• a 1-cup measuring cup• tablespoon• paint stirrer or other stir-
ring utensil• 4 small buckets of soil or
mud, each collected fromone of four differentsources (like a pond, gar-den, stream, forest, yard,etc.).
• 4 small buckets of water,one from each place youcollected the soil (use dis-tilled water for soil collect-ed from a dry place).
• 4 sheets of newspaper• 1 cup of powdered chalk
(crush several pieces ofchalk or you can buy somepowdered chalk at a hard-ware store)
Wash your hands beforestarting. If you have a cuton your hand, wear latex
gloves when working withsoil. Divide into fourgroups. Each group will pre-pare one of the experiments.Be sure to match the bucketof soil with the bucket ofwater from the same source.Label each bucket with thesource of soil or mud andwater using the maskingtape and marker.
For each experiment:Cut off the top end of your
plastic bottle. The top end willbe used as a funnel, and thebottom will hold your experi-ment. Shred the sheet of news-paper into thin strips and set itaside. In the 2-gallon bucket,add 5 or 6 cups of soil or mud.Pick out all of the sticks,leaves, and pebbles. Whilestirring, slowly add water(from the same source) untilthe mixture becomes like athick cream. Add the shreddednewspaper and 1 tablespoonof powdered chalk. Mix gen-tly, and make sure the mixtureis wet enough to flow throughthe funnel. Label your plasticbottle with the source of thesoil. Then, using the funnel,pour about 1 centimeter or1/2 inch of the mixture intothe plastic bottle. With onehand over the top of the plas-tic bottle, gently tap the mix-ture on a hard surface to allowthe mixture to settle evenly.Continue this process untilyou have filled the bottle towithin about 4 centimeters or2 inches from the top. Coverthe top with plastic wrap andseal with the rubber band.Place your bottle in a well-lit
place, but not in direct sun-light. Keep it out of heat and atroom temperature.
For 3 or 4 weeks, observethe bottles daily. Look forcolor changes in the mixtures.Record your observations,using the chart below as anexample. You may draw, label,and color a picture of each ofthe jars at the end of eachweek.
You should begin to see dif-ferent colors in the bottles.What are the colors and whereare they located in the bottle?What do you think causes thedifferent colors?
• Red and orange are purplephotosynthetic (fo to sintheh tik) bacteria
• Green at the surface arecyanobacteria (si an o bakter e uh) and algae
• Olive green in the middle orlower area are green sulphurbacteria
• Black patches are iron sul-fide, a chemical formed bycertain bacteria
To learn more about these different kindsof bacteria, visitwww.ucmp.berkeley.edu/bacteria/bacteriasy.html
This FACTivity was adapted from an activ-ity titled “Biosphere in a Bottle” developedby the National Association of BiologyTeachers. For more fun activities related tobacteria, visit http://www.microbe.org.
From: Cuevas, E. & Lugo, A. E. (1998).Dynamics of organic matter and nutrientreturn from litterfall in stands of ten tropi-cal tree plantation species. Forest Ecologyand Management, 112: 263-279.
To learn more about nutrient cycling, visithttp://www.swifty.com/apase/charlotte/soil7.html

19
Meet Dr. Weaver:I like being a scientist
because I do a little bit ofeverything. My backgroundhas allowed me to travel,work in different cultures,learn new languages, andwork with people in develop-ing countries on many practi-cal projects.
Glossary:watershed (wä tür shed):Land area with small streamsthat deliver water to a largerstream.
represent (rep re zent): To bean example of.
diversity (duh vür suh te):The quality of being differentor varied.
sustainable (suh stan uh bul):The quality of surviving orbeing maintained over a spe-cific time period.
conservation (kän sür vashun): The care and protec-tion of natural resources suchas forests and water.
sea level (se lev ul): The levelof the surface of the sea.
elevation (el uh va shun):The height above sea level.
topography (tuh pog ruh fe):The surface features of aregion, such as rivers, hills,and valleys.
diameter (di am uh ter): Thedistance equal to a straightline passing through the cen-ter of a circle, cylinder, orsphere.
species (spë sëz): Groups oforganisms that resemble oneanother in appearance,behavior, chemical processes,and genetic structure.
Pronunciation Guidea as in apeä as in care as in mei as in iceo as in go
ô as in foru as in useü as in furoo as in toolng as in sing
Accented syllables are in bold.
OOoooohh!! TThhaatt’’ssGGrroowwtthh!!
Measuring Trees inCinnamon Bay Watershed
Dr. Weaver
Measuring Trees inCinnamon Bay Watershed

All livingthings grow anddevelop. Thinkabout yourselfand your friends.As a living thing,you grow and
develop too. Once you stopgrowing physically, you willcontinue to change anddevelop in other ways. Whenliving systems such as forestsstop growing bigger, theycontinue to develop in other
Thinking About Ecologyways. In this study the scien-tist wanted to know how thetrees were growing anddeveloping in a watershed inthe Virgin Islands. By learn-ing how the trees were grow-ing and developing, he wouldknow about the mixture oftrees in the watershed. Withthis information, the scientistcan help managers make bet-ter decisions about how tokeep the area healthy andsustainable.
20
Thinking AboutScience
When study-ing the naturalenvironment,scientists some-times have to
wait many years to discovernew things. The scientist inthis study wanted to knowhow the trees were changingin the Cinnamon Bay water-shed, St. John, U.S. VirginIslands National Park (Figure1). He was interested in know-ing what kind of new treeswere growing and what kindof trees were dying. He alsowanted to know how fast thetrees were growing. If peoplewant to understand the natur-al environment, they have toknow how to describe it.Usually, the best way todescribe an environment is toobserve it, and then to recordyour observations. When youknow what an environmentlooked like one year, you cancompare it with other years totell how much it has changed.
Thinking About theEnvironment
The VirginIslands NationalPark is located
in the U.S. Virgin Islands(Figure 1). In 1976, the UnitedNations Educational,Scientific, and CulturalOrganization (UNESCO, unes ko) named the nationalpark a Biosphere (bi o sfer)Reserve (re zerv). (The UnitedNations is an internationalorganization that works for
world peace and security.) ABiosphere Reserve is a speciallabel given to natural areasaround the world that repre-sent the world’s natural diver-sity. A biosphere reserveshould be managed so that itstays healthy into the future.This is called keeping the areasustainable. To manage aBiosphere Reserve for sustain-ability (suh stan uh bil uh te),
managers have to considerconservation, research, educa-tion, and whether and how tobuild structures for humanuse. All of these things mustbe balanced so that the areastays healthy into the future.
IntroductionIn 1718, Danish settlers
moved to what is now the U.S.Virgin Islands. They cut down
Gulf of Mexico
Atlantic Ocean
Brazil
CostaRica
U.S. Virgin Islands
Puerto Rico
Dominican Republic
United States
Caribbean Sea
North
Figure 1. Location of U.S. Virgin Islands in the Caribbean.

21
most of the trees and plantedsugar cane. By 1750, almostall of the original trees hadbeen cut down. Over time,new trees were planted orbegan to grow on their own.In 1917 the United Statesbought the Virgin Islandsfrom Denmark. By then, onlyabout 10 percent of the islandwas being used for crops, andthe rest of it was again a for-est. (What percentage wasforested? Subtract 10 percentfrom 100 percent.) In 1956,the United States established anational park on one of theislands. The United Nationsnamed the national park aBiosphere Reserve in 1976. Tohelp manage the park as aBiosphere Reserve, theNational Park Service wantedto understand how fast thetrees were growing. To dothis, they invited the ForestService to do a study of thetrees in the Cinnamon Baywatershed, one of the areaswithin the Biosphere Reserve(Figures 2 and 3).
ReflectionSection• If you werethe scientist,how would youstudy how well
the trees were growing inthe Cinnamon Bay water-shed?
• Why do you think theUnited Nations would likeareas to be managed sus-tainably?
MethodThe Cinnamon Bay water-
shed covers 1.32 km2 (Howmany square miles is that?Multiply 1.32 X .621), andrises from sea level to 330meters in elevation (Howmany feet is that? Multiply330 X 3.28). Because the sci-entist could not study theentire area by himself, hedecided to identify 16 smallerareas within the watershed tostudy. Because he wantedthese areas to represent thewhole watershed, he selectedareas at different elevationsand topography. (Figure 4).
How many areas have beenidentified in Figure 4?Compare this number withthe number of areas the scien-tist studied. You should nowrealize that there was onemore area identified by thescientist that is not shown inFigure 4. The scientist locatedthe 16th area near the highestpoint of the watershed, at 275meters in elevation. (Howmany feet is that?)
The scientist then measuredthe height and diameter ofalmost every tree in the 16areas. When scientists mea-sure the diameter of a tree,
Figures 2 and 3. Cinnamon Bay watershed in the U. S. VirginIslands National Park.

22
they always measure it at 1.37meters (or 4.5 feet) above theground. This measurement iscalled d.b.h., or diameter atbreast height (Figure 5). If thed.b.h. of a tree was less than4.1 centimeters (or 1.61 inch-es), the scientist did notinclude it in his observations.For every tree measured, thetype of tree was identified andrecorded. The scientist thenleft the area to grow for 5years. When he returned 5years later, he counted all ofthe new trees and the numberof trees that had died, andmeasured how much the livingtrees had grown.
ReflectionSection• Why do youthink the scien-tist studiedareas at differ-
ent elevations?
• Why do you think that sci-entists always measure treesat d.b.h.? (Hint: What ifone scientist measured atree’s diameter at 3 meters
high and another scientistmeasured the same tree’sdiameter at 4 meters?Would their measurementsbe the same?)
• What three kinds of infor-mation did the scientisthave after he took his mea-surements 5 years later?
ResultsAfter 5 years, the scientist
counted 206 new trees in the16 areas. He also found that161 trees had died. Overall,would you say that the water-shed is gaining trees or losingtrees? Why? The trees grew anaverage of 0.07 centimeters ayear when measured at d.b.h.Most of the trees grew < (lessthan) 0.10 centimeters a yearin height (How many inches isthat? Multiply 0.10 X .394)The scientist found no new
Figure 4. Areas studied in the Cinnamon Bay watershed.
Elevation
Topography
60 meters(How manyfeet?Multiply 60X 3.28)
120 meters(How manyfeet?)
10 X 50meters
10 X 50meters
10 X 50meters
10 X 50meters
Valley
10 X 50meters
10 X 50meters
10 X 50meters
10 X 50meters
10 X 50meters
MountainSlope
10 X 50meters
10 X 50meters
10 X 50meters
10 X 50meters For example:This area ison a moun-tain ridge atan elevationof 120 meters
10 X 50meters(How manyfeet?)
MountainRidge
240 meters(How manyfeet?)
210 meters(How manyfeet?)
180 meters(How manyfeet?)
10 X 50meters
Figure 5. Research assistantmeasuring d.b.h. in theCinnamon Bay watershed.
23
tree species growing in thestudy areas.
ReflectionSection• Think aboutthe trees whereyou live. In thespring, new
growth appears as newstems and leaves.Compared to the treeswhere you live, would yousay that the trees inCinnamon Bay watershedwere growing faster orslower?
• Based on the results of thisresearch, do you think thewatershed is becomingmore diverse in its treespecies? Why or why not?
ImplicationsThis study will help forest
managers in many ways. First,it tells them how much timewill be needed for the forest togrow back if, in the future, thetrees are cut down or a hurri-cane destroys the forest.Second, it tells scientists whatkind of trees grow at differentelevations in this tropicalwatershed. This could be espe-cially helpful if managerswant to plant trees in a similararea. Finally, this study helpsmanagers to identify whichtrees are common and whichare rare in the tropical water-shed. It also tells managerswhich trees will grow to matu-rity, if there is no hurricane orother disturbance. You can seethat by studying the currentconditions of a natural area,
scientists can help forest man-agers protect the area into thefuture.
ReflectionSection• Rememberthat theCinnamon Baywatershed is
part of the BiosphereReserve. Go back to“Thinking About theEnvironment” and look atwhat must be balanced in aBiosphere Reserve. Whichone of those four things arereported on in this article?
• Do you think the scientistshould go back toCinnamon Bay watershedin 5 more years and takemore measurements? Whyor why not?
FACTivityFor this
FACTivity, youwill answer thequestion: Whatis the relation-
ship between tree height andd.b.h.? In other words, whentrees get taller, does the d.b.h.get smaller, larger, or stay thesame? You might be able toguess at the answer to thisquestion based on your exist-ing knowledge. What do youthink the relationship is? Yourguess is a hypothesis (hi pawthuh sis). A hypothesis is anassumption that is made forthe time being, so that it canbe tested using planned andrecorded observation. For this
FACTivity, you will need acloth (flexible) tape measure.
The method you will use totest your hypothesis is this: Goto an area that has trees ofvarying heights. You will firstplace the trees into categories,based on their height. Sinceyou will not be able to mea-sure the height of most of thetrees, for this FACTivity youwill be placing the trees ingeneral categories. Find atleast three trees in each ofthese categories:• Short trees (those that are
not much taller than ahuman)
• Medium height trees (thosethat are much taller than ahuman, but not taller than atwo story-building
• Tall trees (those that aretaller than a two storybuilding
If you cannot find enoughtrees in these categories nearyour school, you may want tohave your classmates takemeasurements of trees athome or in different places.The more trees you can mea-sure in each of these cate-gories, the more informationyou will have to answer thequestion.
To measure each tree’sdiameter at d.b.h., place thetape measure at ground level.Measure up the tree’s trunk to1.37 meters (4.5 feet). Haveyour classmate hold a finger atthat height on the trunk. Atthat height, measure the cir-cumference of the tree. Thecircumference is the distancearound the tree trunk. For

24
each measurement, you willhave to calculate the diameterfrom the circumference. To dothis, multiply the circumfer-ence by .3183. No matter howlarge the circumference, thediameter is always .3183times the size of the circumfer-ence. Record all of your mea-surements. You can use thechart on the right as an exam-ple. After you have finishedrecording all of your measure-ments, you will need to deter-mine if there is a relationshipbetween tree d.b.h. and treeheight.
To determine if there is arelationship between treeheight and d.b.h., create a his-togram (bar chart) from yourrecorded information. Youcan use the sample on theright to create your bar chart.See an example of a bar chartbelow the sample.
After you have made yourbar chart, can you see a pat-tern in the d.b.h. of the trees?What is the pattern? The pat-tern is a relationship that youhave discovered between treeheight and d.b.h. Now thatyou know this, what is theanswer to the question askedat the beginning of thisFACTivity? Was your hypoth-esis correct?
From Weaver, P. L. (1990). Tree diametergrowth rates in Cinnamon Bay watershed,St. John, U.S. Virgin Islands. CaribbeanJournal of Science, 26(1-2): 1-6.
5045403530
d.b.h. 2520151050
Short trees Medium trees Tall trees
Tree #1 – d.b.h.
Tree #2 – d.b.h.
Tree #3 – d.b.h.
Sample chart for recording measurements
Sample bar chart
Tree #
Tree height Short Medium Tall
1 2 3 1 2 31 2 3
5045403530
d.b.h. 2520151050
Example of a bar chart
Tree #
Tree height Short Medium Tall
1 2 3 1 2 31 2 3

25
Meet Dr. Keller (with hat):I like being a scientist
because I get to follow my nat-ural curiosity to learn how theEarth system works. My workis split between the field, theoffice, and the laboratory andI have a great deal of indepen-dence. I love to learn newthings.
Glossary:gaseous (gash us): In theform of gas.
greenhouse effect (grenhowls e fekt): Warming ofthe Earth’s surface thatoccurs when the sun’s heat istrapped by the atmosphere.
climate (kli met): The aver-age condition of the weatherat a place.
bacteria (bak ter e uh):Living things that only haveone cell and can only be seenusing a microscope.
specialization (spesh ul i zashun): Special study of some-thing or working only in aspecial topic or area.
compact (käm pakt): To packclosely and firmly together.
porous (poor us): Full ofpores or tiny holes throughwhich water, air, etc., maypass.
sample (sam pool): A part orpiece that shows what thewhole group or thing is like.
anaerobic (an ä ro bik):Existing in the absence ofoxygen.
Pronunciation Guidea as in apeä as in care as in mei as in iceo as in go
ô as in foru as in useü as in furoo as in toolng as in sing
Accented syllables are in bold.
Thinking AboutScience
Chemistry isthe science ofthe buildingblocks of allmatter. Atoms
are the most basic buildingblock. Molecules are combi-nations of two or more atomsof the same chemical element.All matter is built from over100 chemical elements.Examples of elements arenitrogen, hydrogen, oxygen,and carbon. Compounds aremade up of two or more ele-ments. To make it easier to
It’s a Gas!
The Exchange of GasesBetween the Soil and the
Atmosphere
Dr. Keller

26
imagine, think about thealphabet. Atoms are like dif-ferent letters. There could be“A” atoms, “B” atoms, and“C” atoms, for example.Elements are like a single let-ter, such as A, I, or T.Molecules are like strings ofthe same letter (or element),such as BBB or MMMM.Compounds are like words,which are made from differentletters (or elements). Whenelements interact and becomecompounds, their structurechanges. Elements can forman almost limitless number ofcompounds, just as letters canform an almost limitless num-ber of words. These com-pounds can be solid, liquid, orgas. Some scientists study thestructure and behavior ofgaseous compounds. In thisstudy, the scientists were inter-ested in studying the gaseouscompounds that go into theatmosphere as greenhousegases.
Thinking About theEnvironment
The green-house effect iscaused by cer-
tain gases that act like glass ina greenhouse. They reflectheat in the atmosphere backdown to earth (Figure 1). Theamount of heat trapped in theatmosphere can vary, depend-ing on the type of gas and howlong it stays in the atmos-phere. The major greenhousegases are water vapor, carbondioxide (kär bun di ox id),methane (meth an), nitrous (ni
trus) oxide, and chlorofluoro-carbons (klôr o flôr o kärbuns), also called CFCs. Weneed a certain level of green-house gases to maintain a live-able climate on Earth. If wehad too small an amount ofgreenhouse gases, the Earth’sclimate would get too cold. Ifwe get too great an amount ofgreenhouse gases, the Earth’sclimate will get too warm.Human activities, such asburning fossil fuels like petro-leum, can create greenhousegases. The scientists in thisstudy looked at greenhousegases from another perspec-tive. They looked at howhuman activities have enabled
soil bacteria to increase theamount of nitrous oxide in theatmosphere.
IntroductionTropical forests are some-
times cut down so thathumans can use the trees forwood and other products.Then, the cleared land is madeinto a pasture so that cattlecan be raised for human con-sumption. When forest landbecomes pasture, the soilchanges. It becomes morecompacted and less porous.(Can you think of why thismight happen? Think aboutthe size and weight of cattle.)Previous research had shown
SEA LEVEL
7 miles
Thermosphere
Mesosphere
Stratosphere
Troposphere: Weather layer—80% of oursky “contents”
20 miles
40 miles
30 miles
50 miles
60 miles
70 miles
Figure 1. The Earth’s atmosphere. The troposphere is the sec-tion of our atmosphere reaching from sea level up to 7 miles.Most clouds are contained within the troposphere. When youfly somewhere in a jet, you are flying through the middle andupper portions of our troposphere.

27Figure 2. The nitrogen cycle.
Atmospheric Nitrogen (N2)
Soil bacteriaabsorb N2from theatmosphere
Plants areeaten by animals
Dead plants, animals, and animal wasteswork into the soil where bacteria turnthem into ammonium ions
Bacteria turn nitrites into nitrogen (N2) and nitratesinto nitrogen and nitrous oxide (N2O)
Plants take upammonium ionsand create proteinsand other nitrogen-containing nutrients
More bacteriaturn ammoniumions into nitrites (NO2-)and nitrates (NO3-)
Bacteria in soil and on plantroots turn N2
into ammonia(NH3), then other bacteriaturn ammonia intoammonia ions (NH4+)
BBB
Ammonia
Ammonia ions
B
B
BB
B
Nitrates
Nitrites
N2O N2 N2
Often, scientistsstudy one particu-lar event orobject. Whilesuch specializa-tion helps scientists to
understand a lot about thatone event or object, it does notalways help them to under-stand how that event or objectrelates to other events orobjects. Ecologists (e käl uhjists) are scientists who studyhow living things relate to
Thinking About Ecologyeach other and to nonlivingthings. In this study, the ecolo-gists were studying the nitro-gen cycle (Figure 2). Thenitrogen cycle explains therelationship of the elementnitrogen with other elements,and with plants, animals, andbacteria. Bacteria are impor-tant in the cycle, because theyconvert nitrogen from theatmosphere into forms thatplants can use such as nitratesand ammonia. These com-pounds are used by plants tomake other compounds such
as protein. Animals who eatplants can use the proteinfrom the plants. Bacteria liv-ing in soil convert animalwastes and dead materialfrom plants back into nitrogencompounds. The nitrogen isreleased back to the atmos-phere, and the cycle beginsagain. This is an example ofhow life depends on relation-ships between living and non-living things. What are someexamples of how your lifedepends on living and nonliv-ing things?

28
that pasture soils release moregreenhouse gases than forest-ed land. Sometimes pasturesare abandoned after a while.This is often because the soilcan no longer produce enoughplants to support the cattle.When pastures are aban-doned, the forest begins togrow again. No one knewwhether soils from theseyoung forests would begin torelease less greenhouse gasesas the forest grew again. Thatis the question the scientistswanted to answer.
ReflectionSection• What is thequestion the sci-entists wantedto answer?
What is the bigger problemtheir research might help tosolve?
• Do you think the scientistsneeded to visit and studyyoung tropical forests, orcould they do all of theirresearch inside a laborato-ry? Why or why not?
MethodThe scientists selected four
types of areas to study. Theystudied old tropical forests,young tropical forests, pas-tures that were currently beingused for raising cattle, andrecently abandoned pastures(Figures 3-5). They selectedthree different areas of eachtype to study as examples.(How many total areas didthey study? Multiply 4 typesof areas times 3 exampleseach.) Then, they picked eightspots in each area where theymeasured the amount ofnitrous oxide (N2O) in the
Figures 3-5. An old tropicalforest, a current pasture, anda young tropical forest.
29
soil. (How many total spotsdid they measure? Multiply 12X 8.) The scientists measuredthe amount of nitrous oxide atthe top level of the soil at eachspot once a month for 12months. (How many totalmeasurements did they col-lect? Multiply 12 X 8 X 12.How many measurements didthey collect for each type ofarea? Divide the total mea-surements by the number oftypes.) The scientists collectedsamples of the gases that werein the soil by placing aninstrument 2 centimeters intothe soil (Figure 6). (To find outhow many inches that is, mul-tiply 2 X .393.) They took thegaseous samples back to a lab-oratory. There they measurednow much nitrous oxide wasin the samples collected fromthe top level of the soil.
ReflectionSection• Why do youthink the scien-tists studied allfour types of
areas, instead of just study-ing young tropical forests?
• Do you think that the scien-tists found that more, thesame, or less nitrous oxidewas in the soil of youngtropical forests comparedwith the soil in the pasturebeing used by cattle? Why?
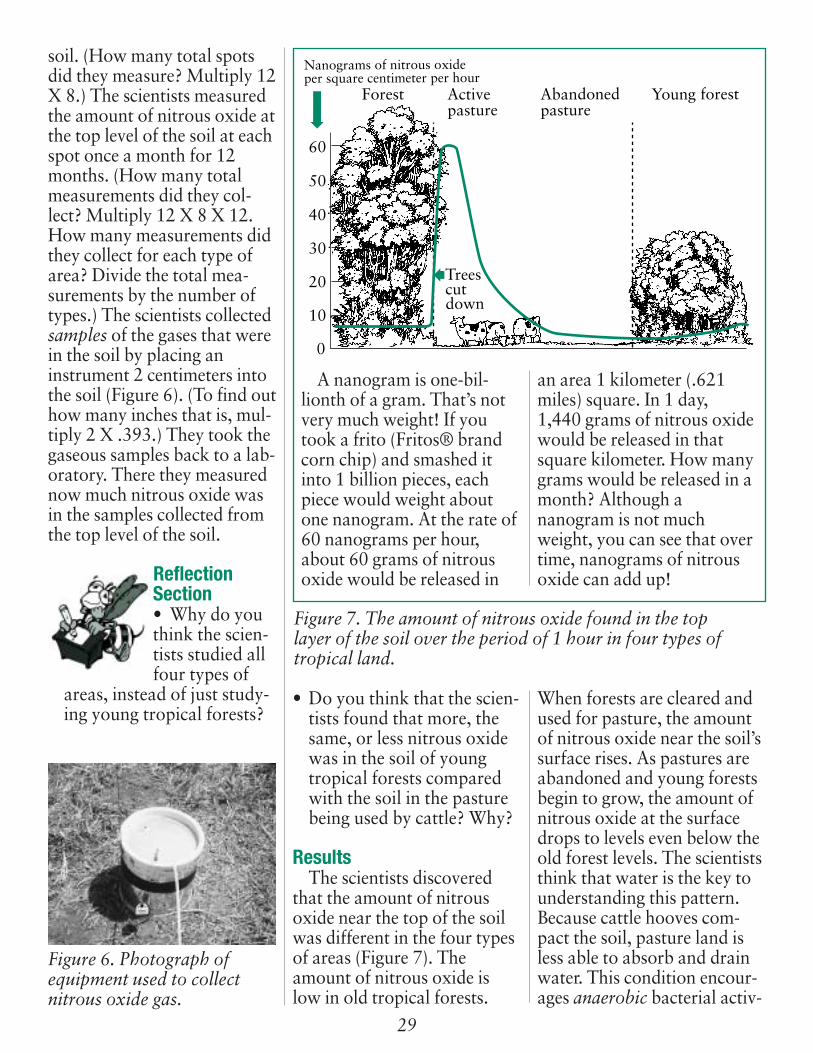
ResultsThe scientists discovered
that the amount of nitrousoxide near the top of the soilwas different in the four typesof areas (Figure 7). Theamount of nitrous oxide islow in old tropical forests.
Figure 6. Photograph ofequipment used to collectnitrous oxide gas.
When forests are cleared andused for pasture, the amountof nitrous oxide near the soil’ssurface rises. As pastures areabandoned and young forestsbegin to grow, the amount ofnitrous oxide at the surfacedrops to levels even below theold forest levels. The scientiststhink that water is the key tounderstanding this pattern.Because cattle hooves com-pact the soil, pasture land isless able to absorb and drainwater. This condition encour-ages anaerobic bacterial activ-
Forest Activepasture
Abandonedpasture
Young forest
Treescut down
0
10
20
30
40
50
60
Nanograms of nitrous oxideper square centimeter per hour
Figure 7. The amount of nitrous oxide found in the toplayer of the soil over the period of 1 hour in four types oftropical land.
A nanogram is one-bil-lionth of a gram. That’s notvery much weight! If youtook a frito (Fritos® brandcorn chip) and smashed itinto 1 billion pieces, eachpiece would weight aboutone nanogram. At the rate of60 nanograms per hour,about 60 grams of nitrousoxide would be released in
an area 1 kilometer (.621miles) square. In 1 day,1,440 grams of nitrous oxidewould be released in thatsquare kilometer. How manygrams would be released in amonth? Although ananogram is not muchweight, you can see that overtime, nanograms of nitrousoxide can add up!

30
ity on plant and animal wastesnear the soil’s surface. Thisresults in an increased amountof nitrous oxide near the soil’ssurface, which is then releasedinto the atmosphere.
ReflectionSection• What are twothings happen-ing in tropicalpastures that
might be increasing theamount of nitrous oxidebeing released into theatmosphere?
• The scientists measured theamount of nitrous oxide 2centimeters below the sur-face of the soil. Do youthink that same amount ofnitrous oxide is beingreleased into the atmos-phere? Why or why not?
ImplicationsThe scientists discovered
that nitrous oxide is beingreleased into the atmosphereas a part of the nitrogen cycle.They do not know, however,what causes bacteria to turnsome ammonium ions intonitrous oxide and others intonitrogen. Nitrogen is a neces-sary gas in the atmosphere,but nitrous oxide is a green-house gas that could causeharm in great amounts. Thereis still a lot to learn abouttropical soils and greenhousegases. This research showsthat humans impact the Earth
in ways that we may not beable to see. By making deci-sions to manage land in differ-ent ways, we affect whathappens now and what willhappen in the future.
ReflectionSection• What otherthings do youknow about theeffect of green-
house gases?
• Do you think that no mat-ter where they are on theplanet, pastures cause morenitrous oxide to be releasedthan would happen if theland were a forest? Why orwhy not?
DiscoveryFACTivity
In thisFACTivity, youwill answer thequestion: What
are the similarities between aglass jar with soil and theEarth’s atmosphere? Themethod you will use to answerthis question is this: Get twothermometers, a large clearglass jar with a lid (be care-ful!), and 1 cup of dark soil.Put the soil into the glass jar toa depth of about 4 centimeters(or about 2 inches). Put a ther-mometer upside down in thejar, and close the lid. Turn theglass jar over, so that the soil isat the lid and the thermometeris right side up. Place the jar in
the sunlight or under a high-intensity bulb for 1 hour. Placethe second thermometer nearthe jar.
At the end of the hour,record the temperature out-side of the jar using the secondthermometer. Record the tem-perature of the air inside ofthe glass jar. Compare the twotemperatures. Then considerthe following questions:
• What part of Earth does theair inside of the jar repre-sent?
• What part of the Earth doesthe glass represent?
• What part of the Earth doesthe black dirt represent?
You will see that the soil isheated by the light, whichthen radiates the heat backinto the air where it is trappedby the glass. You have createda greenhouse effect! Now seeif you can answer the questionposed at the beginning of thisFACTivity.
This FACTivity was adapted fromRodriguez, N., Kampen, A., andDufresne, M. (2000). It’s your planet: Astudy of global warming. An interdiscipli-nary curriculum designed for middleschool students and their exploration ofglobal warming. Visit this Web site formore information and activities:http://www.classtech2000.com/archno2/SessionB/Jesuit/gwarming.htm
From Keller, M. & Reiners, W. A. (1994).Soil-atmosphere exchange of nitrousoxide, nitric oxide, and methane undersecondary succession of pasture to forestin the Atlantic lowlands of Costa Rica.Global biogeochemical cycles, 8(4): 399-409.

31
Meet Dr. Latta (Second from left):
I like being a scientistbecause of the adventure ofworking in wild places and thechallenge of trying to under-stand the ecology of birds. I
think it is important to protectthe diversity of living thingson the planet.
Thinking AboutScience
When scien-tists observewhat happens innature, theyoften must cre-
ate categories for things thatthey observe. Categories helpthem to classify their observa-tions. Classifying is a way ofgrouping similar thingstogether. This helps scientists
Glossary:ecology (e kä luh je): The study ofthe interactions of living thingswith one another and with theirenvironment.
diversity (duh vür suh te): Thequality of being different or var-ied.
classify (klas uh fi): To arrange byputting into groups according tosome system.
analyze (an uh liz): To study orexamine carefully.
summarize (sum uh riz): To makea summary or a brief report.
forage (for ij): Food for animalsusually taken by browsing orgrazing; the act of taking suchfood.
adapt (uh dapt): To change so asto fit new conditions.
mature (muh toor): Fully devel-oped or fully grown.
species (spe sez): Groups of organ-isms that resemble one another inappearance, behavior, chemicalprocesses, and genetic structure.
tropical (träp i käl): Of, in, or likethe tropics. The tropics is theregion of the Earth near theEquator.
understory (un der stôr e):Vegetation in a forest that is nearthe ground.
migratory (mi gruh tôr e): Havinga characteristic of moving fromone place to another.
perch (purch): A tree branch thata bird sits on.
population (päp yoo la shun): Thewhole number of individuals ofthe same type occupying an area.
Pronunciation Guidea as in apeä as in care as in mei as in iceo as in go
ô as in foru as in useü as in furoo as in toolng as in sing
Accented syllables are in bold.
Tropical Birds and TheirTemporary Guests
Dr. Latta
Please Join Usfor Dinner:

32
analyze and summarize whatthey discover. In this study, thescientists wanted to under-stand the foraging behavior ofbirds in the DominicanRepublic, which is part of anisland in the Caribbean (kä ribe un) Sea (Figure 1). By ana-lyzing and summarizing theirobservations of bird behavior,the scientists hoped to betterunderstand how differentbirds find food.
Thinking About theEnvironment
Even the samekind of animalsmight eat differ-
ent kinds of foods. Over hun-dreds or thousands of years,animals have adapted to dif-ferent environments wherefood is available. In this study,the scientists wanted to studythe diets of birds. For exam-ple, some birds eat insects,some eat berries, some eatnectar (the sweet liquid from aplant), and some eat seeds.Some birds eat more than onetype of food. When different
kinds of birds eat differentkinds of foods, they can live inthe same area because they donot have to compete for thesame food source. The samething is true for other kinds ofanimals. Because of this, manydifferent kinds of animals canlive in the same area.
IntroductionPine forests are common in
the tropical Caribbean.Usually, these pine forests also
have an understory of broad-leafed trees. Broad-leafed treesare trees with flat leaves. Thepine forests are the home ofmany different kinds of birds.Although scientists had stud-ied the birds living in otherkinds of forests, they had notstudied the birds living intropical pine forests. Somebirds live in the pine forests allyear. These birds are calledresidents (Figure 2). Otherbirds are migratory, living in
Figure 1. Location of the Dominican Republic in theCaribbean Sea.
Gulf of Mexico
Atlantic Ocean
Brazil
CostaRica
U.S. Virgin Islands
Puerto Rico
Dominican Republic
United States
Caribbean Sea
North
Diversity is animportant qualityfor all maturecommunities oflife. In a maturenatural environ-ment, it is impor-
tant to have a diversity ofspecies. This means that nat-ural communities usually have
Thinking About Ecologydifferent kinds of animal andplant species. It is also impor-tant for differences to occur inthe same kinds of animals andplants. Think about the com-munity that you live in. Yourfamily is different in manyways than other families inyour neighborhood, and youare different in many ways
from other people. In the nat-ural world, there is a diversityof other animals and plants. Inthis study, the scientists wereinterested in observing howdifferent birds eat differentfoods. When there is a diversi-ty of animals living in an area,there is food available for allof the animals.
33
the pine forests only duringthe winter months. Migratorybirds fly from the colder northto spend the winter in thetropics, where it is warm. Thescientists in this study wantedto learn what kind of food theresident birds and migratorybirds eat during the wintermonths.
ReflectionSection• If you werethe scientist,how would youstudy what
birds eat in the pine forests?
• Do you think that differentbirds eat different kinds offoods in pine forests? Whyor why not?
MethodsFirst, the scientists selected
12 areas in a large pine forest.These areas had trees thatwere typical of the trees in thelarger pine forest surroundingthe 12 areas. After they select-
ed an area, they drew an imag-inary circle 16 meters in diam-eter (To find out how manyyards this is, multiply 16 by1.09). Then they identified thetype of trees within the circles.The scientists observed theforaging behavior of birds bywalking through different sec-tions of the pine forest eachday. They recorded the type ofbird and the bird behaviorthey observed. To record howeach bird was getting its food,the scientists classified thebirds’ foraging behavior intofive types (Table 1). They alsorecorded four more things: 1)the species of bird, 2) whetherthe bird species was a residentor a migrant, 3) whether thebird was in the pines, in thebroad leaf area, or in the over-lap of the two areas when itwas getting its food, and 4)how each bird was getting itsfood (Table 2 and Figure 3).
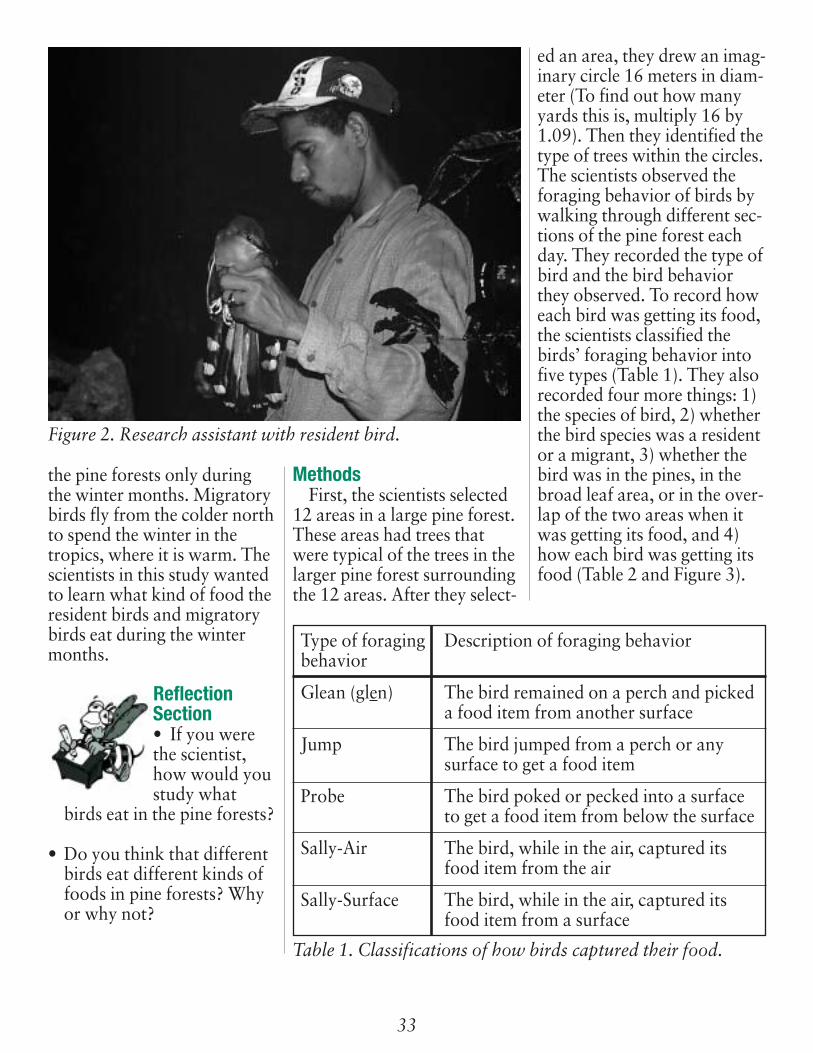
Figure 2. Research assistant with resident bird.
Table 1. Classifications of how birds captured their food.
Type of foraging Description of foraging behaviorbehavior
Glean (glen) The bird remained on a perch and pickeda food item from another surface
Jump The bird jumped from a perch or any surface to get a food item
Probe The bird poked or pecked into a surface to get a food item from below the surface
Sally-Air The bird, while in the air, captured itsfood item from the air
Sally-Surface The bird, while in the air, captured its food item from a surface

34
ReflectionSection• Why do youthink the scien-tists selectedsmaller areas to
identify trees instead of thewhole pine forest?
• How do you think the sci-entists knew that the treesin the 12 areas were similarto the trees in the largerpine forest?
ResultsSeventy-eight percent of the
birds foraged in an areabetween 5 and 10 meters fromthe ground (How many yardsis this? See the “Methods”section above to find out howto calculate this). This is theheight where the pine needlesand the broad leaves overlap.Below 5 meters high and clos-er to the ground, the plantsare mostly broad leafed.Above 10 meters, the plantsare mostly pine trees. Most ofthe birds they observed in theCaribbean pine forests were
residents and lived there all ofthe time. The rest were migra-tory (Figure 4). Almost half ofall birds ate insects, and therest ate other kinds of foods(Figure 5).
Even though most of thebirds ate insects, the scientistsfound that the birds used a lotof different foraging behaviorsto capture insects. For exam-ple, birds gleaned (or picked)insects from leaf surfaces, theycaught insects while flying in
the air, and they picked insectsfrom surfaces while they wereflying. Not only did the birdsuse different behaviors to cap-ture insects, they usually cap-tured insects from differentsurfaces or areas. The scien-tists found that the pine forest,with its broad-leafed under-story, provided a variety offood for many different kindsof birds.
Figure 3. Forest with understory and broadleaf/pine overlap.
Ground R Yes No No Gleanwarbler
Palm warbler M No Yes No Glean
Broad-billed R No Yes No Sally-SurfaceTody
Table 2. Example of how the scientists summarized their observations.
Species ofbird
Migrant (M)or Resident (R)
Seen inbroadleafedarea most ofthe time?
Seen in themixedbroadleaf/pine areamost of thetime?
Seen in thepine areamost of thetime?
Most oftenused foragingbehavior

35
Figure 4. Percentage of permanent and migratory birds.
Figure 5. Food sources of birds in the Caribbean pine forest.
ReflectionSection• Name twoexamples ofdiversitydescribed in this
article. Think about thetype of birds, the foods theyeat, how they get their food,and the trees and plantswhere they find food.
• In what ways did diversityhelp the birds?
ImplicationsThroughout North
America, the number of song-bird species is declining. Manyof those songbirds aremigrants that live in the trop-ics during the winter. Thisstudy shows how migrant and
resident birds can live in thesame place at one time. Withthis information, people canmake sure that resident andmigrant birds have the kindsof places in the tropics thatthey need to survive. By pro-viding and protecting theforests that different kinds ofbirds need, people can helpreduce the declining numbersof songbirds in the future.
ReflectionSection• A healthyfood web is bal-anced betweenfood sources
and the animals that eat thefood. Think about insect-eating birds. What wouldhappen to the population ofinsects if the birds were notthere to eat the insects?
• How might protecting sometropical forests help reducethe declining number ofsongbirds in NorthAmerica?
FACTivityThe scientists
found that birdsate three kindsof foods. Thesefoods were 1)
insects, 2) fruits and seeds,and 3) nectar. They also foundthat birds captured their foodin the air, and they gleaned,jumped, and probed for theirfood (See Table 1). In thisFACTivity, you will answerthe question: What kinds ofphysical characteristics might
24%Migrants
76%Residents
49%Insects
24%Nectar
26%Fruits
and seeds

36
different birds have to helpthem capture their food? Hereis the method that you will useto explore the question: Youwill need five large pieces ofplain white paper andcrayons. On each piece ofpaper, design a bird that cap-tures and eats different kindsof foods. Pay careful attentionto the kind of beak, wings,body shape, and legs the birdshould have. You may want todesign your birds in smallgroups, discussing how eachpart of the bird would help itcapture the right kind of food.
Design a—• Bird that gleans and eats
seeds and fruit• Bird that probes into flow-
ers and eats nectar• Bird that captures insects
while flying• Bird that captures insects by
probing into trees• Bird that jumps along the
ground and picks insects offof the ground
After designing your birds,you may want to do someresearch on different birds tolearn about the shape of theirbeaks, the size of their wings,
the shape of their body, andthe length of their legs. Youcan explore different birds byusing a bird identificationbook. Compare what youhave learned with your ownbird designs. What kind ofphysical characteristics dobirds need to capture differentkinds of food?
From Latta, S. C. and Wunderle, J. M. Jr.(1998). The assemblage of birds foragingin native West Indian pine (Pinus occiden-talis) forests of the Dominican Republicduring the nonbreeding season.Biotropica 30(4): 645-656.
Another resource: Bird Beak Buffet:http://saveourlake.org/lessons/chpt2/act5.htm.

Glossary:complexity (käm plek suh te):The state of being complicatedor having many related parts.
latitude (lat uh tood):Distance north or south of theEquator.
diverse (di vürs): Differingfrom one another.
biome (bi om): An area ofEarth with similar plants andanimals because of its climate.
climate (kli met): The averagecondition of the weather at aplace.
adapt (uh dapt): To change soas to fit new conditions.
dense (dens): Having its partsclose together.
land use history (land us histür e): The story of how landhas been used by people overtime.
barren (bear en): Not produc-ing crops, fruit, or many trees.
former (fôr mer): Earlier or inthe past.
native (na tiv): Naturallyoccurring in an area.
habitat (ha ba tat):Environment where a plant oranimal naturally grows andlives.
consensus (kän sen sus):Agreement of all or most.
Pronunciation Guidea as in apeä as in care as in mei as in iceo as in go
ô as in foru as in useü as in furoo as in toolng as in sing
Accented syllables are in bold.
37
Meet Dr. Lugo:I like being a scientist
because it brings me into con-tact with people who, like me,
are fascinated by the complex-ity of nature and have anopportunity to try to figure itout. Then we can put theinformation to work for thebenefit of people.
Thinking AboutScience
Scientistsobserve naturalareas usingmany differenttechniques. One
way to observe natural areasis through photographs. Inthis article, the scientists want-ed to learn about changes in
Some Things WillAlways Change:
Land Use in a Dry Tropical Forest
Dr. Lugo
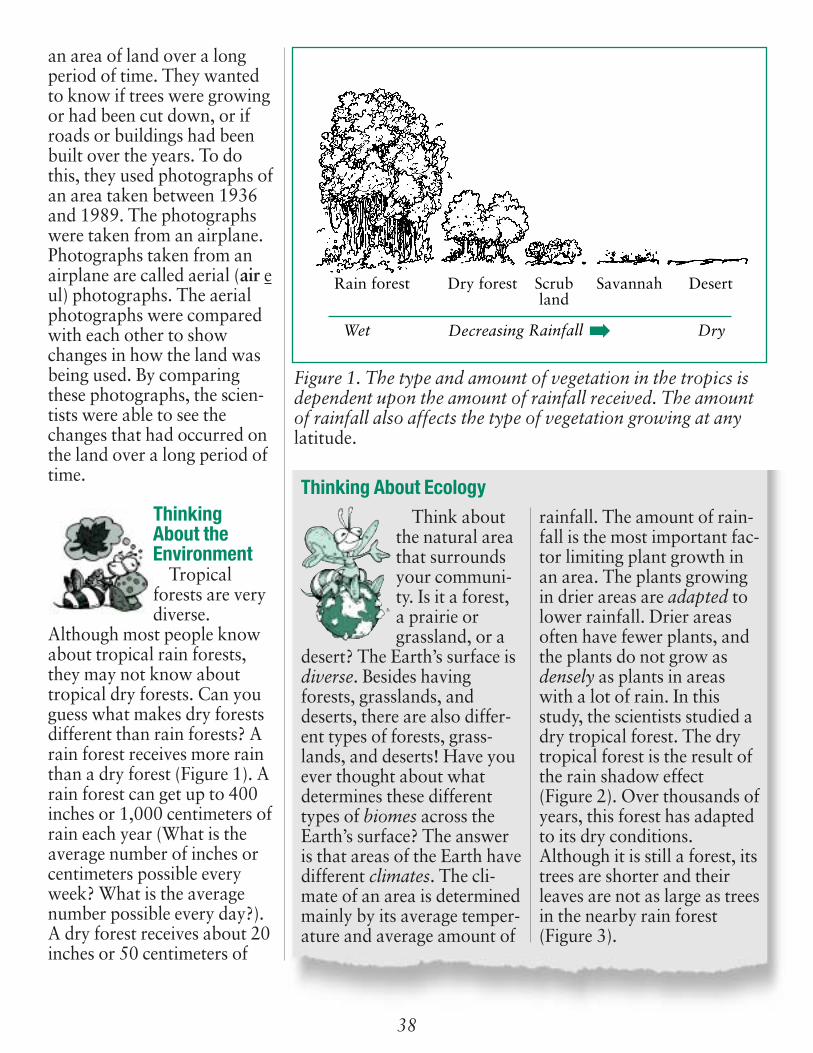
38
an area of land over a longperiod of time. They wantedto know if trees were growingor had been cut down, or ifroads or buildings had beenbuilt over the years. To dothis, they used photographs ofan area taken between 1936and 1989. The photographswere taken from an airplane.Photographs taken from anairplane are called aerial (air eul) photographs. The aerialphotographs were comparedwith each other to showchanges in how the land wasbeing used. By comparingthese photographs, the scien-tists were able to see thechanges that had occurred onthe land over a long period oftime.
Thinking About theEnvironment
Tropicalforests are verydiverse.
Although most people knowabout tropical rain forests,they may not know abouttropical dry forests. Can youguess what makes dry forestsdifferent than rain forests? Arain forest receives more rainthan a dry forest (Figure 1). Arain forest can get up to 400inches or 1,000 centimeters ofrain each year (What is theaverage number of inches orcentimeters possible everyweek? What is the averagenumber possible every day?).A dry forest receives about 20inches or 50 centimeters of
Figure 1. The type and amount of vegetation in the tropics isdependent upon the amount of rainfall received. The amountof rainfall also affects the type of vegetation growing at anylatitude.
Rain forest Dry forest Scrubland
Savannah Desert
Wet Decreasing Rainfall Dry
Think aboutthe natural areathat surroundsyour communi-ty. Is it a forest,a prairie orgrassland, or a
desert? The Earth’s surface isdiverse. Besides havingforests, grasslands, anddeserts, there are also differ-ent types of forests, grass-lands, and deserts! Have youever thought about whatdetermines these differenttypes of biomes across theEarth’s surface? The answeris that areas of the Earth havedifferent climates. The cli-mate of an area is determinedmainly by its average temper-ature and average amount of
Thinking About Ecologyrainfall. The amount of rain-fall is the most important fac-tor limiting plant growth inan area. The plants growingin drier areas are adapted tolower rainfall. Drier areasoften have fewer plants, andthe plants do not grow asdensely as plants in areaswith a lot of rain. In thisstudy, the scientists studied adry tropical forest. The drytropical forest is the result ofthe rain shadow effect(Figure 2). Over thousands ofyears, this forest has adaptedto its dry conditions.Although it is still a forest, itstrees are shorter and theirleaves are not as large as treesin the nearby rain forest(Figure 3).

39
rain each year (What is theaverage number of inches orcentimeters possible everyweek?). For this reason, thetypes of plants and animalsliving in dry forests are differ-ent from those living in rainforests. Trees and animals thatare adapted to drier condi-tions live in tropical dryforests. In this article, you willlearn about a dry forest inPuerto Rico. (Just for fun –What is the average amount ofrainfall your town or areareceives each year?)
IntroductionGuanica (gwa ne kä) Forest
is a tropical dry forest in thesouthwest corner of PuertoRico (Figure 4). In 1981, theUnited Nations recognized itfor being one of the bestexamples of a dry tropical for-est. Before 1919, GuanicaForest was used for agricul-ture and other human activi-ties. In 1919, Guanica Forestbecame legally protected frommost human development.Since 1919, more acres havebeen added to Guanica Forest.Land that had been used in thepast for human activities isnow inside the forest bound-aries. It is mostly protectedfrom development inside theboundaries. The land in andaround Guanica Forest hasbeen changing. The scientistsin this study wanted to knowhow Guanica Forest and theland around it has changedover the years. For example,they wanted to know whetherthe trees have been growingback where crops used to be.
Figure 2. The rain shadow causes some areas to be drier thanothers.
Dry forestRain forest
Prevailingwind
Moistair
rises
Clouds form and release moisture
as rain
Dry air
Rain shadow
Figure 3. Guanica Forest, a dry forest in Puerto Rico.
San Juan
Dry forest Guanica Forest
Direction ofprevailingwind
CaribbeanNational Forest
Cental Mountains
North
Rain forest
Figure 4 – Location of Guanica Forest in Puerto Rico.

40
They were interested in theland use history of GuanicaForest and the surroundingland. You have probablylearned about the history ofyour country, state, or com-monwealth. Land use historyis like your country’s, state’s,or commonwealth’s history,except that it is a history ofhow people used the land.
ReflectionSection• Why do youthink it isimportant tolearn the land
use history of an area?
• Think about the land thatyour home or school wasbuilt on. What do you thinkthe land was used for, orwhat it looked like, beforeyour home or school wasbuilt there?
MethodsBased on aerial photographs
taken in 1936, 1950, 1963,1983, and 1989, the scientistsdetermined how the land wasbeing used over the years.They looked at the pho-tographs of land within theGuanica Forest and outside ofthe forest boundaries. Theysaw that land had been usedfor buildings, roads, and agri-culture. They also saw the nat-ural areas of the forest,including trees, wetlands, andbarren land. The scientists cal-culated the percentage of theforest that was in each catego-ry. The categories included:
• Urban land (with buildings,parking lots, roads, andother structures)
• Agricultural land• Water• Forests • Wetlands• Barren land
ReflectionSection• Why do youthink the scien-tists created cat-egories of landuse?
• Do you think that theamount of agricultural landwithin Guanica Forestincreased or decreased overthe years? Why?
• Do you think that theamount of urban land out-side Guanica Forest
increased or decreased overthe years? Why?
ResultsThe scientists found that
land use had changed over theyears. Although the portion ofurban land within the forestincreased much more thanoutside of the forest, therewere many more hectares ofurban land outside of the for-est (See Figures 5 and 6). Theamount of agricultural landwithin the forest decreasedmuch more than outside of theforest. Overall, urban landincreased and agriculturalland decreased, while theamount of forested landstayed about the same. Figure7 shows some of the actualphotographs used by the sci-entists.
Figure 5. Relative amount of change in land use over timewithin and outside of Guanica Forest.
Perc
ent
chan
ge in
num
bers
of
hect
ares
Percent of increasein land use (above the line)
Withinforest
Outsideforest
Withinforest
Outsideforest
Withinforest
Outsideforest
Percent of decreasein land use (below the line)
Forested
0 1.5
-2
-40
5
36
Urban Agricultural

41
Figure 6. Actual change in number of hectares by land use typewithin and outside of Guanica Forest. A hectare is a metricmeasure equal to 2.47 acres.
Act
ual c
hang
e in
num
bers
of
hec
tare
s
Withinforest
Outsideforest
Withinforest
Outsideforest
Withinforest
Outsideforest
Forested
136
699
3366
1795
31893353
2211
3502
151 4.26 9.460
500
1000
1500
2000
2500
3000
3500
4000
Urban Agricultural1936 – 1989
ReflectionSection• Does the landaround yourhome or schoollook more like a
forest or is it an urban area?What land use changes, ifany, are taking placearound your home orschool?
• Why do you think there ismore urban land outside ofthe Guanica Forest bound-ary compared with insidethe boundary?
ImplicationsThe scientists found that
land use outside of GuanicaForest was changing quickly.Urban uses, such as buildingsand roads, were replacing thenative forest. When nativeforests are removed, animalsthat do not naturally live inthe forest can move into thearea. These non-native ani-mals might gradually moveclose to or over the boundaryof Guanica Forest. Once theydo that, they will competewith the native animals forfood and habitat. An examplein North America is theEuropean starling, a bird thatcompetes with nativeAmerican songbirds. The sci-entists suggest that some ofthe land surrounding the for-est should remain mostlyforested with limited buildingsor other construction (Figure8). That way, non-native ani-mals will not be as likely tomove into Guanica Forest,Figure 7. Aerial photographs showing land use changes over
time in an area outside of Guanica Forest.

42
and the forest’s native animalswill be protected.
ReflectionSection• Do you thinkit is importantto protect thenative animals
in Guanica Forest? Why orwhy not?
• How could the scientistsfind out if non-native ani-mals are competing withnative animals for food?
FACTivityIn this
FACTivity, youwill answer thequestion:Should an area
of land outside of the GuanicaForest boundary be closed toland development? Themethod you will use to answerthis question is by holdingclass discussions. Divide yourclass into three (or five) equal-sized groups of about 6 stu-dents each. One or two groupswill take the position that landoutside of the immediate for-est boundary can and shouldbe developed for human uses.Another group, or two othergroups, will take the positionthat an area of land outside ofthe forest should be left unde-veloped and natural. Each ofthese groups will developthree arguments in support of
their position. You will needto discuss the issue withinyour group before developingyour arguments. Take about20 minutes to develop yourarguments either for oragainst development. Youshould consider the advan-tages of development to peo-ple, as well as thedisadvantages of developmentto the animals and plantswithin the forest. Rememberthat Guanica Forest has beenrecognized by the UnitedNations as one of the bestexamples of a dry tropical for-est. Once you have developedyour arguments, each groupwill present them orally to theremaining group while thewhole class listens. Theremaining group must decide
whether to allow developmentclose to the forest boundary,or whether to create an areaaround the forest that isclosed to human development.The remaining group shouldspend time in advance plan-ning how they will make theirdecision. Will they vote, orwill they try to reach consen-sus? Once a decision is made,the remaining group mustexplain to the class how andwhy they made their decision.
From Lugo, Ariel E.; Ramos, Olga;Molina, Sandra; and Scatena, F. N.(1996). A fifty-three year record of landuse change in the Guanica ForestBiosphere Reserve and Its vicinity. RioPiedras, PR: Institute of Tropical Forestry:USDA Forest Service
For information on dry tropical forests,visit www.mobot.org/gradstudents/olson/drytropics.html
Guanica Forest
Proposedprotected
area
Developedarea outside
of forest
Figure 8. Example of the proposed protected area aroundGuanica forest.

Glossary:scat (skat): Animal fecal drop-ping; animal waste.
sample (sam pool): A part orpiece that shows what thewhole group or thing is like.
represent (rep re zent): To bean example of.
mine (min): To take coal, ores,or other minerals from theEarth by digging a large hole.
natural resources (na cha rôlre sôr sez): A supply of some-thing in nature that takes careof a human need, such as oil.
disperse (di spürs): To scatteror spread in all directions.
defecate (def uh kat): To getrid of waste matter from thebowels.
infertile (in fürt l): Not able toproduce crops, fruit, or off-spring.
complex (käm pleks):Complicated and having manydifferent relationships.
native (na tiv): Naturallyoccurring in an area.
mammal (mam ul): Any warmblooded animal with a back-bone and glands to producemilk for feeding their young.
diversity (duh vür suh te): Thequality of being different orvaried.
germination (jür mi na shun):The act of sprouting or begin-ning to grow.
Pronunciation Guidea as in apeä as in care as in mei as in iceo as in go
ô as in foru as in useü as in furoo as in toolng as in sing
Accented syllables are in bold.
43
Meet Dr. Parrotta: I like being a scientist
because I get to explore andlearn about the natural world.Nature is like a bottomlesstreasure chest, full of surprisesand mysteries. It is fun to tryto unravel those mysteries. Itis important for humans tofind ways to use the gifts ofnature without damaging theenvironment, and also to
repair the damage that wehave already caused.
The Trees HaveGone Batty!
How Bat Scat HelpedRestore a Tropical Forest
Dr. Parrotta

44
Thinking AboutScience
When scien-tists want tolearn what ishappening to aparticular piece
of land, they usually go out tothat place to study what ishappening. Because they usu-ally cannot study every inch ofa large piece of land, scientistsselect small areas, or samplesof land, to study. They assumethat the samples represent therest of the land in which theyare interested. This same ideais used in most scientific stud-ies. For example, when scien-tists want to know what thepublic thinks about some-thing, they cannot ask every-one. They ask a sample ofpeople that the scientistsbelieve can represent every-one. When was the last timeyou used a sample? When youeat a potato chip from a bag,do you think the rest of thechips in the bag will taste like
the first one? Is the first potatochip a sample? Why or whynot?
Thinking About theEnvironment
Humans useland for manythings.
Sometimes, they want to useland temporarily. In this case,they disturb the land, thenthey let it grow naturallyagain. An example of this iswhen humans mine the landfor minerals and other naturalresources. Can you think ofother examples of using natur-al resources that cause a tem-porary disturbance to theland? Sometimes when theland is disturbed, it cannotrestore itself back to its origi-nal condition without helpfrom humans and other ani-mals. In this study, the scien-tists wanted to know whetherhumans and other animalswere helping a tropical forest
to restore itself after it hadbeen disturbed by a miningoperation.
IntroductionThe scientists in this study
were interested in knowingwhether humans and otheranimals can help disturbedareas of land to becomehealthy ecosystems again. Amining company in Brazil(Figure 1) asked the scientiststo restore a tropical forest ontheir old mining site. The orig-inal tropical forest had beencut down to mine the area for
Jamaican Fruit bat.
An ecosystem ismade up of all ofthe plants, ani-mals, bacteria,and nonlivingthings that occurin a particular
environment. When anecosystem is healthy, theplants, animals, and bacteriadepend on each other and onthe nonliving environment to
Thinking About Ecologylive. Some bats, for example,need to eat the fruit of plantsto live. When bats eat fruit,they help to disperse the seedsof plants. Can you think ofhow they might do this? Whenthey eat the fruit, they cannotdigest the seeds. Because theycannot digest the seeds, theyeither defecate or spit out theseeds. They usually defecatesome time after they have
eaten the fruit. By that time,they may have flown awayfrom the tree. The seeds fallonto the ground and begin togrow. You can see that thetrees help the bats by provid-ing food, and the bats help thetrees by dispersing seeds. Thebats and the trees depend oneach other. They are part of ahealthy ecosystem.

45
bauxite (bäk sit) or aluminumore. Bauxite is the main com-pound used in making alu-minum.
Mining disturbs the land byremoving the trees and the toplayer of soil, or topsoil (Figure2). This causes the land to beinfertile. Since there are notrees left on the land, there is
no source of seeds to helptrees grow again. Althoughthe scientists could plant sometrees, they would never beable to create the kind of com-plex ecosystem that includesall of the original plants andanimals. The scientists wantedto know whether they couldset up the conditions so that
plants and animals couldcome in from outside themined area without furtherhuman help. Then, the newplants and animals might helpthe land to become healthyagain.
ReflectionSection• If you werethe scientist,what would youtell people you
are trying to do throughyour research on the oldmining site?
• Although trees are notmobile, their seeds canspread to new areas andgrow. Can you think of twoways that a tree’s seeds canmove from place to place?
MethodsThe scientists covered the
bare ground with new topsoiland planted 70 different kindsof native trees. Although thisseems like a lot of differentkinds of trees, it is not a lot fora tropical forest in Brazil.Brazilian tropical forests canhave thousands of differentkinds of trees! Then, the scien-tists waited 10 years for thetrees to grow. At the end of 10years, the scientists selected 32sample areas to study. Theareas they studied were cir-cles, each 10 meters in diame-ter (To find out how manyyards this is, multiply 10 times1.09).
The scientists went intothese sample areas and identi-fied the kind of trees growing
Mining area
Brazil
AmazonRiver
Brazil is slightly smallerthan the U.S.
North
Figure 1. Location of the study area in Brazil.
Figure 2. The mining site.

46
in each circle. They alsocounted how many of eachkind of tree was growing. Thescientists determined which ofthe trees were over 10 yearsold. The scientists then knewthat the rest of the trees hadgrown on their own over thelast 10 years. The scientistsrecorded the number and kindof birds and mammals theyfound within the sampleareas. They collected all ofthis information by observingand carefully recording every-thing that they saw.
ReflectionSection• Why did thescientists wantto identifywhich trees they
had planted 10 years agoand which trees had grownon their own?
• Why do you think that thescientists wanted to knowthe kind and number ofbirds and mammals withinthe sample areas?
ResultsThe scientists found that the
numbers and kinds of newtrees growing in the sampleareas were different, depend-ing on where the sample areawas located. The sample areasthat were close to the outeredge of the mined area, nearexisting tropical forests, had agreater diversity of tree species(Figure 3). The scientistscounted 125 different kinds oftrees. They also had moretrees growing in them than the
sample areas near the centerof the mined area. The scien-tists found 45 different kindsof birds in the sample areas.Of these, less than half wouldhave been able to successfullydisperse seeds. That is becausemost of the birds ate insects or
nectar, or would have beenable to digest the seeds.(Think of parrots and para-keets. They eat and digestseeds, so they would not begood at dispersing seeds!)
Average tree diversity (variety of tree species) in plantedareas at different distances from the existing rain forest
0 100 200 300 400 500 600 700Distance of study sites from rain forest edge (meters)
Div
ersi
ty (
vari
ety)
of t
ree
spec
ies
Extremely diverse
Highly diverse
Moderately diverse
Limited in diversity
Very limited in diversity
Figure 3. The amount of tree diversity at different distancesfrom the rain forest.
Figure 4. The relationship of the planted forest to the existingrain forest.
Rain Forest
RainForest
Planted Trees(Old mining
area)
Fewer bats
More bats

47
The scientists found that alot of different kinds of mam-mals lived in the sample areas.The most numerous kind ofmammal found in the sampleplots was fruit bats. Therewere more bats in the sampleareas closer to the edge of themined area than in sampleareas closer to the center(Figure 4). Although there wasnot a great diversity of differ-ent kinds of bats, there was alarge number of fruit bats liv-
ing in the sample areas.Figures 5 and 6 show howvegetation began growing onthe old mining site.
ReflectionSection• Where thescientists founda diversity ofnew kinds of
trees growing, they alsofound a large number offruit bats. If you were the
scientist, what would youconclude from this informa-tion?
• Why do you think thatthere were more bats andmore kinds of new treesnear the edges of the oldmining area, and fewer batsand fewer kinds of treesnear the center?
ImplicationsThe scientists concluded
that by planting a variety oftrees on an old mining site,nature can take over and helpthe land to become a healthyecosystem. The scientistsbelieve that by planting thetrees, they started a processthat might have taken decadesor centuries to happen on itsown. Once they planted thetrees, animals were able tomove into the young tropicalforest. When bats arrived, theydefecated seeds eaten fromfruit trees outside of the minedarea. The bats helped to makethe young tropical forest morediverse, which provided morefood for other kinds of ani-mals. After humans have dis-turbed land, they might haveto help restore the environ-ment to a healthy condition.Usually if humans lend a help-ing hand in the beginning,nature can take over the job.
ReflectionSection• Do you thinkthat it is best tolet nature takeover the job of
restoring an ecosystem to a
Figures 5 and 6. The recovering mining site. The roads you cansee throughout the area are for transporting soil and seedlings.Eventually, these roads will grow naturally with vegetationand the entire area will become a forest again.
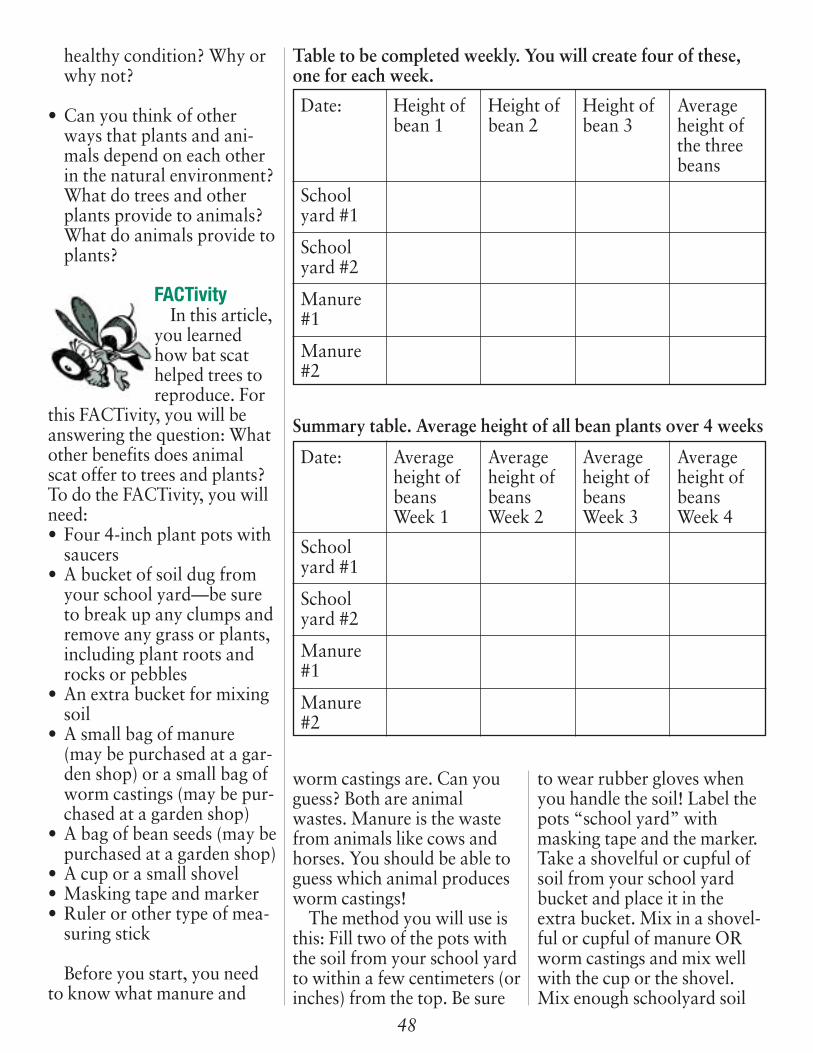
48
Table to be completed weekly. You will create four of these,one for each week.
Date: Height ofbean 1
Height ofbean 2
Height ofbean 3
Averageheight ofthe threebeans
Schoolyard #1
Schoolyard #2
Manure#1
Manure#2
Summary table. Average height of all bean plants over 4 weeks
Date: Averageheight ofbeans Week 1
Averageheight ofbeansWeek 2
Averageheight ofbeansWeek 3
Averageheight ofbeansWeek 4
Schoolyard #1
Schoolyard #2
Manure#1
Manure#2
healthy condition? Why orwhy not?
• Can you think of otherways that plants and ani-mals depend on each otherin the natural environment?What do trees and otherplants provide to animals?What do animals provide toplants?
FACTivityIn this article,
you learnedhow bat scathelped trees toreproduce. For
this FACTivity, you will beanswering the question: Whatother benefits does animalscat offer to trees and plants?To do the FACTivity, you willneed:• Four 4-inch plant pots with
saucers• A bucket of soil dug from
your school yard—be sureto break up any clumps andremove any grass or plants,including plant roots androcks or pebbles
• An extra bucket for mixingsoil
• A small bag of manure(may be purchased at a gar-den shop) or a small bag ofworm castings (may be pur-chased at a garden shop)
• A bag of bean seeds (may bepurchased at a garden shop)
• A cup or a small shovel• Masking tape and marker• Ruler or other type of mea-
suring stick
Before you start, you needto know what manure and
worm castings are. Can youguess? Both are animalwastes. Manure is the wastefrom animals like cows andhorses. You should be able toguess which animal producesworm castings!
The method you will use isthis: Fill two of the pots withthe soil from your school yardto within a few centimeters (orinches) from the top. Be sure
to wear rubber gloves whenyou handle the soil! Label thepots “school yard” withmasking tape and the marker.Take a shovelful or cupful ofsoil from your school yardbucket and place it in theextra bucket. Mix in a shovel-ful or cupful of manure ORworm castings and mix wellwith the cup or the shovel.Mix enough schoolyard soil

49
and manure (or worm cast-ings) to fill the next two potsto within a few centimeters (orinches) of the top. Label thepots “manure” or “wormcastings” using the maskingtape and marker. Make threethumbprints about 2 centime-ters deep (or about 1 inchdeep) in each pot. Space thethumbprints so that they forma triangle. Place one seed ineach thumbprint. Cover theseeds with soil from the potand gently water.
Put the pots in a sunny win-dow and keep the soil moist.Do not over water! Observethe pots every day for 4weeks. You can use the charton the previous page as anexample. At the end of eachweek, measure the growth ofthe beans. Keep a weeklyrecord of your observations.You will need to calculate theaverage height of the beans ineach pot. To calculate theaverage, add the height of thethree bean plants and dividethe total height by three. Youcan easily compare your databy creating a bar chart (or his-togram). To learn how to cre-ate a bar chart, see theexample at the bottom right.Which kind of soil is best forseed germination and growth?Think about what you learnedin this article. Bats helpedtrees to reproduce by spread-ing tree seeds through batscat. What other benefits doesanimal scat offer to plants?This experiment should helpyou answer this question.
Sample bar chart: Average height of beans over 4 weeks.(Create this bar chart from the summary table on theprevious page. See the example that follows.)
5
4
3
2
1
0
Average height of beans in centimeters or inches
Week 1 2 3 4School yard
#1
1 2 3 41 2 3 41 2 3 4School yard
#2Manure
#1Manure
#2
Example bar chart: Average height of beans over 4 weeks.
5
4
3
2
1
0
Average height of beans in inches
Week 1 2 3 4School yard
#1
1 2 3 41 2 3 41 2 3 4School yard
#2Manure
#1Manure
#2
From Parrotta, John A., Knowles, Oliver Henry, and Wunderle, Joseph M. Jr. (1997).Development of floristic diversity in 10-year-old restoration forests on a bauxite minedsite in Amazonia. Forestry Ecology and Management. 99: 21-42.
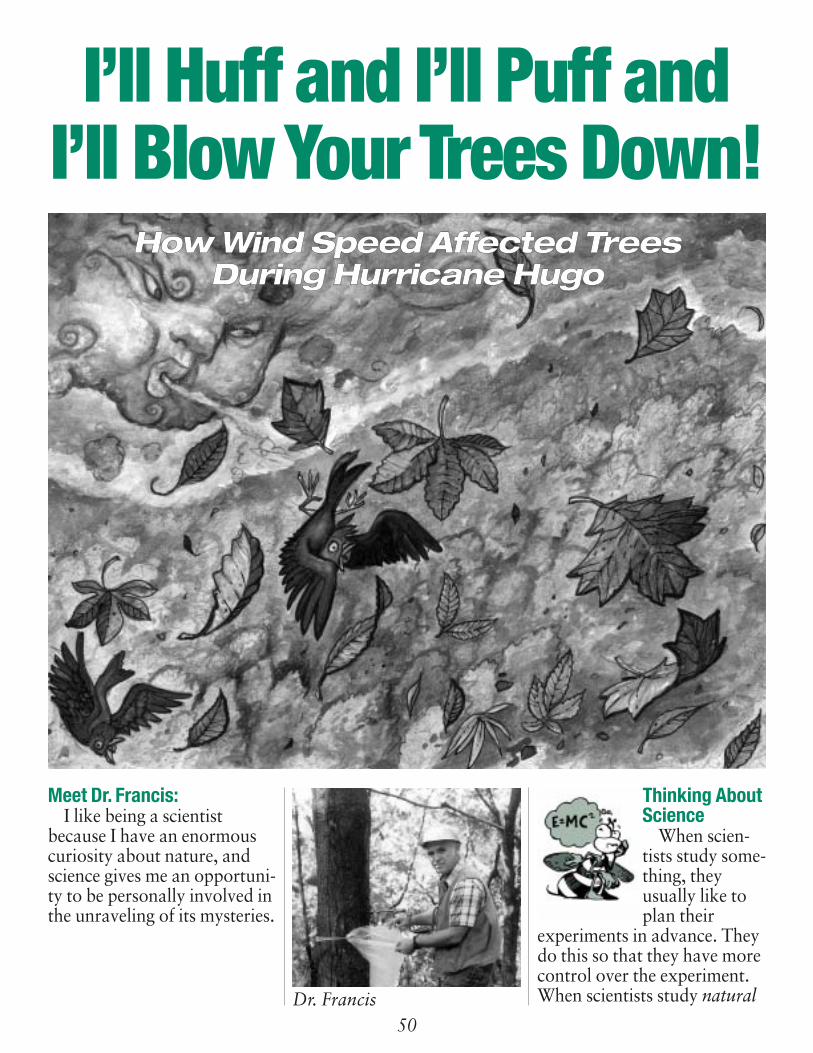
50
Meet Dr. Francis:I like being a scientist
because I have an enormouscuriosity about nature, andscience gives me an opportuni-ty to be personally involved inthe unraveling of its mysteries.
Thinking AboutScience
When scien-tists study some-thing, theyusually like toplan their
experiments in advance. Theydo this so that they have morecontrol over the experiment.When scientists study natural
I’ll Huff and I’ll Puff andI’ll Blow Your Trees Down!
HHooww WWiinndd SSppeeeedd AAffffeecctteedd TTrreeeess DDuurriinngg HHuurrrriiccaannee HHuuggoo
Dr. Francis

51
disasters, they cannot alwaysplan their experiments. This isbecause people do not alwaysknow when or where a natur-al disaster will occur. Naturaldisasters include events likehurricanes, tornadoes, land-slides, volcanoes, and floods.The scientists in this studywanted to study the effects ofa hurricane. As part of theirresearch, they needed to know
the wind speed of the hurri-cane as it blew across differentplaces. Because they did notknow where or when the hur-ricane would blow, they hadto rely on measurements madeby other people. You can seethat scientists sometimes haveto use data collected by otherpeople. Can you think ofexamples of when you have todo the same thing? (Hint:Think about the weather fore-cast or about medical infor-mation. What other differentkinds of information do youuse that are collected by otherpeople?)
Thinking About theEnvironment
In nature,some events arecyclical. The
seasons are an example of acyclical natural event becausethey repeat themselves everyyear. Day and night are alsoexamples of a cyclical eventbecause they are repeateddaily. Can you think of othercyclical events that are pre-dictable? Cyclical events hap-pen in nature all of the time.Some cycles are not as exact asother cycles. Hurricanes, forexample, are cyclical becausethey occur in the tropics everyyear between June andNovember. However, we donot know exactly what day ahurricane will occur duringthat time. Can you think ofother cyclical events that arenot as easily predictable?
Glossary:natural disaster (nach ur uldi zas tür): A natural happen-ing that causes much damageor suffering.
data (da tuh): Factual ormeasurement information.
cyclical (sik lik ool): Like acycle; when events continueto happen in the same order.
predictable (pre dik tüh bül):Easy to tell what one thinkswill happen in the future.
feedback (fed bak): Aresponse, often one that setsa process in motion. Theresponse can then also beaffected by the process it setin motion.
species (spe sez): Groups oforganisms that resemble oneanother in appearance,behavior, chemical processes,and genetic structure.
compacted (käm pak ted):Closely and firmly packedtogether.
analyze (an ä liz): To studyor examine carefully.
modify (mäd uh fi) To makea small change in.
Pronunciation Guidea as in apeä as in care as in mei as in iceo as in go
ô as in foru as in useü as in furoo as in toolng as in sing
Accented syllables are in bold.
Thinking About Ecology
In the naturalworld, feed-back and control areimportant prin-ciples to under-stand.
Feedback is a response tosomething that occurs, andits result is usually somekind of control on the sys-tem. Feedback can be posi-tive as when it accelerates(ak sel ür ats) a process, ornegative when it slowsdown a process. In thisstudy of hurricane damage,feedback was provided bytrees. In response to the hur-ricane’s strong winds, thetrees shed their leaves. Oncethe trees lost their leaves,the hurricane’s winds couldno longer do much moredamage to the trees. Thisprovided some control bylimiting how much moredamage the wind could doto the trees. Can you thinkof examples of feedbackand control in your ownbody?

52
IntroductionWhen a hurricane occurs, a
lot of damage can be done tobuildings and other structures.One of the most visible typesof damage occurs to trees.When hurricanes occur, treeslose most of their leaves. Thescientists in this study wantedto know more about theextent of damage to trees fol-lowing a tropical hurricane inPuerto Rico (Figure 1). WhenHurricane Hugo occurred inSeptember of 1989, the scien-tists decided to study the dam-age done to the trees in PuertoRico (Figure 2). HurricaneHugo was a category 4 hurri-cane (Table 1).
Caribbean hurricanes areformed at the West Africacoast. Atmospheric conditionspush hurricanes to the islandsin the Caribbean Sea and upthe east coast of the UnitedStates (Figure 3).
ReflectionSection• The scientistsknew that over-all, HurricaneHugo had
winds of between 131-155mph (210-249 kph). Whydo you think they wantedto measure wind speed atdifferent places in PuertoRico?
• Do you think that hurricanedamage to a tree with leavesis greater than to a tree with-out leaves? Why or why not?
MethodThe scientists wanted to
understand how much treedamage was done by the
North
Gulf of Mexico
Atlantic Ocean
Brazil
CostaRica
U.S. Virgin Islands
Puerto Rico
Dominican Republic
United States
Caribbean Sea
Figure 1. Location of Puerto Rico
Figure 2. Tree damage following Hurricane Hugo.
Category Wind speed
1 74-95 mph/119-153 kph
2 96-110 mph/154-177 kph
3 111-130 mph/178-209 kph
4 131-155 mph/210-249 kph
5 156+ mph/250+ kph
Table 1. Saffir-SimpsonHurricane Scale
Note: If you want to convert miles perhour (mph) to kilometers per hour(kph), multiply the number of mph X1.61. To convert from kph to mph,multiply the number of kph X .621.

53
hurricane at different windspeeds. To do this, they had tostudy the trees in areas wherewind instruments were placedbefore Hurricane Hugooccurred. The scientistsobserved 81 different speciesof trees in 18 different areas.They observed damage to1,226 trees. The scientists puteach of the trees in one of five
categories, based on howmuch damage they observed.They then compared palmtrees with broad-leafed trees,to determine whether one kindof tree had more damage thanthe other (Figure 4). For thepalms and the broad-leafedtrees, they compared theamount of damage with thewind speed.
ReflectionSection• Why did thescientists studytrees that werelocated near
wind instruments?
• Look at the leaf shapes inFigure 4. Do you think thescientists found a differencein damage to trees with dif-ferent kinds of leaves? Whyor why not?
ResultsThe scientists found out
many things about the harmdone to trees duringHurricane Hugo. First, theyfound that larger trees hadmore damage than smallertrees. They also found thatpalm trees had less damagethan broad-leafed trees. Theyalso discovered that afterbroad-leafed trees lose theirleaves to the wind, there is lessdamage to the trees. Up to apoint, the hurricane’s windscontinued to do more damageas they blew faster. However,when the wind blew over 100kph (multiply 100 by .621 tofind out how fast this is inmiles per hour), it did not domuch more damage (Figure5). By then, most of the leaveshad blown off of the trees.
ReflectionSection• Why do youthink the palmtrees had lessdamage than
the broad-leafed trees?
PuertoRico
...and may becomehurricanes in theCaribbean and along the east coast of North America
Storms formoff of theAfrican coast...
Africa
SouthAmerica
NorthAmerica
AtlanticOcean
North
Figure 3. Tropical hurricanes in eastern North America beginas tropical storms on the west African coast.
Figure 4. Palm and broad-leafed trees.
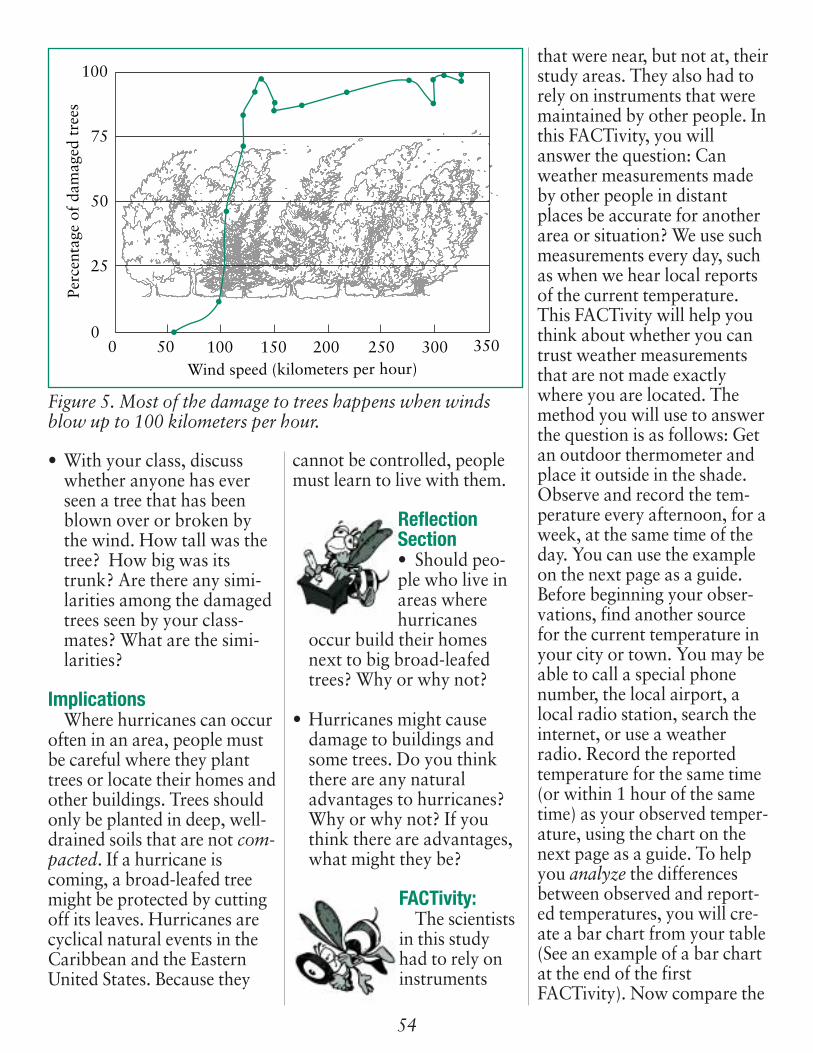
54
• With your class, discusswhether anyone has everseen a tree that has beenblown over or broken bythe wind. How tall was thetree? How big was itstrunk? Are there any simi-larities among the damagedtrees seen by your class-mates? What are the simi-larities?
ImplicationsWhere hurricanes can occur
often in an area, people mustbe careful where they planttrees or locate their homes andother buildings. Trees shouldonly be planted in deep, well-drained soils that are not com-pacted. If a hurricane iscoming, a broad-leafed treemight be protected by cuttingoff its leaves. Hurricanes arecyclical natural events in theCaribbean and the EasternUnited States. Because they
cannot be controlled, peoplemust learn to live with them.
ReflectionSection• Should peo-ple who live inareas wherehurricanes
occur build their homesnext to big broad-leafedtrees? Why or why not?
• Hurricanes might causedamage to buildings andsome trees. Do you thinkthere are any naturaladvantages to hurricanes?Why or why not? If youthink there are advantages,what might they be?
FACTivity:The scientists
in this studyhad to rely oninstruments
Figure 5. Most of the damage to trees happens when windsblow up to 100 kilometers per hour.
0 50 100 150 200 250 300 350
100
75
50
25
0
Wind speed (kilometers per hour)
Perc
enta
ge o
f da
mag
ed t
rees
that were near, but not at, theirstudy areas. They also had torely on instruments that weremaintained by other people. Inthis FACTivity, you willanswer the question: Canweather measurements madeby other people in distantplaces be accurate for anotherarea or situation? We use suchmeasurements every day, suchas when we hear local reportsof the current temperature.This FACTivity will help youthink about whether you cantrust weather measurementsthat are not made exactlywhere you are located. Themethod you will use to answerthe question is as follows: Getan outdoor thermometer andplace it outside in the shade.Observe and record the tem-perature every afternoon, for aweek, at the same time of theday. You can use the exampleon the next page as a guide.Before beginning your obser-vations, find another sourcefor the current temperature inyour city or town. You may beable to call a special phonenumber, the local airport, alocal radio station, search theinternet, or use a weatherradio. Record the reportedtemperature for the same time(or within 1 hour of the sametime) as your observed temper-ature, using the chart on thenext page as a guide. To helpyou analyze the differencesbetween observed and report-ed temperatures, you will cre-ate a bar chart from your table(See an example of a bar chartat the end of the firstFACTivity). Now compare the

55
Sample chart for recording temperatures.
Observed Temperature(F or C)
Reported Temperature(F or C)
Monday Tuesday Wednesday Thursday Friday
Observed Reported Observed Reported Observed Reported Observed Reported Observed Reported
Sample bar chart (histogram) for analyzing temperatures.
Temperature (Specify F or C) in one degree increments
Monday Tuesday Wednesday Thursday Friday
temperature you observed onyour thermometer with thereported temperature. Are thetwo daily temperatures thesame or different? Do youthink the reported tempera-ture is an adequate measure ofthe temperature at yourschool? Why or why not?
You may also record theobserved and reported tem-perature at different timesthroughout the day for theweek. The more observationsyou have to compare, themore accurate your findingswill be. If your findings aremore accurate, will you havemore or less confidence inyour answer to the FACTivityquestion? Why?
Convert your temperaturesfrom Centigrade to Fahrenheitor from Fahrenheit toCentigrade. Then make a newbar chart using the convertedmeasurements. Compare thebar charts. How are they simi-lar? How are they different?This is how you do the con-version:
If you know Fahrenheit:Subtract 32 from the tempera-ture, then multiply by .55
If you know Centigrade:Multiply the temperature by1.8, then add 32
Observed Reported Observed Reported Observed Reported Observed Reported Observed Reported
Example of a bar chart
Temperature in °F
Monday Tuesday Wednesday Thursday Friday
66°
59°
60°
61°
62°
63°
64°
65°
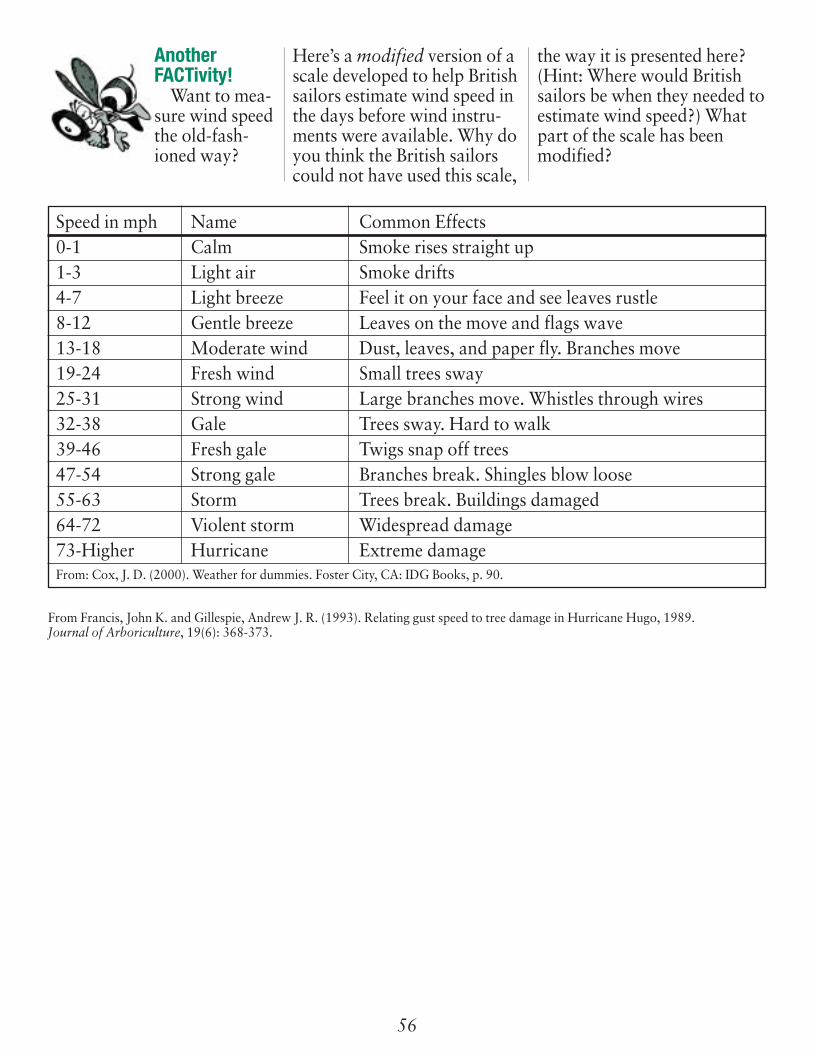
56
Speed in mph Name Common Effects0-1 Calm Smoke rises straight up1-3 Light air Smoke drifts4-7 Light breeze Feel it on your face and see leaves rustle8-12 Gentle breeze Leaves on the move and flags wave13-18 Moderate wind Dust, leaves, and paper fly. Branches move19-24 Fresh wind Small trees sway25-31 Strong wind Large branches move. Whistles through wires32-38 Gale Trees sway. Hard to walk39-46 Fresh gale Twigs snap off trees47-54 Strong gale Branches break. Shingles blow loose55-63 Storm Trees break. Buildings damaged64-72 Violent storm Widespread damage73-Higher Hurricane Extreme damageFrom: Cox, J. D. (2000). Weather for dummies. Foster City, CA: IDG Books, p. 90.
AnotherFACTivity!
Want to mea-sure wind speedthe old-fash-ioned way?
Here’s a modified version of ascale developed to help Britishsailors estimate wind speed inthe days before wind instru-ments were available. Why doyou think the British sailorscould not have used this scale,
the way it is presented here?(Hint: Where would Britishsailors be when they needed toestimate wind speed?) Whatpart of the scale has beenmodified?
From Francis, John K. and Gillespie, Andrew J. R. (1993). Relating gust speed to tree damage in Hurricane Hugo, 1989.Journal of Arboriculture, 19(6): 368-373.

Which National Science Education Standards* Can Be Met by the Natural Inquirer?
Science EducationStandards*
Science as Inquiry
Abilities Necessary for Scientific Inquiry X X X X X X X X
Physical Science
Properties of Matter X
Transfer of Energy X X X
Life Science
Structure & Function of Living Systems X X X X
Reproduction & Heredity X X
Regulation & Behavior X X X
Populations & Ecosystems X X X X X X X
Organism Diversity & Adaptation X X X
Earth & Space Science
Structure of Earth System X X X X
Earth in the Solar System X X
Science & Technology
Nature of Technological Solutions X X
Tradeoffs of Technology X
Benefits and Consequences X X
Science–Personal & Social Perspectives
Personal Health X X
Natural Hazards X X
Risks & Benefits X X X
Science & Technology in Society X X
History & Nature of Science
Science as a Human Endeavor X X X
Nature of Science X X
Swim
min
gU
pstr
eam
Wit
hout
a L
adde
r
Lea
f Me
Alo
ne!
Ooo
ooh!
Tha
t’sG
row
th!
It’s
a G
as!
Plea
se J
oin
Us
for
Din
ner
Som
e T
hing
s W
illA
lway
s C
hang
e
The
Tre
es A
reG
oing
Bat
ty!
I’ll
Huf
f and
I’ll
Puff
and
I’ll
Blo
w Y
our
Tre
es D
own!
*National Research Council, Content Standards, Grades 5-8
Articles

The Forest Service is part ofthe Federal Government. It ismade up of thousands of peo-ple who care for the Nation’sforest land. The ForestService manages over 150national forests and almost20 national grasslands. Theseare large areas of trees,streams, and grasslands.National forests are similar insome ways to national parks.Both national forests andnational parks provide cleanwater, homes for animals thatlive in the wild, and places forpeople to do fun things in theoutdoors. National forestsalso provide resources forpeople to use, such as treesfor lumber, minerals, and
plants used for medicines.Some people in the ForestService are scientists, whosework is presented in this jour-nal. Forest Service scientistswork to solve problems andprovide new informationabout natural resources sothat we can make sure ournatural environment ishealthy, now and into thefuture.
The U.S. Department ofAgriculture (USDA) prohibits dis-crimination in all its programs andactivities on the basis of race, color,national origin, sex, religion, age,disability, political beliefs, sexualorientation, or marital or familystatus. (Not all prohibited basesapply to all programs.) Personswith disabilities who require alter-
native means for communicationof program information (Braille,large print, audiotape, etc.) shouldcontact USDA’s TARGET Centerat (202) 720-2600 (voice andTDD).
To file a complaint of discrimi-nation, write USDA, Director,Office of Civil Rights, Room 326-W, Whitten Building, 1400Independence Avenue, SW,Washington, D.C. 20250-9410 orcall (202) 720-5964 (voice andTDD). USDA is an equal opportu-nity provider and employer.
What Is the Forest Service?
United States Department of Agriculture
Forest Service
Visit these Web sites for more information:
USDA Forest Service:http://www.fs.fed.us
The Natural Inquirer:http://www.naturalinquirer.usda.gov
Conservation Education:http://www.fs.fed.us/outdoors/nrce/
USDA Kid’s Page:http://www.usda.gov/news/usdakids/index.html
NatureWatch:http://www.fs.fed.us/outdoors/naturewatch/default.htm
Woodsy Owl:http://www.fs.fed.us/spf/woodsy
Smokey Bear:http://www.smokeybear.com
National Forest Information:http://www.fs.fed.us/links/forests/html
National Forest Recreation:http://www.fs.fed.us/recreation/recreation.html
International Institute of Tropical Forestry:http://www.fs.fed.us/global/iitf
FS-726 • December 2001