page | 1 · what is google analytics ? google analytics is a cloud-based analytics tool that...
TRANSCRIPT
Page | 1
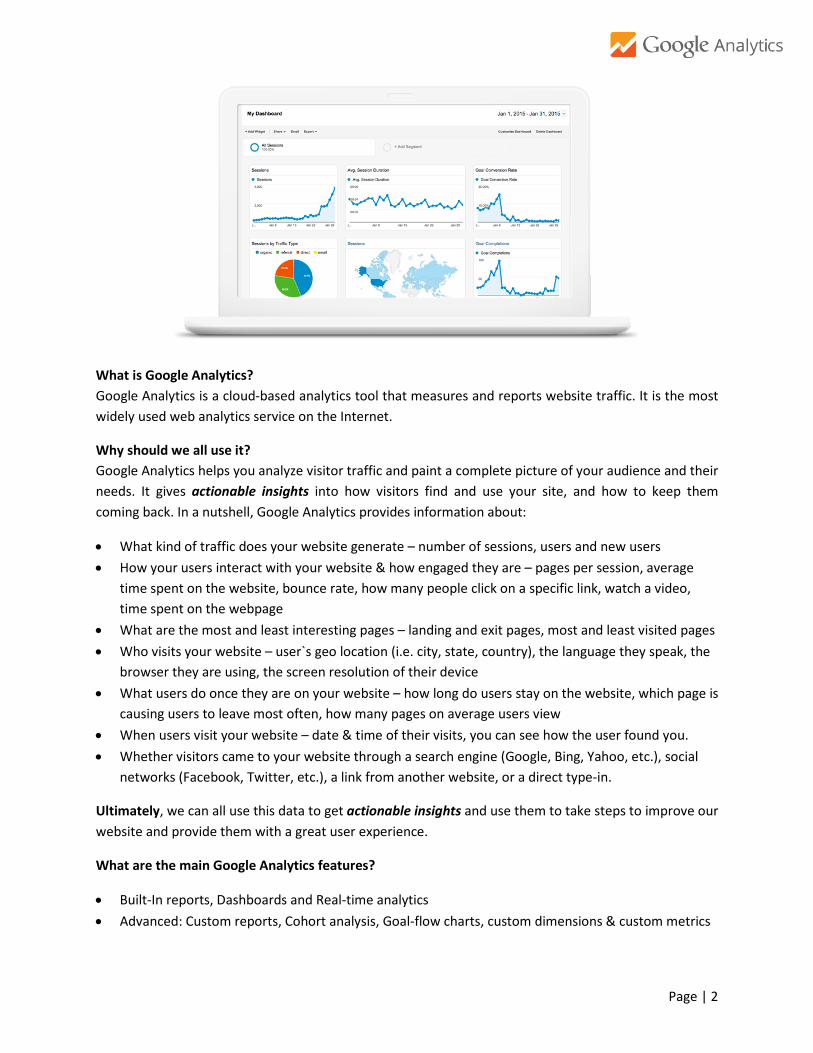
What is Google Analytics? Google Analytics is a cloud-based analytics tool that measures and reports website traffic. It is the most widely used web analytics service on the Internet.
Why should we all use it? Google Analytics helps you analyze visitor traffic and paint a complete picture of your audience and their needs. It gives actionable insights into how visitors find and use your site, and how to keep them coming back. In a nutshell, Google Analytics provides information about:
• What kind of traffic does your website generate – number of sessions, users and new users• How your users interact with your website & how engaged they are – pages per session, average
time spent on the website, bounce rate, how many people click on a specific link, watch a video,time spent on the webpage
• What are the most and least interesting pages – landing and exit pages, most and least visited pages• Who visits your website – user`s geo location (i.e. city, state, country), the language they speak, the
browser they are using, the screen resolution of their device• What users do once they are on your website – how long do users stay on the website, which page is
causing users to leave most often, how many pages on average users view• When users visit your website – date & time of their visits, you can see how the user found you.• Whether visitors came to your website through a search engine (Google, Bing, Yahoo, etc.), social
networks (Facebook, Twitter, etc.), a link from another website, or a direct type-in.
Ultimately, we can all use this data to get actionable insights and use them to take steps to improve our website and provide them with a great user experience.
What are the main Google Analytics features?
• Built-In reports, Dashboards and Real-time analytics• Advanced: Custom reports, Cohort analysis, Goal-flow charts, custom dimensions & custom metrics
Page | 2
How to use Google Analytics?
1. Create a Gmail account – to be able to use Google Analytics, you will need to have a Google account.Click here to create one
2. Once created the account, send me your newly created Gmail account [email protected] and I will grant you access to Google analytics for your website.
3. You will receive an email from [email protected] with a subject line:You have been granted access to a property in Google Analytics accountFollow the instructions in the email (i.e. click on the link provided in the email)
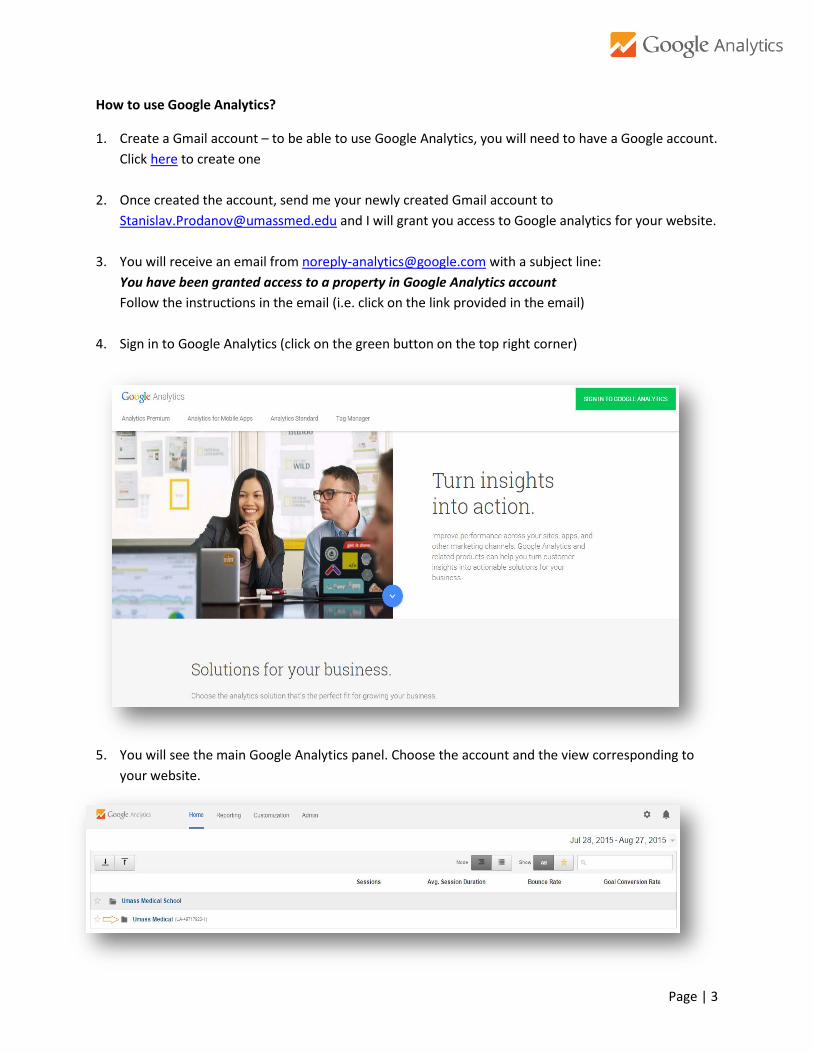
4. Sign in to Google Analytics (click on the green button on the top right corner)
5. You will see the main Google Analytics panel. Choose the account and the view corresponding toyour website.
Page | 3
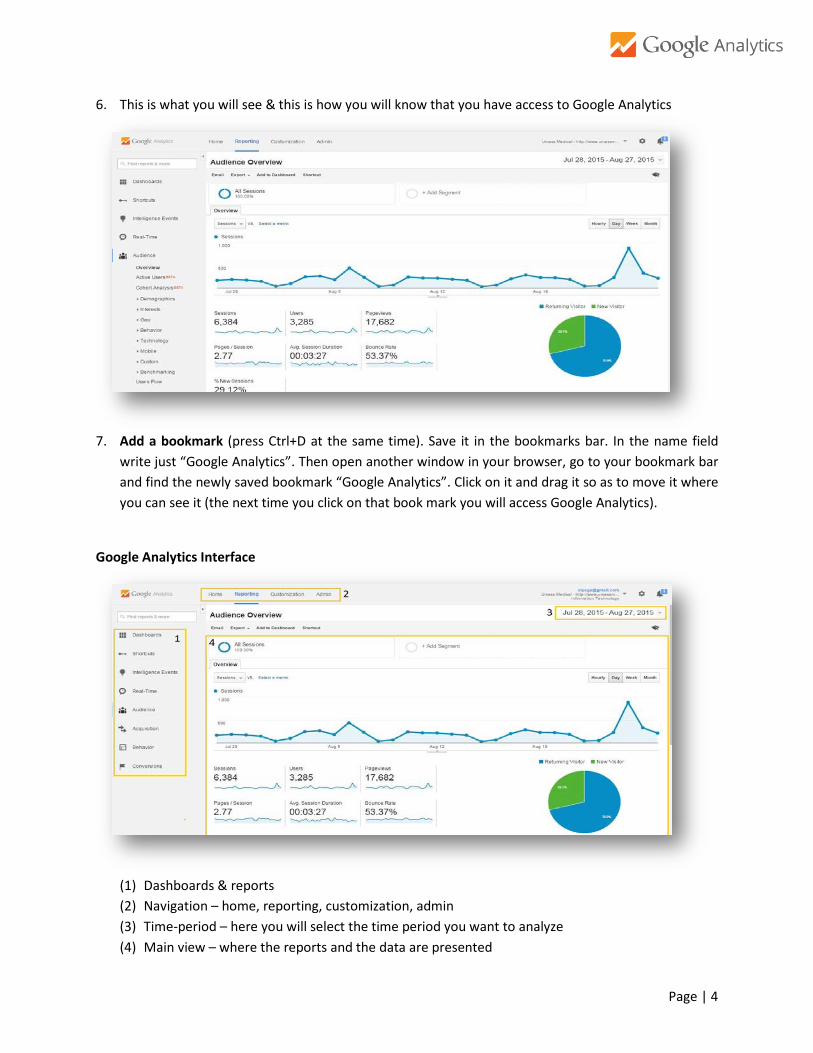
6. This is what you will see & this is how you will know that you have access to Google Analytics
7. Add a bookmark (press Ctrl+D at the same time). Save it in the bookmarks bar. In the name fieldwrite just “Google Analytics”. Then open another window in your browser, go to your bookmark barand find the newly saved bookmark “Google Analytics”. Click on it and drag it so as to move it whereyou can see it (the next time you click on that book mark you will access Google Analytics).
Google Analytics Interface
(1) Dashboards & reports(2) Navigation – home, reporting, customization, admin(3) Time-period – here you will select the time period you want to analyze(4) Main view – where the reports and the data are presented
Page | 4
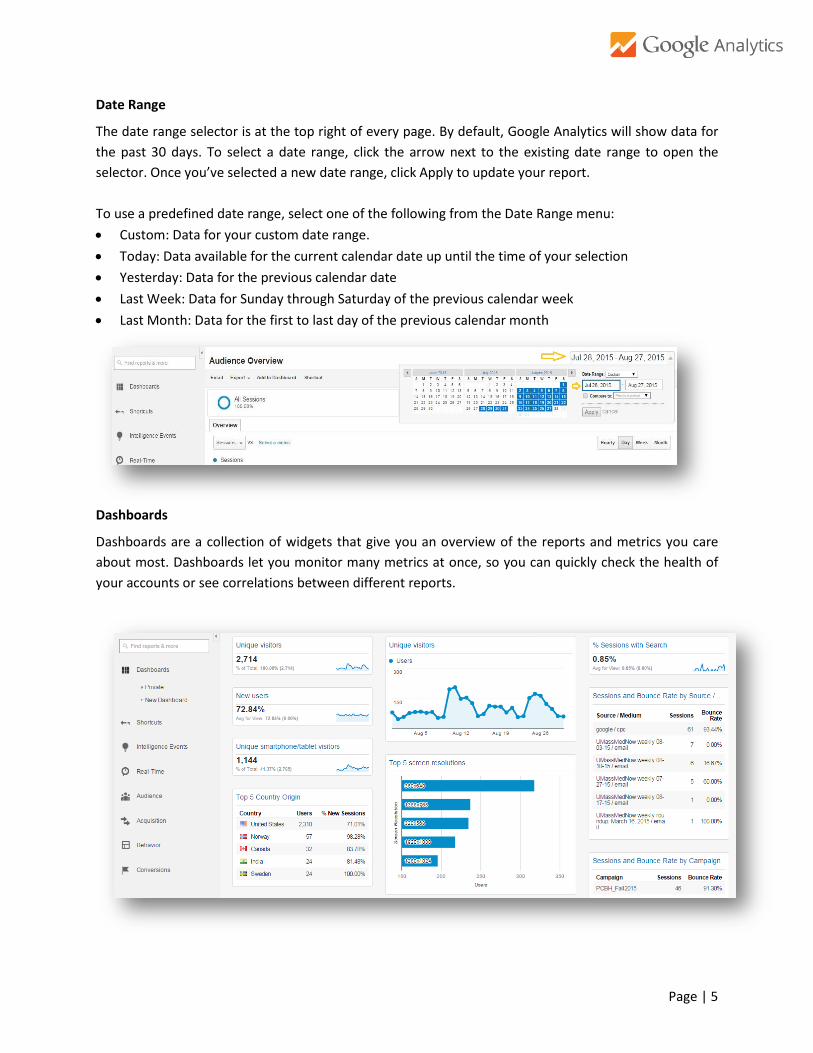
Date Range
The date range selector is at the top right of every page. By default, Google Analytics will show data for the past 30 days. To select a date range, click the arrow next to the existing date range to open the selector. Once you’ve selected a new date range, click Apply to update your report. To use a predefined date range, select one of the following from the Date Range menu: • Custom: Data for your custom date range. • Today: Data available for the current calendar date up until the time of your selection • Yesterday: Data for the previous calendar date • Last Week: Data for Sunday through Saturday of the previous calendar week • Last Month: Data for the first to last day of the previous calendar month
Dashboards
Dashboards are a collection of widgets that give you an overview of the reports and metrics you care about most. Dashboards let you monitor many metrics at once, so you can quickly check the health of your accounts or see correlations between different reports.
Page | 5
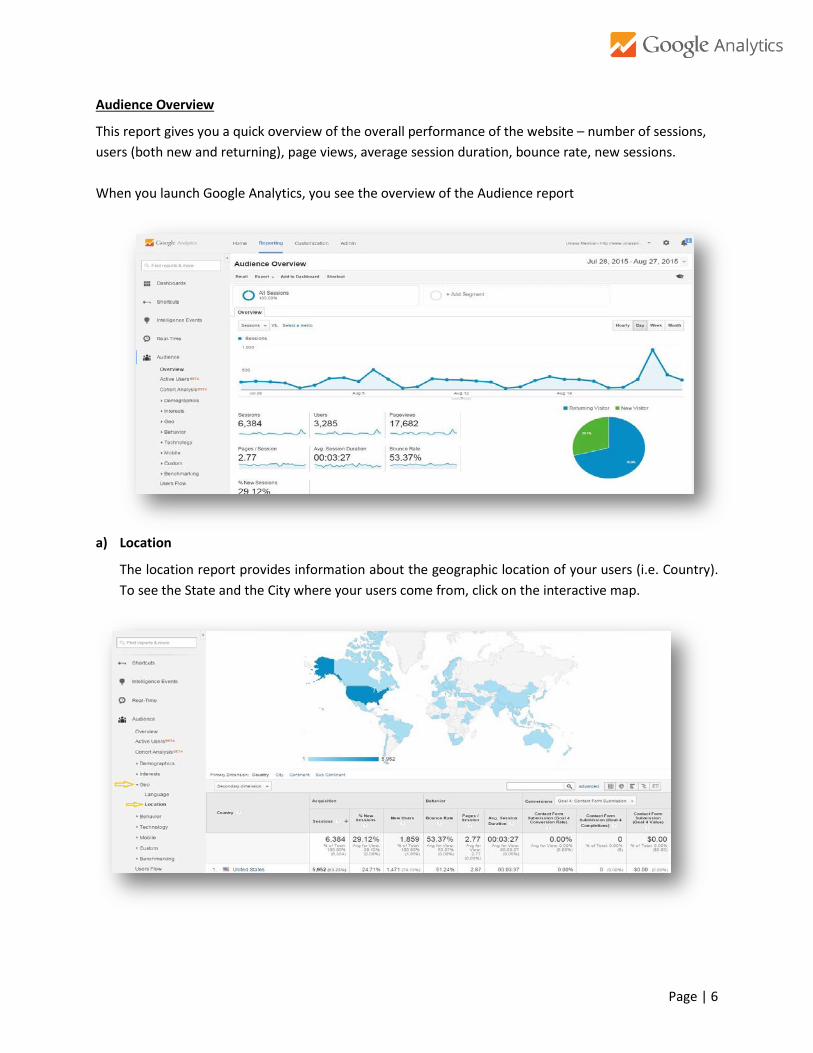
Audience Overview
This report gives you a quick overview of the overall performance of the website – number of sessions, users (both new and returning), page views, average session duration, bounce rate, new sessions. When you launch Google Analytics, you see the overview of the Audience report
a) Location
The location report provides information about the geographic location of your users (i.e. Country). To see the State and the City where your users come from, click on the interactive map.
Page | 6
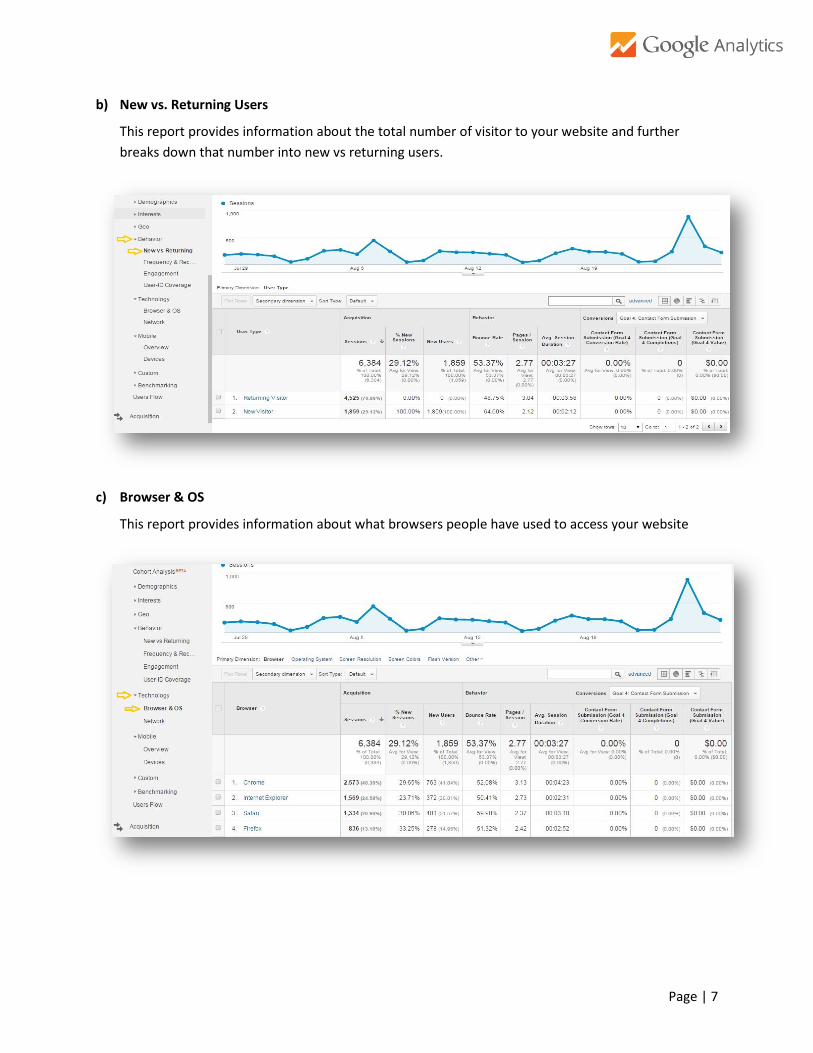
b) New vs. Returning Users
This report provides information about the total number of visitor to your website and further breaks down that number into new vs returning users.
c) Browser & OS
This report provides information about what browsers people have used to access your website
Page | 7
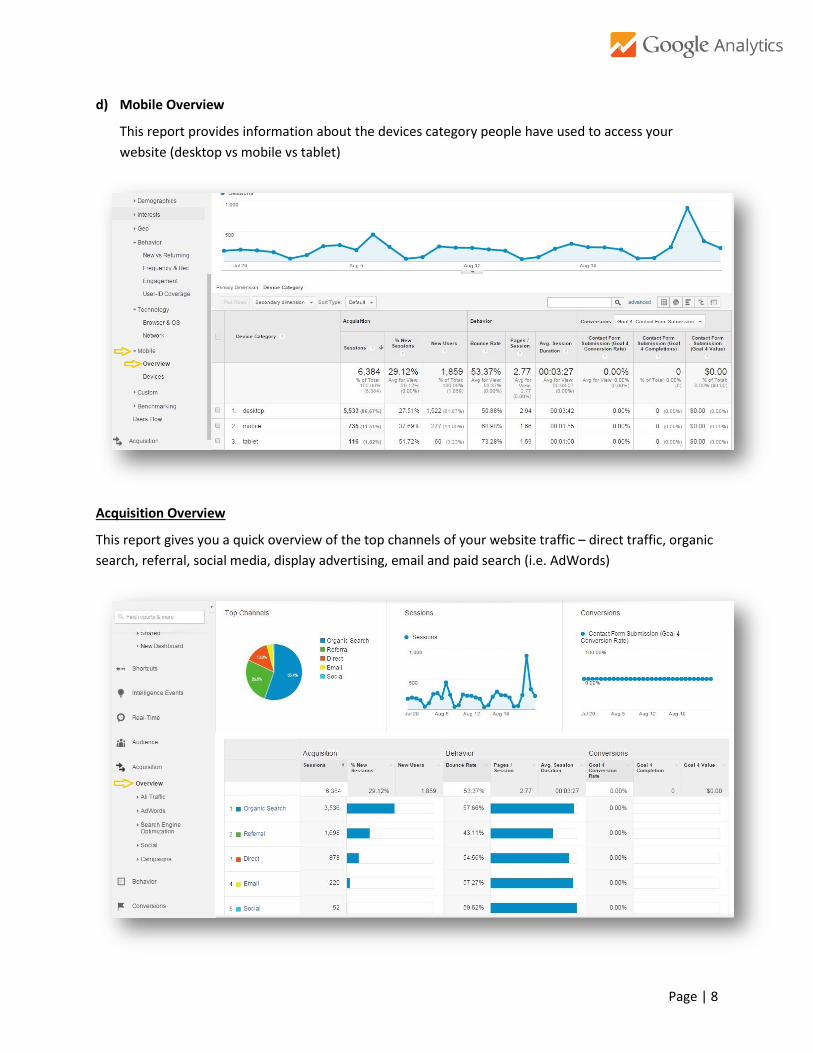
d) Mobile Overview
This report provides information about the devices category people have used to access your website (desktop vs mobile vs tablet)
Acquisition Overview
This report gives you a quick overview of the top channels of your website traffic – direct traffic, organic search, referral, social media, display advertising, email and paid search (i.e. AdWords)
Page | 8
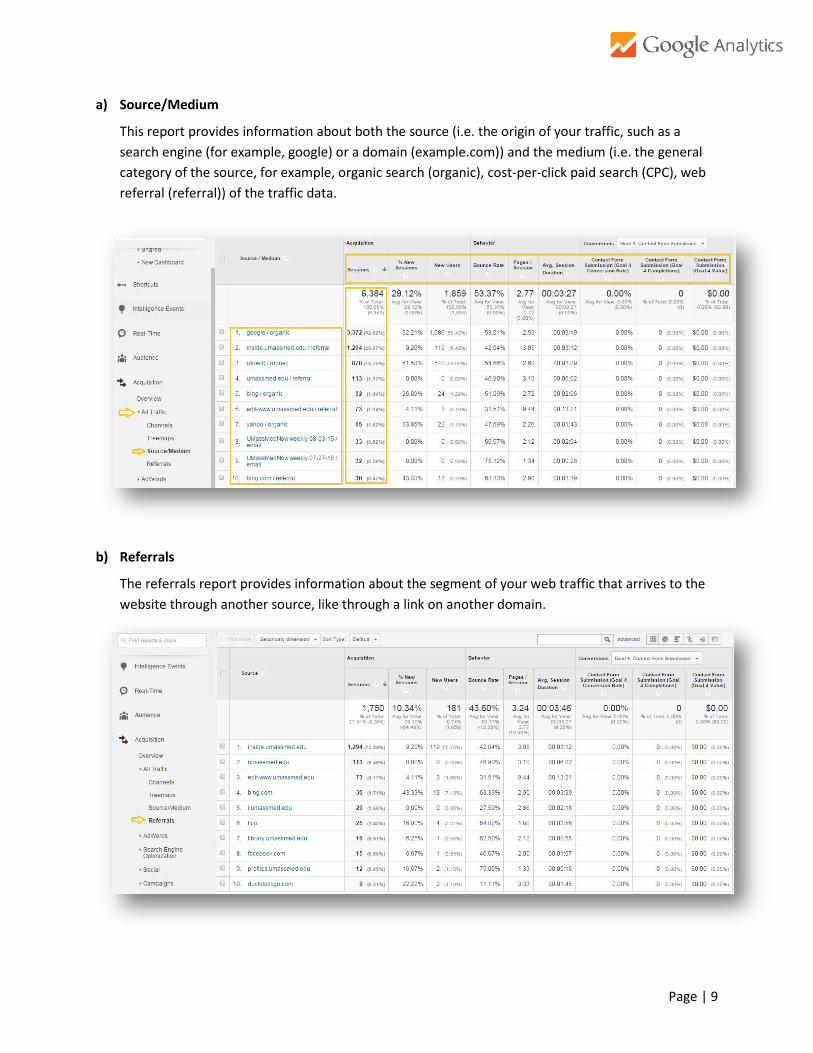
a) Source/Medium
This report provides information about both the source (i.e. the origin of your traffic, such as a search engine (for example, google) or a domain (example.com)) and the medium (i.e. the general category of the source, for example, organic search (organic), cost-per-click paid search (CPC), web referral (referral)) of the traffic data.
b) Referrals
The referrals report provides information about the segment of your web traffic that arrives to the website through another source, like through a link on another domain.
Page | 9
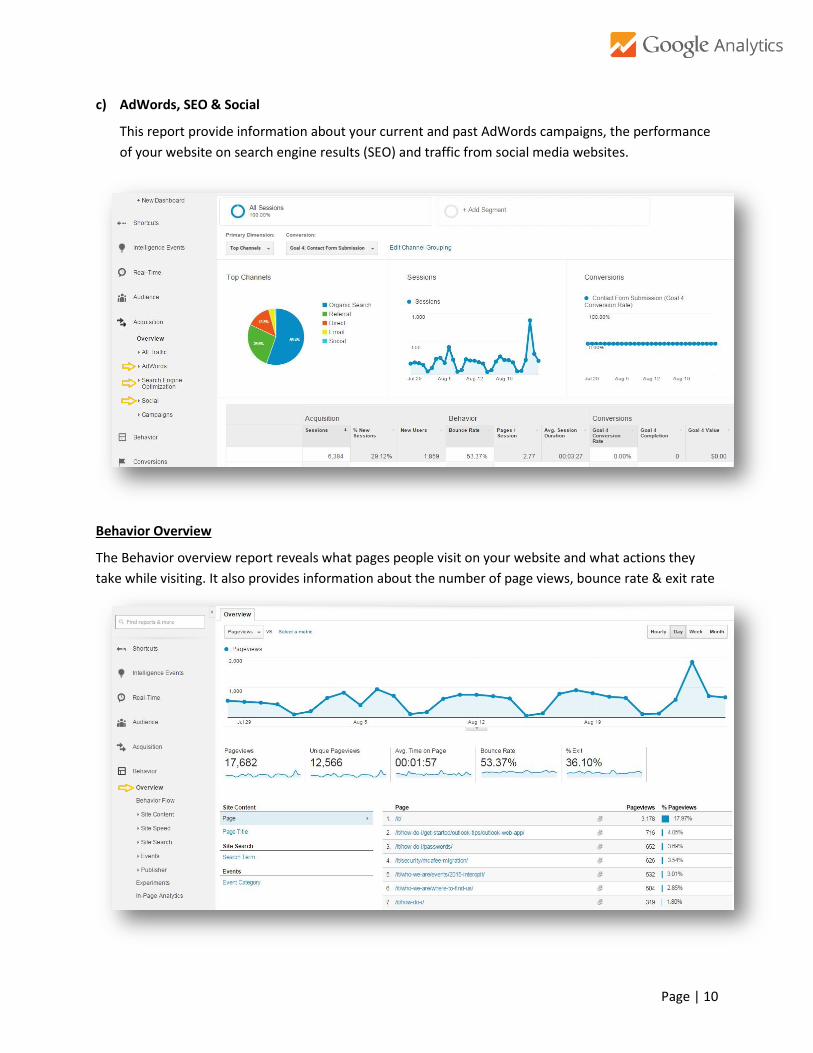
c) AdWords, SEO & Social
This report provide information about your current and past AdWords campaigns, the performance of your website on search engine results (SEO) and traffic from social media websites.
Behavior Overview
The Behavior overview report reveals what pages people visit on your website and what actions they take while visiting. It also provides information about the number of page views, bounce rate & exit rate
Page | 10
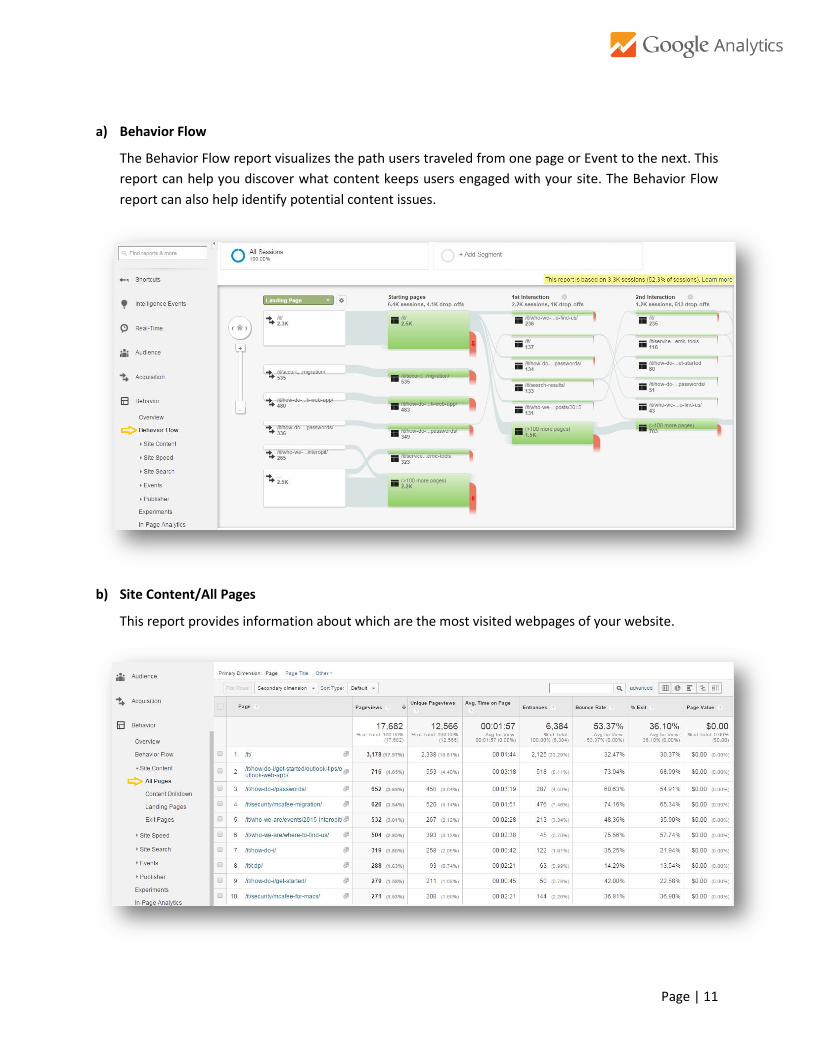
a) Behavior Flow
The Behavior Flow report visualizes the path users traveled from one page or Event to the next. This report can help you discover what content keeps users engaged with your site. The Behavior Flow report can also help identify potential content issues.
b) Site Content/All Pages
This report provides information about which are the most visited webpages of your website.
Page | 11
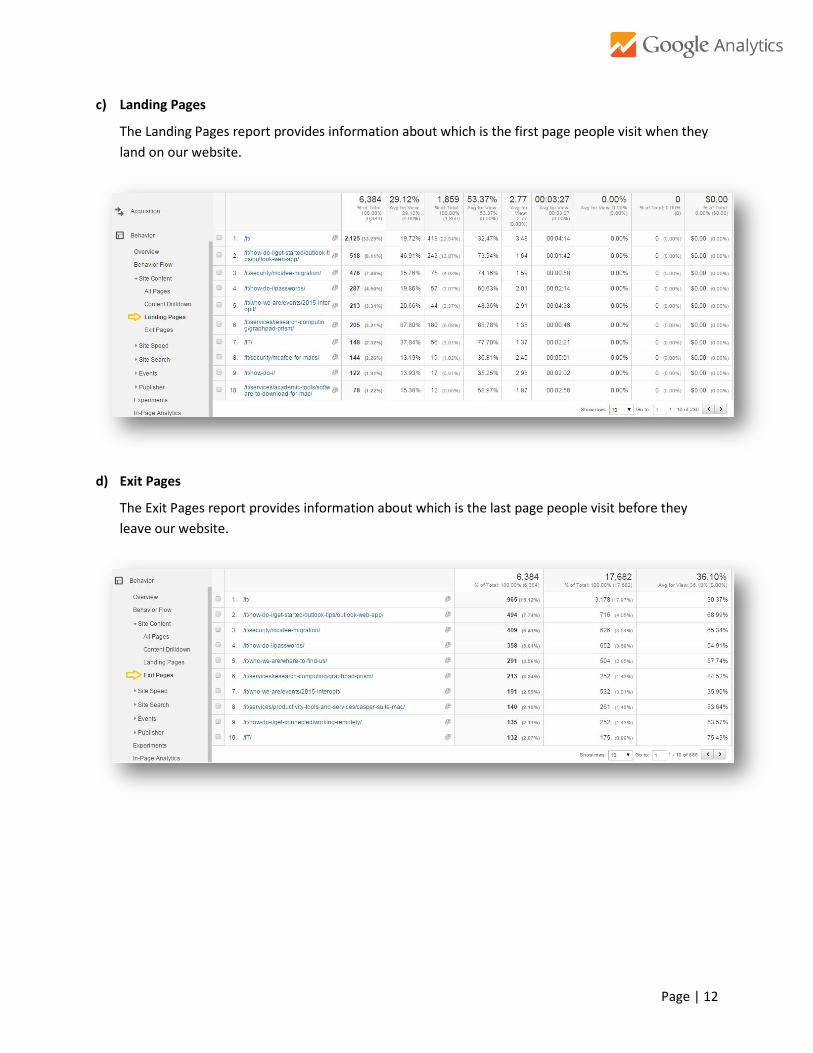
c) Landing Pages
The Landing Pages report provides information about which is the first page people visit when they land on our website.
d) Exit Pages
The Exit Pages report provides information about which is the last page people visit before they leave our website.
Page | 12
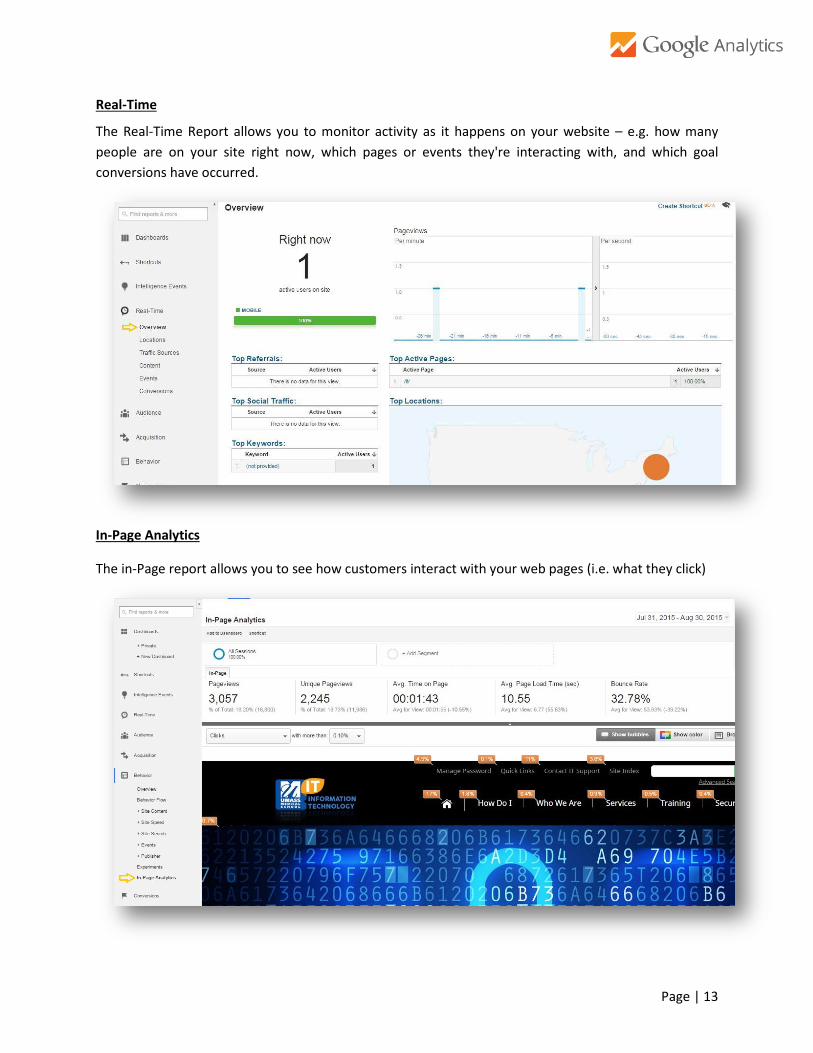
Real-Time
The Real-Time Report allows you to monitor activity as it happens on your website – e.g. how many people are on your site right now, which pages or events they're interacting with, and which goal conversions have occurred.
In-Page Analytics
The in-Page report allows you to see how customers interact with your web pages (i.e. what they click)
Page | 13
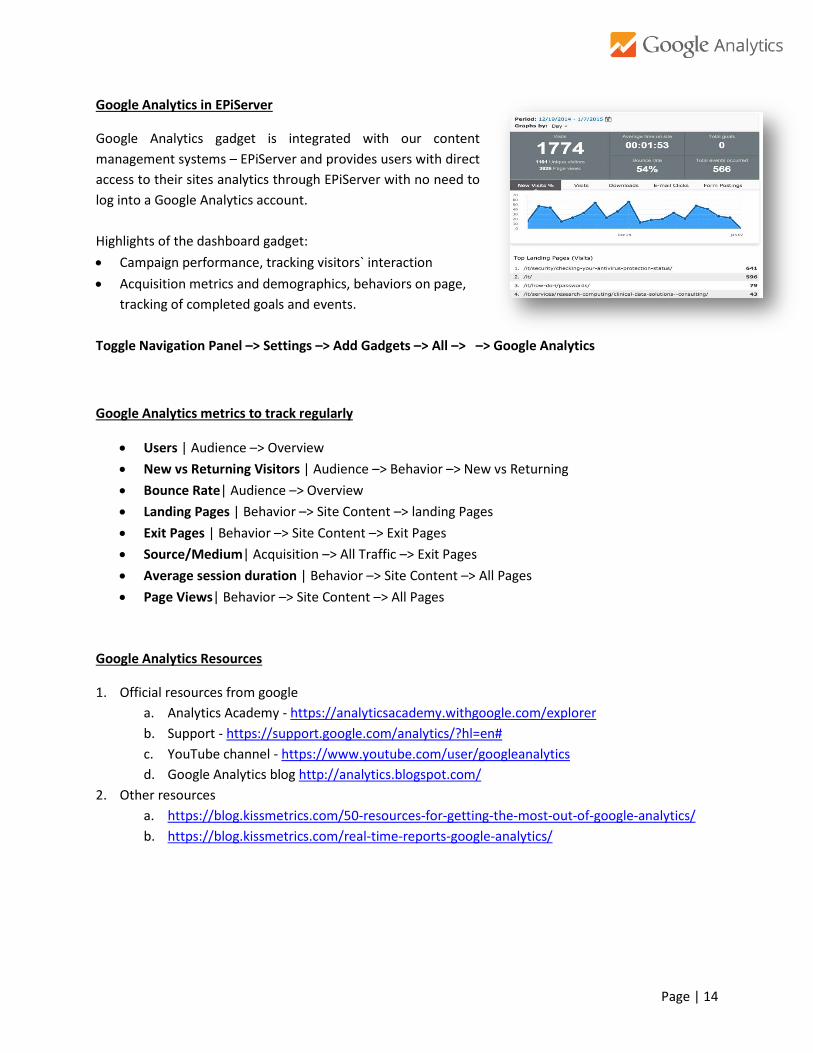
Google Analytics in EPiServer
Google Analytics gadget is integrated with our content management systems – EPiServer and provides users with direct access to their sites analytics through EPiServer with no need to log into a Google Analytics account. Highlights of the dashboard gadget: • Campaign performance, tracking visitors` interaction • Acquisition metrics and demographics, behaviors on page,
tracking of completed goals and events.
Toggle Navigation Panel –> Settings –> Add Gadgets –> All –> –> Google Analytics
Google Analytics metrics to track regularly
• Users | Audience –> Overview • New vs Returning Visitors | Audience –> Behavior –> New vs Returning • Bounce Rate| Audience –> Overview • Landing Pages | Behavior –> Site Content –> landing Pages • Exit Pages | Behavior –> Site Content –> Exit Pages • Source/Medium| Acquisition –> All Traffic –> Exit Pages • Average session duration | Behavior –> Site Content –> All Pages • Page Views| Behavior –> Site Content –> All Pages
Google Analytics Resources
1. Official resources from google a. Analytics Academy - https://analyticsacademy.withgoogle.com/explorer b. Support - https://support.google.com/analytics/?hl=en# c. YouTube channel - https://www.youtube.com/user/googleanalytics d. Google Analytics blog http://analytics.blogspot.com/
2. Other resources a. https://blog.kissmetrics.com/50-resources-for-getting-the-most-out-of-google-analytics/ b. https://blog.kissmetrics.com/real-time-reports-google-analytics/
Page | 14