page 1 of 61 diabetes -...
TRANSCRIPT
1
Pivotal role of O-GlcNAc modification in cold-induced thermogenesis by brown
adipose tissue through mitochondrial biogenesis
Natsuko Ohashi1, Katsutaro Morino
1, Shogo Ida
1, Osamu Sekine
1, Mengistu Lemecha
1,
Shinji Kume1, Shi-Young Park
2, Cheol Soo Choi
2,3, Satoshi Ugi
1 and Hiroshi Maegawa
1
1Department of Medicine, Shiga University of Medical Science, Otsu, Shiga, Japan
2Korea Mouse Metabolic Phenotyping Center, Lee Gil Ya Cancer and Diabetes Institute,
Gachon University, Incheon, Korea.
3Department of Internal Medicine, Gachon University Gil Medical Center, Incheon,
Korea
Running title: Role of O-GlcNAc modification in BAT
Word count: 4188 words
Number of tables and figures: 6
Corresponding author:
Katsutaro Morino M.D., Ph.D.
Department of Medicine, Shiga University of Medical Science,
Tsukinowa-cho, Seta, Otsu, Shiga 520-2192, Japan
TEL: +81-775-48-2222
FAX: +81-775-43-3858
E-mail: [email protected]
Page 1 of 61 Diabetes
Diabetes Publish Ahead of Print, published online June 21, 2017
2
Abstract
Adipose tissues considerably influence metabolic homeostasis, and both white 1
(WAT) and brown adipose tissue (BAT) play significant roles in lipid and glucose 2
metabolism. O-GlcNAc modification is characterized by the addition of 3
N-acetylglucosamine to various proteins by O-GlcNAc transferase (Ogt), subsequently 4
modulating various cellular processes. However, little is known about the role of 5
O-GlcNAc modification in adipose tissues. Here, we report the critical role of 6
O-GlcNAc modification in cold-induced thermogenesis. Deletion of Ogt in WAT and 7
BAT using adiponectin promoter-driven Cre recombinase resulted in severe cold 8
intolerance with decreased uncoupling protein-1 (Ucp1) expression. Furthermore, Ogt 9
deletion led to decreased mitochondrial protein expression in conjunction with 10
decreased peroxisome proliferator-activated receptor gamma coactivator 1-α protein 11
expression. This phenotype was further confirmed by deletion of Ogt in BAT using 12
Ucp1 promoter-driven Cre recombinase, suggesting that O-GlcNAc modification in 13
BAT is responsible for cold-induced thermogenesis. Hypothermia was significant under 14
fasting conditions. This effect was mitigated following normal diet consumption but not 15
Page 2 of 61Diabetes

3
following consumption of a fatty acid-rich ketogenic diet lacking carbohydrates, 16
suggesting impaired diet-induced thermogenesis, particularly by fat. In conclusion, 17
O-GlcNAc modification is essential for cold-induced thermogenesis and mitochondrial 18
biogenesis in BAT. Glucose flux into BAT may be a signal to maintain BAT 19
physiological responses. 20
21
Page 3 of 61 Diabetes
4
Obesity develops when energy intake exceeds energy expenditure, leading to 22
excess calorie storage in the adipose tissues. Obesity is highly correlated with the 23
development of type 2 diabetes, the metabolic syndrome and cardiovascular disease. 24
Adipose tissues have considerable influence on metabolic homeostasis. Two 25
functionally different types of adipose tissues are present in mammals: white adipose 26
tissue (WAT), which is the primary site of energy storage, and brown adipose tissue 27
(BAT), which is specific to thermogenic energy expenditure. BAT uniquely expresses 28
uncoupling protein 1 (Ucp1) and is rich in mitochondria. Furthermore, it is responsible 29
for active metabolism during cold- or diet-induced thermogenesis and uses glucose and 30
fatty acids as fuel (1-4). 31
Cellular homeostasis between nutrient sensing and energy metabolism is 32
coordinately regulated by complex molecular mechanisms (5). Growing evidence 33
indicates that the hexosamine biosynthetic pathway and its end product, 34
UDP-N-acetylglucosamine (UDP-GlcNAc), act as important nutrient sensors (6-8). In a 35
branch of the glycolytic pathway, fructose-6-phosphate is converted into UDP-GlcNAc 36
through multiple enzymes in the hexosamine biosynthetic pathway. UDP-GlcNAc also 37
Page 4 of 61Diabetes
5
serves as the donor for O-linked N-acetylglucosamine (O-GlcNAc) modification, which 38
is associated with glucose, amino acid and fatty acid metabolism (9). O-GlcNAc 39
modification of proteins on serine/threonine residues occurs in the nucleus, cytoplasm 40
and mitochondria, and its addition is catalyzed by O-GlcNAc transferase (Ogt) (10). 41
Cold-induced thermogenesis is a fundamental function required in mammals 42
to survive in severe environmental changes. BAT is important for maintaining body 43
temperature under cold conditions (11). Recent reports have revealed that, even in 44
humans, significantly increased glucose and fatty acid flux are observed via positron 45
emission tomography with 18F-fluorodeoxyglucose and 18F-fluoro-thiahepadecaoic 46
acid (12). In addition, dramatic changes in both glucose and fatty acid flux occur in the 47
fasting and postprandial states in WAT. Since O-GlcNAc modification is considered a 48
“nutrient sensor” for glucose and fatty acids, O-GlcNAc modification may influence 49
BAT and WAT function. However, little is known about the role of O-GlcNAc 50
modification in adipose tissues. 51
Therefore, in this study, to reveal the physiological role of O-GlcNAc 52
modification in adipose tissues, we analyzed the phenotypes of adipose tissue-specific 53
Page 5 of 61 Diabetes
6
Ogt knockout (Ogt-FKO) and BAT-specific Ogt knockout (Ogt-BKO) mice. Here, we 54
demonstrated that O-GlcNAc modification in BAT is essential for thermogenesis and 55
mitochondrial biogenesis. 56
57
Page 6 of 61Diabetes
7
Research Design and Methods 58
Animal experiments 59
Ogt-KO mice were generated using the Cre-LoxP system. We crossbred Ogt-flox 60
(Ogtf/f
) female mice (Jackson Laboratory, Bar Harbor, ME) with Adipoq-Cre (kindly 61
provided by Dr. Evan Rosen) and Ucp1-Cre (Jackson Laboratory) mice to generate 62
Ogt-FKO and Ogt-BKO mice, respectively. All experiments and analyses were 63
performed with male mice. Because Ogt is present on the X chromosome, the first 64
generation of female mice are heterozygous with X-linked inheritance. Thus, we 65
examined male mice as complete knockout mice (Figures 1A and 4A). All animal 66
handling and experimentation were conducted according to the guidelines of the 67
Research Center for Animal Life Science at Shiga University of Medical Science or the 68
Korea Mouse Metabolic Phenotyping Center at Gachon University. All experimental 69
protocols were approved by the Gene Recombination Experiment Safety Committee 70
and Research Center for Animal Life Science at Shiga University of Medical Science or 71
Gachon University Institutional Animal Care and Use Committee. 72
73
Page 7 of 61 Diabetes
8
Tissue collection 74
Mice were euthanized at various time points by intraperitoneal administration of 10% 75
pentobarbital with sevoflurane inhalation before immediate tissue collection. Inguinal 76
WAT (iWAT), epididymal WAT (eWAT), inter-scapular BAT, gastrocnemius muscle, 77
liver, and pancreas were dissected immediately, snap-frozen in liquid-nitrogen, and 78
stored at −80°C until analysis. 79
80
Blood analysis 81
Blood glucose concentrations were measured with GDH-PQQ glucose test strips 82
(Glutest Sensor®, Sanwa Kagaku, Nagoya, Japan). Plasma insulin levels were 83
measured by an enzyme-linked immunosorbent assay (Morinaga, Tokyo, Japan). Blood 84
ketone levels were measured using a Precision Xceed (Abbott, Chiba, Japan). 85
86
Histological analyses 87
Fixed specimens embedded in paraffin were sectioned (3 µm thicknesses). Antibodies 88
against UCP1 (U6382, Sigma-Aldrich, St. Louis, MO), cytochrome oxidase subunit 4 89
Page 8 of 61Diabetes
9
(COX4; Novus Biologicals, Cambridge, UK), and perilipin (#9349, Cell Signaling 90
Technology, Tokyo, Japan) were used. Transmission electron microscopic analysis was 91
performed with a Hitachi H-7500 (Hitachi, Tokyo, Japan). The adipocyte number and 92
area were calculated using a BZ-H3C (Keyence, Osaka, Japan). 93
94
Acute cold exposure 95
Ogt-FKO, Ogt-BKO, and control mice were deprived of food for 12 h before 96
experiments. The mice were placed into individual cages with bedding and water in a 97
room maintained at 4°C for 3 h. Mouse rectal body temperature was measured using a 98
type T thermocouple rectal probe (RET-3, Physitemp Instruments, Inc., Clifton, NJ). 99
Following cold exposure, mice were euthanized by sevoflurane before immediate 100
inter-scapular BAT and iWAT collection as described above. 101
102
Normal and ketogenic diet consumption during acute cold exposure 103
Ogt-FKO, Ogt-BKO, and control mice were deprived of food for 18 h before 104
experiments. Mice were placed into individual cages with bedding, food, and water in a 105
Page 9 of 61 Diabetes
10
room maintained at 4°C for 3 h. The mice were fed a normal (protein : fat : 106
carbohydrate = 27.5 : 12.5 : 60 kcal%, CE-2, CREA Japan, Inc., Tokyo, Japan) or 107
ketogenic diet (protein : fat : carbohydrate = 10.4 : 89.5 : 0.1 kcal%, Very Low 108
Carbohydrate Ketogenic Rodent Diet, Research Diets, Inc., New Brunswick) during 109
cold exposure. Before and at 1, 2 and 3 h after cold exposure, mouse rectal body 110
temperatures were assessed. Before and at 3 h after cold exposure, blood glucose 111
concentrations and blood ketone levels were measured. 112
113
Intraperitoneal glucose tolerance test (IPGTT) 114
An IPGTT in Ogt-FKO, Ogt-BKO, and control mice was performed in overnight-fasted 115
mice following an intraperitoneal injection of glucose (1 g/kg body weight) at room 116
temperature or 4°C. Blood glucose levels were determined at 15, 30, 60, 90 and 120 117
min after injection. 118
119
Intraperitoneal insulin tolerance tests (IPITT) 120
An IPITT in Ogt-FKO and control mice was performed an intraperitoneal injection of 121
Page 10 of 61Diabetes
11
insulin (0.5 U/kg body weight) at 6 h after fasting at room temperature. Blood glucose 122
levels were determined at 15, 30, 60, 90 and 120 min after injection. 123
124
Oral glucose and olive oil tolerance tests 125
Ogt-FKO, Ogt-BKO, and control mice were deprived of food for 18 h before 126
experiments. The mice were placed into individual cages with bedding and water in a 127
room maintained at 4°C for 3 h. Glucose (20%) or olive oil was administered orally 128
(0.01 ml/g body weight) before and at 1 and 2 h after cold exposure. Before and at 1, 2, 129
and 3 h after cold exposure, mouse rectal body temperatures were measured. Before and 130
at 3 h after cold exposure, blood glucose concentrations and blood ketone levels were 131
measured. 132
133
Body fat composition and basal energy balance measurement 134
Fat and lean body masses were measured in mice using the 1H minispec system (LF90II, 135
BrukerOptics, Germany). Basal energy balance, including oxygen consumption, carbon 136
dioxide production rate, respiratory quotient, energy expenditure, and food intake, were 137
Page 11 of 61 Diabetes

12
measured (2 days of acclimation followed by 2 days of measurement) using 138
Comprehensive Laboratory Animal Monitoring Systems (CLAMS; Columbus 139
Instruments, Columbus, OH). 140
141
Total RNA preparation and RT-qPCR analysis 142
Total RNA was extracted from tissues using an RNeasy Kit (Qiagen Inc., Valencia, CA). 143
cDNA was synthesized using reverse transcription reagents (Takara Bio, Otsu, Japan). 144
Transcript abundance was assessed by real-time PCR on an Applied Biosystems 7500 145
Real-Time PCR System (Thermo Fisher Scientific K.K., Yokohama, Japan) with SYBR 146
Green (Bio-Rad Laboratories, Hercules, CA). Analytical data were normalized to 147
GAPDH mRNA expression as an internal control. Primer sequences can be found in the 148
Supplemental Data section. 149
150
RT-qPCR analysis of mitochondrial DNA content 151
DNA primers were designed to detect cytochrome oxidase 2 (Cox2) and uncoupling 152
protein 2 (Ucp2) for mitochondrial DNA (mtDNA) and nuclear DNA, respectively. The 153
Page 12 of 61Diabetes
13
ratio of Cox2 to Ucp2 within the samples was used to calculate the mtDNA copy 154
number. Primer sequences can be found in the Supplemental Data section. 155
156
Western blot analysis 157
For western blot analysis, proteins were resolved by SDS-polyacrylamide gel 158
electrophoresis and transferred to nitrocellulose membranes. The membranes were 159
incubated with antibodies against the following molecules: OGT (O6264, 160
Sigma-Aldrich), RL2 (MA1-072, Thermo Scientific, MA), β-tubulin (H-235, Santa 161
Cruz Biotechnology, Santa Cruz, CA), UCP1 (U6382, Sigma-Aldrich), peroxisome 162
proliferator-activated receptor gamma coactivator-1α (PGC-1α; ab54481, Abcam plc, 163
Cambridge, UK), cAMP response element-binding protein (CREB; sc-186, Santa Cruz 164
Biotechnology), pCREB (sc-7978, Santa Cruz Biotechnology), phosho-(Ser/Thr) 165
protein kinase A substrate (pPKA; #9621, Cell Signaling Technology, Tokyo, Japan), 166
phospho-hormone sensitive lipase Ser563 (pHSL; #4139, Cell Signaling Technology), 167
pHSL Ser660 (#4126, Cell Signaling Technology), HSL (#4107, Cell Signaling 168
Technology), cytochrome c oxidase subunit 1 (MTCO1; ab14705, Abcam plc), COX4 169
Page 13 of 61 Diabetes
14
(ab14744, Abcam plc), mitochondrial transcription factor A (TFAM; LS-C30495, 170
LifeSpan BioSciences, Seattle, WA), succinate dehydrogenase complex, subunit A 171
(SDHA; ab14715, Abcam plc), pyruvate dehydrogenase (PDH; Novus Biologicals, 172
Cambridge, UK), ubiquitin (Cell Signaling Technology), Autophagy-related gene (ATG) 173
5 (Cell Signaling Technology), ATG7 (Cell Signaling Technology), 174
microtubule-associated protein 1 light chain 3 (LC3; Novus Biologicals), β-actin 175
(A5316, Sigma-Aldrich), pan-actin (sc-1616, Santa Cruz Biotechnology), long-chain 176
acyl coenzyme A dehydrogenase (LCAD) (ACADL; Proteintech Group, Rosemont), 177
and medium-chain acyl coenzyme A dehydrogenase (MCAD) (ACADM; GeneTex, Inc., 178
CA). After additional washing, the membranes were incubated with horseradish 179
peroxidase-linked secondary antibodies followed by chemiluminescence detection. 180
181
Stromal vascular (SV) culture and primary brown adipocyte differentiation 182
The interscapular brown fat pad (eight fat pads for each group) was dissected from 183
8-week-old Ogt-BKO and Ogt-flox mice according to a previous report (13). Briefly, 184
tissues were minced and digested with 1.5 U/ml collagenase D (1108874103, Roche) in 185
Page 14 of 61Diabetes
15
10 mM CaCl2 and 2.4 U/ml dispase II (04942078001, Roche) for 40–50 min while 186
shaking at 37°C. Digestion was stopped by adding complete DMEM/F12 containing 187
10% FBS and penicillin/streptomycin (SV culture medium). Cells were collected by 188
centrifugation at 700 × g for 10 min, resuspended, and strained through a 70 µM cell 189
strainer (BD Biosciences). Cells were further filtered through a 40 mm cell strainer to 190
remove clumps and large adipocytes. After further centrifugation as mentioned above, 191
SV cells were re-suspended in SV culture medium and plated onto 6-well 192
collagen-coated dishes. At confluency (day 0), cells were exposed to a differentiation 193
cocktail including 0.25 µM dexamethasone, 10 µg/mL insulin, 1 nM T3, 0.5 µM 194
rosiglitazone, 0.5 mM isobutylmethylxanthine, and 125 µM indomethacin in SV culture 195
medium. At 48 h after induction, the cells were maintained in SV culture medium 196
containing 5 mg/mL insulin and 1 µM rosiglitazone for 6 days. Cells were fully 197
differentiated on day 8. To examine the role of the proteasomal pathway, proteasomal 198
inhibitor MG132 (25 µM) was applied at 3 h before sample collection. All chemicals 199
for cell culture were obtained from Sigma unless indicated otherwise. 200
201
Page 15 of 61 Diabetes
16
Statistical analysis 202
Results are expressed as means ± SEM. Student’s t tests were used to assess differences 203
between two groups. A P-value of less than 0.05 was considered as statistically 204
significant. 205
Page 16 of 61Diabetes
17
Results 206
Ogt-FKO mice display a significantly reduced WAT mass, but an increased BAT mass 207
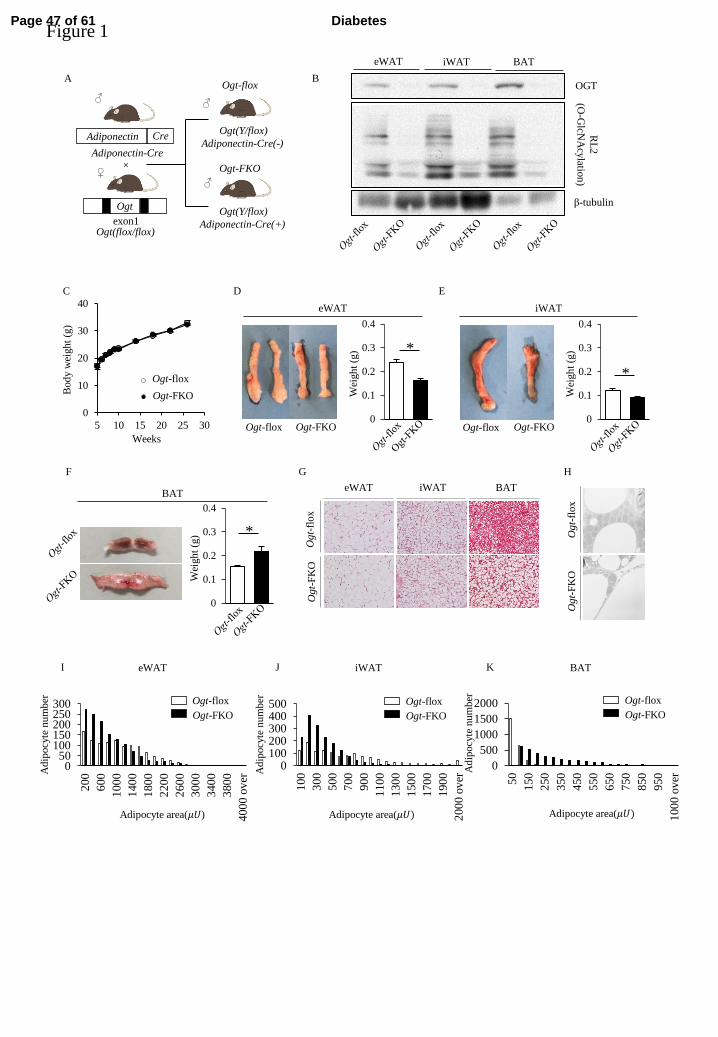
We first clarified the role of O-GlcNAc modification in WAT and BAT using Ogt-FKO 208
mice (Figure 1A). OGT protein expression was decreased in both WAT and BAT of 209
Ogt-FKO mice compared with those of control mice (Figure 1B). Similarly, O-GlcNAc 210
modifications analyzed by the RL2 antibody were also decreased in these tissues 211
(Figure 1B). Ogt-FKO mice developed normally (Figure 1C), and there were significant 212
reductions in eWAT and iWAT masses (Figure 1D, E). In contrast, BAT in Ogt-FKO 213
mice displayed an increased fat mass. Upon dissection, it was visibly lipid laden and 214
displayed a milky appearance compared with the dark brown color of BAT in control 215
mice (Figure 1F). Histologically, BAT cells in Ogt-FKO mice were substantially 216
enlarged with a WAT-like appearance resulting from accumulation of lipid droplets 217
(Figure 1G, H, Supplementary Figure 1A). Quantitative analysis of cell size revealed 218
that Ogt-FKO mice had significantly smaller adipocytes in eWAT and iWAT, but larger 219
adipocytes in BAT (Figure 1I–K). 220
221
Page 17 of 61 Diabetes
18
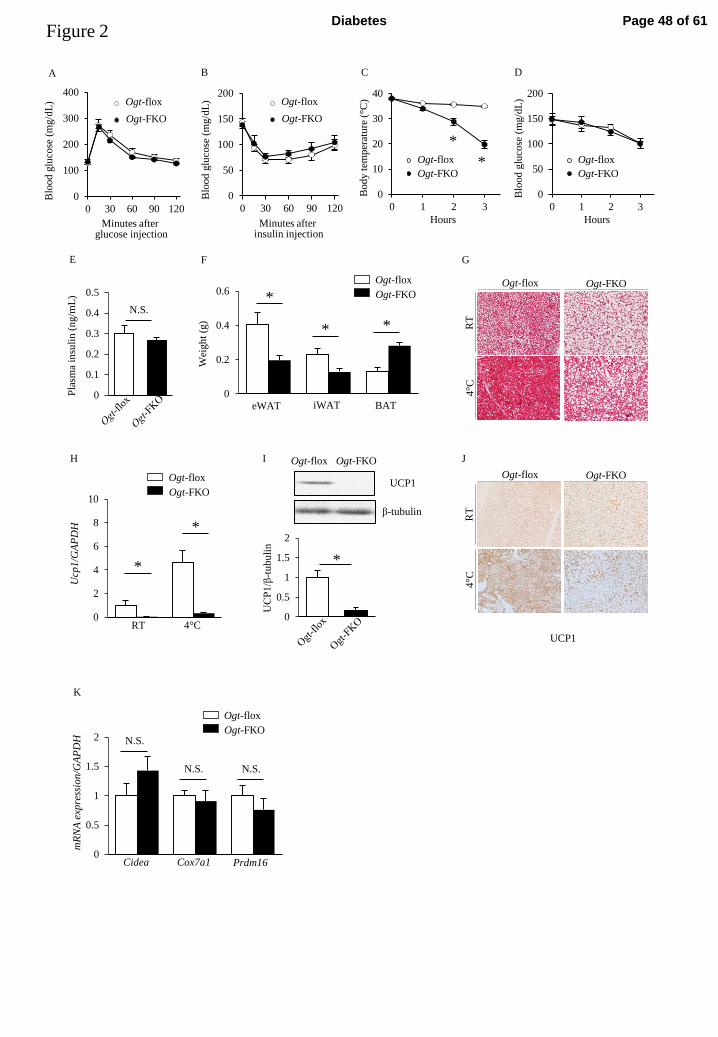
Ogt-FKO mice display significant intolerance to cold exposure compared with control 222
mice 223
We next examined the effects of adipose tissue-specific O-GlcNAc modification 224
deficiency in glucose metabolism and thermogenesis. IPGTTs and IPITTs revealed no 225
significant differences between the two genotypes (Figure 2A, B). To assess 226
thermogenesis, a cold exposure test was performed at 4°C for 3 h. Surprisingly, 227
although all mice visibly shivered, cold intolerance was evident only in Ogt-FKO mice 228
with the mice reaching critical hypothermia within 3 h (Figure 2C). During cold 229
exposure, there were no differences in blood glucose or plasma insulin levels between 230
the two genotypes (Figure 2D, E). eWAT and iWAT masses in Ogt-FKO mice were 231
reduced compared with those in control mice (Figures 2F, G). In contrast, BAT in 232
Ogt-FKO mice was heavier than that in control mice and displayed substantial lipid 233
droplet accumulation even after cold exposure (Figures 2F, G). Therefore, we focused 234
on the detailed molecular mechanism underlying O-GlcNAc modification 235
deficiency-mediated cold intolerance. 236
Interestingly, BAT Ucp1 gene expression was significantly low at room 237
Page 18 of 61Diabetes
19
temperature in Ogt-FKO mice (Figure 2H). Moreover, Ogt-FKO mice displayed 238
impaired cold-stimulated Ucp1 mRNA expression compared with control mice (Figure 239
2H). UCP1 protein expression was also significantly decreased in Ogt-FKO mice 240
(Figure 2I). Similarly, immunohistochemical analysis revealed decreased UCP1 241
expression both at room temperature and following cold exposure (Figure 2J). To test 242
the differentiation level of BAT, we analyzed mRNA expression of Cox7a1, Cidea, and 243
Prdm16. There was no significant difference in the expression of these genes between 244
the two genotypes (Figure 2K). Taken together, Ogt-FKO mice displayed significant 245
intolerance to cold exposure compared with control mice, partially because of the lack 246
of Ucp1 expression. 247
248
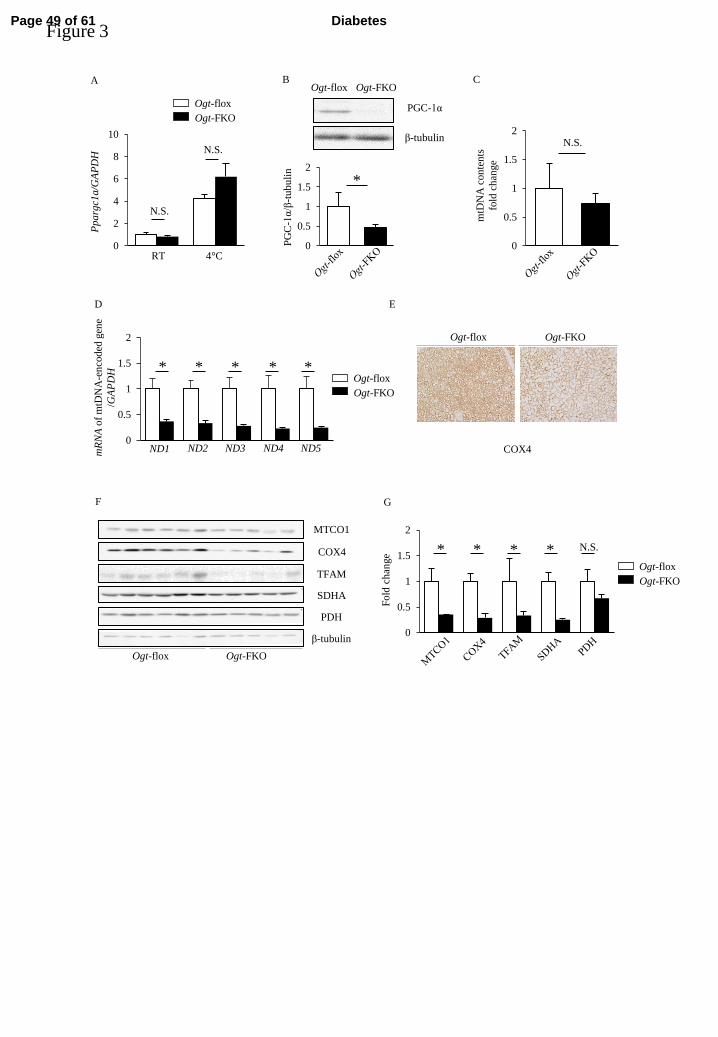
PGC-1α and mitochondria-related protein expression in BAT are remarkably decreased 249
in Ogt-FKO mice compared with control mice 250
Induction of the cold-induced thermogenesis program in BAT in vivo is strongly 251
influenced by the sympathetic nervous system and the resulting action of the 252
β-adrenergic receptor/PKA/CREB axis. Thus, we next evaluated changes in the 253
Page 19 of 61 Diabetes
20
expression levels of genes associated with the β-adrenergic receptor/PKA/CREB axis. 254
First, we examined PKA, HSL, and CREB phosphorylations and found no significant 255
differences between Ogt-FKO and control mice (Supplementary Figure 2). However, 256
we observed a significant reduction in protein level of PGC-1α, a key regulator of 257
thermogenesis, although there were no significant changes in mRNA expression of the 258
gene encoding PGC-1α, Ppargc1a (Figure 3A, B). Because PGC-1α is also known as a 259
master regulator of mitochondrial biogenesis, we next evaluated the expression of genes 260
associated with mitochondria. Although the mtDNA copy number was similar in the 261
two genotypes (Figure 3C), mRNA expression of mtDNA-encoded genes was 262
significantly decreased in Ogt-FKO mice, suggesting decreased transcription of 263
mtDNA-encoded genes probably due to the decreased TFAM protein levels (Figure 3D). 264
Moreover, immunohistochemical analysis of COX4 in BAT revealed decreased 265
expression in Ogt-FKO mice (Figure 3E). In addition, the protein levels of MTCO1, 266
COX4, TFAM, and SDHA were significantly decreased in BAT (Figure 3F, G). These 267
results suggested that Ogt deletion in adipose tissues resulted in impaired cold-induced 268
thermogenesis in BAT through dysregulation of PGC-1α. 269
Page 20 of 61Diabetes
21
270
Ogt deletion in mouse BAT significantly increases the BAT mass 271
To evaluate whether BAT is the sole organ responsible for the dysregulation of 272
cold-induced thermogenesis following Ogt deletion, Ogt-BKO mice were generated by 273
crossbreeding Ogt-flox mice with Ucp1-Cre mice (Figure 4A). In Ogt-BKO mice, OGT 274
protein expression was decreased only in BAT, resulting in decreased O-GlcNAc 275
modification as measured using the RL2 antibody (Figure 4B). Similar to Ogt-FKO 276
mice, Ogt-BKO mice developed normally (Figure 4C). There were no differences in 277
body composition, food intake, energy expenditure, resting energy expenditure, oxygen 278
consumption, carbon dioxide production, or locomotor activity between Ogt-BKO and 279
control mice (Figure 4D–H, Supplementary Figure 3). Although there were no 280
differences in eWAT or iWAT masses, a difference in BAT mass was observed (Figure 281
4I). Consistent with Ogt-FKO mice, Ogt-BKO mice displayed accumulation of enlarged 282
lipid droplets in BAT cells (Figure 4J, Supplementary Figure 1B). 283
284
Ogt-BKO mice display marked intolerance to cold exposure similar to Ogt-FKO mice 285
Page 21 of 61 Diabetes
22
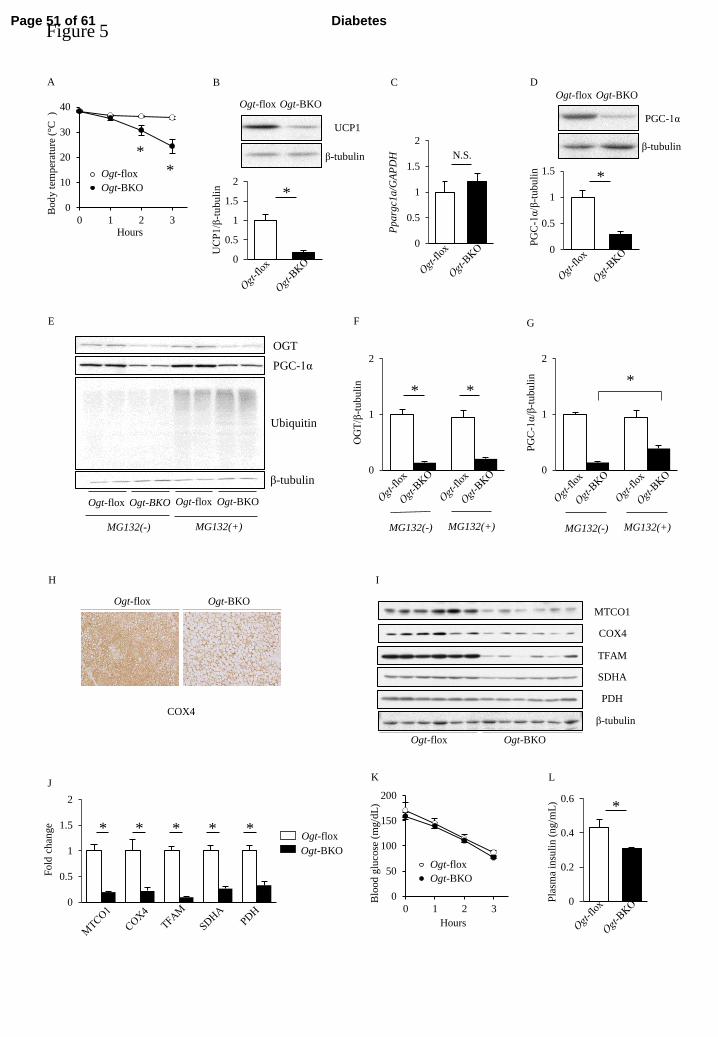
Similar to Ogt-FKO mice, cold intolerance was evident in Ogt-BKO mice with mice 286
reaching critical hypothermia within 3 h (Figure 5A). Ogt-BKO mice showed no 287
significant changes in expression levels of OGT or O-GlcNAc modification detected by 288
the RL2 antibody in iWAT after 3 h of cold exposure (Supplementary Figure 4A–C). 289
The BAT UCP1 protein level was severely diminished in Ogt-BKO mice compared with 290
control mice at room temperature (Figure 5B). Moreover, PGC-1α protein level was 291
significantly lower, although mRNA expression was unchanged compared with control 292
mice, suggesting post-translational modification (Figure 5C, D). To further explorer this 293
mechanism, we evaluated primary brown adipocytes from Ogt-BKO mice. PGC-1α 294
expression was significantly reduced in primary brown adipocytes from Ogt-BKO mice 295
compared with those from control mice. Treatment with proteasomal inhibitor MG132 296
partially but significantly increased PGC-1α protein levels in Ogt-BKO mice, 297
suggesting that O-GlcNAc modification protects PGC-1α from proteasomal degradation 298
(Figure 5E–G). Similar to Ogt-FKO mice, immunohistochemical analysis showed that 299
COX4 was decreased in BAT (Figure 5H), and other mitochondrial protein levels were 300
significantly decreased in Ogt-BKO mice (Figure 5I, J). There was no difference in 301
Page 22 of 61Diabetes
23
blood glucose levels, but a significant decrease in plasma insulin levels in Ogt-BKO 302
mice (Figure 5K, L). In other glucose metabolism-related tissues such as liver, muscle, 303
and pancreas, no apparent difference was found in OGT or mitochondrial related protein 304
expression, and O-GlcNAc modification was observed in Ogt-BKO mice compared 305
with control mice (Supplementary Figure 5B). This phenomenon was consistent in 306
Ogt-FKO mice (Supplementary Figure 5A). 307
308
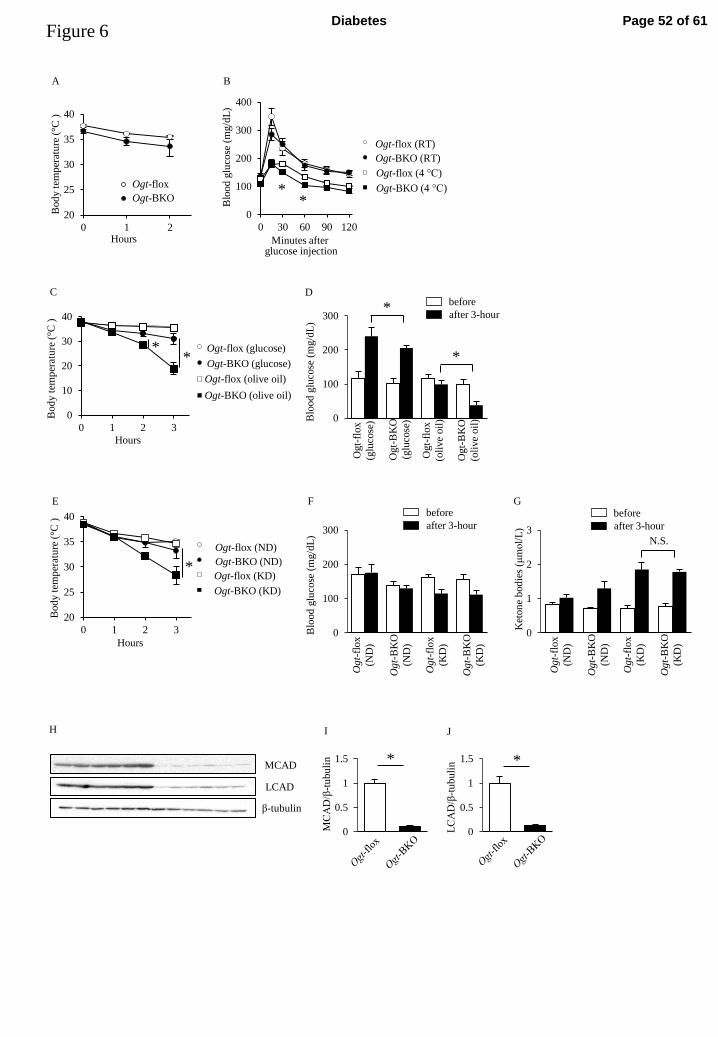
Ogt-BKO mice maintain their body temperature during cold exposure following glucose 309
administration 310
During cold exposure, increased glucose and fatty acid oxidation appears to maintain 311
core temperature by stimulating heat production in BAT. To evaluate glucose 312
metabolism during cold exposure, we performed IPGTTs in Ogt-BKO and control mice. 313
Surprisingly, body temperatures during an IPGTT at 4°C were sustained even in 314
Ogt-BKO mice (Figure 6A). However, Ogt-BKO mice displayed slightly but 315
significantly lower glucose levels compared with control mice at 30 and 60 min of cold 316
exposure (Figure 6B). Compared with glucose levels at room temperature, substantially 317
Page 23 of 61 Diabetes
24
lowered glucose levels were observed during cold exposure in both genotypes, 318
suggesting increased glucose utilization (Figure 6B). These data suggest that 319
diet-induced thermogenesis by glucose rescued hypothermia in Ogt-BKO mice. To test 320
this hypothesis, we performed glucose- and oil-loading tests during cold exposure. 321
There was no apparent difference in shivering between glucose- and oil-loaded groups 322
(data not shown). Oral administration of oil failed to maintain body temperature in 323
Ogt-BKO mice during cold exposure (Figure 6C). Following cold exposure, oil 324
administration in Ogt-BKO mice resulted in significantly lower glucose levels 325
compared with control mice (Figure 6D). In addition, Ogt-BKO mice fed a normal diet 326
could maintain body temperature, but Ogt-BKO mice fed a low carbohydrate ketogenic 327
diet could not, although there were no changes in blood glucose or ketone body levels 328
between Ogt-BKO and control mice (Figure 6E–G). Because a ketogenic diet is 329
deficient in carbohydrates but high in fat, these data suggest that Ogt-BKO mice 330
preferentially use glucose, and fat utilization is defective during cold exposure. To 331
further explorer the mechanism, we next investigated whether Ogt deletion affect 332
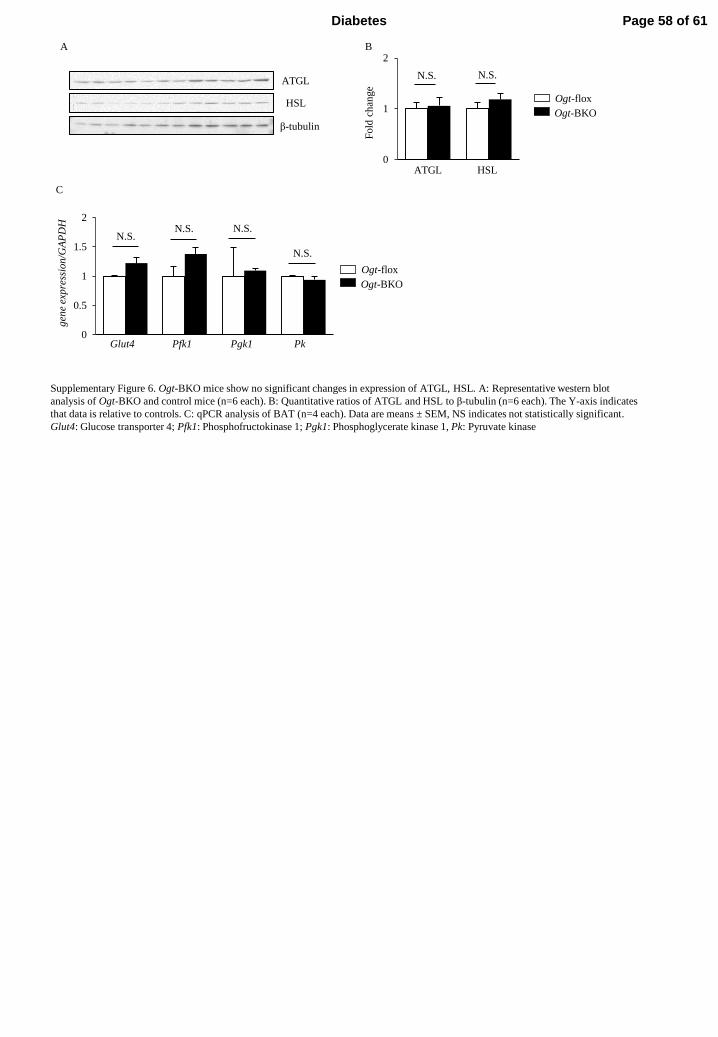
lipolysis and fatty acid oxidation in BAT. The protein expression of ATGL and HSL, 333
Page 24 of 61Diabetes
25
key enzymes of lipolysis, were similar between Ogt-BKO and control mice 334
(Supplementary Figure 6A, B). Protein expression of LCAD and MCAD, fatty acid 335
oxidation gene known PGC-1α targets, were significantly lower in Ogt-BKO mice 336
(Figure 6H–J). These data strongly support the hypothesis that O-GlcNAc modification 337
deficiency impairs fatty acid oxidation in BAT. 338
339
Page 25 of 61 Diabetes
26
Discussion 340
The current study was designed to clarify the role of protein O-GlcNAc 341
modification in adipose tissues. We demonstrated that this modification was essential 342
for cold-induced thermogenesis in BAT. Advances in brown adipose cell biology during 343
the last decade have increased our understanding of the cellular origin (14-16), function 344
(4; 16; 17), and adult human tissue distribution (3; 18-20) of BAT. However, a 345
comprehensive overview of BAT biology has not been fully clarified. One of the most 346
prominent findings from this study was that Ogt-KO mice displayed impaired 347
thermogenesis during cold exposure. Compared with control mice, we identified an 348
increased number of large lipid droplets in the BAT of both Ogt-FKO and Ogt-BKO 349
mice. To reveal the detailed mechanism underlying impaired thermogenesis by 350
O-GlcNAc modification deficiency, we compared the expression levels of 351
mitochondrial proteins in the BAT of Ogt-KO and control mice. In the BAT of Ogt-FKO 352
mice, protein and mRNA expression levels of Ucp1 and mitochondrial DNA-encoded 353
proteins were decreased significantly and accompanied by decreased PGC-1α 354
expression. PGC-1α-dependent Ucp1 expression and mitochondrial biogenesis are 355
Page 26 of 61Diabetes
27
essential for cold exposure-induced thermogenesis in BAT (21). Thus, O-GlcNAc 356
modification deficiency in BAT may impair cold-induced thermogenesis by modulating 357
PGC-1α. 358
PGC-1α is a key transcriptional co-activator that regulates mitochondrial 359
biogenesis (21). PGC-1α stability and activity are regulated by post-translational 360
mechanisms such as acetylation and phosphorylation (22-24). PGC-1α degradation can 361
also be regulated by ubiquitin-dependent proteasomal degradation (25; 26). We found 362
no difference in PGC-1α mRNA expression between Ogt-KO and control mice, whereas 363
PGC-1α protein levels were decreased in Ogt-KO mice (Figures 3B, 5D). In addition, 364
primary adipocytes from Ogt-BKO mice showed lower PGC-1α protein levels 365
compared with control mice (Figure 5E, G). Treatment with the proteasomal inhibitor 366
resulted in a partial but significant increase in PGC-1α protein levels, indicating the 367
ubiquitin-proteasomal pathway in the stability of PGC-1α (Figure 5E, G). These results 368
suggest that O-GlcNAc modification may regulate the PGC-1α degradation process in 369
BAT. This hypothesis is in agreement with a previous study that demonstrated that 370
O-GlcNAc modification of PGC-1α protein in the liver antagonizes ubiquitination and 371
Page 27 of 61 Diabetes
28
subsequent degradation (27). Taken together, O-GlcNAc modification of PGC-1α 372
protein may stabilize PGC-1α by inhibiting ubiquitination in BAT. 373
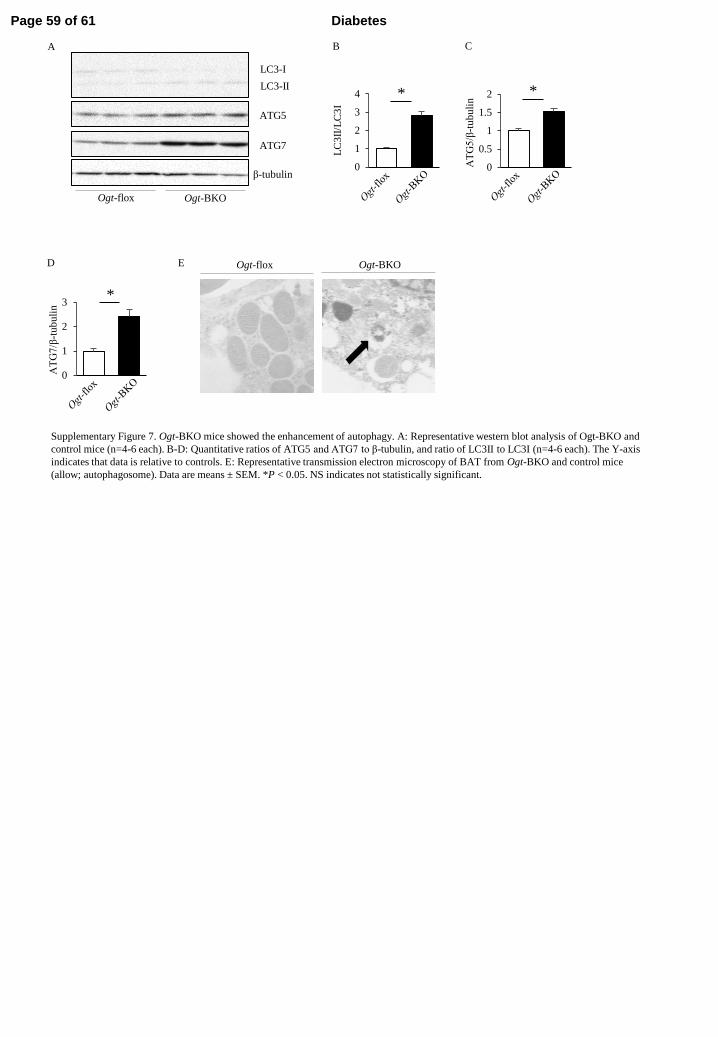
An alternative explanation for the decreased mitochondrial proteins is 374
activation of autophagy. It is known that mitochondrial homeostasis is regulated by the 375
balance between mitochondrial biogenesis and degradation (28). LC3, a regulatory 376
protein essential for induction of autophagy, localizes to autophagosome membranes 377
during autophagy activation. We found that LC3-I protein expression was decreased and 378
LC3-II protein expression was increased in Ogt-BKO mice, suggesting acceleration of 379
autophagy (Supplementary Figure 7A, B). Moreover, protein expressions of ATG5 and 380
ATG7, essential for autophagy induction, were increased in Ogt-BKO mice compared 381
with control mice (Supplementary Figure 7A, C and D). In transmission electron 382
microscopy, autophagosomes were found in Ogt-BKO mice, but not in control mice 383
(Supplementary Figure 7E). These data suggest that autophagy is enhanced in Ogt-BKO 384
mice. It has been supported that autophagy have a role in remodeling mitochondrial 385
contents and regulating adipose mass and differentiation (28; 29). It is also possible that 386
the enhancement of autophagy is a consequence of damaged mitochondria due to Ogt 387
Page 28 of 61Diabetes
29
depletion. Further examinations are necessary to reveal the relationship of dysregulated 388
mitochondrial proteins and autophagy under Ogt deletion. 389
Another interesting finding of this study was that impaired thermogenesis in 390
Ogt-KO mice was observed under fasting conditions. This effect was recovered by oral 391
intake of a normal diet or following glucose injection, but not by consumption of a fatty 392
acid-rich ketogenic diet deficient in glucose (Figure 6C, E, Supplementary Figure 8). 393
Moreover, we found a marked decrease in the protein levels of acyl-CoA 394
dehydrogenases, such as MCAD and LCAD, in Ogt-BKO mice (Figure 6H–J). 395
Therefore, the metabolic rate of fatty acid was probably decreased. A previous study in 396
mice with adipose-specific deletion of carnitine palmitoyltransferase 2 demonstrated 397
similar changes because of the lack of fatty acid oxidation (30). In addition, it has been 398
reported that PGC-1α is related to regulation of gene expression involved in fatty acid 399
oxidation (31; 32), and acute RNA interference-mediated PGC-1α knockdown leads to 400
profound downregulation of fatty acid gene expression (33). Hence, we speculate that 401
fatty acid oxidation was impaired because of the decrease of PGC-1α protein in Ogt-KO 402
mice. Collectively, O-GlcNAc modification is essential for fat oxidation in BAT. 403
Page 29 of 61 Diabetes
30
Because glucose does not need a beta-oxidation process to form acetyl-CoA, glucose 404
may be preferentially used in Ogt-KO mice to maintain body temperature and generate 405
heat even under the reduced UCP1 condition. This hypothesis is partially supported by 406
our results showing which enzymes were intact in the glycolysis pathway 407
(Supplementary Figure 6C). In addition, blood glucose levels in Ogt-BKO mice during 408
cold exposure were lower than those in control mice (Figure 6B, D). Thus, enhanced 409
glucose uptake and use in BAT of Ogt-KO mice were likely to be associated with heat 410
production during cold exposure. Thus, O-GlcNAc modification may act as a 411
“metabolic switch” in BAT and plays a crucial role in whole body glucose and lipid 412
homeostasis in cold environments. 413
Ogt deletion from both WAT and BAT resulted in reduced WAT and increased 414
BAT masses (Figure 1D–F). In contrast, Ogt-BKO mice displayed similar WAT and 415
increased BAT masses compared with control mice (Figure 4D). Because both 416
Ogt-FKO and Ogt-BKO mice displayed intolerance to cold exposure, the differences in 417
WAT have little effect on this phenotype. 418
There are two limitations to this study. First, we did not identify the direct target of 419
Page 30 of 61Diabetes
31
Ogt in BAT. Although we speculate that PGC-1α may be a potential direct target of Ogt, 420
further experiments are necessary to test this hypothesis. Second, energy expenditure 421
during hypothermia was not measured as a result of a technical issue. Because the 422
sympathetic nervous system plays a significant role in cold-induced thermogenesis, 423
further experiments such as β3 adrenergic stimulation may predict energy expenditure 424
during hypothermia. 425
In conclusion, the post-translational modification, O-GlcNAc modification 426
plays a pivotal role in cold-induced thermogenesis in BAT. The current findings provide 427
novel insights into BAT biology. 428
429
Page 31 of 61 Diabetes
32
Acknowledgements 430
We are indebted to Ms. Keiko Kosaka, Ms. Yoshiko Asano, Mr. Takefumi Yamamoto 431
and the Central Research Laboratory of Shiga University of Medical Science for their 432
expert technical assistance in this study. We thank Drs. Evan Rosen (Harvard 433
University), Wataru Ogawa and Tetsuya Hosooka (Kobe University) for providing the 434
Adipoq-Cre mice. We appreciate constructive discussion from Drs. Hiroshi Sakaue and 435
Shingo Kajimura. 436
This study was supported by Grants-in-Aid for Scientific Research (KAKENHI) from 437
the Japan Society for the Promotion of Science (No. 15K09383 to O.S. and No. 438
16K09743 to S.U.). This work was supported by a grant from the Bio & Medical 439
Technology Development Program of the National Research Foundation (NRF), which 440
is funded by the Ministry of Science, ICT & Future Planning 441
(NRF-2014M3A9D5A01073886). This study was funded by the Shiga University of 442
Medical Science. The Department of Medicine, Shiga University of Medical Science, 443
has received research promotion grants (Shogaku Kifukin) from Astellas, 444
Boehringer-Ingerheim, Daiichi-Sankyo, Kowa Pharmaceuticals, Kyowa-hakko-Kirin, 445
Page 32 of 61Diabetes
33
Mitsubishi Tanabe, MSD, Ono Pharmaceutical, Sanofi, Sanwa Kagaku Kenkyusho, 446
Shionogi, Taisho-Toyama, Takeda and Teijin Pharma. However, the research topics of 447
these donation grants are not restricted. 448
N.O., S.I., K.M., S.U. and H.M. designed the study. N.O., S.I., S.Y.P., C.S.C. and L.M. 449
conducted the research. N.O. analyzed the data. N.O., K.M. and H.M. wrote the 450
manuscript. S.K. gave constructive comments regarding the study concept. O.S., K.M., 451
S.U, S.K. and H.M. reviewed and edited the manuscript. K.M. is the guarantor of this 452
work and, as such, had full access to all the data in the study and takes responsibility for 453
the integrity of the data and the accuracy of the data analysis. All authors read and 454
approved the final manuscript. 455
456
Page 33 of 61 Diabetes
34
References
1. Rothwell NJ, Stock MJ: Effects of age on diet-induced thermogenesis and brown 457
adipose tissue metabolism in the rat. Int J Obes 1983;7:583-589 458
2. Gesta S, Tseng YH, Kahn CR: Developmental origin of fat: tracking obesity to its 459
source. Cell 2007;131:242-256 460
3. van Marken Lichtenbelt WD, Vanhommerig JW, Smulders NM, Drossaerts JM, 461
Kemerink GJ, Bouvy ND, Schrauwen P, Teule GJ: Cold-activated brown adipose tissue 462
in healthy men. N Engl J Med 2009;360:1500-1508 463
4. Bartelt A, Bruns OT, Reimer R, Hohenberg H, Ittrich H, Peldschus K, Kaul MG, 464
Tromsdorf UI, Weller H, Waurisch C, Eychmuller A, Gordts PL, Rinninger F, 465
Bruegelmann K, Freund B, Nielsen P, Merkel M, Heeren J: Brown adipose tissue 466
activity controls triglyceride clearance. Nat Med 2011;17:200-205 467
5. Efeyan A, Comb WC, Sabatini DM: Nutrient-sensing mechanisms and pathways. 468
Nature 2015;517:302-310 469
6. Hart GW, Slawson C, Ramirez-Correa G, Lagerlof O: Cross talk between 470
O-GlcNAcylation and phosphorylation: roles in signaling, transcription, and chronic 471
Page 34 of 61Diabetes
35
disease. Annu Rev Biochem 2011;80:825-858 472
7. Bond MR, Hanover JA: O-GlcNAc cycling: a link between metabolism and chronic 473
disease. Annu Rev Nutr 2013;33:205-229 474
8. Vaidyanathan K, Durning S, Wells L: Functional O-GlcNAc modifications: 475
implications in molecular regulation and pathophysiology. Crit Rev Biochem Mol Biol 476
2014;49:140-163 477
9. Ruan HB, Singh JP, Li MD, Wu J, Yang X: Cracking the O-GlcNAc code in 478
metabolism. Trends Endocrinol Metab 2013;24:301-309 479
10. Janetzko J, Walker S: The making of a sweet modification: structure and function of 480
O-GlcNAc transferase. J Biol Chem 2014;289:34424-34432 481
11. Cannon B, Nedergaard J: Brown adipose tissue: function and physiological 482
significance. Physiol Rev 2004;84:277-359 483
12. Ouellet V, Labbe SM, Blondin DP, Phoenix S, Guerin B, Haman F, Turcotte EE, 484
Richard D, Carpentier AC: Brown adipose tissue oxidative metabolism contributes to 485
energy expenditure during acute cold exposure in humans. J Clin Invest 486
2012;122:545-552 487
Page 35 of 61 Diabetes
36
13. Chaurasia B, Kaddai VA, Lancaster GI, Henstridge DC, Sriram S, Galam DL, 488
Gopalan V, Prakash KN, Velan SS, Bulchand S, Tsong TJ, Wang M, Siddique MM, 489
Yuguang G, Sigmundsson K, Mellet NA, Weir JM, Meikle PJ, Bin MYMS, Shabbir A, 490
Shayman JA, Hirabayashi Y, Shiow ST, Sugii S, Summers SA: Adipocyte Ceramides 491
Regulate Subcutaneous Adipose Browning, Inflammation, and Metabolism. Cell Metab 492
2016;24:820-834 493
14. Farmer SR: Transcriptional control of adipocyte formation. Cell Metab 494
2006;4:263-273 495
15. Seale P, Kajimura S, Yang W, Chin S, Rohas LM, Uldry M, Tavernier G, Langin D, 496
Spiegelman BM: Transcriptional control of brown fat determination by PRDM16. Cell 497
Metab 2007;6:38-54 498
16. Tseng YH, Kokkotou E, Schulz TJ, Huang TL, Winnay JN, Taniguchi CM, Tran TT, 499
Suzuki R, Espinoza DO, Yamamoto Y, Ahrens MJ, Dudley AT, Norris AW, Kulkarni RN, 500
Kahn CR: New role of bone morphogenetic protein 7 in brown adipogenesis and energy 501
expenditure. Nature 2008;454:1000-1004 502
17. Tseng YH, Cypess AM, Kahn CR: Cellular bioenergetics as a target for obesity 503
Page 36 of 61Diabetes
37
therapy. Nat Rev Drug Discov 2010;9:465-482 504
18. Saito M, Okamatsu-Ogura Y, Matsushita M, Watanabe K, Yoneshiro T, 505
Nio-Kobayashi J, Iwanaga T, Miyagawa M, Kameya T, Nakada K, Kawai Y, Tsujisaki 506
M: High incidence of metabolically active brown adipose tissue in healthy adult 507
humans: effects of cold exposure and adiposity. Diabetes 2009;58:1526-1531 508
19. Cypess AM, Lehman S, Williams G, Tal I, Rodman D, Goldfine AB, Kuo FC, 509
Palmer EL, Tseng YH, Doria A, Kolodny GM, Kahn CR: Identification and importance 510
of brown adipose tissue in adult humans. N Engl J Med 2009;360:1509-1517 511
20. Virtanen KA, Lidell ME, Orava J, Heglind M, Westergren R, Niemi T, Taittonen M, 512
Laine J, Savisto NJ, Enerback S, Nuutila P: Functional brown adipose tissue in healthy 513
adults. N Engl J Med 2009;360:1518-1525 514
21. Wu Z, Puigserver P, Andersson U, Zhang C, Adelmant G, Mootha V, Troy A, Cinti S, 515
Lowell B, Scarpulla RC, Spiegelman BM: Mechanisms controlling mitochondrial 516
biogenesis and respiration through the thermogenic coactivator PGC-1. Cell 517
1999;98:115-124 518
22. Lerin C, Rodgers JT, Kalume DE, Kim SH, Pandey A, Puigserver P: GCN5 519
Page 37 of 61 Diabetes
38
acetyltransferase complex controls glucose metabolism through transcriptional 520
repression of PGC-1alpha. Cell Metab 2006;3:429-438 521
23. Rodgers JT, Lerin C, Haas W, Gygi SP, Spiegelman BM, Puigserver P: Nutrient 522
control of glucose homeostasis through a complex of PGC-1alpha and SIRT1. Nature 523
2005;434:113-118 524
24. Jager S, Handschin C, St-Pierre J, Spiegelman BM: AMP-activated protein kinase 525
(AMPK) action in skeletal muscle via direct phosphorylation of PGC-1alpha. Proc Natl 526
Acad Sci U S A 2007;104:12017-12022 527
25. Olson BL, Hock MB, Ekholm-Reed S, Wohlschlegel JA, Dev KK, Kralli A, Reed 528
SI: SCFCdc4 acts antagonistically to the PGC-1alpha transcriptional coactivator by 529
targeting it for ubiquitin-mediated proteolysis. Genes Dev 2008;22:252-264 530
26. Trausch-Azar J, Leone TC, Kelly DP, Schwartz AL: Ubiquitin 531
proteasome-dependent degradation of the transcriptional coactivator PGC-1{alpha} via 532
the N-terminal pathway. J Biol Chem 2010;285:40192-40200 533
27. Ruan HB, Han X, Li MD, Singh JP, Qian K, Azarhoush S, Zhao L, Bennett AM, 534
Samuel VT, Wu J, Yates JR, 3rd, Yang X: O-GlcNAc transferase/host cell factor C1 535
Page 38 of 61Diabetes
39
complex regulates gluconeogenesis by modulating PGC-1alpha stability. Cell Metab 536
2012;16:226-237 537
28. Altshuler-Keylin S, Kajimura S: Mitochondrial homeostasis in adipose tissue 538
remodeling. Sci Signal 2017;10 539
29. Singh R, Xiang Y, Wang Y, Baikati K, Cuervo AM, Luu YK, Tang Y, Pessin JE, 540
Schwartz GJ, Czaja MJ: Autophagy regulates adipose mass and differentiation in mice. 541
J Clin Invest 2009;119:3329-3339 542
30. Lee J, Ellis JM, Wolfgang MJ: Adipose fatty acid oxidation is required for 543
thermogenesis and potentiates oxidative stress-induced inflammation. Cell Rep 544
2015;10:266-279 545
31. Finck BN, Kelly DP: Peroxisome proliferator-activated receptor gamma 546
coactivator-1 (PGC-1) regulatory cascade in cardiac physiology and disease. Circulation 547
2007;115:2540-2548 548
32. Finck BN, Kelly DP: PGC-1 coactivators: inducible regulators of energy 549
metabolism in health and disease. J Clin Invest 2006;116:615-622 550
33. Koo SH, Satoh H, Herzig S, Lee CH, Hedrick S, Kulkarni R, Evans RM, Olefsky J, 551
Page 39 of 61 Diabetes
40
Montminy M: PGC-1 promotes insulin resistance in liver through 552
PPAR-alpha-dependent induction of TRB-3. Nat Med 2004;10:530-534 553
Page 40 of 61Diabetes
41
Figure legends 554
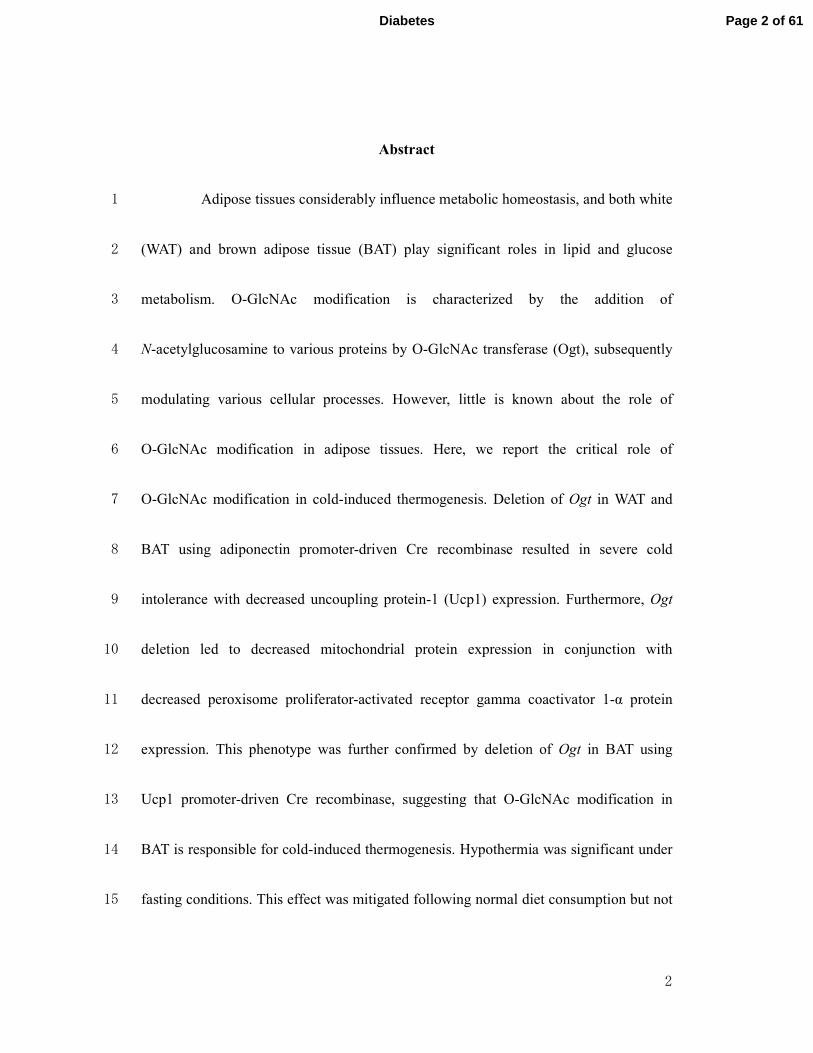
Figure 1. Ogt deletion from adipose tissues in mice significantly reduces WAT mass, but 555
increases BAT mass. 556
A: Schematic diagram of Ogt-FKO mouse generation. B: Representative western blot 557
analysis of OGT and O-GlcNAcylation (RL2) in eWAT, iWAT, and BAT. C: Body 558
weights of Ogt-FKO mice and littermate controls (n=6 each). D: Representative images 559
and weights of eWAT from Ogt-FKO mice and littermate controls (n=8 each). E: 560
Representative images and weights of iWAT from Ogt-FKO mice and littermate 561
controls (n=8 each). F: Representative images and weights of BAT from Ogt-FKO mice 562
and littermate controls (n=8 each). G: Hematoxylin and eosin staining of Ogt-FKO and 563
control mice. H: Transmission electron microscopy of BAT from Ogt-FKO and control 564
mice. I–K: Fat cell area in Ogt-FKO and control mice. Data are means ± SEM. *P < 565
0.05. NS indicates not statistically significant. 566
567
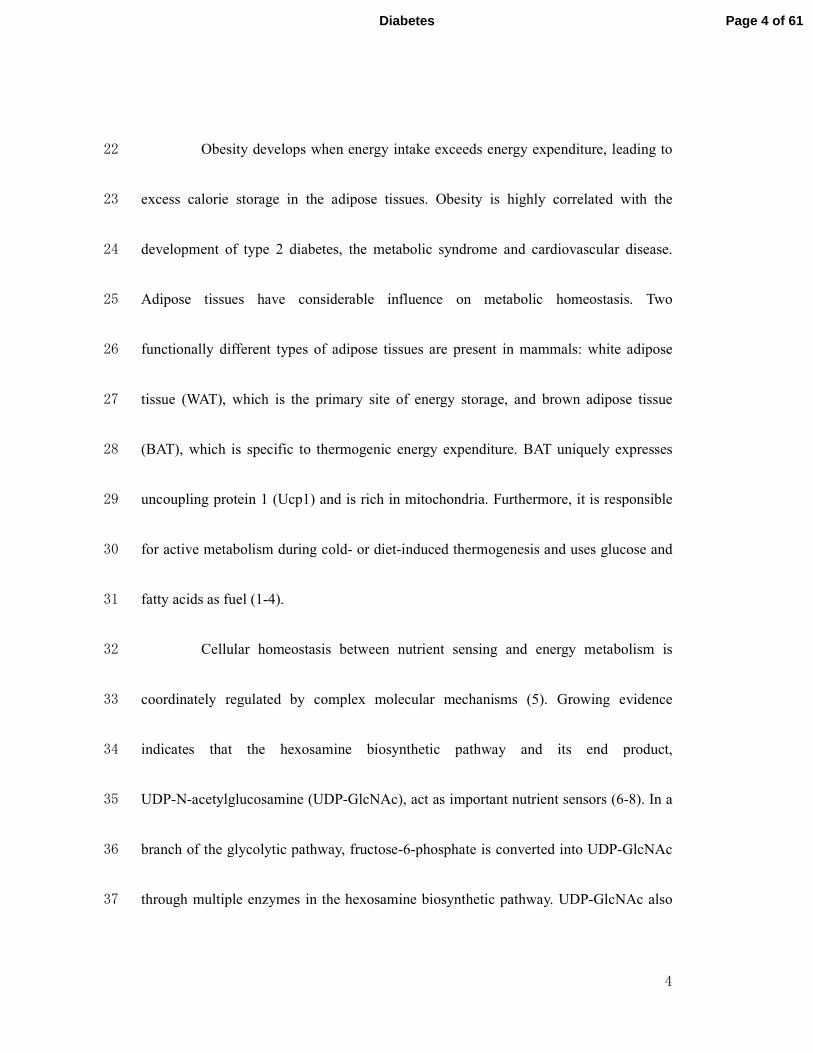
Figure 2. Ogt-FKO mice display significant intolerance to cold exposure compared with 568
control mice. 569
Page 41 of 61 Diabetes
42
A and B: Glucose changes during intraperitoneal glucose tolerance tests (IPGTTs) and 570
intraperitoneal insulin tolerance tests (IPITTs) (n=6 each). C and D: Body temperatures 571
and blood glucose levels in Ogt-FKO and control mice during cold exposure (n=8 each). 572
E: Plasma insulin levels after 3 h of cold exposure (n=8 each). F: Adipose tissue weights 573
of Ogt-FKO and control mice after 3 h of cold exposure (n=6 each). G: Hematoxylin 574
and eosin staining of Ogt-FKO and control mice at room temperature and after 3 h cold 575
of exposure. H: qPCR analysis of BAT (n=6 each). I: Western blot analysis and 576
quantification (n=6 each). The Y-axis indicates that data is relative to controls. J: 577
Representative immunohistochemical analysis of UCP1 in BAT from Ogt-FKO and 578
control mice at room temperature and after 3 h of cold exposure. K: qPCR analysis of 579
iWAT (n=6 each). Data are means ± SEM. *P < 0.05. NS indicates not statistically 580
significant. RT: room temperature. 581
582
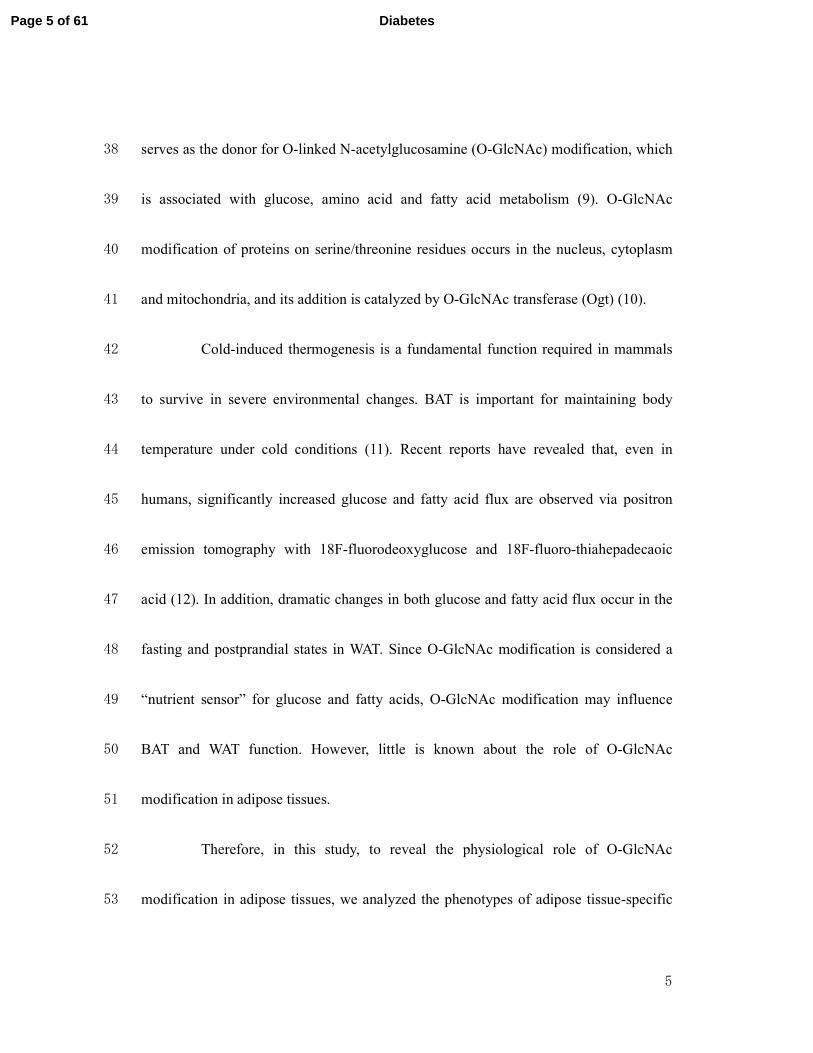
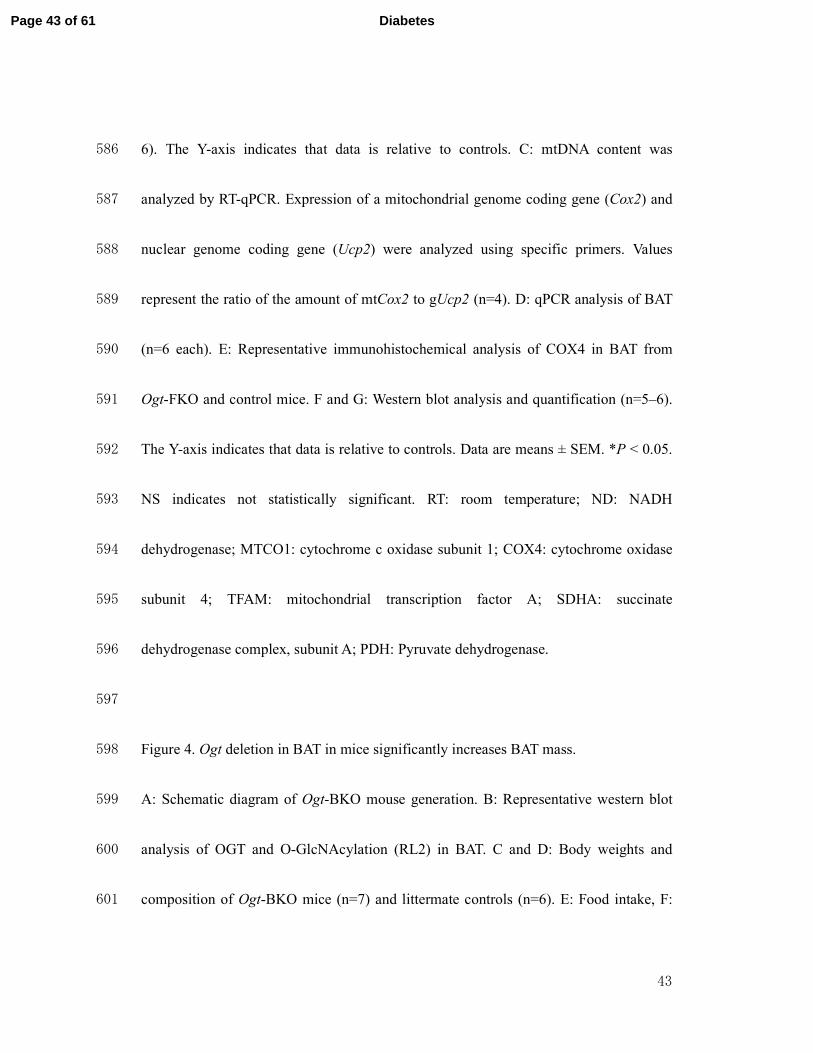
Figure 3. PGC-1α and mitochondria-related protein levels in BAT are remarkably 583
decreased in Ogt-FKO mice compared with control mice. 584
A: qPCR analysis of BAT (n=6 each). B: Western blot analysis and quantification (n=5–585
Page 42 of 61Diabetes
43
6). The Y-axis indicates that data is relative to controls. C: mtDNA content was 586
analyzed by RT-qPCR. Expression of a mitochondrial genome coding gene (Cox2) and 587
nuclear genome coding gene (Ucp2) were analyzed using specific primers. Values 588
represent the ratio of the amount of mtCox2 to gUcp2 (n=4). D: qPCR analysis of BAT 589
(n=6 each). E: Representative immunohistochemical analysis of COX4 in BAT from 590
Ogt-FKO and control mice. F and G: Western blot analysis and quantification (n=5–6). 591
The Y-axis indicates that data is relative to controls. Data are means ± SEM. *P < 0.05. 592
NS indicates not statistically significant. RT: room temperature; ND: NADH 593
dehydrogenase; MTCO1: cytochrome c oxidase subunit 1; COX4: cytochrome oxidase 594
subunit 4; TFAM: mitochondrial transcription factor A; SDHA: succinate 595
dehydrogenase complex, subunit A; PDH: Pyruvate dehydrogenase. 596
597
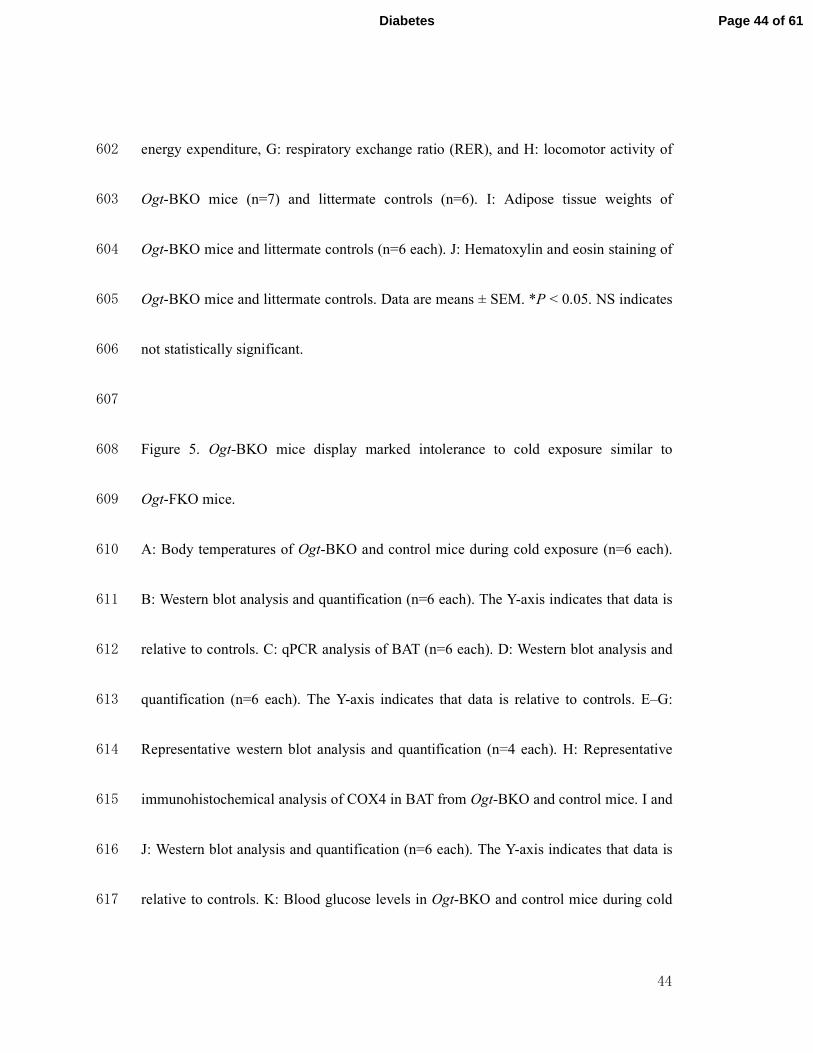
Figure 4. Ogt deletion in BAT in mice significantly increases BAT mass. 598
A: Schematic diagram of Ogt-BKO mouse generation. B: Representative western blot 599
analysis of OGT and O-GlcNAcylation (RL2) in BAT. C and D: Body weights and 600
composition of Ogt-BKO mice (n=7) and littermate controls (n=6). E: Food intake, F: 601
Page 43 of 61 Diabetes
44
energy expenditure, G: respiratory exchange ratio (RER), and H: locomotor activity of 602
Ogt-BKO mice (n=7) and littermate controls (n=6). I: Adipose tissue weights of 603
Ogt-BKO mice and littermate controls (n=6 each). J: Hematoxylin and eosin staining of 604
Ogt-BKO mice and littermate controls. Data are means ± SEM. *P < 0.05. NS indicates 605
not statistically significant. 606
607
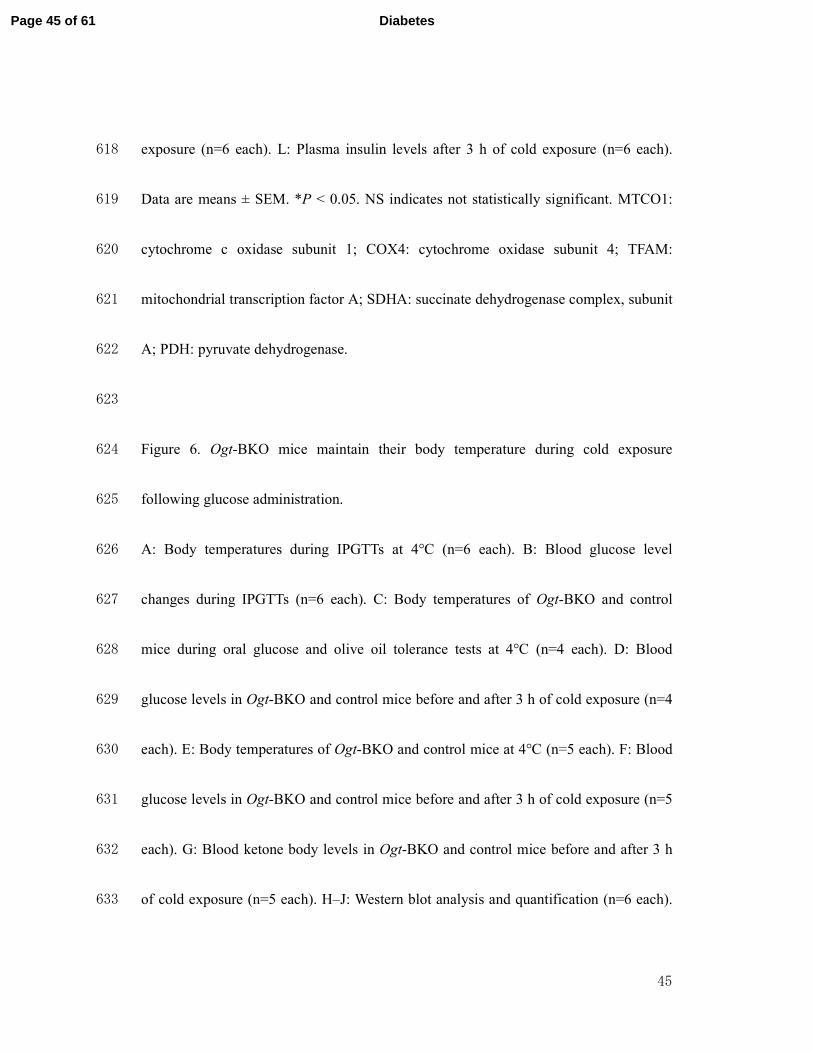
Figure 5. Ogt-BKO mice display marked intolerance to cold exposure similar to 608
Ogt-FKO mice. 609
A: Body temperatures of Ogt-BKO and control mice during cold exposure (n=6 each). 610
B: Western blot analysis and quantification (n=6 each). The Y-axis indicates that data is 611
relative to controls. C: qPCR analysis of BAT (n=6 each). D: Western blot analysis and 612
quantification (n=6 each). The Y-axis indicates that data is relative to controls. E–G: 613
Representative western blot analysis and quantification (n=4 each). H: Representative 614
immunohistochemical analysis of COX4 in BAT from Ogt-BKO and control mice. I and 615
J: Western blot analysis and quantification (n=6 each). The Y-axis indicates that data is 616
relative to controls. K: Blood glucose levels in Ogt-BKO and control mice during cold 617
Page 44 of 61Diabetes
45
exposure (n=6 each). L: Plasma insulin levels after 3 h of cold exposure (n=6 each). 618
Data are means ± SEM. *P < 0.05. NS indicates not statistically significant. MTCO1: 619
cytochrome c oxidase subunit 1; COX4: cytochrome oxidase subunit 4; TFAM: 620
mitochondrial transcription factor A; SDHA: succinate dehydrogenase complex, subunit 621
A; PDH: pyruvate dehydrogenase. 622
623
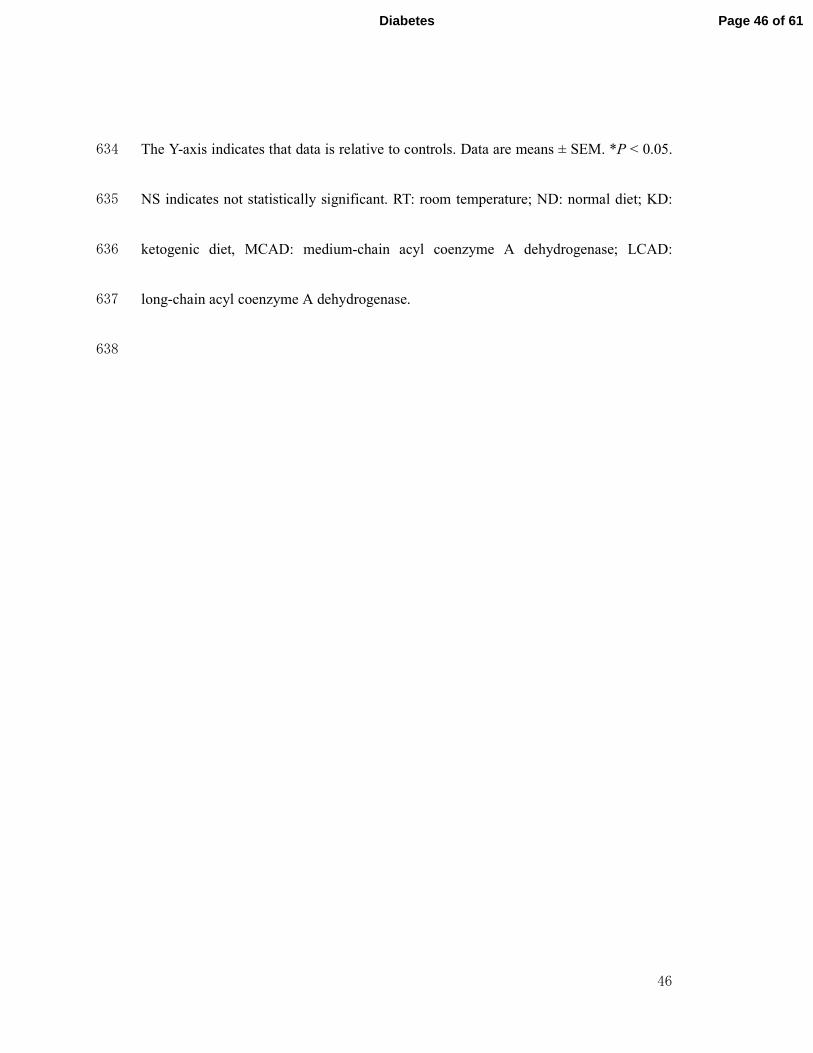
Figure 6. Ogt-BKO mice maintain their body temperature during cold exposure 624
following glucose administration. 625
A: Body temperatures during IPGTTs at 4°C (n=6 each). B: Blood glucose level 626
changes during IPGTTs (n=6 each). C: Body temperatures of Ogt-BKO and control 627
mice during oral glucose and olive oil tolerance tests at 4°C (n=4 each). D: Blood 628
glucose levels in Ogt-BKO and control mice before and after 3 h of cold exposure (n=4 629
each). E: Body temperatures of Ogt-BKO and control mice at 4°C (n=5 each). F: Blood 630
glucose levels in Ogt-BKO and control mice before and after 3 h of cold exposure (n=5 631
each). G: Blood ketone body levels in Ogt-BKO and control mice before and after 3 h 632
of cold exposure (n=5 each). H–J: Western blot analysis and quantification (n=6 each). 633
Page 45 of 61 Diabetes
46
The Y-axis indicates that data is relative to controls. Data are means ± SEM. *P < 0.05. 634
NS indicates not statistically significant. RT: room temperature; ND: normal diet; KD: 635
ketogenic diet, MCAD: medium-chain acyl coenzyme A dehydrogenase; LCAD: 636
long-chain acyl coenzyme A dehydrogenase. 637
638
Page 46 of 61Diabetes
Bod
y w
eigh
t (g
)
C
0
10
20
30
40
5 10 15 20 25 30
Weeks
B
Ogt-flox
Ogt-FKO
D
Ogt-flox Ogt-flox Ogt-FKO Ogt-FKO
eWAT iWAT
BAT
E
0
0.1
0.2
0.3
0.4
0
0.1
0.2
0.3
0.4
0
0.1
0.2
0.3
0.4
Wei
gh
t (g
)
Wei
gh
t (g
)
F
Wei
gh
t (g
)
*
*
*
Og
t-fl
ox
Og
t-F
KO
eWAT iWAT BAT
G H
I
050
100150200250300
200
600
100
0
140
0
180
0
220
0
260
0
300
0
340
0
380
0
400
0 o
ver
0100200300400500
100
300
500
700
900
110
0
130
0
150
0
170
0
190
0
200
0 o
ver
0
500
1000
1500
2000
50
150
250
350
450
550
650
750
850
950
100
0 o
ver
eWAT iWAT BAT
Ogt-flox
Ogt-FKO
Ogt-flox
Ogt-FKO
Ogt-flox
Ogt-FKO
J K
Og
t-fl
ox
Og
t-F
KO
Ad
ipocy
te n
um
ber
Ad
ipocy
te n
um
ber
Ad
ipocy
te n
um
ber
Adipocyte area(𝜇𝑈) Adipocyte area(𝜇𝑈) Adipocyte area(𝜇𝑈)
Adiponectin-Cre
♂
Cre Adiponectin
exon1
♀
Ogt
Ogt(flox/flox)
Ogt(Y/flox)
Adiponectin-Cre(+)
♂
×
Ogt(Y/flox)
Adiponectin-Cre(-)
♂
A Ogt-flox
Ogt-FKO
Figure 1
RL
2
(O-G
lcNA
cylatio
n)
OGT
β-tubulin
BAT eWAT iWAT
Page 47 of 61 Diabetes
0
10
20
30
40
0 1 2 3
0
50
100
150
200
0 1 2 3
iWAT BAT
Wei
gh
t (g
)
Hours Hours
Blo
od
glu
cose
(m
g/d
L)
Bod
y t
emp
erat
ure
(°C
)
C D
0
2
4
6
8
10
RT 4°C
Ucp
1/G
AP
DH
0
0.5
1
1.5
2
UCP1
β-tubulin
Ogt-flox Ogt-FKO H J
UCP1/β
-tu
bu
lin
K
Ogt-flox
Ogt-FKO
Ogt-flox
Ogt-FKO
0
0.1
0.2
0.3
0.4
0.5
Pla
sma
insu
lin
(n
g/m
L)
N.S.
E
*
*
Ogt-flox Ogt-FKO
RT
4
°C
G
Ogt-flox Ogt-FKO R
T
4°C
Ogt-flox
Ogt-FKO
* *
0
0.2
0.4
0.6
F
eWAT
Ogt-flox
Ogt-FKO
*
*
* *
0
100
200
300
400
0 30 60 90 120
A
Blo
od
glu
cose
(m
g/d
L)
0
50
100
150
200
0 30 60 90 120B
lood
glu
cose
(m
g/d
L)
Minutes after glucose injection
Minutes after insulin injection
Ogt-flox
Ogt-FKO
Ogt-flox
Ogt-FKO
B
Figure 2
I
UCP1
0
0.5
1
1.5
2
Cidea Cox7a1 Prdm16
Ogt-flox
Ogt-FKO N.S.
N.S. N.S.
mR
NA
exp
ress
ion/G
AP
DH
Page 48 of 61Diabetes
MTCO1
COX4
PDH
SDHA
TFAM
β-tubulin
0
0.5
1
1.5
2
ND1 ND2 ND3 ND4 ND5 mR
NA
of
mtD
NA
-en
cod
ed g
ene
/GA
PD
H
Ogt-flox Ogt-FKO
Ogt-flox
Ogt-FKO
D
F
0
0.5
1
1.5
2
Ogt-flox
Ogt-FKO
Fold
ch
ange
G
Ogt-flox Ogt-FKO
* * * * *
* * * * N.S.
0
2
4
6
8
10
RT 4°C
PGC-1α
β-tubulin
A B
0
0.5
1
1.5
2
N.S.
N.S.
Ogt-flox
Ogt-FKO
*
Pp
arg
c1a/G
AP
DH
Ogt-flox Ogt-FKO
PG
C-1α/β
-tu
bu
lin
E
Figure 3
COX4
C
0
0.5
1
1.5
2
mtD
NA
con
ten
ts
fold
ch
ange
N.S.
Page 49 of 61 Diabetes

Ucp1-Cre
♂
Cre Ucp1
exon1
♀
Ogt
Ogt(flox/flox)
Ogt(Y/flox)
Ucp1-Cre(+)
×
Ogt(Y/flox)
Ucp1-Cre(-)
A B
0
10
20
30
40
5 10 15 20 25 30
Bod
y w
eigh
t (g
)
C
Weeks
Ogt-flox
Ogt-BKO
D
0
1
2
3
4
5
N.S.
Food
in
tak
e (g
/day
)
E
0
500
1000
1500 N.S.
Act
ivit
y (
cou
nt/
hr)
H
0
5
10
15
20N.S.
En
ergy e
xp
end
itu
re (
kca
l/k
g/h
r)
F
0
0.5
1
1.5
N.S.
RE
R
G
Ogt-flox
Ogt-BKO
♂
♂
0
10
20
30
40
Bod
y c
om
posi
tion
(g)
Body
weight
Fat Lean
Ogt-flox
Ogt-BKO
N.S.
N.S.
N.S.
I
0
0.2
0.4
0.6
iWAT BAT
Wei
gh
t (g
)
eWAT
Ogt-flox
Ogt-BKO
* N.S.
N.S.
Og
t-fl
ox
Og
t-B
KO
eWAT iWAT BAT
J
Figure 4
RL
2
(O-G
lcNA
cylatio
n)
OGT
β-tubulin
BAT eWAT iWAT
Page 50 of 61Diabetes
0
10
20
30
40
0 1 2 3
Bod
y t
emp
erat
ure
(°C
)
Ogt-flox
Ogt-BKO
Ogt-flox Ogt-BKO
UCP1
β-tubulin
Hours
0
0.5
1
1.5
2
PGC-1α
β-tubulin
0
0.5
1
1.5
0
0.5
1
1.5
2
A B C
*
*
* *
N.S.
UCP1/β
-tu
bu
lin
Ogt-flox Ogt-BKO
PG
C-1α/β
-tu
bu
lin
D
Pp
arg
c1a/G
AP
DH
Figure 5
OGT
PGC-1α
Ubiquitin
β-tubulin 0
1
2OGT/β
-tu
bu
lin
0
1
2
PG
C-1α/β
-tu
bu
lin
Ogt-flox Ogt-BKO Ogt-flox Ogt-BKO
MG132(-) MG132(+) MG132(-) MG132(+) MG132(-) MG132(+)
E F G
*
Hours
Blo
od
glu
cose
(m
g/d
L)
K
0
0.2
0.4
0.6
Pla
sma
insu
lin
(n
g/m
L)
L
*
0
50
100
150
200
0 1 2 3
Ogt-flox
Ogt-BKO
MTCO1
COX4
PDH
SDHA
TFAM
β-tubulin
Ogt-flox Ogt-BKO
I
Ogt-flox Ogt-BKO
H
COX4
J
0
0.5
1
1.5
2
Ogt-flox
Ogt-BKO
Fold
ch
ange * * * * *
* *
Page 51 of 61 Diabetes
0
100
200
300
400
0 30 60 90 120
* *
20
25
30
35
40
0 1 2
Bod
y t
emp
erat
ure
(°C
)
Hours
Blo
od
glu
cose
(m
g/d
L)
Ogt-flox
Ogt-BKO
Ogt-flox (RT)
Ogt-BKO (RT)
Ogt-BKO (4 °C)
Ogt-flox (4 °C)
B A
20
25
30
35
40
0 1 2 3
*
Ogt-flox (ND)
Ogt-BKO (ND)
Ogt-BKO (KD)
Ogt-flox (KD)
Bod
y t
emp
erat
ure
(°C
)
Hours
Minutes after glucose injection
0
1
2
3K
eton
e b
od
ies
(μmol/
L)
E G
Og
t-fl
ox
(ND
)
Og
t-B
KO
(ND
)
Og
t-fl
ox
(KD
)
Og
t-B
KO
(KD
)
before
after 3-hour
C D
0
100
200
300
F
Blo
od
glu
cose
(m
g/d
L)
before
after 3-hour
Og
t-fl
ox
(ND
)
Og
t-B
KO
(ND
)
Og
t-fl
ox
(KD
)
Og
t-B
KO
(KD
)
Figure 6
0
10
20
30
40
0 1 2 3
Ogt-flox (glucose)
Ogt-BKO (glucose)
Ogt-BKO (olive oil)
Ogt-flox (olive oil)
Bod
y t
emp
erat
ure
(°C
)
Hours
* *
0
100
200
300
Ogt-
flox
(glu
cose
)
Ogt-
BK
O
(glu
cose
)
Ogt-
flox
(oli
ve
oil
)
Ogt-
BK
O
(oli
ve
oil
) Blo
od
glu
cose
(m
g/d
L)
before
after 3-hour
*
*
N.S.
0
0.5
1
1.5
LCAD/β
-tu
bu
lin
*
LCAD
MCAD
H
β-tubulin
I
0
0.5
1
1.5
MCAD/β
-tu
bu
lin
J
*
Page 52 of 61Diabetes
Ogt-flox Ogt-FKO Ogt-flox Ogt-BKO
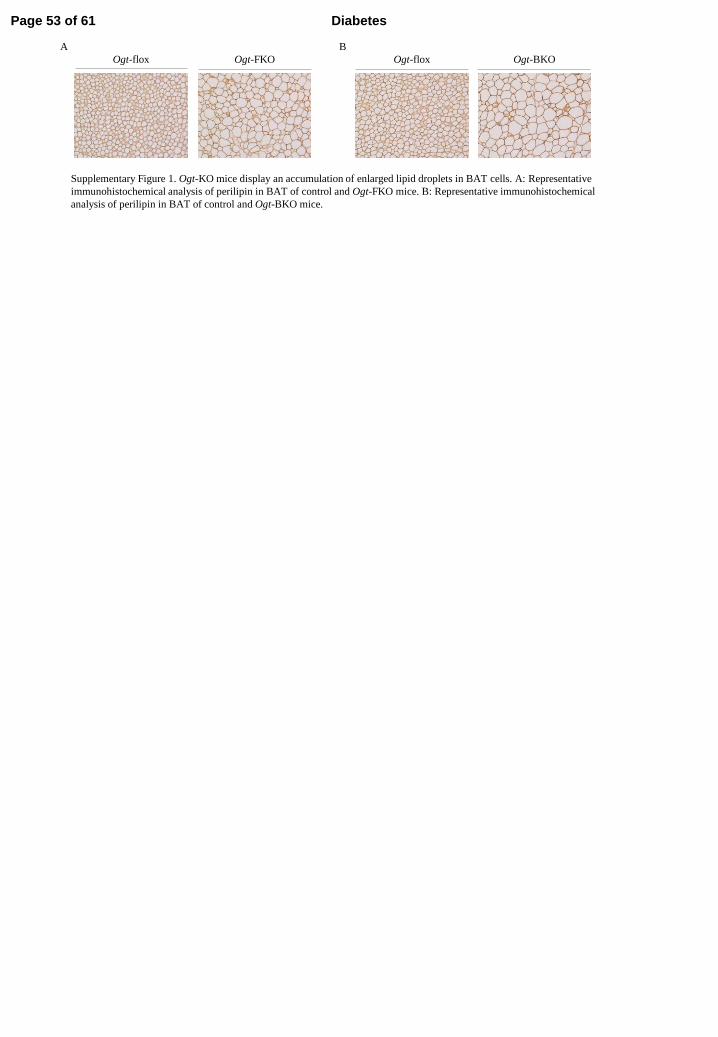
Supplementary Figure 1. Ogt-KO mice display an accumulation of enlarged lipid droplets in BAT cells. A: Representative
immunohistochemical analysis of perilipin in BAT of control and Ogt-FKO mice. B: Representative immunohistochemical
analysis of perilipin in BAT of control and Ogt-BKO mice.
A B
Page 53 of 61 Diabetes

pCREB
CREB
Ogt-flox Ogt-FKO
0
0.5
1
1.5
2N.S.
pC
RE
B/C
RE
B
pP
KA
sub
strate β
-tub
ulin
Ogt-flox Ogt-FKO
HSL
pHSL(serp563)
Ogt-flox Ogt-FKO Ogt-flox Ogt-FKO
HSL
pHSL(serp660)
0
0.5
1
1.5
2N.S.
pH
SL
(ser
p5
63)/
HS
L
0
0.5
1
1.5
2N.S.
pH
SL
(ser
p6
60)/
HS
L
A B C D
Supplementary Figure 2. Ogt-FKO mice show no significant changes in expression levels of proteins associated with the β-
AR/PKA/CREB axis. A-D: Western blot analysis and its quantification (n=6 each). The Y-axis indicates that data is relative to controls.
Data are means ± SEM. NS indicates not statistically significant.
CREB: cAMP response element-binding protein, pPKA: phosho-(Ser/Thr) protein kinase A substrate, HSL: hormone sensitive lipase.
Page 54 of 61Diabetes
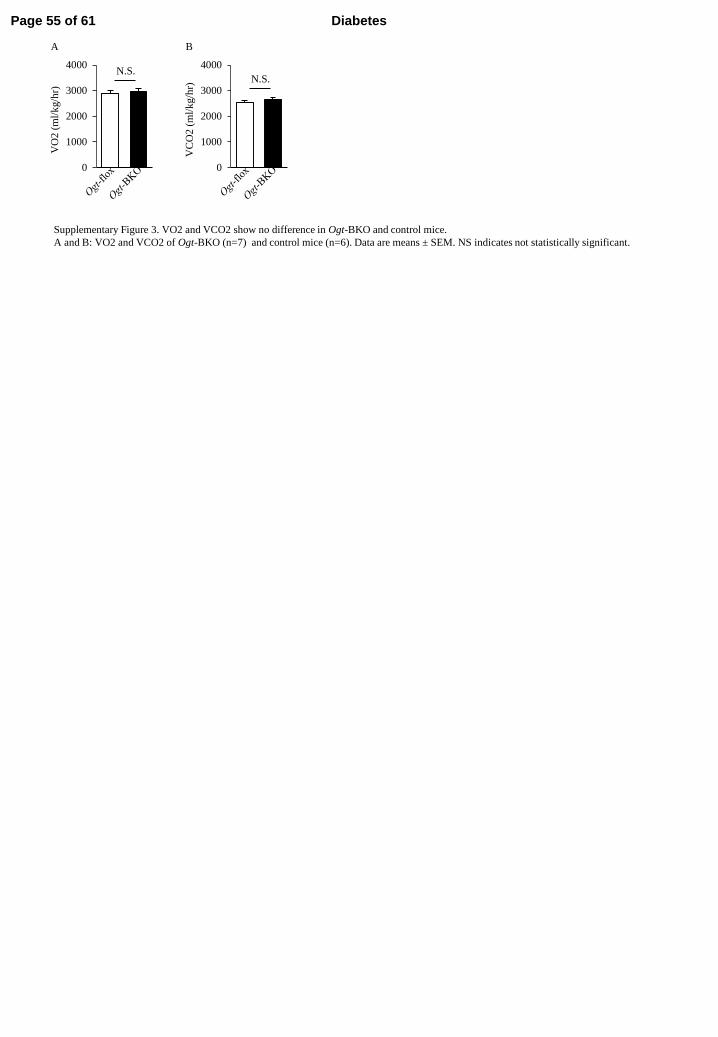
Supplementary Figure 3. VO2 and VCO2 show no difference in Ogt-BKO and control mice.
A and B: VO2 and VCO2 of Ogt-BKO (n=7) and control mice (n=6). Data are means ± SEM. NS indicates not statistically significant.
i
0
1000
2000
3000
4000N.S.
VO
2 (
ml/
kg/h
r)
A
0
1000
2000
3000
4000
N.S.
VC
O2
(m
l/k
g/h
r)
B
Page 55 of 61 Diabetes
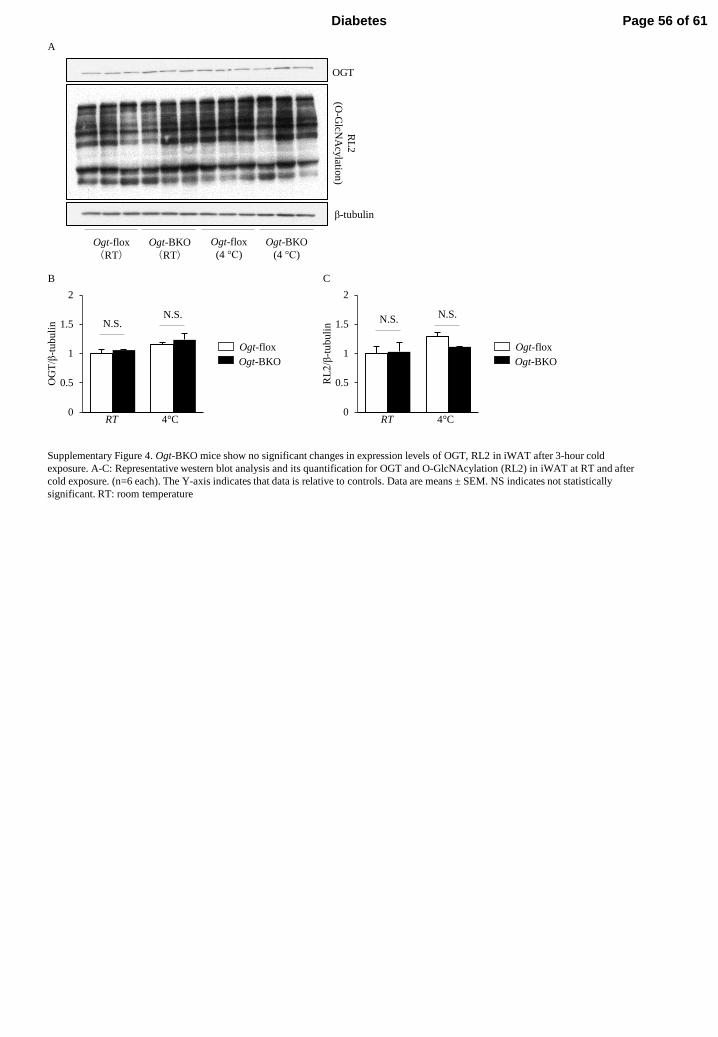
Supplementary Figure 4. Ogt-BKO mice show no significant changes in expression levels of OGT, RL2 in iWAT after 3-hour cold
exposure. A-C: Representative western blot analysis and its quantification for OGT and O-GlcNAcylation (RL2) in iWAT at RT and after
cold exposure. (n=6 each). The Y-axis indicates that data is relative to controls. Data are means ± SEM. NS indicates not statistically
significant. RT: room temperature
A
Ogt-flox
(RT)
Ogt-BKO
(RT)
Ogt-BKO
(4 °C)
Ogt-flox
(4 °C)
OGT
β-tubulin
RL
2
(O-G
lcNA
cylatio
n)
0
0.5
1
1.5
2
B
Ogt-flox
Ogt-BKO
RT 4°C
OG
T/β
-tu
bu
lin
0
0.5
1
1.5
2
C
RL
2/β
-tu
bu
lin
RT 4°C
Ogt-flox
Ogt-BKO
N.S. N.S. N.S.
N.S.
Page 56 of 61Diabetes
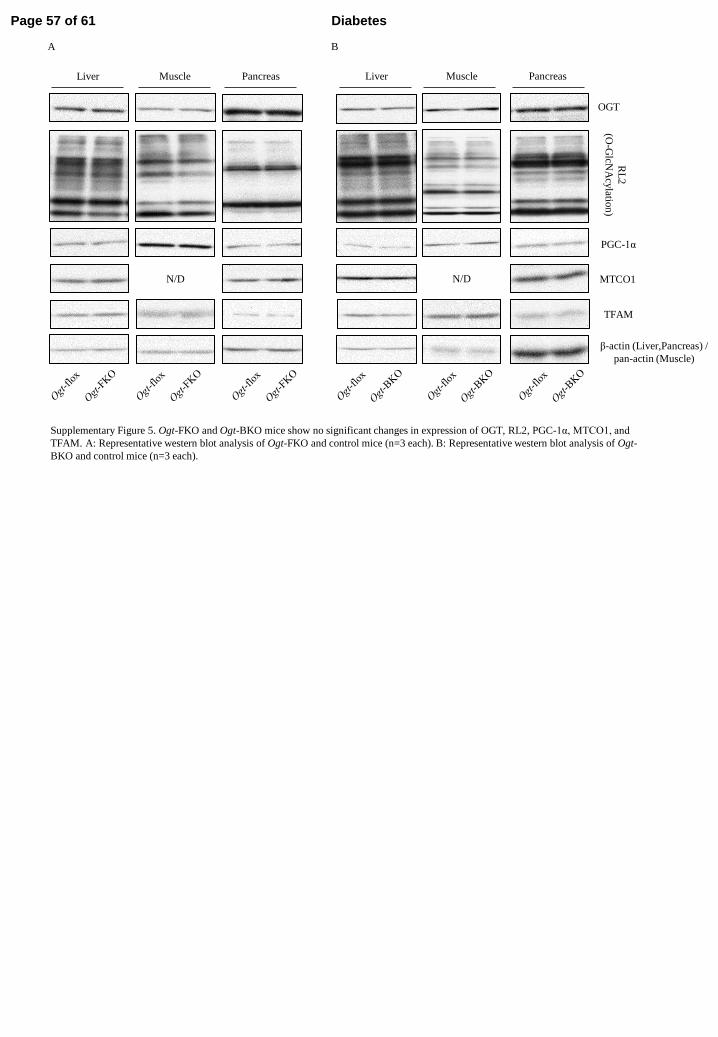
Supplementary Figure 5. Ogt-FKO and Ogt-BKO mice show no significant changes in expression of OGT, RL2, PGC-1α, MTCO1, and
TFAM. A: Representative western blot analysis of Ogt-FKO and control mice (n=3 each). B: Representative western blot analysis of Ogt-
BKO and control mice (n=3 each).
Pancreas Liver Muscle Pancreas Liver Muscle
RL
2
(O-G
lcNA
cylatio
n)
OGT
β-actin (Liver,Pancreas) /
pan-actin (Muscle)
PGC-1α
TFAM
A B
MTCO1 N/D N/D
Page 57 of 61 Diabetes
β-tubulin
HSL
ATGL
A B
Supplementary Figure 6. Ogt-BKO mice show no significant changes in expression of ATGL, HSL. A: Representative western blot
analysis of Ogt-BKO and control mice (n=6 each). B: Quantitative ratios of ATGL and HSL to β-tubulin (n=6 each). The Y-axis indicates
that data is relative to controls. C: qPCR analysis of BAT (n=4 each). Data are means ± SEM, NS indicates not statistically significant.
Glut4: Glucose transporter 4; Pfk1: Phosphofructokinase 1; Pgk1: Phosphoglycerate kinase 1, Pk: Pyruvate kinase
0
1
2
ATGL HSL
Ogt-flox
Ogt-BKO
N.S. N.S.
Fold
ch
ange
0
0.5
1
1.5
2
gen
e ex
pre
ssio
n/G
AP
DH
Glut4 Pfk1 Pgk1 Pk
Ogt-flox
Ogt-BKO
N.S. N.S. N.S.
N.S.
C
Page 58 of 61Diabetes
ATG5
ATG7
β-tubulin
LC3-I
LC3-II
0
1
2
3
AT
G7
/β-t
ub
uli
n
*
Ogt-flox Ogt-BKO
Supplementary Figure 7. Ogt-BKO mice showed the enhancement of autophagy. A: Representative western blot analysis of Ogt-BKO and
control mice (n=4-6 each). B-D: Quantitative ratios of ATG5 and ATG7 to β-tubulin, and ratio of LC3II to LC3I (n=4-6 each). The Y-axis
indicates that data is relative to controls. E: Representative transmission electron microscopy of BAT from Ogt-BKO and control mice
(allow; autophagosome). Data are means ± SEM. *P < 0.05. NS indicates not statistically significant.
A
D E
0
0.5
1
1.5
2
AT
G5
/β-t
ub
uli
n *
B C
0
1
2
3
4
LC
3II
/LC
3I
*
Ogt-flox Ogt-BKO
Page 59 of 61 Diabetes

20
25
30
35
40
0 1 2 3
Bod
y t
emp
erat
ure
(°C
)
Hours
20
25
30
35
40
0 1 2 3
Bod
y t
emp
erat
ure
(°C
)
Hours
Ogt-flox (glucose)
Ogt-FKO (glucose)
Ogt-FKO (olive oil)
Ogt-flox (olive oil)
Ogt-flox (ND)
Ogt-FKO (ND)
Ogt-FKO (KD)
Ogt-flox (KD)
*
Supplementary Figure 8. Ogt-FKO mice fed a normal diet can maintain body temperature, but Ogt-FKO mice fed a ketogenic diet can not.
A and B: Body temperatures of Ogt-FKO and control mice at 4°C (n=5 each). Data are means ± SEM. *P < 0.05. NS indicates not
statistically significant. ND: normal diet; KD: ketogenic diet.
A B
*
Page 60 of 61Diabetes
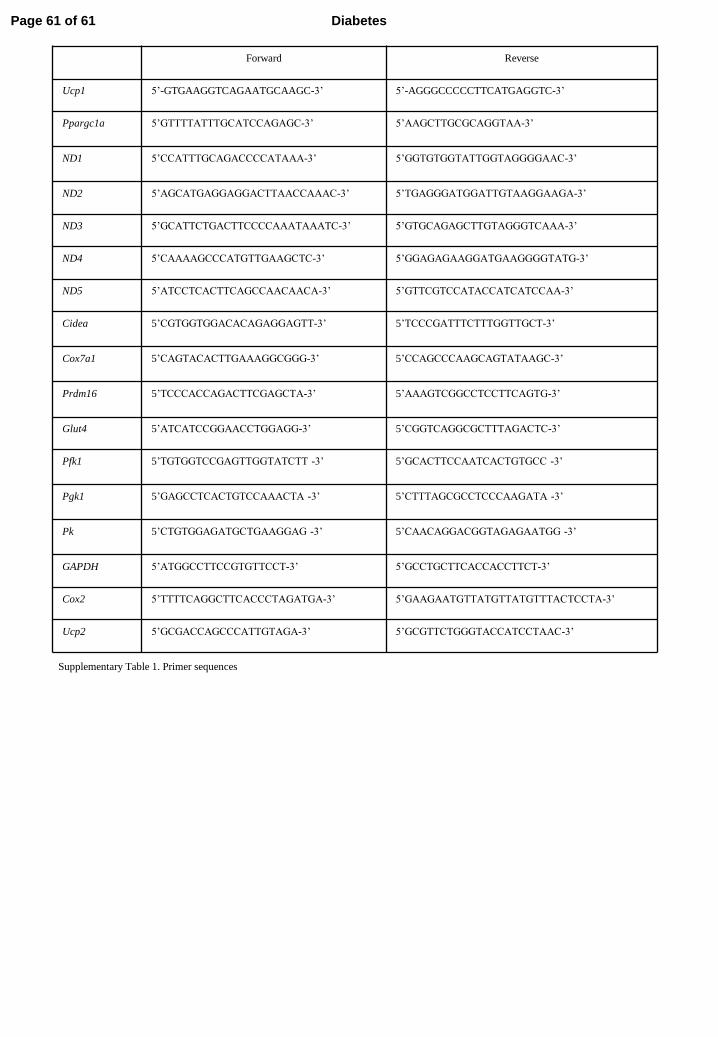
Supplementary Table 1. Primer sequences
Forward Reverse
Ucp1 5’-GTGAAGGTCAGAATGCAAGC-3’ 5’-AGGGCCCCCTTCATGAGGTC-3’
Ppargc1a
5’GTTTTATTTGCATCCAGAGC-3’ 5’AAGCTTGCGCAGGTAA-3’
ND1
5’CCATTTGCAGACCCCATAAA-3’ 5’GGTGTGGTATTGGTAGGGGAAC-3’
ND2 5’AGCATGAGGAGGACTTAACCAAAC-3’ 5’TGAGGGATGGATTGTAAGGAAGA-3’
ND3 5’GCATTCTGACTTCCCCAAATAAATC-3’ 5’GTGCAGAGCTTGTAGGGTCAAA-3’
ND4 5’CAAAAGCCCATGTTGAAGCTC-3’ 5’GGAGAGAAGGATGAAGGGGTATG-3’
ND5 5’ATCCTCACTTCAGCCAACAACA-3’ 5’GTTCGTCCATACCATCATCCAA-3’
Cidea 5’CGTGGTGGACACAGAGGAGTT-3’
5’TCCCGATTTCTTTGGTTGCT-3’
Cox7a1
5’CAGTACACTTGAAAGGCGGG-3’
5’CCAGCCCAAGCAGTATAAGC-3’
Prdm16 5’TCCCACCAGACTTCGAGCTA-3’
5’AAAGTCGGCCTCCTTCAGTG-3’
Glut4 5’ATCATCCGGAACCTGGAGG-3’ 5’CGGTCAGGCGCTTTAGACTC-3’
Pfk1 5’TGTGGTCCGAGTTGGTATCTT -3’
5’GCACTTCCAATCACTGTGCC -3’
Pgk1 5’GAGCCTCACTGTCCAAACTA -3’
5’CTTTAGCGCCTCCCAAGATA -3’
Pk 5’CTGTGGAGATGCTGAAGGAG -3’
5’CAACAGGACGGTAGAGAATGG -3’
GAPDH 5’ATGGCCTTCCGTGTTCCT-3’ 5’GCCTGCTTCACCACCTTCT-3’
Cox2 5’TTTTCAGGCTTCACCCTAGATGA-3’ 5’GAAGAATGTTATGTTATGTTTACTCCTA-3’
Ucp2 5’GCGACCAGCCCATTGTAGA-3’ 5’GCGTTCTGGGTACCATCCTAAC-3’
Page 61 of 61 Diabetes