page 1 of 37 - s3.amazonaws.coms3.amazonaws.com/futuremark-static/downloads/3dmark_technical... ·...
TRANSCRIPT

Page 1 of 37

Page 2 of 37
What is 3DMark?
3DMark is a benchmark designed to measure the performance of computer hardware. This
version includes three different tests, each designed for a specific type of hardware ranging
from smartphones to high-performance gaming PCs. More tests will be added over time.
3DMark works by running intensive graphical and computational tests on your hardware.
The more powerful your hardware, the smoother the tests will run. Don't be surprised if your
frame rates are low as 3DMark tests are very demanding.
Each test gives a score, which you can use to compare similar devices and systems. Unlike
previous versions, there is no overall 3DMark score, only individual test scores. When testing
devices or components, be sure to use the most appropriate test for the hardware's
capabilities and report your results using the full name of the test, for example:
CORRECT "Video card scores 5,800 in 3DMark Cloud Gate benchmark."
WRONG "Video card scores 5,800 in 3DMark benchmark."
3DMark is used by millions of gamers, hundreds of hardware review sites and many of the
world's leading manufacturers. We are proud to say that 3DMark is the world's most popular
and widely used benchmark.
What's new in this version?
Cross-platform benchmarking
With the new 3DMark, for the first time, you can measure the performance of Windows,
Windows RT, Android and iOS devices and directly compare scores across all four platforms.
Check the Futuremark website for the latest information on cross-platform availability.
Please note that the more demanding tests requiring more advanced hardware will only be
available in the Windows versions of 3DMark initially.
Complete Windows benchmarking toolkit
On Windows, this version of 3DMark is the first to include tests for DirectX 11, DirectX 10,
and DirectX 9 level hardware within one application. All three tests, even those targeting
DirectX 9 and DirectX 10 compatible hardware are powered by modern DirectX 11 engines
using Direct3D feature levels. The new 3DMark is best and most versatile benchmark we
have ever created.

Page 3 of 37
3DMark lingo
This version is simply called 3DMark to reflect its all-round versatility. Not only is this
3DMark the first in the series to offer cross-platform comparisons, it is also the first to test
different Direct3D feature levels within one application.
Please avoid referring to this new version by any other name.
CORRECT 3DMark
WRONG 3DMark 12, 3DMark 2013, 3DMark Next, 3DMark for Windows
3DMark includes Benchmark Tests for measuring the performance of hardware and
devices. Please do not abbreviate or use symbols for individual tests.
CORRECT "My phone can hardly run the Ice Storm test."
WRONG "My phone can hardly run the IS test."
Tests may also have a number of Presets, predefined settings that scale the workloads to
match a specific range of hardware capabilities. Please do not abbreviate individual presets.
CORRECT "My PC struggles to run the Fire Strike Extreme preset."
WRONG "My new PC struggles to run the Fire Strike E preset."
Each Test may generate one or more component scores such as a Physics score, Graphics
score or Combined score.
"My 3DMark Cloud Gate Physics score is lower than expected."
Component scores are generated from one or more parts, individual workloads designed to
focus on a specific combination of effect and techniques.
In summary
3DMark The name of the application
Fire Strike Benchmark Test
Extreme Preset
Graphics test Component score Part 2 Component test part
"What is your 3DMark Fire Strike Extreme Graphics test part 2 score?"

Page 4 of 37
About this guide
Last updated September 9, 2013
Latest version numbers
Windows Windows RT Android iOS
3DMark GUI 1.1.0 Not yet released 1.1.0.1179 1.1.0
Ice Storm 1.1 n/a 1.2 1.2
Cloud Gate 1.1 n/a n/a n/a
Fire Strike 1.1 n/a n/a n/a
Test compatibility
Ice Storm Cloud Gate Fire Strike
Windows ● ● ●
Windows RT ● ✕1 ✕1
Android ● ✕ ✕
Apple iOS ● ✕ ✕
1 These tests will be added to 3DMark Windows RT Edition when there are publicly available Windows
RT devices that support DirectX feature level 10 and feature level 11.

Page 5 of 37
System requirements
Windows
Minimum Recommended
OS Windows Vista2 Windows 7 or Windows 8
Processor 1.8 GHz dual-core Intel or AMD CPU 1.8 GHz dual-core Intel or AMD CPU
Memory 2 GB 4GB
Graphics3 DirectX 94 DirectX 11 with 1 GB graphics memory5
Storage 3 GB free disk space 3 GB free disk space
Windows RT
Minimum
OS Windows RT
Memory 1 GB
Device All Windows RT devices
Storage 164 MB
2 Windows Vista users must install the DirectX 11 platform update from Microsoft.
3 3DMark Ice Storm requires 128 MB video card memory, Cloud Gate requires 256 MB video card memory, Fire Strike requires 1 GB video card memory, and Fire Strike Extreme requires 1.5 GB video card memory and 4 GB system memory. Video cards with less memory than specified can usually run the test but at the expense of a considerable performance penalty.
4 DirectX 9 hardware needs Shader Model 3.0 support, 128 MB and WDDM 1.1 drivers. Note that ATI Radeon X1x00 series cards do not have WDDM 1.1 drivers available and cannot run 3DMark. The oldest cards confirmed to work with 3DMark are Radeon HD 2x00 series (Ice Storm, Cloud Gate), NVIDIA GeForce 7x00 series (Ice Storm) and Intel GMA X4500 (Ice Storm).
5 Graphics hardware that supports all DirectX 11 features is required to run all tests in 3DMark.

Page 6 of 37
Android
Minimum
OS Android 3.1
Memory 1 GB
Graphics OpenGL ES 2.0 compatible
Storage 155 MB
Apple iOS
Minimum
OS iOS 6.0
Memory 512 MB
Device iPhone 4, iPad 2, iPod touch (5th Gen)
Storage 174 MB

Page 7 of 37
Does 3DMark use DirectX 11.1?
Yes, but only in a minor way and with a fallback for DirectX 11 to ensure compatibility with
the widest range of hardware and to ensure that all tests work with Windows Vista and
Windows 7 as well as Windows 8.
DirectX 11.1 API features were evaluated and those that could be utilized to accelerate the
rendering techniques in the tests designed to run on DirectX 11.0 were used.
Discard resources and resource views
In cases where subsequent Direct3D draw calls will overwrite the entire resource or resource
view and the application knows this, but it is not possible for the display driver to deduce it, a
discard call is made to help the driver in optimizing resource usage. If DirectX 11.1 is not
supported, a clear call or no call at all is made instead, depending on the exact situation. This
DX11.1 optimization may have a performance effect with multi-GPU setups or with hardware
featuring tile based rendering, which is found in some tablets and entry-level notebooks.
16 bpp texture formats
The 16 bpp texture formats supported by DirectX 11.1 are used on Ice Storm game tests to
store intermediate rendering results during post processing steps. If support for those
formats is not found, 32 bpp formats are used instead. This optimization gives a noticeable
performance effect on hardware such as tablets, entry-level notebooks for which the Ice
Storm tests provide a suitable benchmark.
There are no visual differences between the tests when using DX11 or DX11.1 in 3DMark and
the practical performance difference from these optimizations is limited to Ice Storm on very
low-end Windows hardware, and on Windows RT.

Page 8 of 37
Good testing guide
To get accurate and consistent benchmark results you should test clean systems without
third party software installed. If this is not possible, you should close as many background
tasks as possible, especially automatic updates or tasks that feature pop-up alerts such as
email and messaging programs.
If you are testing a mobile device, it is a good idea to close apps that may be running in the
background, and disable notifications before running the benchmark. Some high-powered
mobile devices use thermal throttling to avoid overheating the CPU, which can lead to lower
scores on successive runs. To reduce this effect, we recommended waiting 15 minutes
before and after 3DMark runs to allow the device to cool down.
Running other programs and tasks during the benchmark can affect the results.
Avoid touching the mouse, keyboard or touchscreen while the tests are running.
Do not change the window focus while the benchmark is running.
Press the ESC key (PC) or Back Button (Android) if you want to stop the test.
How to set up your hardware or device
1. Install all system updates to ensure your operating system is up to date.
2. Install the latest approved drivers for your hardware.
3. Restart the computer or device.
4. Wait 2 minutes for startup to complete.
5. Close all other programs, especially those that run in the background or task bar.
6. Wait for 15 minutes.
7. Run the benchmark test.
8. Repeat from step 3 at least three times to verify that the results are consistent.

Page 9 of 37
3DMark settings
The settings found on the Help tab (Windows) and Settings screen (Windows RT, Android
and iOS) apply to all 3DMark benchmark tests available in that version.
Run demo
Uncheck this box if you wish to skip the demo. This option is selected by default.
Register / Unregister
If you have a 3DMark Advanced or Professional Edition upgrade key, copy it into the box and
press the Register button. If you wish to unregister your key, so you can move your license to
a different machine for example, press the Unregister button.
Automatically view results online
When this box is checked 3DMark will automatically open a browser window allowing you to
view your results on the Futuremark website after you complete a benchmark run. This
option is selected by default and cannot be disabled in 3DMark Basic Edition.
Automatically hide results online
Check this box if you wish to keep your 3DMark test scores private. Hidden results are not
visible to other users and do not appear in search results. Hidden results are not eligible for
competitions or the Futuremark Overclocking Hall of Fame. This option is disabled by default
and cannot be selected in 3DMark Basic Edition.
Scan SystemInfo
SystemInfo is a component used by Futuremark benchmarks to identify the hardware in
your system or device. It does not collect any personally identifiable information. This option
is selected by default and is required in order to get a valid benchmark test score.
SystemInfo hardware monitoring
This option controls whether SystemInfo monitors your CPU temperature, clock speed,
power, and other hardware information during the benchmark run. This option is selected
by default.
Demo audio
Uncheck this box if you wish to turn off the soundtrack while a demo is running. This option
is selected by default.
GPU count
You can use this drop down to tell 3DMark how many GPUs are present in the system you
are testing. The default choice, automatic, is fine in most cases and should only be changed
in the rare instances when SystemInfo is unable to correctly identify the system's hardware.

Page 10 of 37
Scaling mode
This option controls how the rendered output of each test, which is at a fixed resolution
regardless of hardware, is scaled to fit the native resolution of the system's display or screen.
The default option is Letterbox, which maintains the aspect ratio of the rendered output and
adds bars to the top and bottom of the image to fill the remainder of the screen. Selecting
Stretched will stretch the rendered output to fill the screen without preserving the original
aspect ratio. This option does not affect the test score.
Language
Use this drop down to change the display language. The choices are English, German,
Traditional Chinese and Simplified Chinese.
Custom settings
Each test has its own settings, found on the Custom tab (Windows) or Settings screen
(Windows RT, Android and iOS), which you can adjust to explore the limits of your
hardware's performance.
On Windows platforms, these custom settings are only available in 3DMark Advanced and
Professional Editions.
You will only get an official 3DMark test score when you run a test with the default settings
or one of the predefined Presets. When using custom settings you will still get the results
from individual sub-tests as well as hardware performance monitoring information.

Page 11 of 37
Page 12 of 37
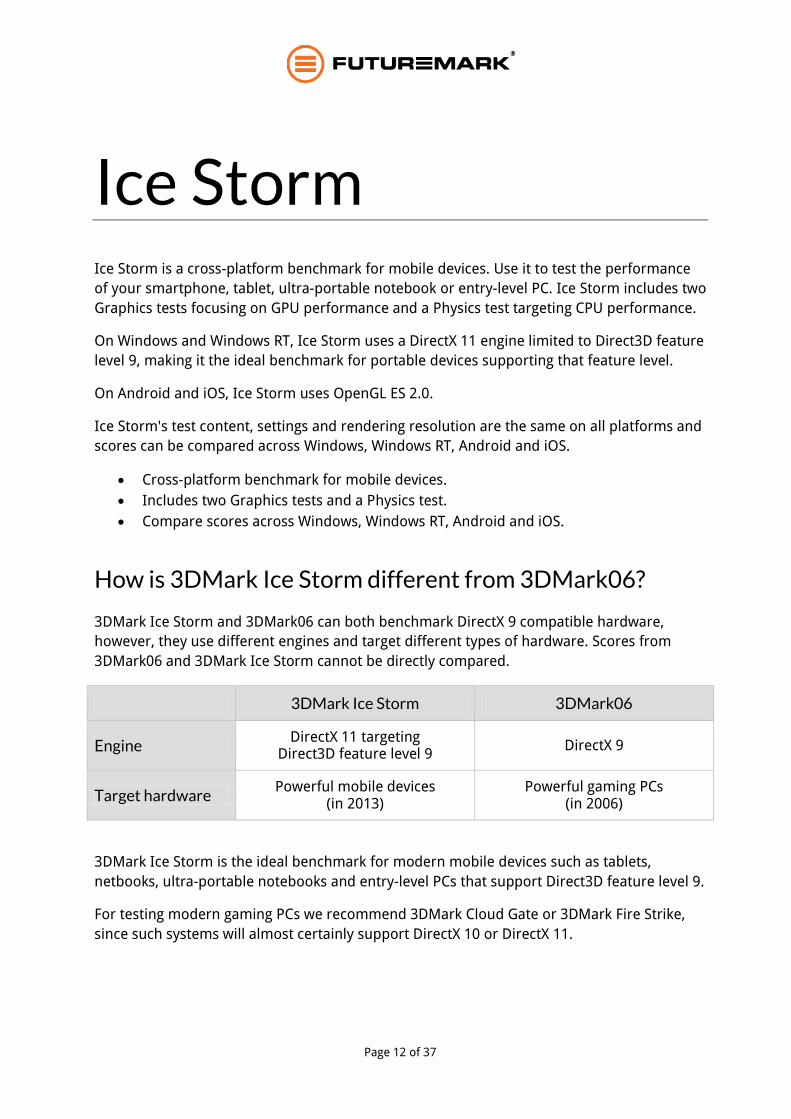
Ice Storm Ice Storm is a cross-platform benchmark for mobile devices. Use it to test the performance
of your smartphone, tablet, ultra-portable notebook or entry-level PC. Ice Storm includes two
Graphics tests focusing on GPU performance and a Physics test targeting CPU performance.
On Windows and Windows RT, Ice Storm uses a DirectX 11 engine limited to Direct3D feature
level 9, making it the ideal benchmark for portable devices supporting that feature level.
On Android and iOS, Ice Storm uses OpenGL ES 2.0.
Ice Storm's test content, settings and rendering resolution are the same on all platforms and
scores can be compared across Windows, Windows RT, Android and iOS.
Cross-platform benchmark for mobile devices.
Includes two Graphics tests and a Physics test.
Compare scores across Windows, Windows RT, Android and iOS.
How is 3DMark Ice Storm different from 3DMark06?
3DMark Ice Storm and 3DMark06 can both benchmark DirectX 9 compatible hardware,
however, they use different engines and target different types of hardware. Scores from
3DMark06 and 3DMark Ice Storm cannot be directly compared.
3DMark Ice Storm 3DMark06
Engine DirectX 11 targeting
Direct3D feature level 9 DirectX 9
Target hardware Powerful mobile devices
(in 2013) Powerful gaming PCs
(in 2006)
3DMark Ice Storm is the ideal benchmark for modern mobile devices such as tablets,
netbooks, ultra-portable notebooks and entry-level PCs that support Direct3D feature level 9.
For testing modern gaming PCs we recommend 3DMark Cloud Gate or 3DMark Fire Strike,
since such systems will almost certainly support DirectX 10 or DirectX 11.

Page 13 of 37
Ice Storm
Rendering resolution 1280x720 (720p)
GPU memory budget 128 MB
Texture quality Low
Bloom resolution 1/8
Use Ice Storm for device-to-device comparisons of mainstream mobile devices. Ice Storm is
rendered at a fixed 720p resolution ("off-screen rendering") and then scaled to the native
resolution of the display. This is the best approach for ensuring that devices can be
compared fairly.
Many mobile devices lock their display refresh rate to 60Hz and force the use of vertical sync.
If your device is able to run this test at more than 60 frames per second you will be
prompted to run Ice Storm Extreme instead.
Ice Storm Extreme
Graphics tests rendering resolution 1920x1080 (1080p)
Physics test rendering resolution 1280x720 (720p)
GPU memory budget 256 MB
Texture Quality High
Bloom resolution 1/4
Use Ice Storm Extreme for device-to-device comparisons of high performance mobile
devices. Ice Storm Extreme raises the rendering resolution from 720p to 1080p and uses
higher quality textures and post-processing effects in the Graphics tests to create a more
demanding load for the latest smartphones and tablets. The Physics test runs at 720p to
ensure the result is not influenced by the GPU.
Many mobile devices lock or limit their display refresh rate to 60Hz and force the use of
vertical sync. If your device is able to run this test at more than 60 frames per second you
will be prompted to run Ice Storm Unlimited instead.

Page 14 of 37
Ice Storm Unlimited
Graphics tests rendering resolution 1280x720 (720p)
Physics test rendering resolution 1280x720 (720p)
GPU memory budget 128 MB
Texture Quality Low
Bloom resolution 1/8
How does Unlimited differ from the other tests?
Ice Storm and Ice Storm Extreme measure the performance of the complete device. The
nature of the test content and the methods used to render it to the screen are the same as
typically used in the latest graphically demanding games. These two benchmark tests are the
best choice when you want to measure the real-world performance of a device and make
device-to-device comparisons.
Ice Storm Unlimited is a different type of benchmark test designed for making chip-to-chip
comparisons of the hardware inside a device. The test provides an accurate and consistent
way to measure the potential performance capability of chipsets, CPUs, GPUs and APUs
without vertical sync, display resolution scaling and other operating system factors affecting
the result.
In Unlimited mode the rendering engine uses a fixed time step between frames and renders
exactly the same frames in every run on every device. The frames are rendered in 720p
resolution "offscreen" while the display is updated with frame thumbnails every 100 frames
to show progress.
Comparing scores
Scores from 3DMark Ice Storm, Ice Storm Extreme and Ice Storm Unlimited should not be
compared to each other - they are separate tests with their own scores, even though they
share the same content.
Scores from individual tests can be compared across platforms. Ice Storm Unlimited will be
added to 3DMark Windows Edition soon.

Page 15 of 37
Graphics test 1
Ice Storm Graphics test 1 stresses the hardware’s ability to process lots of vertices while
keeping the pixel load relatively light. Hardware on this level may have dedicated capacity for
separate vertex and pixel processing. Stressing both capacities individually reveals the
hardware’s limitations in both aspects. Pixel load is kept low by excluding expensive post
processing steps, and by not rendering particle effects.
Processing performed in an average frame
Vertices Triangles Pixels6
Ice Storm
530,000 180,000 1.9 million
Ice Storm Extreme
580,000 190,000 4.4 million
Graphics test 2
Graphics test 2 stresses the hardware’s ability to process lots of pixels. It tests the ability to
read textures, do per pixel computations and write to render targets. The additional pixel
processing compared to Graphics test 1 comes from including particles and post processing
effects such as bloom, streaks and motion blur. The numbers of vertices and triangles are
considerably lower than in Graphics test 1 because shadows are not drawn and the
processed geometry has a lower number of polygons.
Processing performed in an average frame
Vertices Triangles Pixels6
Ice Storm
79,000 26,000 7.8 million
Ice Storm Extreme
89,000 28,000 18.6 million
6 This figure is the average number of pixels processed per frame before the image is scaled to fit the
native resolution of the device being tested. If the device’s display resolution is greater than the test’s rendering resolution, the actual number of pixels processed per frame will be even greater.

Page 16 of 37
Physics test
The purpose of the Physics test is to benchmark the hardware’s ability to do gameplay
physics simulations on CPU. The GPU load is kept as low as possible to ensure that only the
CPU’s capabilities are stressed.
The test has four simulated worlds. Each world has two soft bodies and two rigid bodies
colliding with each other. One thread per available CPU core is used to run simulations. All
physics are computed on the CPU with soft body vertex data updated to the GPU each frame.
The background is drawn as a static image for the least possible GPU load.
The Physics test uses the Bullet Open Source Physics Library.
Ice Storm engine
Ice Storm uses the same engine on all platforms. The engine supports the following features. Traditional forward rendering using one pass per light. Scene updating and visibility computations are multithreaded. Draw calls are issued from a single thread. Support for skinned and static geometries. Surface lighting model is basic Blinn Phong. Supported light types include unshadowed point light and optionally shadow mapped
directional light as well as pre-computed environmental cube. Support for transparent geometries and particle effects. 16-bit color formats are used in illumination buffers if supported by the hardware.
Windows
On Windows and Windows RT, Ice Storm requires support for Direct3D feature level 9_3 or
9_1 with the optional shadow filtering support.
Android
Ice Storm does not use any vendor specific OpenGL ES 2.0 extensions. Textures are
compressed using ETC. Textures that require an alpha channel are loaded uncompressed.
iOS
Textures, including those with an alpha channel, are compressed using PVRTC.

Page 17 of 37
Windows edition change log
3DMark Windows Edition v1.1.0 – May 6, 2013
New
Added Ice Storm Extreme preset to 3DMark Advanced and Professional Editions.
3DMark Windows Editions v1.0.0 – February 4, 2013
Launch version.
Android edition change log
3DMark Android Edition v1.1.0.1179 – September 9, 2013
New
New Ice Storm Unlimited test, see main app description for details.
Compare 3DMark scores with Apple iOS devices in the Device Channel.
Improved
Forced vertical sync on Android devices limits apps to displaying a maximum of 60
frames per second. Your score will be shown as "Maxed out" if your device hits the
vertical sync limit during a test.
3DMark will recommend the best test for your device to avoid vertical sync limits.
Compatibility
Nexus 7 (2013) is correctly identified.
3DMark Android Edition v1.0.3-1138 - August 20, 2013
Compatibility
Added a workaround for a driver bug on Nexus 7 devices running Android 4.3.

Page 18 of 37
3DMark Android Edition v1.0.2-1109 - May 2, 2013
New
Added chipset model to device detail pages.
Improved
Ice Storm Extreme Physics test for measuring CPU performance now runs at 720p to
ensure the result is not influenced by the GPU. Ice Storm Extreme scores may
improve slightly on devices with low-end GPUs.
Optimized
Faster image loading in the Device Channel.
Better score bar scaling in search result lists.
Reduced app size to 149 MB.
Compatibility
Automatically skip demo on devices with TI OMAP 44xx chipset to avoid a memory-
related crash. There will be some visual corruption during the Physics test however
this does not affect the score and you will now be able to complete all the tests on
these devices.
Automatically skip demo if the device runs out of memory during the demo, typically
on devices with 512 MB of memory. The recommended minimum device memory for
3DMark is 1 GB (1024 MB).
Fixed
Fixed a bug that prevented your best score being shown as your Highest Score.
My Device now shows the Android OS version installed on the current device. Device
Channel detail pages show the Android OS version shipped with the model.
3DMark Android Edition v1.0.1-949 – April 11, 2013
New
You can now search the Device Channel.
You can now report unknown and incorrectly identified devices.
Fixed
Fixed a bug that caused crashes for some users.
Fixed the "no score" bug that could cause the test to exit after the demo.

Page 19 of 37
The Device Channel list loads faster and uses less memory.
3DMark Android Edition v1.0.0 – April 2, 2013
Launch version.
Added Ice Storm Extreme test for the latest smartphones and tablets.
iOS edition change log
3DMark iOS Edition v1.1.0 – September 9, 2013
Launch version.

Page 20 of 37

Page 21 of 37
Cloud Gate Cloud Gate is a new test designed for Windows notebooks and typical home PCs. It is a
particularly good benchmark for systems with integrated graphics. Cloud Gate includes two
graphics tests and a physics test. The benchmark uses a DirectX 11 engine limited to
Direct3D feature level 10 making it suitable for testing DirectX 10 compatible hardware.
Cloud Gate is only available in the Windows edition of 3DMark.
Designed for typical home PCs and notebooks.
DirectX 11 engine supporting DirectX 10 hardware.
Includes two graphics tests and a physics test.
3DMark Cloud Gate and 3DMark Vantage compared
3DMark Vantage and 3DMark Cloud Gate are both benchmarks for DirectX 10 compatible
hardware. The difference is in the engine powering each benchmark.
3DMark Vantage, released in April 2008, uses a DirectX 10 engine. 3DMark Cloud Gate uses a
DirectX 11 engine limited to Direct3D feature level 10. Using Direct3D feature levels is the
modern approach to game engine design as it allows developers to use a DirectX 11 engine
and still support older generation hardware all the way down to DirectX 9 level models.
We recommend using 3DMark Cloud Gate for testing DirectX 10 based systems. Scores from
3DMark Vantage and 3DMark Cloud Gate cannot be directly compared.
Cloud Gate default settings
Rendering Resolution 1280x720
GPU memory Budget 256 MB
Shadow Sample Count 4
Shadow Map Resolution 1024
Depth of Field Quality Low
Bloom Resolution 1/8

Page 22 of 37
Graphics test 1
Cloud Gate Graphics test 1 has an emphasis on geometry processing while having simple
shaders. Volumetric illumination is disabled, but the scene contains particle effects. FFT
based bloom effects and a depth of field effect are added as post processing steps.
Processing performed in an average frame
Vertices Triangles Pixels7
Cloud Gate 3.0 million 1.1 million 15.6 million
Graphics test 2
Cloud Gate Graphics test 2 has shaders that are more mathematically complex than Graphics
test 1, but has less geometry to process. Simple volumetric illumination is used, but the
scene has no particle effects. Post processing steps are similar to Graphics test 1.
Processing performed in an average frame
Vertices Triangles Pixels7
Cloud Gate 1.8 million 690,000 16.3 million
Physics test
The Cloud Gate Physics test benchmarks the hardware’s ability to run gameplay physics
simulations on CPU. The GPU load is kept as low to ensure that only the CPU is stressed.
The test has 32 simulated worlds. Each world has 4 soft bodies, 4 joints and 20 rigid bodies
colliding with each other. The rigid bodies are invisible and are there to cause the blast effect
on the soft bodies.
The simulations run on one thread per available CPU core. All physics are computed on the
CPU with soft body vertex data updated to the GPU each frame. Each world also has one CPU
simulated particle system. The Physics test uses a forward renderer for minimum GPU load.
7 This figure is the average number of pixels processed per frame before the image is scaled to fit the
native resolution of the device being tested. If the device’s display resolution is greater than the test’s rendering resolution, the actual number of pixels processed per frame will be even greater.

Page 23 of 37
The test duration is 20 seconds but the score calculation begins after 8 seconds. The first 8
seconds skipped to allow all simulated objects to actively participate in simulation.
The Cloud Gate Physics test uses the Bullet Open Source Physics Library.
Cloud Gate engine
Cloud Gate tests use same engine as Fire Strike, but with a reduced set of features including
a simplified lighting model and some fallbacks implemented for Direct3D feature level 10.
On Windows and Windows RT, Cloud Gate requires graphics hardware with support for
Direct3D feature level 10 or greater.
Change log
3DMark Windows Edition v1.1.0 – May 6, 2013
No changes to Cloud Gate in this update.
3DMark Windows Editions v1.0.0 – February 4, 2013
Launch version

Page 24 of 37

Page 25 of 37
Fire Strike Fire Strike is the new showcase DirectX 11 benchmark for high-performance gaming PCs.
Using a multi-threaded DirectX 11 engine, Fire Strike includes two graphics tests, a physics
test and a combined test designed to stress the CPU and GPU at the same time.
3DMark Advanced and Professional Editions include an additional Extreme preset for high-
end systems with multiple GPUs. Fire Strike is only available in the Windows editions of
3DMark initially.
Designed for high-performance gaming PCs.
Extreme preset for multi-GPU systems.
Stunning DirectX 11 showcase graphics.
How is 3DMark Fire Strike different from 3DMark 11?
3DMark 11 is a DirectX 11 benchmark that was released in December 2010. 3DMark Fire
Strike is a second generation DirectX 11 benchmark and is the more modern and demanding
of the two. Scores from 3DMark 11 and 3DMark Fire Strike cannot be directly compared.
3DMark Fire Strike 3DMark 11
Engine DirectX 11 DirectX 11
Default setting rendering resolution
1920x1080 (1080p) 1280x720 (720p)
Extreme preset rendering resolution
2560x1440 (1440p) 1920x1080 (1080p)
While 3DMark 11's Entry preset can prove useful for testing entry-level hardware, in most
cases we recommend using 3DMark Fire Strike for testing DirectX 11 based systems.

Page 26 of 37
Fire Strike default settings
Resolution 1920x1080
GPU Memory Budget 1 GB
Tessellation Detail Medium
Surface Shadow Sample Count 8
Shadow Map Resolution 1024
Volume Illumination Quality Medium
Particle Illumination Quality Medium
Ambient Occlusion Quality Medium
Depth of Field Quality Medium
Bloom Resolution 1/4
Fire Strike Extreme settings
Resolution 2560x1440
GPU Memory Budget 1.5 GB
Tessellation Detail High
Surface Shadow Sample Count 16
Shadow Map Resolution 2048
Volume Illumination Quality High
Particle Illumination Quality High
Ambient Occlusion Quality High
Depth of Field Quality High
Bloom Resolution 1/4

Page 27 of 37
How is the Extreme preset different from default settings?
3DMark Fire Strike Extreme is a modified version of 3DMark Fire Strike designed for high-end
multi-GPU (SLI/Crossfire) systems and future hardware generations. In addition to the higher
rendering resolution, additional visual quality improvements increase the rendering load to
ensure accurate performance measurements for truly extreme hardware setups.
Scores from 3DMark Fire Strike and Fire Strike Extreme should not be compared to each
other - they are separate tests with their own scores, even if they share the same benchmark
content. The Extreme preset is the highest workload 3DMark can currently offer.
Graphics test 1
3DMark Fire Strike Graphics test 1 focuses on geometry and illumination. Particles are drawn
at half resolution and dynamic particle illumination is disabled.
There are 100 shadow casting spot lights and 140 non-shadow casting point lights in the
scene. Compute shaders are used for particle simulations and post processing. Pixel
processing is lower than in Graphics test 2 as there is no depth of field effect.
Processing performed in an average frame
Vertices Tessellation
patches Triangles Pixels
8
Compute shader invocations
Fire Strike
3.9 million 500,000 5.1 million 80 million 1.5 million
Fire Strike Extreme
3.9 million 560,000 9.9 million 150 million 3.5 million
Graphics test 2
3DMark Fire Strike Graphics test 2 focuses on particles and GPU simulations. Particles are
drawn at full resolution and dynamic particle illumination is enabled.
There are two smoke fields simulated on GPU. Six shadow casting spot lights and 65 non-
shadow casting point lights are present. Compute shaders are used for particle and fluid
simulations and for post processing steps. Post processing includes a depth of field effect.
8 This figure is the average number of pixels processed per frame before the image is scaled to fit the
native resolution of the device being tested. If the device’s display resolution is greater than the test’s rendering resolution, the actual number of pixels processed per frame will be even greater.

Page 28 of 37
Processing performed in an average frame
Vertices Tessellation
patches Triangles Pixels
8
Compute shader invocations
Fire Strike
2.6 million 240,000 5.8 million 170 million 8.1 million
Fire Strike Extreme
3.9 million 260,000 12.9 million 400 million 10.4 million
Physics test
3DMark Fire Strike Physics test benchmarks the hardware’s ability to run gameplay physics
simulations on the CPU. The GPU load is kept as low as possible to ensure that only the CPU
is stressed. The Bullet Open Source Physics Library is used as the physics library for the test.
The test has 32 simulated worlds. One thread per available CPU core is used to run
simulations. All physics are computed on CPU with soft body vertex data updated to GPU
each frame.
Combined test
3DMark Fire Strike Combined test stresses both the GPU and CPU simultaneously. The GPU
load combines elements from Graphics test 1 and 2 using tessellation, volumetric
illumination, fluid simulation, particle simulation, FFT based bloom and depth of field.
The CPU load comes from the rigid body physics of the breaking statues in the background.
There are 32 simulation worlds running in separate threads each containing one statue
decomposing into 113 parts. Additionally there are 16 invisible rigid bodies in each world
except the one closest to camera to push the decomposed elements apart. The simulations
run on one thread per available CPU core.
The 3DMark Fire Strike Combined test uses the Bullet Open Source Physics Library.
Processing performed in an average frame
Vertices Tessellation
patches Triangles Pixels
8
Compute shader invocations
Fire Strike
7.5 million 530,000 7.9 million 150 million 110 million
Fire Strike Extreme
9.2 million 540,000 14.8 million 390 million 110 million

Page 29 of 37
Fire Strike engine
Multithreading
The multithreading model is based on DX11 deferred device contexts and command lists.
The engine utilizes one thread per available CPU core. One of the threads is considered as
the main thread, which uses both immediate device context and deferred device context.
The other threads are worker threads, which use only deferred device contexts.
Rendering workload is distributed between the threads by distributing items (e.g. geometries
and lights) in the rendered scene to the threads. Each thread is assigned roughly equal
amount of scene items.
When rendering a frame, each thread does the work associated to items assigned to the
thread. That includes, for example, computation of transformation matrix hierarchies,
computation of shader parameters (constants buffer contents and dynamic vertex data) and
recording of DX API calls to a command list. When the main thread is finished with the tasks
associated to its own items, it executes the command lists recorded by worker threads.
Tessellation
The engine supports rendering with and without tessellation. The supported tessellation
techniques are PN Triangles, Phong, and displacement map based detail tessellation. Both
triangle and quad based tessellation is supported.
Tessellation factors are adjusted to achieve desired edge length for output geometry on the
render target. Additionally, patches that are back facing and patches that are outside of the
view frustum are culled by setting the tessellation factor to zero.
Tessellation is turned entirely off by disabling hull and domain shaders when size of object’s
bounding box on render target drops below a given threshold. This applies both to g-buffer
and shadow map drawing.
Lighting
Lighting is done in deferred style. Geometry attributes are first rendered to a set of render
targets. Ambient occlusion is then computed from depth and normal data. Finally
illumination is rendered based on those attributes.
Page 30 of 37
Surface illumination
Two different surface shading models and g-buffer compositions are supported. The more
complex model uses four textures and depth texture as the g-buffer. The simpler model uses
two textures and depth texture.
Surface illumination model is either combination of Oren-Nayar diffuse reflectance and
Cook-Torrance specular reflectance or basic Blinn Phong reflectance model. Simple surface
shading model is used on Feature Level 10 demo and tests while the complex model is used
on Feature Level 11 demo and tests. Optionally atmospheric attenuation is also computed.
Horizon based screen space ambient occlusion can be applied to the surface illumination.
Point, spot and directional lights are supported. Spot and directional lights can be shadowed.
For spot lights, shadow texture size is selected based on size of the light volume in screen
space. Shadow maps are sampled using best candidate sample distribution. Sample pattern
is dithered with 4x4 pixel pattern.
Volumetric illumination
The renderer supports volume illumination. It is computed by approximating the light
scattered towards the viewer by the medium between eye and the visible surface on each lit
pixel. The approximation is based on volume ray casting and the Rayleigh-Mie scattering and
attenuation model.
One ray is cast on each lit pixel for each light. The cast ray is sampled at several depth levels.
Sampling quality is improved by dithering sampling depths with a 4x4 pixel pattern. The
achieved result is blurred to combine the different sampling depths on neighboring pixels
before combining the volume illumination with the surface illumination.
When rendering illumination, there are two high dynamic range render targets. One is for
surface illumination and the other for volume illumination.
Particle illumination
Particle effects are rendered on top of opaque surface illumination with additive or alpha
blending. Particles are simulated on the GPU. Particles can be either simply self-illuminated
or receive illumination from scene lights.
Lights that participate in particle illumination can be individually selected. To illuminate
particles, the selected lights are rendered to three volume textures that are fitted into view
frustum. The textures contain incident radiance in each texel stored as spherical harmonics.
Each of the three textures holds data for one color channel storing four coefficients. Incident
radiance from each light is rendered to these volume textures as part of light rendering.

Page 31 of 37
When rendering illuminated particles, hull and domain shaders are enabled. Incident
radiance volume texture sampling is done in the domain shader. Tessellation factors are set
to produce fixed size triangles in screen pixels. Tessellation is used to avoid sampling
incident radiance textures in the pixel shader.
Particles can cast shadows on opaque surface and on other particles. For generating particle
shadows, particle transmittance is first rendered to a 3D texture. The transmittance texture
is rendered from the shadow casting light like a shadow map. After particles have been
rendered to the texture, an accumulated transmittance 3D texture is generated by
accumulating values of each depth slice in the transmittance texture. The accumulated
transmittance texture can then be sampled when rendering illumination or incident radiance
that is used to illuminate particles.
Post-processing
Particle based distortion
Particles can be used to generate a distortion effect. For particles that generate the effect, a
distortion field is rendered to a texture using a 3D noise texture as input. This field is then
used to distort the input image in post processing phase.
Depth of field
The effect is computed using the following procedure:
1. Circle of confusion radius is computed for all screen pixels and stored in a full
resolution texture.
2. Half and quarter resolution versions are made from the radius texture and the
original illumination texture.
3. Positions of out-of-focus pixels whose circle of confusion radius exceeds a predefined
threshold are appended to a buffer.
4. The position buffer is used as point primitive vertex data and, using Geometry
Shaders, the image of a hexagon-shaped bokeh is splatted to the positions of these
vertices. Splatting is done to a texture that is divided into regions with different
resolutions using multiple viewports. First region is screen resolution and the rest are
a series of halved regions down to 1x1 texel resolution. The screen space radius of
the splatted bokeh determines the used resolution. The larger the radius the smaller
the used splatting resolution.
5. Steps 3 and 4 are performed separately for half and quarter resolution image data
with different radius thresholds. Larger bokehs are generated from lower resolution
image data.

Page 32 of 37
6. The different regions of the splatting texture are combined by up-scaling the data in
the smaller resolution regions step by step to the screen resolution region.
7. Finally, the out-of-focus illumination is combined with the original illumination.
Lens reflections
The effect is computed by first applying a filter to the computed illumination in frequency
domain like in the bloom effect. The filtered result is then splatted in several scales and
intensities on top of the input image using additive blending. The effect is computed in the
same resolution as the bloom effect and therefore the forward FFT needs to be performed
only once for both effects. As in the bloom effect, the forward and inverse FFTs are
performed using the CS and 32bit floating point textures.
Bloom
The effect is computed by transforming the computed illumination to frequency domain
using Fast Fourier Transform (FFT) and applying bloom filter to the input in that domain. An
inverse FFT is then applied to the filtered image. The forward FFT, applying the bloom filter
and inverse FFT are done with the CS. The effect is computed in reduced resolution. The
input image resolution is halved two or three times depending on settings and then rounded
up to nearest power of two. The FFTs are computed using 32bit floating point textures. A
procedurally pre-computed texture is used as the bloom filter. The filter combines blur,
streak, lenticular halo and anamorphic flare effects.
Anti-aliasing
MSAA and FXAA anti-aliasing methods are supported.
In MSAA method G-buffer textures are multisampled with the chosen sample count. Edge
mask is generated based on differences in G-buffer sample values. The mask is used in
illumination phase to select for which pixels illumination is evaluated for all G-buffer
samples. For pixels that are not considered edge pixels, illumination is evaluated only for the
first G-buffer sample. Volume illumination is always evaluated only for the first G-buffer
sample due to its low frequency nature.
FXAA is applied after tone mapping making it the final step in post processing.
Smoke simulation
The implementation of the smoke simulation is based on Ronald Fedkiw's paper "Visual
Simulation of Smoke" with the addition of viscous term as in Jos Stam's "Stable Fluids" but

Page 33 of 37
without a temperature simulation. Thus the smoke is simulated in a uniform grid where
velocity is modeled with incompressible Euler equations. Advection is solved with a semi-
Lagrangian method.
Vorticity confinement method is then applied to the velocity field to reinforce vortices.
Diffusion and projection is then computed by the Jacobi iteration method. The simulation is
done entirely with Compute Shaders. Cylinders that interact with the smoke are implicit
objects which are voxelized into the velocity and density field in Compute Shaders.
Windows
On Windows and Windows RT, Fire Strike requires graphics hardware with full DirectX 11
feature support.
Change log
3DMark Windows Edition v1.1.0 – May 6, 2013
This update fixes issues when testing systems with multiple GPUs. Fire Strike and Fire Strike
Extreme scores will increase slightly on systems with two GPUs and significantly on systems
with three or four GPUs.
Fixed
3DMark now works correctly on systems with up to four GPUs.
Fixed the issue caused by Windows update KB2670838, which added partial DX11.1
support to Windows 7.
Fixed a problem with the bloom post-processing effect when using very high
rendering resolutions in custom settings.
3DMark Windows Editions v1.0.0 – February 4, 2013
Launch version

Page 34 of 37
Benchmark Scores
How to report scores from 3DMark
Please follow these guidelines when including 3DMark scores in reviews or marketing
materials to avoid confusing your customers and to ensure you represent our software
correctly. Here's an example of how to do it right:
"Video card scores 5,800 in 3DMark Cloud Gate benchmark."
Do not use 3DMark as a unit of measurement.
CORRECT "New video card scores 10,000 in 3DMark Fire Strike benchmark."
WRONG "New video card scores 10,000 3DMarks."
Always include details of the hardware setup you used to obtain the score. Be sure to include
the operating system, system hardware and version numbers for relevant drivers.
3DMark 11 score of P11865 achieved with air cooled AMD Radeon HD 6990
graphics card, AMD Catalyst 11.4 drivers, Windows 7 64-bit operating system,
Intel Core i7 Extreme 990X, and ASUSTek Rampage III Extreme Motherboard.
World record scores
Futuremark's Hall of Fame is the only source of official 3DMark world record scores. You
must not present scores from any other website or leaderboard as world records. In those
cases we suggest using alternative wording such as:
"Video card takes the number one spot on [website] leaderboard."
Marketing guidelines
On the first mention of 3DMark in marketing text, such as an advertisement or product
brochure, please write "3DMark benchmark" in order to protect our trademark. For example:
"We recommend 3DMark® benchmarks from Futuremark®."
Please include our legal text in your small print.
3DMark® is a registered trademark of Futuremark Corporation.

Page 35 of 37
How 3DMark scores are calculated
3DMark includes three different tests, each designed for a specific type of hardware ranging
from mobile devices to high-performance gaming PCs. When testing devices or components,
make sure you use the most appropriate test for the hardware's capabilities.
Each test gives its own score, which you can use to compare similar devices or systems.
Unlike previous versions, there is no overall 3DMark score. Scores from different tests and
presets are not comparable.
Overall test score
The 3DMark score formula uses a weighted harmonic mean to calculate the overall score
from the Graphics, Physics and Combined scores, when applicable.
Where is the Graphics score weight for each test, is the Physics score
weight and is the Combined score weight. The constants and weights in the
score formulas are as shown in the table below.
Ice Storm Cloud Gate Fire Strike
7/9 7/9 0.75
2/9 2/9 0.15
0.0 0.0 0.10
230 230 230
315 315 315
N/A N/A 215
For a balanced system, with the weights in the score formula show the ratio between the
effects of graphics and physics performance on the overall score. A balanced system in this
sense is one where the Graphics and Physics sub-scores are roughly of the same magnitude.
For systems where either the Graphics or Physics sub-score is substantially higher than the
other, the harmonic mean rewards boosting the side where the score is lower.

Page 36 of 37
This reflects what users should see in games. For example, using an entry-level graphics card
and doubling the CPU speed doesn't help much in games since the system is already limited
by the GPU, and vice-versa on high-end graphics card systems with underpowered CPUs.
Graphics test scoring
Each Graphics test produces a raw performance result in frames per second (FPS). We then
take a harmonic mean of these raw results and multiply it with a scaling constant to reach a
graphics score ( ) as follows:
Where is the scaling constant for the graphics score and are the FPS
results for Graphics Tests 1-2. The constant brings the score in line with traditional 3DMark
score levels at the time of launch of the test.
Physics test scoring
The Physics Test will produce a raw performance result in frames per second (fps).
Where is the scaling constant and is the fps result for the Physics Test. As
with the graphics tests, the scaling factor is used to bring the overall score into a
traditional range.
Combined test scoring
The Combined Test will produce a raw performance result in frames per second (fps).
Where is the scaling constant and is the fps result for the Combined
Test. As with the graphics tests, the scaling factor is used to bring the overall
score into a traditional range.

Page 37 of 37
Futuremark Futuremark creates benchmarks that enable people to measure, understand and manage
computer hardware performance. Our talented team creates the industry's most
authoritative and widely used performance tests for desktop computers, notebooks, tablets,
smart phones and browsers.
We work in cooperation with many of the world's leading technology companies to develop
industry standard benchmarks that are relevant, accurate, and impartial. As a result, our
benchmarks are widely used by the world's leading press publications and enthusiast review
sites when testing the latest processors, graphics cards, notebooks and tablets. Futuremark
maintains the world's largest and most comprehensive hardware performance database,
using the results submitted by millions of users to drive innovative online solutions designed
to help consumers make informed purchasing decisions.
Our headquarters are in Finland just outside the capital Helsinki. We also have a sales office
in Silicon Valley and sales representatives in Taiwan.
Please don’t hesitate to contact us if you have a question about 3DMark.
Press [email protected]
Business [email protected]
Support http://www.futuremark.com/support
Website http://www.futuremark.com/
© 2013 Futuremark® Corporation. 3DMark® and Futuremark® trademarks and logos, Futuremark® character names and distinctive likenesses, are the exclusive property of Futuremark Corporation. Microsoft, Windows 8, Windows 7, Internet Explorer, Outlook, Excel, DirectX, and Direct3D are either registered trademarks or trademarks of Microsoft Corporation in the United States and/or other countries. The names of other companies and products mentioned herein may be the trademarks of their respective owners.