page 1 herb sutherland wind energy technology dept. sandia national laboratories wind energy...
TRANSCRIPT

page 1
Herb Sutherland
Wind Energy Technology Dept.
Sandia National Laboratories
www.sandia.gov/wind
Wind Energy Technology

page 2
Current Wind Industry MarketCurrent Wind Industry Market
• Size– 1.5-5.0 MW
– Towers: 65-100 m
– Blades: 34-50m
– Weight: 150-500t
• Costs– System < $3/lb
– Blades < $5/lb
– ~ $0.75/Watt
– $0.03-0.05/kWh

page 3
Wind Cost of Energy is Falling
Increased Turbine Size - R&D Advances - Manufacturing Improvements
0
1000
2000
3000
4000
5000
6000
7000
1980 1983 1986 1989 1992 1995 1998 2001
0
10
20
30
40
50
60
70
80
90
100
U.S
. C
umul
ativ
e C
apac
ity (
MW
)
Cos
t of
Ene
rgy
(cen
ts/k
Wh*
)
*Year 2000 dollars

page 4
Some Machines Currently on the Market
Some Machines Currently on the Market
Gamesa (Spain)
GE (US)
Enercon (Germany)
Vestas – NEG Micon(Denmark)
No. 5Bonus/Siemens(Denmark/Germany)
These four suppliers account for 75% of the
world market

page 5
Size of the Global MarketSize of the Global Market
The Global Wind Power Market in US$Expected development 2004-2008
0
3,000
6,000
9,000
12,000
15,000
2003 2004 2005 2006 2007 2008
mill
. US
$
0
12,000
24,000
36,000
48,000
60,000
Cu
mu
lati
ve m
ill. U
S$
Forecast offshore Offshore 2003 Onshore 2003
Forecast onshore Cumulative marketSource: BTM Consult ApS - March 2004

page 6
0
10000
20000
30000
40000
50000
60000
90 91 92 93 94 95 96 97 98 99 '00 '01 '02 '03 '04 '05 '06 '07
Growth of Wind Energy Capacity Worldwide
Growth of Wind Energy Capacity Worldwide
Rest of World
Actual Projected
Rest of World
North America North America
Europe Europe
Jan 2004 Cumulative MW*Rest of World = 3.897
North America = 6,691
Europe = 28,706
MW
In
s ta l
led
Sources: BTM Consult Aps, March 2003
AWEA/EWEA Press Release 3/3/03
EWEA press release 10/3/04
*
* Updated March 2004

page 7
Installed capacity in DenmarkNo. of MW (1981-2003)
0
50
100
150
200
250
300
350
400
450
500
550
600
650
1981 1984 1987 1990 1993 1996 1999 2002
MW
0
250
500
750
1,000
1,250
1,500
1,750
2,000
2,250
2,500
2,750
3,000
3,250
Cu
mu
lati
ve M
W
Installed MW Forecast Cumulative Cumul. forecast
Source: BTM Consult ApS - March 2004
Installed capacity in GermanyNo. of MW (1987-2003)
0
450
900
1,350
1,800
2,250
2,700
3,150
3,600
1987 1990 1993 1996 1999 2002
MW
0
2,000
4,000
6,000
8,000
10,000
12,000
14,000
16,000
18,000
Cu
mu
lati
ve M
W
Installed MW Forecast Cumulative Cumul. forecast
Source: BTM Consult ApS - March 2004
Installed capacity in SpainNo. of MW (1990-2003)
0
200
400
600
800
1,000
1,200
1,400
1,600
1990
1991
1992
1993
1994
1995
1996
1997
1998
1999
2000
2001
2002
2003
2004
MW
0
1,000
2,000
3,000
4,000
5,000
6,000
7,000
8,000
Cu
mu
lati
ve M
W
Installed MW Forecast Cumulative Cumul. forecast
Source: BTM Consult ApS - March 2004
Installed capacity in the USANo. of MW (1981-2003)
0
200
400
600
800
1,000
1,200
1,400
1,600
1,800
1981
1983
1985
1987
1989
1991
1993
1995
1997
1999
2001
2003
MW
0
800
1,600
2,400
3,200
4,000
4,800
5,600
6,400
7,200
Cu
mu
lati
ve M
W
Installed MW Forecast Cumulative Cumul. forecast
Source: BTM Consult ApS - March 2004

page 8
RESOURCERESOURCE
0
200
400
600
800
1000
1200
1400
TWh
N Dakota
Texas
Kansas
S Dakota
Montana
Nebraska
Wyoming
Oklahoma
Minnesota
Iowa
Colorado
New Mexico
Idaho
Rest of U.S.
Ref.: Elliott, et al, “An Assessment of the Available Windy Land Area and Wind EnergyPotential in the Contiguous United States,” August 1991, PNL-7789
New Mexico

page 9
NM Wind FarmsNM Wind Farms
• 204 MW PNM Wind Energy Center – House, NM
– PNM
• 80 MW Caprock Wind Ranch– Quay county, NM
– Cielo Wind Power/Xcel
• 120 MW San Juan Mesa – Elida, NM
– Padoma Wind Power/Xcel

page 10
DOE Wind Energy Program2002 Plan
DOE Wind Energy Program2002 Plan
Goal ABy 2012, COE from large systems in Class 4 winds 3 cents/kWh onshore or5 cents/kWh offshore
(Program Strategic Performance Goal)
Goal C By 2012, complete
program activities for grid access, operating rules, ancillary service tariffs,
and transmission expansion plans that
support industry’s 2020 capacity goal.
Goal D By 2010, 100 MW installed in at least
16 states.
ProgramGoals
Technology ApplicationTechnology Viability
Low Wind SpeedTechnology
SystemsIntegration
Primary Program Activities:• Public/private partnerships
Distributed WindTechnology
Primary Program Activities:• Public/private partnerships
Primary Program Activities:• Models• Ancillary costs• Utility rules• Grid capability
TechnologyAcceptance
Primary Program Activities:• State outreach • Federal loads• Rural wind development• Native Americans• Power partnerships
Goal B By 2007, COE from
distributed wind systems10-15 cents/kWh in Class 3
Supporting Researchand Testing
Primary Program Activities:• Enabling research• Design Review and Analysis• Testing Support
Supporting Engineeringand Analysis
Primary Program Activities:• Standards and certification• Field verification test support• Technical issues analysis and communications• Innovative technology development
Class 6 (High Energy) Sites
Class 4 (Good) Sites
Load Centers

page 11
Impact of Cost GoalsImpact of Cost Goals
Baseline (15 GW in 2020)• No technology breakthrough• Class 6 Plateau
Program Goal: 3 cents/kWh Class 4 COE in 2012
10
20
30
40
50
60
2005 2010 2015 2020
GW Competitive Class 4 Technology*
*Growth trajectory from NEMS using AEO 2001 assumptions with 3 cent/Class4/2007 technology
EIA/AEO 2001 Renewables Cases
Opportunity
2001
Reference
High Renewables
Expands resource base 20-fold Reduces average distance to load 5-fold 35 GW additional opportunity by 2020
Current Class 4 cost:4.3 cents/kWh
Class 4 goal (2012):3.0 cents/kWh

page 12
Offshore WindOffshore Wind
US DOE Program Goal: 5 cents/kWh, Shallow Water Offshore in the year
2012
• European Goal – 10 GW offshore
• British Islands– Enormous resource
– 1.4 GW in the planning stages
• US has limited shallow resource
• US Early Interest:– Cape Cod (Cape Wind)
– Long Island (LIPA)
• Deep Water Research – Base and foundation costs
– Floating structures

page 13
How Do We Get to Low-Cost,Low-Wind-Speed Technology?
(Thresher: 5/02)Technology Improvements Estimated COE Improvement
• Larger-scale 2 - 5MW - (rotors up to 120m) 0% 5%
• Advanced rotors and controls – (flexible, low-solidity, higher speed, hybrid carbon-glass -15% 7%and advanced and innovative designs)
• Advanced drive train concepts - (Hybrid drive trains with low-speed PM generators and -10% 7%other innovative designs including reduced cost PE)
• New tower concepts - (taller, modular, field assembled, load feedback control) -2% 5%
• Improved availability and reduced losses - (better controls, -5% 3%siting and improved availability)
• Manufacturing improvements - (new manufacturing methods, -7% 3%volume production and learning effects)
• Region and site tailored designs (tailoring of larger 100MW -5% 2%wind farm turbine designs to unique sites)
-44% 32%

page 14
Wind Turbine SystemsWind Turbine Systems
Hub
BladeTower
Gear Box
Generator
Pitch System
Yaw System
Conventional Drive Train
Direct Drive System

page 15
How Do We Get to Low-Cost,Low-Wind-Speed Technology?
(Thresher: 5/02)Technology Improvements Estimated COE Improvement
• Larger-scale 2 - 5MW - (rotors up to 120m) 0% 5%
• Advanced rotors and controls – (flexible, low-solidity, higher speed, hybrid carbon-glass -15% 7%and advanced and innovative designs)
• Advanced drive train concepts - (Hybrid drive trains with low-speed PM generators and -10% 7%other innovative designs including reduced cost PE)
• New tower concepts - (taller, modular, field assembled, load feedback control) -2% 5%
• Improved availability and reduced losses - (better controls, -5% 3%siting and improved availability)
• Manufacturing improvements - (new manufacturing methods, -7% 3%volume production and learning effects)
• Region and site tailored designs (tailoring of larger 100MW -5% 2%wind farm turbine designs to unique sites)
-44% 32%

page 16
Sandia Wind Energy ResearchPrimary Responsibility – Blades
Sandia Wind Energy ResearchPrimary Responsibility – Blades
Sandia Research Elements
•Advanced Blade Control – both active and passive (adaptive blade)
•Materials
•Manufacturing
•Analysis Tools
•Validation Testing & NDI
•Field Testing and Instrumentation
•Reliability
Blades are the only uniquely wind-turbine component Blades produce all the energy Blades produce all the system loads

page 17
Blades Are Getting BiggerBlades Are Getting Bigger
50.5 Meter Blade(GE 3.6 MW turbine)
Blade Size over Time

page 18
Comparison of Weight Trends WindStats Data & Preliminary Designs
Comparison of Weight Trends WindStats Data & Preliminary Designs
SAND2004-0074, Innovative Design Approaches for Large Wind Turbine Blades; Final Report, TPI

page 19
New Materials: New IssuesNew Materials: New Issues
• Carbon fiber forms– Cost vs. Performance
– Tow Size
– Pre-preg vs. fabrics
• Processing and fiber straightness
• Carbon/Glass hybrids
• Carbon-to-Glass Transitions
• Resin systems
7.5 mmAdditionalfiberglass
3.0 mmCarbonlayers

page 20
Design Tools:Validation and Testing
Design Tools:Validation and Testing
Design, analyze, fabricate, and test composite material structures to develop new approaches to design and analysis of blades
page 21
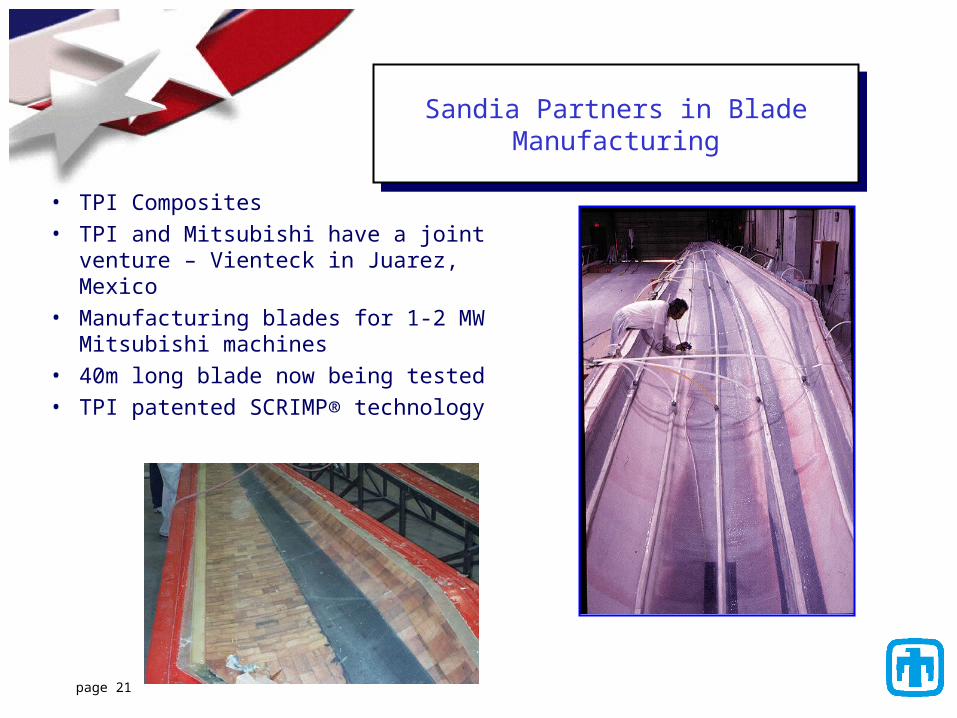
Sandia Partners in Blade Manufacturing
Sandia Partners in Blade Manufacturing
• TPI Composites
• TPI and Mitsubishi have a joint venture – Vienteck in Juarez, Mexico
• Manufacturing blades for 1-2 MW Mitsubishi machines
• 40m long blade now being tested
• TPI patented SCRIMP® technology

page 22
Eolidyn Rotor SystemsPlanform A / 50 meter blade
Blade Length (m) (ft) 50.0 164.0 Rotor Speed (rpm) 11.9Hub Radius (m) (ft) 1.5 4.9 Wind Speed (m/s) 10.0Rotor Radius (m) (ft) 51.5 169.0
Baseline Thickest Structurally Optimized ReynoldsStation Radius Radius Station Chord Twist Chord Thickness Thickness Thickness Thickness Thickness Thickness NumberNumber Ratio (m) (m) Ratio (deg) (m) Ratio (mm) Ratio (mm) Ratio (mm) (Re)
1 5% 2.575 1.075 0.0517 29.5 2.664 100.00% 2664 100.00% 2664 100.00% 2664 1.92E+062 15% 7.725 6.225 0.0775 19.5 3.992 42.00% 1676 62.00% 2475 66.00% 2634 3.79E+063 25% 12.875 11.375 0.0860 13.0 4.429 28.00% 1240 48.00% 2126 54.00% 2392 5.73E+064 35% 18.025 16.525 0.0758 8.8 3.901 24.00% 936 40.00% 1561 47.00% 1834 6.57E+065 45% 23.175 21.675 0.0664 6.2 3.418 23.00% 786 33.00% 1128 35.00% 1196 7.15E+066 55% 28.325 26.825 0.0574 4.4 2.957 22.00% 651 26.00% 769 27.00% 798 7.43E+067 65% 33.475 31.975 0.0487 3.1 2.509 21.00% 527 21.00% 527 21.00% 527 7.37E+068 75% 38.625 37.125 0.0402 1.9 2.072 20.00% 414 20.00% 414 20.00% 414 6.97E+069 85% 43.775 42.275 0.0319 0.8 1.643 19.00% 312 19.00% 312 19.00% 312 6.24E+06
10 95% 48.925 47.425 0.0237 0.0 1.221 18.00% 220 18.00% 220 18.00% 220 5.16E+06
0
500
1000
1500
2000
2500
3000
0 2 4 6 8 10 12 14 16 18 20 22 24 26 28 30 32 34 36 38 40 42 44 46 48 50
Blade Station (m)
BladeThickness
(mm)
Traditional Design Thicker AirfoilsR
oot Tip
Bla
de
Th
ick
nes
s
Blade Station
Design Studies identify the inner-span for thicker airfoilsDesign Studies identify the inner-span for thicker airfoils
• A thicker airfoil opens up new manufacturing opportunities– Constant thickness spar cap
– Pre-manufactured spars (e.g., Pultrusion)
• Weights are reduced substantially without other (material) changes
page 23
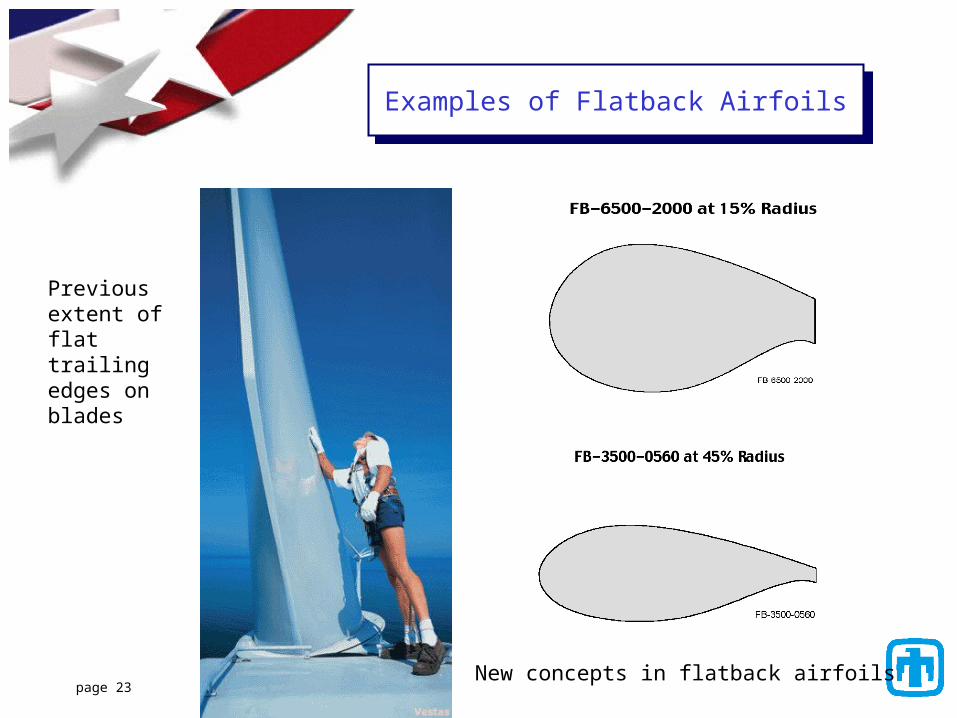
Examples of Flatback AirfoilsExamples of Flatback Airfoils
Previous extent of flat trailing edges on blades
New concepts in flatback airfoils

page 24
Adaptive BladesAdaptive Blades
ActiveMicro-tab Assembly & Motion
s l i d e r
b a s e
e x t e n d e r
Passive
Bend-Twist Coupling

page 25
ATLAS System Layout
Field Testing Site Monitoring and Turbine Loads Research
Field Testing Site Monitoring and Turbine Loads Research

page 26
Wind Energy: QuestionsWind Energy: Questions

page 27
0
10000
20000
30000
40000
50000
60000
90 91 92 93 94 95 96 97 98 99 '00 '01 '02 '03 '04 '05 '06 '07
Growth of Wind Energy Capacity Worldwide
Growth of Wind Energy Capacity Worldwide
Rest of World
Actual Projected
Rest of World
North America North America
Europe Europe
Jan 2004 Cumulative MW*Rest of World = 3.897
North America = 6,691
Europe = 28,706
MW
In
s ta l
led
Sources: BTM Consult Aps, March 2003
AWEA/EWEA Press Release 3/3/03
EWEA press release 10/3/04
*
* Updated March 2004

page 28
Blade Size over TimeBlade Size over Time
50+ meter
34 meter
23 meter
20 meter
12 meter
9 meter
7.5 meter
5 meter
1978 1985 1990 1995 2000 2005

page 29
50.5 Meter Blade(GE 3.6 MW turbine)
50.5 Meter Blade(GE 3.6 MW turbine)

page 30
Offshore Wind DevelopmentOffshore Wind Development
• Germany and Denmark have limited land area and extensive, shallow, windy, offshore area
• The UK has onshore NIMBY and is hoping to go immediately offshore
• The US East Coast is the largest electrical load – the best wind resources are offshore
• Great Lakes offer a similar opportunity
• Much of the US opportunity is in deeper water (>50m)
Annual Global Wind Power DevelopmentActual 1990-2003 Forecast 2004-2008 Prediction 2009-2013
0
7,000
14,000
21,000
28,000
1990 2003 2008 2013
MW
Prediction Offshore (Forecast) Forecast Existing capacitySource: BTM Consult ApS - March 2004
Offshore Projection

page 31
Wind Power BasicsWind Power Basics
59.0
3.0
max
max
32
1
LiftP
DragP
P
C
C
VACWindPower Wind Power output is proportional to wind speed cubed.
Effectively, the maximum drag-driven power coefficient is 0.15 because only the down-wind motion of the blade produces power
Lift-driven machines are only limited by the Betz Limit (the maximum energy extraction coefficient)

page 32
Power Curve
0
500
1000
1500
2000
2500
3000
0 5 10 15 20 25 30 35 40
Windspeed (m/s)
Po
wer
(kW
)
Turbine power Betz Power
Turbine Power BasicsTurbine Power Basics
Power vs. Wind Speed
Energy vs. Wind Speed
15 mph (6.8 m/s) average wind speed
Wind, Energy
0 5 10 15 20 25 30 35 40
Windspeed (m/s)
Rayleigh Probability Weibull Probability Weibull Betz
Turbine Energy Weibull Cp

page 33
Wind Turbine ManufacturersWind Turbine Manufacturers
Top-10 Suppliers in 200396.8% of the total market
VESTAS (DK) 21.7%
ENERCON (GE) 14.6%
Others 3.2%
SUZLON (Ind) 2.1%
MITSUBISHI (JP) 2.6%
NORDEX (GE) 2.9%
REPOWER (GE) 3.5%
BONUS (DK) 6.6%
NEG MICON (DK) 10.2%
GAMESA (ES) 11.5%
GE WIND (US) 18.0%
Source: BTM Consult ApS - March 2004

page 34
Horn’s Reef, Denmark

page 35
Why Move Offshore?Why Move Offshore?
• Higher-quality wind resources• Reduced turbulence• Increased wind speed
• Economies of scale • Avoid logistical constraints on turbine
size
• Proximity to loads• Many demand centers are near the
coast
• Increased transmission options• Access to less heavily loaded lines
• Potential for reducing land use and aesthetic concerns

page 36
Wind turbine type Vestas V80 - 2 MW
Total wind farm output 160 MW (80 turbines)
Expected annual production 600,000,000 kWh
Rotor diameter 80 m
Hub height 70 m
Mean wind speed (62 m) 9.7 m/s
Water depth 6-14 m
Distance from land 14-20 km
Wind farm area 20 km2
Total project costs DKK 2 billion(EUR 270 million)
Horns Rev Offshore Wind FarmNorth Sea: Off Danish Coast
Horns Rev Offshore Wind FarmNorth Sea: Off Danish Coast

page 37
Northeastern U.S. Offshore Potential
Northeastern U.S. Offshore Potential

page 38
Wind ResourceWest Coast of the US
Wind ResourceWest Coast of the US

page 39
Reverse Evolution…

page 40
GE Wind Energy 3.6 MW Turbines