pag 2015 - breeding view: statistical analyses in the breeding management system - dr mark sawkins
TRANSCRIPT

The Breeding View: Statistical analyses in the Breeding
Management System (BMS)
An initiative of the CGIAR Generation Challenge Programme (GCP)
Mark Sawkins Plant and Animal Genome
2015 San Diego, CA

Breeding View – what it is? Simple graphical Interface to conduct statistical analysis of
phenotypic and genotypic data Can access procedures in Genstat or R-scripts and allows analyses
to be configured Integrated into the IBP Breeding Management System (BMS)

The Breeding Management System is a comprehensive, all-in-one suite of tools to effectively manage your breeding activities throughout all development phases of your programs, from project planning to final decision-making:

Breeding View – Rationale for development
Existing packages are complex Many features that are not relevant Steep learning curve Focus on publication ready graphics
Majority of Breeders have specific, routine requirements Standard set of analyses Push lots of data quickly
BV provides a choice of statistical engine (Genstat or R)

Current analysis pipelines

Statistical Analysis of Phenotyping Data Single site analysis is available for complete and
incomplete block designs as well as row-column designs and spatial analysis. New designs are being added at each update, Analyses can be run in batches over environments
and traits,
Two-stage multi-site analysis is available for GxE and stability analysis with or without grouping of environments, Single pass meta analysis of unbalanced site by
season data is being incorporated.

Statistical analysis of Genotyping Data Single trait linkage analysis (QTL)
Quality control phenotypes (summary statistics)
Quality control marker data QTL detection – genome wide scan
using single and composite IM Output includes profile plots and
tables Results available for automatic
viewing in Flapjack HTML report of QTL results
Multiple trait & environment sequential analysis QTL results for each trait combined Single Flapjack view for all traits
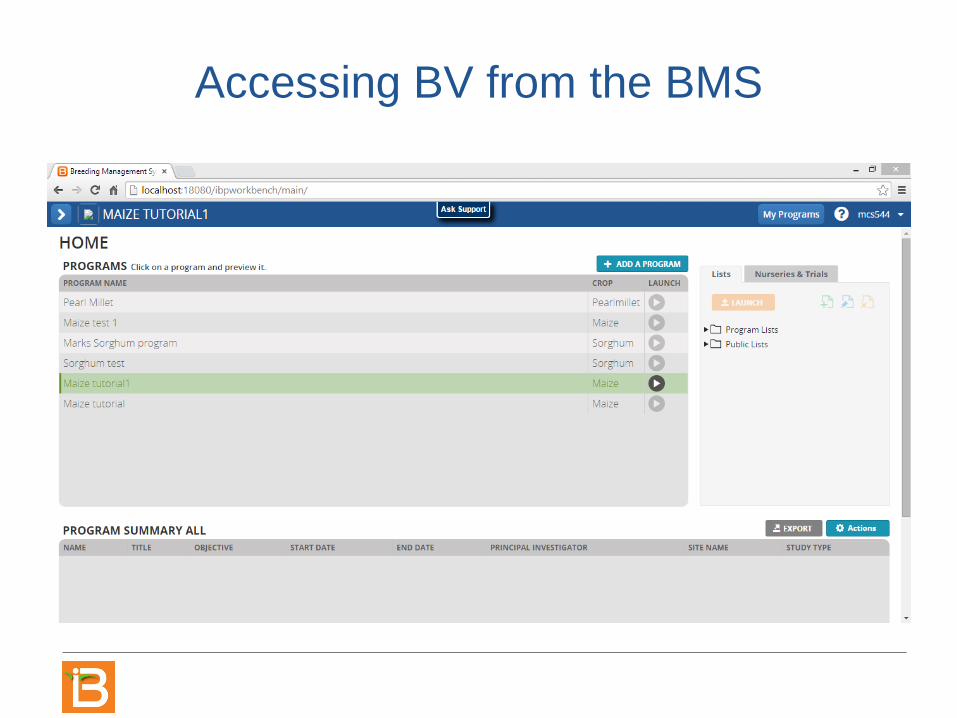
Accessing BV from the BMS
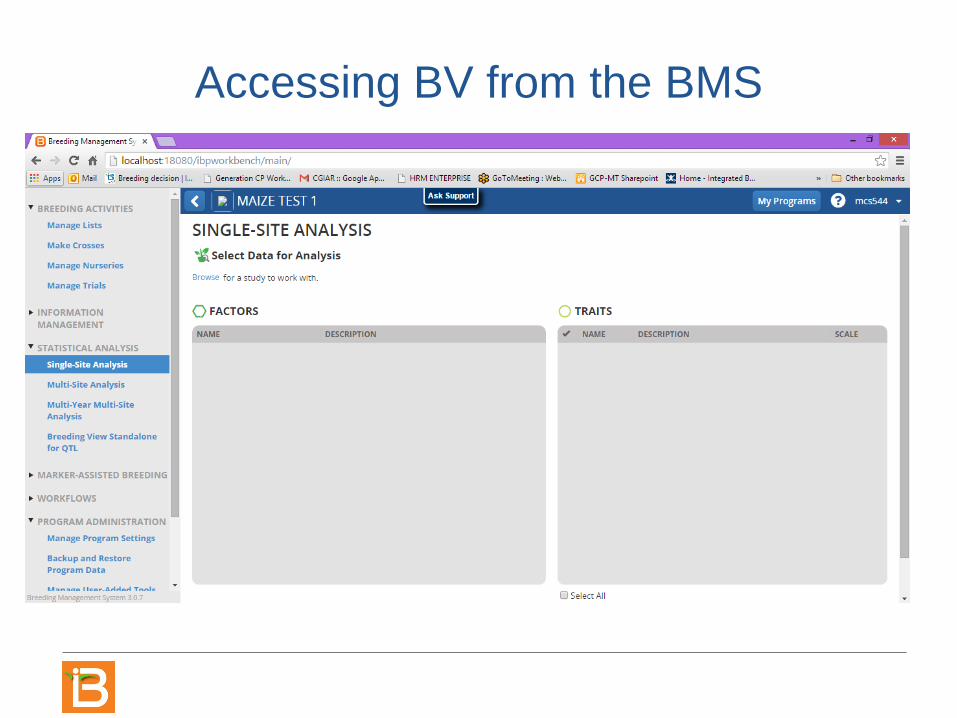
Accessing BV from the BMS
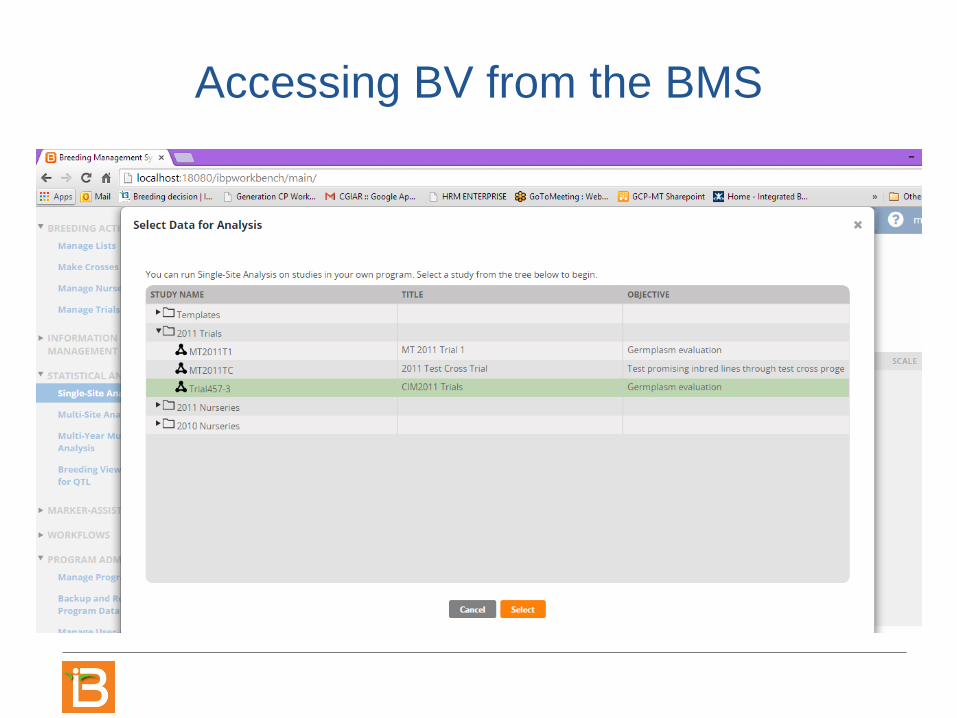
Accessing BV from the BMS

Accessing BV from the BMS

Accessing BV from the BMS
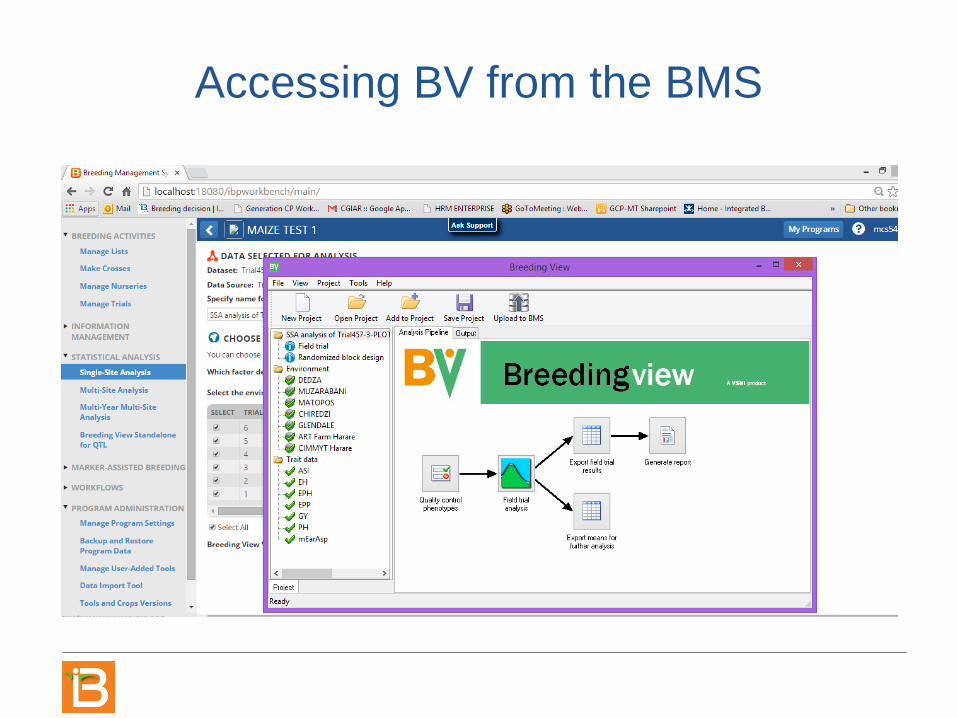
Accessing BV from the BMS
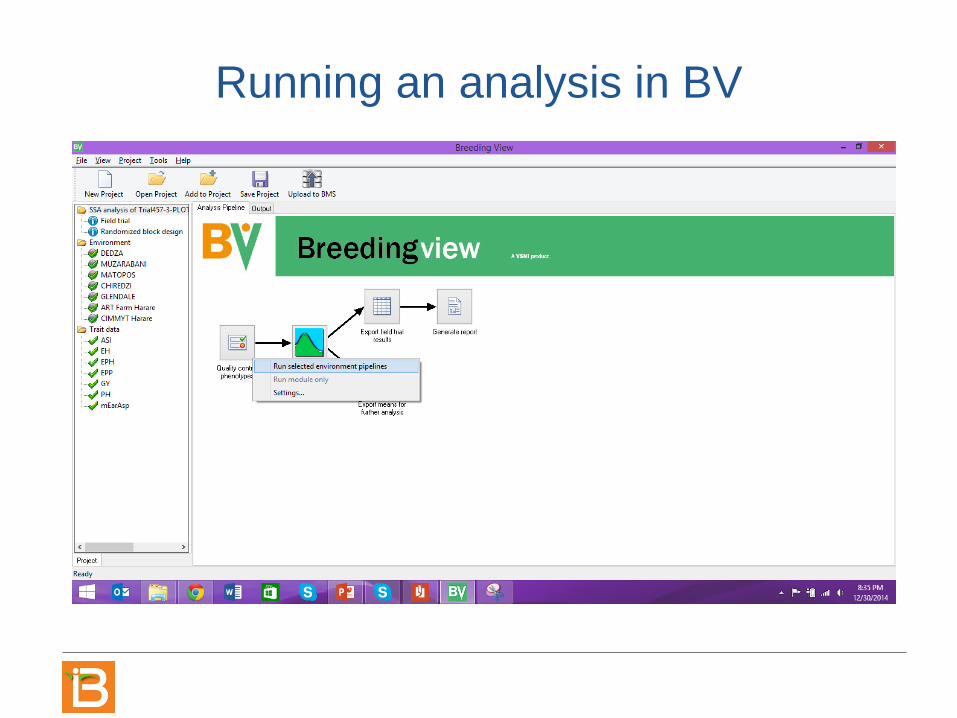
Running an analysis in BV

Output from BV

Saving output to the BMS

To Come
Ongoing updates to the Genstat and R scripts to support new field designs and analysis types as they are added to the BMS Additional field designs (e.g. Augmented, P-rep) Line x Tester analysis
All pipelines fully integrated in BMS Addition of new pipelines (e.g., multi-site/multi-
year analysis Incremental improvements to output and reports Improved documentation for all pipelines

To come
Ability to add user/community developed R-scripts to BV
Want to know more? www.integratedbreeding.net
Questions about licensing? [email protected]

Thanks!