pacmtn industry analysis update - thurstonedc.com
TRANSCRIPT

PacMtn Industry Analysis Update
Economic Forecast Expo
December 2019

Adjustments
2012 Industry Clusters
Food Manufacturing
Wood Products
Life Sciences
Chemical Products
IT/Telecommunication
Tourism and Recreation
2019 Industry Clusters
Food Manufacturing
Wood Products
Health Care
Specialty Manufacturing/Logistics
IT/Telecommunication
Tourism and Recreation

ApproachUpdates
Industry and Workforce Tracks
Real-Time Data Query Structures + Training
Customized County Findings

$5,000,000,000
$10,000,000,000
$15,000,000,000
$20,000,000,000
$25,000,000,000
2001 2002 2003 2004 2005 2006 2007 2008 2009 2010 2011 2012 2013 2014 2015 2016 2017 2018
PacMtn Gross Domestic Product, 2001-2108
Thurston Lewis Grays Harbor Mason Pacific

$2,000,000,000
$4,000,000,000
$6,000,000,000
$8,000,000,000
$10,000,000,000
$12,000,000,000
$14,000,000,000
$16,000,000,000
2001 2002 2003 2004 2005 2006 2007 2008 2009 2010 2011 2012 2013 2014 2015 2016 2017 2018
PacMtn Gross Domestic Product, 2001-2018
Thurston Lewis Grays Harbor Mason Pacific

Highest Industry LQ
Above 10.0
Industry EmpAvg Ann Wages LQ
Total New Demand
Shellfish Farming 484 $34,003 158.28 610
Other Food Crops Grown Under Cover 858 $29,491 36.68 1,143
Seafood Product Preparation and Packaging 1,294 $35,737 27.62 1,296
Forest Nurseries and Gathering of Forest Products 86 $66,431 26.65 117
Softwood Veneer and Plywood Manufacturing 460 $70,036 24.32 468
Sawmills 2,027 $68,106 18.26 2,184
Shellfish Fishing 396 $44,002 17.51 365
Finfish Farming and Fish Hatcheries 78 $51,065 15.04 100
Logging 1,239 $59,963 14.18 1,092
American Indian Tribal Governments 1,989 $50,883 13.82 2,013
Support Activities for Forestry 429 $41,087 12.89 486
Crushed and Broken Stone Mining and Quarrying 117 $51,583 12.07 108
Engineered Wood Member Manufacturing 101 $79,904 11.55 107
Casinos (except Casino Hotels) 2,606 $39,319 11.02 4,004
Administration of Education Programs 957 $71,419 10.41 947
Administration of Human Resource Programs 5,170 $67,285 10.26 5,043

Text
Shellfish Farming855.42
Seafood Prep and Packaging321.76
Shellfish Fishing304.15
Food Crops Grown Under Cover163.79
Finfish Fishing88.45
Stone Mining/Quarrying63.74
Other Marine Fishing59.32
Logging54.66
Sawmills37.75
Fish and Seafood Markets36.11
Fertilizer Manufacturing34.65
Electric Power Transmission34.42
$0
$20,000
$40,000
$60,000
$80,000
$100,000
$120,000
-100 0 100 200 300 400 500 600 700
Pacific County: Highest LQ Industries by Total Employment with Annual Wage, 2019

Text
Shellfish Farming817.78
Tobacco Manufacturing91.50
Dried/Dehydrated Food Manufacturing
85.67
Crops Grown Under Cover76.16
Seafood Preparation/Packaging71.66
Flower, Nursery Stock, Florists' Supplies Wholesalers
55.46
Casinos (except Casino Hotels)44.12
Rural Bus Transportation39.11
Tribal Governments25.41
Logging24.72
Correctional Institutions13.88
Sawmills10.78
Electric Power Distribution9.13
$0
$20,000
$40,000
$60,000
$80,000
$100,000
$120,000
-100 0 100 200 300 400 500 600 700 800 900 1,000
Mason County: Highest LQ Industries (min 50 jobs) by Total Employment with Average Annual Wage, 2019

Text Softwood Veneer/Plywood Manufacturing
106.07
Shellfish Farming102.35
Seafood Preparation and Packaging83.68
Sawmills51.01
American Indian Tribal Governments50.00
Food Crops Grown Under Cover37.78
Wood Window/Door Manufacturing36.26
Shellfish Fishing34.04
Crane, Hoist, Monorail Manufacturing30.59
Port and Harbor Operations30.01 Finfish Fishing
26.86
Bus Transportation24.44
Logging21.95
Electric Power Transmission20.96
Boat Building17.80
$0
$20,000
$40,000
$60,000
$80,000
$100,000
$120,000
-100 100 300 500 700 900 1,100
Grays Harbor: Highest LQ Industries by Total Employment and Annual Average Wage, 2019

Text
Engineered Wood Member Manuf.80.82
Softwood Veneer/Plywood Manufacturing78.51
Crushed/Broken Stone Mining and Quarrying
67.05
Sawmills66.52
Frozen Fruit, Juice, Vegetable Manufacturing
49.34
Support Activities Forestry49.20
Glass Product Manufacturing38.95
Manufactured Home Dealers37.88
Berry Farming36.95
Logging35.08
Hydroelectric Power Generation29.34
Railroad Rolling Stock Manufacturing24.04
Dry, Condensed, Evaporated Dairy Product Manufacturing
20.94
Hazardous Waste Treatment/Disposal14.80
Mattress Manufacturing13.05
Plastics Pipe/Pipe Fitting Manufacturing12.33
Light Truck/Utility Vehicle Manufacturing12.00
Nursery/Tree Production11.84
Cut Stone/Stone Product Manufacturing11.32
Refrigerated Warehousing/Storage10.15
$0
$20,000
$40,000
$60,000
$80,000
$100,000
$120,000
$140,000
-300 -100 100 300 500 700 900 1,100 1,300
Lewis County: Highest LQ Industries by Total Employment with Annual Average Wage, 2019

Text
Shellfish Farming155
Other Food Crops Grown Under Cover432
Mushroom Production214
Casinos (except Casino Hotels)1,641
Institutional Furniture Manufacturing221
Egg Production182
Nature Parks/Similar Institutions499
Transit Transportation413
Metal Can Manufacturing92
Coffee/Tea Manufacturing113
Business Associations506
Support Activities Forestry106
Logging224
Telephone Answering Services121
$0
$10,000
$20,000
$30,000
$40,000
$50,000
$60,000
$70,000
$80,000
$90,000
-200 300 800 1,300 1,800 2,300
Thurston County: Highest LQ Industries (min 90 jobs) by Total Employment with Annual Average Wage, 2019

Text

Text
Computer Systems Design, Related Services, 1,142
Admin. of Human Resource Programs, 265
Executive, Legislative, General Government Support, 174
Other Information Services, 254
Admin. of Economic Program, 112
Justice, Public Order, Safety Activities, 107
Management of Companies and Enterprises, 108
Employment Services, 111
Admin. of Environmental Quality Programs, 91
Wired/Wireless Telecom Carriers, 64
Elementary/Secondary Schools, 101
Depository Credit Intermediation, 87
Medical/Surgical Hospitals, 83
Management, Scientific, Technical Consulting, 120Data Processing, Hosting, Related Services, 99
Software Publishers, 99
$50,000
$60,000
$70,000
$80,000
$90,000
$100,000
$110,000
$120,000
0 200 400 600 800 1,000 1,200 1,400
2019 Employment Volume
PacMtn: Top 20 Industries for Computer/Math Occupations by Employment/Annual Average Wage + 10-yr demand forecast, 2019

Text
Medical and Surgical Hospitals, 2,261
Offices of Physicians, 820
Offices of Other Health Practitioners, 564
Offices of Dentists, 448
Outpatient Care Centers, 578
Nursing Care Facilities, 250
Health/Personal Care Stores, 255
Professional, Scientific, Technical Services, 268
Admin. Human Resource Programs, 183
Exec, Leg, General Government Support, 165
Elementary/Secondary Schools, 148
Home Health Care Services, 233
Individual/Family Services, 160
Admin. Economic Program, 79
Justice, Public Order, Safety Activities, 77
Assisted Living Facilities, 128
Other Ambulatory Health Care Services, 106
Admin. Environmental Quality Prog., 68
Psych/Substance Abuse Hospitals, 57
$20,000
$40,000
$60,000
$80,000
$100,000
$120,000
$140,000
$160,000
-1,000 -500 0 500 1,000 1,500 2,000 2,500 3,000 3,500 4,000 4,500
2019 Employment Volume
PacMtn: Top 20 Industries for Healthcare Practitioners/Technical Occupations by Employment/Average Annual Wage + 10-yr demand forecast, 2019

Highest AAR % growth: 2014-19
+/- 100 jobs+/- $30K wagePositive job forecast
Industry EmplAvg Ann Wages
2014-2019 Emp Growth
Avg Ann % Chg in Empl
Total New Demand
Toilet Preparation Manufacturing 114 $49,986 112 123.4% 115
Other Food Crops Grown Under Cover 858 $29,491 819 86.0% 1,143
Administration of Veterans' Affairs 139 $56,458 129 69.2% 127
Motion Picture and Video Production 324 $43,760 273 44.6% 390
Payroll Services 256 $39,342 214 43.8% 293
Other Nonresidential Building Equipment Contractors 130 $86,259 109 43.3% 162
Facilities Support Services 661 $62,055 544 41.2% 915
Mattress Manufacturing 130 $43,360 97 31.8% 132
Engineered Wood Member (except Truss) Manufacturing 101 $79,904 75 31.6% 107
Tobacco Manufacturing 103 $46,894 76 30.7% 52
All Other Miscellaneous Schools and Instruction 644 $66,758 454 27.6% 1,002
Roofing, Siding, and Insulation Material Merchant Wholesalers 103 $74,737 72 27.1% 120
Metal Can Manufacturing 92 $75,729 63 26.0% 97
Internet Publishing and Broadcasting and Web Search Portals 224 $129,510 151 25.2% 355
Specialized Freight (except Used Goods) Trucking, Long-Distance 127 $50,690 84 24.2% 139
Blood and Organ Banks 102 $47,383 66 23.5% 142
Breweries 274 $29,871 171 21.8% 360
Wood Window and Door Manufacturing 322 $62,514 198 21.0% 299
Office Administrative Services 820 $68,457 491 20.0% 1,062
Custom Computer Programming Services 416 $97,816 246 19.5% 448
Industrial Building Construction 138 $89,939 81 19.5% 156
Nonresidential Glass and Glazing Contractors 148 $73,404 87 19.4% 184
Other Social Advocacy Organizations 217 $47,514 128 19.3% 277
Meat Processed from Carcasses 111 $35,943 65 19.3% 134
Computer Systems Design Services 1,180 $102,030 656 17.6% 1,265
Residential Poured Concrete Foundation and Structure Contractors 133 $34,930 74 17.5% 163
Psychiatric and Substance Abuse Hospitals 267 $48,268 148 17.5% 231
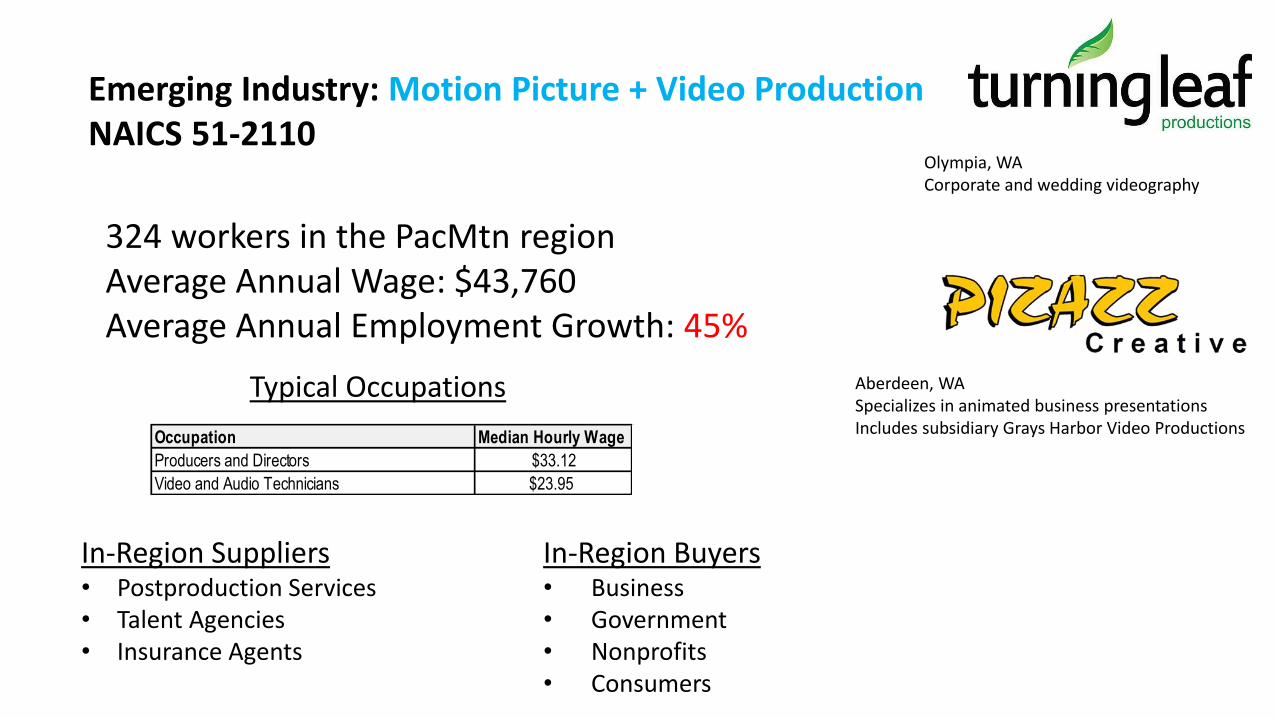
Olympia, WACorporate and wedding videography
Emerging Industry: Motion Picture + Video ProductionNAICS 51-2110
324 workers in the PacMtn regionAverage Annual Wage: $43,760Average Annual Employment Growth: 45%
Aberdeen, WASpecializes in animated business presentationsIncludes subsidiary Grays Harbor Video Productions
Typical Occupations
In-Region Suppliers• Postproduction Services• Talent Agencies• Insurance Agents
In-Region Buyers• Business• Government• Nonprofits• Consumers
Occupation Median Hourly Wage
Producers and Directors $33.12
Video and Audio Technicians $23.95

Corporate HQ in Lacey, WASatellite offices in Bellevue, Portland, Boise# of employees: 52 in Lacey locationHiring:• EUC Engineer• Inside Sales Administrator• Tier 2 IT Support Technician
Emerging Industry: Computer Systems Design ServicesNAICS 54-1512
416 workers in the PacMtn regionAverage Annual Wage: $43,760Average Annual Employment Growth: 32%
Lacey, WA# of employees: est. 10Integrates marketing and computer systems design
Typical Occupations
In-Region Suppliers• Data Hosting Services• Wired and Wireless Telecommunications Carriers• Computer Equipment Retailers• Temporary Help Agencies
In-Region Buyers• Government• Business
Occupation Median Hourly Wage
Computer Systems Analysts $37.95
Network & Computer Systems Administrators $39.29
Computer Network Support Specialists $30.41

Brewery in Tumwater, WAEstablished 2019# of employees: est. 10Estimated annual sales: $5 million6,000 sq. ft. facility
Emerging Industry: BreweriesNAICS 31-2120
274 workers in the PacMtn regionAverage Annual Wage: $29,871Average Annual Employment Growth: 22%
Brewery in Aberdeen, WAEstablished 2019# of employees: est. 5Owner used GoFundMe to raise capital
Typical Occupations
Occupation Median Hourly Wage
Brewer's Assistants $22.00
Sales Representives $25.00 + commission
Light Truck Drivers $17.64
Hand Laborers/Freight, Stock & Material Movers $15.84
In-Region Suppliers• Metal Can Manufacturing • Glass Container Manufacturing• Grain Wholesalers
In-Region Buyers• Restaurants• Drinking Establishments• Grocers

Text
$0
$50,000,000
$100,000,000
$150,000,000
$200,000,000
$250,000,000
$300,000,000
$350,000,000
0%
10%
20%
30%
40%
50%
60%
70%
80%
90%
100%
Tota
l An
nu
al
US
Pu
rch
asin
g
% P
urc
has
es M
ade
In-R
egio
n
PacMtn: Notable Buyer Supply Chain Purchasing by Total Volume vs. % In-Region, 2019 (est.)
Purchases from Out-of-Region Firms % In-Region Purchases