package ‘table1’ - r · 2020-03-23 · knit_print.table1 method for printing in a knitr...
TRANSCRIPT
Package ‘table1’March 23, 2020
Type Package
Version 1.2
Date 2020-03-21
Title Tables of Descriptive Statistics in HTML
URL https://github.com/benjaminrich/table1
BugReports https://github.com/benjaminrich/table1/issues
Description Create HTML tables of descriptive statistics, as one would expectto see as the first table (i.e. ``Table 1'') in a medical/epidemiological journalarticle.
License GPL-3
Imports stats,Formula,knitr,htmltools,yaml
Suggests boot,MatchIt
VignetteBuilder knitr
RoxygenNote 7.0.2.9000
NeedsCompilation no
Author Benjamin Rich [aut, cre, cph]
Maintainer Benjamin Rich <[email protected]>
Repository CRAN
Date/Publication 2020-03-23 07:20:03 UTC
R topics documented:eqcut . . . . . . . . . . . . . . . . . . . . . . . . . . . . . . . . . . . . . . . . . . . . . 2knit_print.table1 . . . . . . . . . . . . . . . . . . . . . . . . . . . . . . . . . . . . . . . 4label . . . . . . . . . . . . . . . . . . . . . . . . . . . . . . . . . . . . . . . . . . . . . 4parse.abbrev.render.code . . . . . . . . . . . . . . . . . . . . . . . . . . . . . . . . . . 5print.table1 . . . . . . . . . . . . . . . . . . . . . . . . . . . . . . . . . . . . . . . . . 6render.categorical.default . . . . . . . . . . . . . . . . . . . . . . . . . . . . . . . . . . 7render.continuous.default . . . . . . . . . . . . . . . . . . . . . . . . . . . . . . . . . . 7render.default . . . . . . . . . . . . . . . . . . . . . . . . . . . . . . . . . . . . . . . . 8
1

2 eqcut
render.missing.default . . . . . . . . . . . . . . . . . . . . . . . . . . . . . . . . . . . . 9render.varlabel . . . . . . . . . . . . . . . . . . . . . . . . . . . . . . . . . . . . . . . . 10signif_pad . . . . . . . . . . . . . . . . . . . . . . . . . . . . . . . . . . . . . . . . . . 11stats.apply.rounding . . . . . . . . . . . . . . . . . . . . . . . . . . . . . . . . . . . . . 12stats.default . . . . . . . . . . . . . . . . . . . . . . . . . . . . . . . . . . . . . . . . . 13subsetp . . . . . . . . . . . . . . . . . . . . . . . . . . . . . . . . . . . . . . . . . . . 15t1read . . . . . . . . . . . . . . . . . . . . . . . . . . . . . . . . . . . . . . . . . . . . 15table.rows . . . . . . . . . . . . . . . . . . . . . . . . . . . . . . . . . . . . . . . . . . 17table1 . . . . . . . . . . . . . . . . . . . . . . . . . . . . . . . . . . . . . . . . . . . . 18units . . . . . . . . . . . . . . . . . . . . . . . . . . . . . . . . . . . . . . . . . . . . . 21
Index 23
eqcut Cut a continuous variable into equal-sized groups.
Description
Cut a continuous variable into equal-sized groups.
Usage
eqcut(x,ngroups,labeling = eqcut.default.labeling,withhold = NULL,varlabel = if (has.label(x)) label(x) else deparse(substitute(x)),quantile.type = 7,right = FALSE,...
)
eqcut.default.labeling(x, xcat, which, what, from, to, ...)
Arguments
x A numeric vector.
ngroups The number of groups desired.
labeling A function that produces the category labels (see Details).
withhold A named list of logical vectors (see Details).
varlabel A character string to be used as a label for x, or NULL.
quantile.type An integer from 1 to 9, passed as the type argument to function quantile.
right Should intervals be right-closed? (passed to cut).
... Further arguments passed on to function labeling.
xcat A factor returned by cut.

eqcut 3
which, what Character vectors for labeling the categories in an appropriate way (see Exam-ples).
from, to Numeric vectors giving the ranges covered by the categories of x.
Details
The function labeling must have the signature function(x,xcat,which,what,from,to,...)and produces the character vector of factor levels. See below for an example.
The withhold list can be used when x contains special values that should not be considered in thecalculation of the quantiles used to create the ngroups categories. The special values are given alabel that corresponds to the name of the corresponding list element. See below for an example.
Value
A factor of the same length as x. There are ngroups levels plus one additional level for eachelement of withhold.
Functions
• eqcut.default.labeling: The default labeling function.
See Also
cut quantile
Examples
x <- sample(100)table(eqcut(x, 2))table(eqcut(x, 3))table(eqcut(x, 4))table(eqcut(x, 5))table(eqcut(x, 6))table(eqcut(x, 7))table(eqcut(x, 8))
# An example of using eqcut in a table with custom labeling function.dat <- expand.grid(id=1:100, sex=c("Male", "Female"), treat=c("Treated", "Placebo"))dat$age <- runif(nrow(dat), 18, 50)dat$wt <- exp(rnorm(nrow(dat), log(75 + 10*(dat$sex=="Male")), 0.2))dat$auc <- ifelse(dat$treat=="Placebo", NA, exp(rnorm(nrow(dat), log(1000), 0.34)))dat$auc[3] <- NA # Add a missing value
label(dat$sex) <- "Sex"label(dat$age) <- "Age"label(dat$wt) <- "Weight"label(dat$auc) <- "AUC"units(dat$age) <- "y"units(dat$wt) <- "kg"units(dat$auc) <- "ng.h/mL"

4 label
w <- list(Placebo=(dat$treat=="Placebo"), Excluded=is.na(dat$auc))f <- function(x, xcat, which, what, from, to, ...) {
what <- sub("of ", "of<br/>", what)sprintf("%s %s<br/>≥%s to <%s",
which, what, signif_pad(from, 3, FALSE), signif_pad(to, 3, FALSE))}table1(~ sex + age + wt | eqcut(auc, 3, f, w), data=dat)
knit_print.table1 Method for printing in a knitr context.
Description
Method for printing in a knitr context.
Usage
## S3 method for class 'table1'knit_print(x, ...)
Arguments
x An object returned by table1.
... Further arguments passed on to knitr::knit_print.
label Label attribute.
Description
Label attribute.
Usage
label(x)
label(x) <- value
has.label(x)
Arguments
x An object.
value A character specifying the label.

parse.abbrev.render.code 5
Functions
• label<-: Set label attribute.
• has.label: Check for label attribute.
Examples
x <- 1:10label(x) <- "Foo"has.label(x)label(x)
parse.abbrev.render.code
Parse abbreviated code for rendering table output.
Description
Parse abbreviated code for rendering table output.
Usage
parse.abbrev.render.code(code, ...)
Arguments
code A character vector specifying the statistics to display in abbreviated code. SeeDetails.
... Further arguments, passed to stats.apply.rounding.
Details
In abbreviated code, the words N, NMISS, MEAN, SD, MIN, MEDIAN, MAX, IQR, CV, GMEAN,GCV, FREQ and PCT are substituted for their respective values (see stats.default). The substitu-tion is case insensitive, and the substituted values are rounded appropriately (see stats.apply.rounding).Other text is left unchanged. The code can be a vector, in which case each element is displayed inits own row in the table. The names of code are used as row labels; if no names are present, then thecode itself is used unless code is of length 1, in which case no label is used (for numeric variablesonly, categorical variables are always labeled by the class label). The special name ’.’ also indicatesthat code itself be is used as the row label.
Value
A function that takes a single argument and returns a character vector.
6 print.table1
Examples
## Not run:x <- round(exp(rnorm(100, log(20), 1)), 2)stats.default(x)f <- parse.abbrev.render.code(c("Mean (SD)", "Median [Min, Max]"), 3)f(x)f2 <- parse.abbrev.render.code(c("Geo. Mean (Geo. CV%)" = "GMean (GCV%)"), 3)f2(x)f3 <- parse.abbrev.render.code(c("Mean (SD)"), 3)f3(x)
x <- sample(c("Male", "Female"), 30, replace=T)stats.default(x)f <- parse.abbrev.render.code("Freq (Pct%)")f(x)
## End(Not run)
print.table1 Print table1 object.
Description
Print table1 object.
Usage
## S3 method for class 'table1'print(x, ...)
Arguments
x An object returned by table1.
... Further arguments passed on to other print methods.
Details
In an interactive context, the rendered table will be displayed in a web browser. Otherwise, theHTML code will be printed as text.
Value
Returns x invisibly.

render.categorical.default 7
render.categorical.default
Render categorical values for table output.
Description
Called from table1 by default to render categorical (i.e. factor, character or logical) valuesfor displaying in the table.
Usage
render.categorical.default(x, ..., na.is.category = TRUE)
Arguments
x A vector of type factor, character or logical.
... Further arguments, passed to stats.apply.rounding.
na.is.category Include missing values in the denominator for calculating percentages (the de-fault) or omit them.
Value
A character vector. Each element is to be displayed in a separate cell in the table. The names ofthe vector are the labels to use in the table. However, the first names should be empty as it will bereplaced by the name of the variable. Empty strings are allowed and result in empty table cells.
Examples
y <- factor(sample(0:1, 99, replace=TRUE), labels=c("Female", "Male"))y[1:10] <- NArender.categorical.default(y)
render.continuous.default
Render continuous values for table output.
Description
Called from table1 by default to render continuous (i.e. numeric) values for displaying in thetable.
Usage
render.continuous.default(x, ...)
8 render.default
Arguments
x A numeric vector.
... Further arguments, passed to stats.apply.rounding.
Value
A character vector. Each element is to be displayed in a separate cell in the table. The names ofthe vector are the labels to use in the table. However, the first names should be empty as it will bereplaced by the name of the variable. Empty strings are allowed and result in empty table cells.
Examples
x <- exp(rnorm(100, 1, 1))render.continuous.default(x)
render.default Render values for table output.
Description
Called from table1 by default to render values for displaying in the table. This function forwardsthe call to separate functions for rendering continuous, categorical and missing values. The idea isthat each of these functions can be overridden to customize the table output.
Usage
render.default(x,name,missing = any(is.na(x)),transpose = F,render.empty = "NA",render.continuous = render.continuous.default,render.categorical = render.categorical.default,render.missing = render.missing.default,...
)
Arguments
x A vector or numeric, factor, character or logical values.
name Name of the variable to be rendered (ignored).
missing Should missing values be included?
transpose Logical indicating whether on not the table is transposed.
render.empty A character to return when x is empty.
render.missing.default 9
render.continuous
A function to render continuous (i.e. numeric) values. Can also be a characterstring, in which case it is passed to parse.abbrev.render.code.
render.categorical
A function to render categorical (i.e. factor, character or logical) values.Can also be a character string, in which case it is passed to parse.abbrev.render.code.
render.missing A function to render missing (i.e. NA) values. Can also be a character string, inwhich case it is passed to parse.abbrev.render.code. Set to NULL to ignoremissing values.
... Further arguments, passed to stats.apply.rounding.
Value
A character vector. Each element is to be displayed in a separate cell in the table. The names ofthe vector are the labels to use in the table. However, the first names should be empty as it will bereplaced by the name of the variable. Empty strings are allowed and result in empty table cells.
Examples
x <- exp(rnorm(100, 1, 1))render.default(x)render.default(x, TRUE)
y <- factor(sample(0:1, 99, replace=TRUE), labels=c("Female", "Male"))y[1:10] <- NArender.default(y)
render.missing.default
Render missing values for table output.
Description
Called from table1 by default to render missing (i.e. NA) values for displaying in the table.
Usage
render.missing.default(x, ...)
Arguments
x A vector.
... Further arguments, passed to stats.apply.rounding.

10 render.varlabel
Value
A character vector. Each element is to be displayed in a separate cell in the table. The namesof the vector are the labels to use in the table. Empty strings are allowed and result in empty tablecells.
Examples
y <- factor(sample(0:1, 99, replace=TRUE), labels=c("Female", "Male"))y[1:10] <- NArender.missing.default(y)
render.varlabel Render variable labels for table output.
Description
Called from table1.formula by default to render variable labels for displaying in the table.
Usage
render.varlabel(x, transpose = F)
Arguments
x A vector, usually with the label and (if appropriate) unit attributes.
transpose Logical indicating whether on not the table is transposed.
Value
A character, which may contain HTML markup.
Examples
x <- exp(rnorm(100, 1, 1))label(x) <- "Weight"units(x) <- "kg"render.varlabel(x)
y <- factor(sample(0:1, 99, replace=TRUE), labels=c("Female", "Male"))y[1:10] <- NAlabel(y) <- "Sex"render.varlabel(y)

signif_pad 11
signif_pad Round numbers with 0-padding.
Description
Utility functions to round numbers, similar the the base functions signif and round, but resultingin character representations that keep zeros at the right edge if they are significant.
Usage
signif_pad(x,digits = 3,round.integers = TRUE,round5up = TRUE,dec = getOption("OutDec"),...
)
round_pad(x, digits = 2, round5up = TRUE, dec = getOption("OutDec"), ...)
Arguments
x A numeric vector.
digits An integer specifying the number of significant digits to keep (for signif_pad)or the number of digits after the decimal point (for round_pad).
round.integers Should rounding be limited to digits to the right of the decimal point?
round5up Should numbers with 5 as the last digit always be rounded up? The standard Rapproach is "go to the even digit" (IEC 60559 standard, see round), while someother softwares (e.g. SAS, Excel) always round up.
dec The character symbol to use as decimal mark (locale specific).
... Further options, passed to formatC (which is used internally). Not all optionswill work, but some might be useful (e.g. big.mark).
Value
A character vector containing the rounded numbers.
See Also
signif round formatC prettyNum format

12 stats.apply.rounding
Examples
x <- c(0.9001, 12345, 1.2, 1., 0.1, 0.00001 , 1e5)signif_pad(x, digits=3)signif_pad(x, digits=3, round.integers=TRUE)
# Compare:as.character(signif(x, digits=3))format(x, digits=3, nsmall=3)prettyNum(x, digits=3, drop0trailing=TRUE)prettyNum(x, digits=3, drop0trailing=FALSE)
# This is very close.formatC(x, format="fg", flag="#", digits=3)formatC(signif(x, 3), format="fg", flag="#", digits=3)
# Could always remove the trailing "."sub("[.]$", "", formatC(x, format="fg", flag="#", digits=3))
stats.apply.rounding Apply rounding to basic descriptive statistics.
Description
Not all statistics should be rounded in the same way, or at all. This function will apply roundingselectively to a list of statistics as returned by stats.default. In particular we don’t round counts(N and FREQ), and for MIN, MAX and MEDIAN the digits is interpreted as the minimum numberof significant digits, so that we don’t loose any precision. Percentages are rounded to a fixed numberof decimal places (default 1) rather than a specific number of significant digits.
Usage
stats.apply.rounding(x,digits = 3,digits.pct = 1,round.median.min.max = TRUE,round.integers = TRUE,round5up = TRUE,...
)
Arguments
x A list, such as that returned by stats.default.
digits An integer specifying the number of significant digits to keep.
digits.pct An integer specifying the number of digits after the decimal place for percent-ages.
stats.default 13
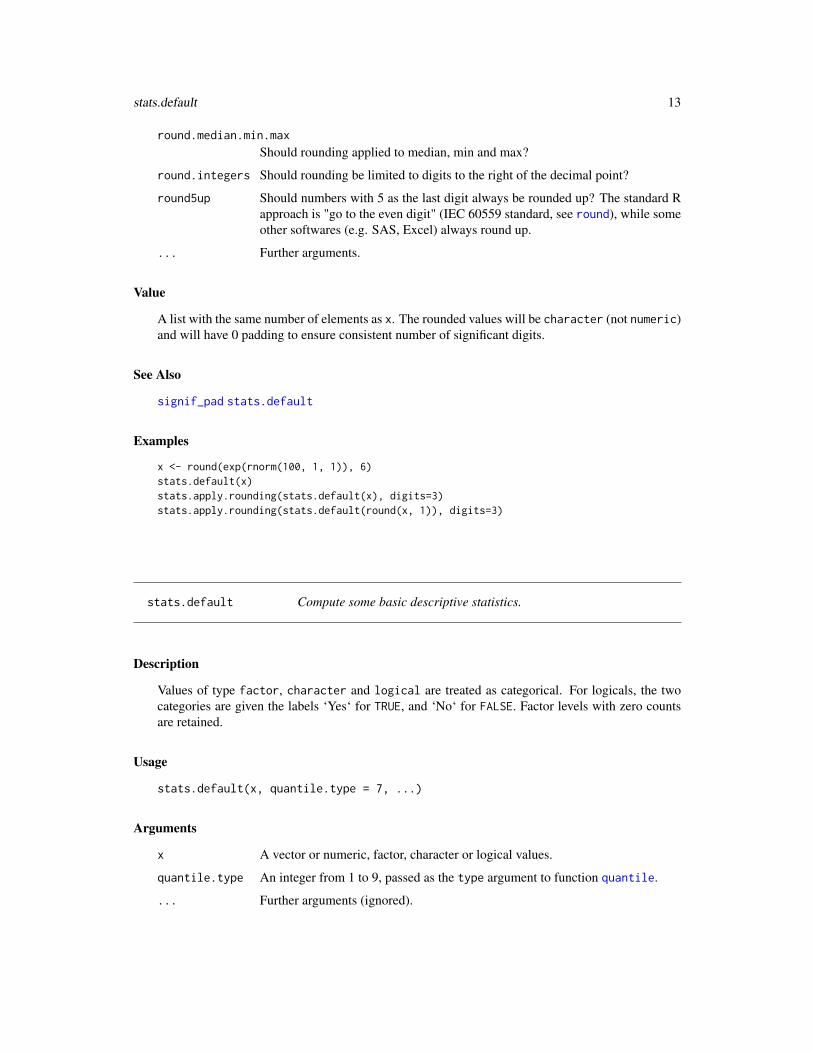
round.median.min.max
Should rounding applied to median, min and max?
round.integers Should rounding be limited to digits to the right of the decimal point?
round5up Should numbers with 5 as the last digit always be rounded up? The standard Rapproach is "go to the even digit" (IEC 60559 standard, see round), while someother softwares (e.g. SAS, Excel) always round up.
... Further arguments.
Value
A list with the same number of elements as x. The rounded values will be character (not numeric)and will have 0 padding to ensure consistent number of significant digits.
See Also
signif_pad stats.default
Examples
x <- round(exp(rnorm(100, 1, 1)), 6)stats.default(x)stats.apply.rounding(stats.default(x), digits=3)stats.apply.rounding(stats.default(round(x, 1)), digits=3)
stats.default Compute some basic descriptive statistics.
Description
Values of type factor, character and logical are treated as categorical. For logicals, the twocategories are given the labels ‘Yes‘ for TRUE, and ‘No‘ for FALSE. Factor levels with zero countsare retained.
Usage
stats.default(x, quantile.type = 7, ...)
Arguments
x A vector or numeric, factor, character or logical values.
quantile.type An integer from 1 to 9, passed as the type argument to function quantile.
... Further arguments (ignored).

14 stats.default
Value
A list. For numeric x, the list contains the numeric elements:
• N: the number of non-missing values
• NMISS: the number of missing values
• SUM: the sum of the non-missing values
• MEAN: the mean of the non-missing values
• SD: the standard deviation of the non-missing values
• MIN: the minimum of the non-missing values
• MEDIAN: the median of the non-missing values
• CV: the percent coefficient of variation of the non-missing values
• GMEAN: the geometric mean of the non-missing values if non-negative, or NA
• GCV: the percent geometric coefficient of variation of the non-missing values if non-negative,or NA
• qXX: various quantiles (percentiles) of the non-missing values (q01: 1%, q02.5: 2.5%, q05:5%, q10: 10%, q25: 25% (first quartile), q33.3: 33.33333% (first tertile), q50: 50% (median,or second quartile), q66.7: 66.66667% (second tertile), q75: 75% (third quartile), q90: 90%,q95: 95%, q97.5: 97.5%, q99: 99%)
• Q1: the first quartile of the non-missing values (alias q25)
• Q2: the second quartile of the non-missing values (alias q50 or Median)
• Q3: the third quartile of the non-missing values (alias q75)
• IQR: the inter-quartile range of the non-missing values (i.e., Q3 -Q1)
• T1: the first tertile of the non-missing values (alias q33.3)
• T2: the second tertile of the non-missing values (alias q66.7)
If x is categorical (i.e. factor, character or logical), the list contains a sublist for each category,where each sublist contains the numeric elements:
• FREQ: the frequency count
• PCT: the percent relative frequency, including NA in the denominator
• PCTnoNA: the percent relative frequency, excluding NA from the denominator
Examples
x <- exp(rnorm(100, 1, 1))stats.default(x)
y <- factor(sample(0:1, 99, replace=TRUE), labels=c("Female", "Male"))y[1:10] <- NAstats.default(y)stats.default(is.na(y))

subsetp 15
subsetp Subset function that preserves column attributes.
Description
Subset function that preserves column attributes.
Usage
subsetp(x, ..., droplevels = TRUE)
Arguments
x An object to be subsetted (usually a data.frame).
... Further arguments passed to subset.
droplevels If TRUE (the default), then unused factor levels are dropped (see droplevels).
Value
An object similar to x containing just the selected elements. In the case of a data.frame, attributesof columns (such as label and units) are preserved.
See Also
subset droplevels
t1read Read and augment data with extended metadata attributes
Description
Read and augment data with extended metadata attributes
Usage
t1read(data, metadata = NULL, read.fun = read.csv, ..., escape.html = TRUE)

16 t1read
Arguments
data Either a file name (character) or a data.frame. If a file name it will be readusing the function read.fun.
metadata Either a file name (character) or a list. If a file name it will be read using thefunction read_yaml (so it should be a file the contains valid YAML text), and alist results. See Details regarding the list contents.
read.fun A function to read files. It should accept a file name as its first argument andreturn a data.frame.
... Further optional arguments, passed to read.fun.
escape.html Logical. Should strings (labels, units) be converted to valid HTML by escapingspecial symbols?
Details
The metadata list may contain the following 3 named elements (other elements are ignored):
• labels: a named list, with names corresponding to columns in data and values the associatedlabel attribute.
• units: a named list, with names corresponding to columns in data and values the associatedunits attribute.
• categoricals: a named list, with names corresponding to columns in data and values arethemselves lists, used to convert the column to a factor: the list names are the levels, and thevalues are the associated labels. The names can also be omitted if the goal is just to specifythe order of the factor levels.
Value
A data.frame (as returned by read.fun).
Examples
# Simulate some dataset.seed(123)data <- expand.grid(sex=0:1, cohort=1:3)[rep(1:6, times=c(7, 9, 21, 22, 11, 14)),]data$age <- runif(nrow(data), 18, 80)data$agecat <- 1*(data$age >= 65)data$wgt <- rnorm(nrow(data), 75, 15)
metadata <- list(labels=list(cohort = "Cohort",sex = "Sex",age = "Age",agecat = "Age category",wgt = "Weight"),
units=list(age = "years",wgt = "kg"),
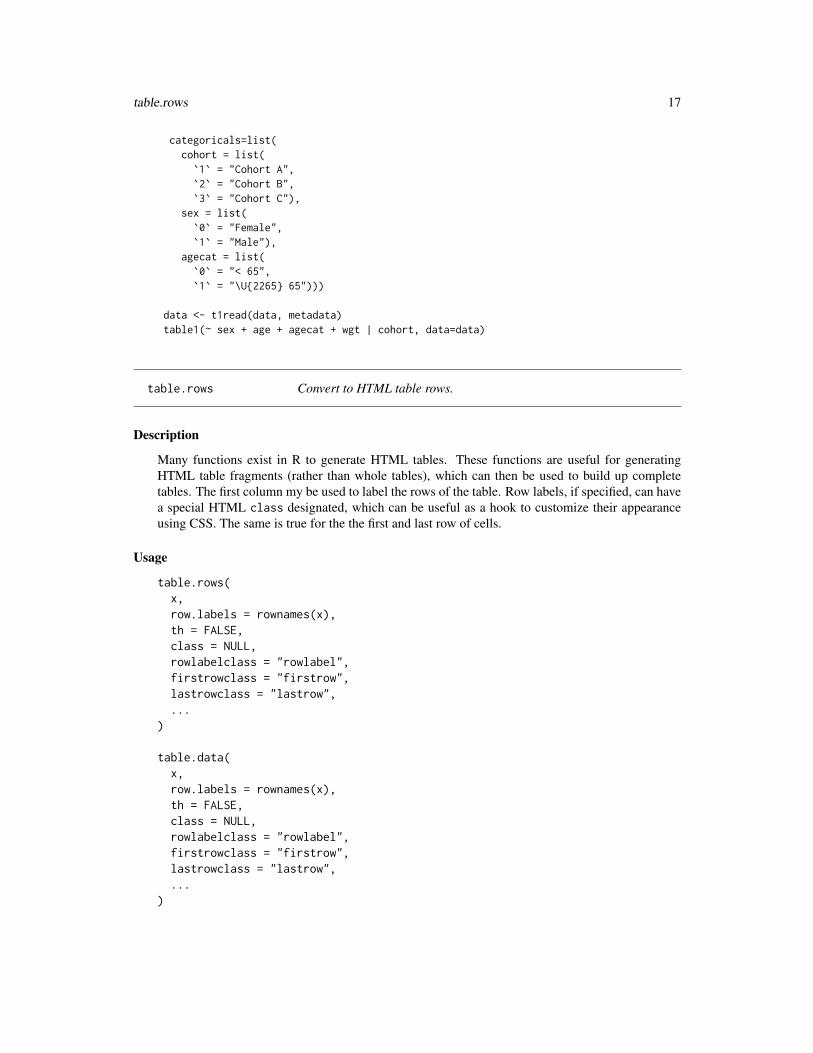
table.rows 17
categoricals=list(cohort = list(
`1` = "Cohort A",`2` = "Cohort B",`3` = "Cohort C"),
sex = list(`0` = "Female",`1` = "Male"),
agecat = list(`0` = "< 65",`1` = "\U{2265} 65")))
data <- t1read(data, metadata)table1(~ sex + age + agecat + wgt | cohort, data=data)
table.rows Convert to HTML table rows.
Description
Many functions exist in R to generate HTML tables. These functions are useful for generatingHTML table fragments (rather than whole tables), which can then be used to build up completetables. The first column my be used to label the rows of the table. Row labels, if specified, can havea special HTML class designated, which can be useful as a hook to customize their appearanceusing CSS. The same is true for the the first and last row of cells.
Usage
table.rows(x,row.labels = rownames(x),th = FALSE,class = NULL,rowlabelclass = "rowlabel",firstrowclass = "firstrow",lastrowclass = "lastrow",...
)
table.data(x,row.labels = rownames(x),th = FALSE,class = NULL,rowlabelclass = "rowlabel",firstrowclass = "firstrow",lastrowclass = "lastrow",...
)
18 table1
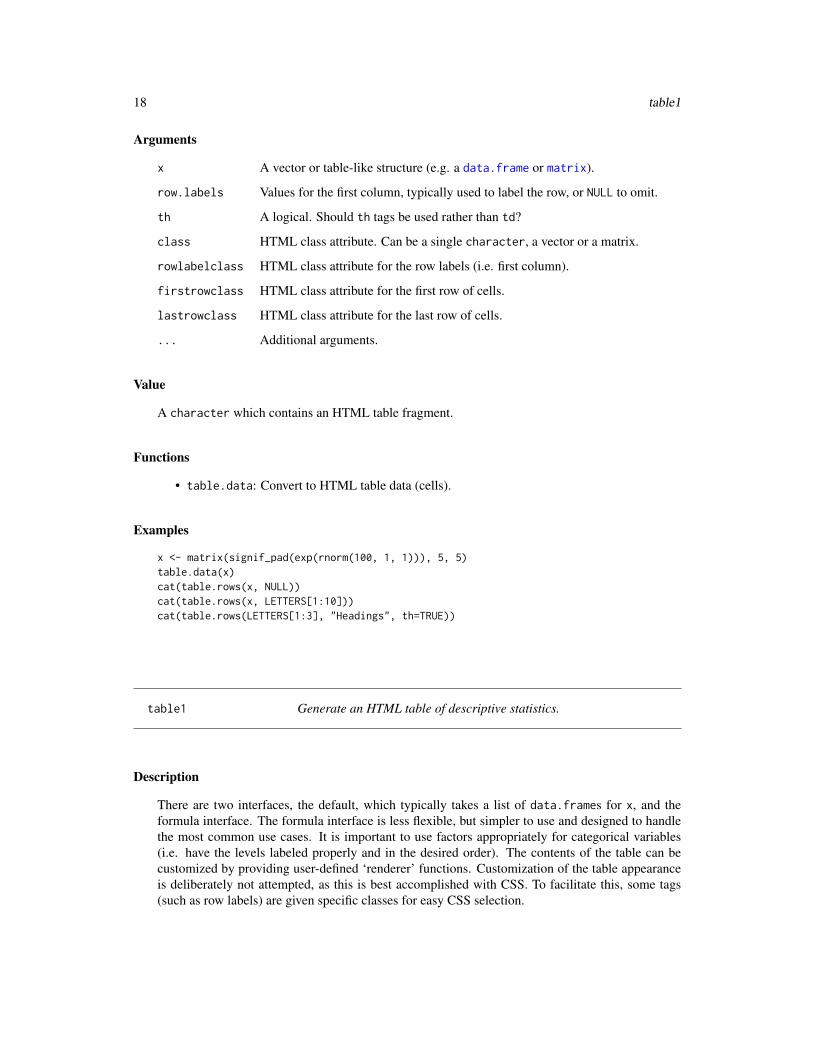
Arguments
x A vector or table-like structure (e.g. a data.frame or matrix).
row.labels Values for the first column, typically used to label the row, or NULL to omit.
th A logical. Should th tags be used rather than td?
class HTML class attribute. Can be a single character, a vector or a matrix.
rowlabelclass HTML class attribute for the row labels (i.e. first column).
firstrowclass HTML class attribute for the first row of cells.
lastrowclass HTML class attribute for the last row of cells.
... Additional arguments.
Value
A character which contains an HTML table fragment.
Functions
• table.data: Convert to HTML table data (cells).
Examples
x <- matrix(signif_pad(exp(rnorm(100, 1, 1))), 5, 5)table.data(x)cat(table.rows(x, NULL))cat(table.rows(x, LETTERS[1:10]))cat(table.rows(LETTERS[1:3], "Headings", th=TRUE))
table1 Generate an HTML table of descriptive statistics.
Description
There are two interfaces, the default, which typically takes a list of data.frames for x, and theformula interface. The formula interface is less flexible, but simpler to use and designed to handlethe most common use cases. It is important to use factors appropriately for categorical variables(i.e. have the levels labeled properly and in the desired order). The contents of the table can becustomized by providing user-defined ‘renderer’ functions. Customization of the table appearanceis deliberately not attempted, as this is best accomplished with CSS. To facilitate this, some tags(such as row labels) are given specific classes for easy CSS selection.

table1 19
Usage
table1(x, ...)
## Default S3 method:table1(x,labels,groupspan = NULL,rowlabelhead = "",transpose = FALSE,topclass = "Rtable1",footnote = NULL,caption = NULL,render = render.default,...
)
## S3 method for class 'formula'table1(x,data,overall = "Overall",rowlabelhead = "",transpose = FALSE,droplevels = TRUE,topclass = "Rtable1",footnote = NULL,render = render.default,...
)
Arguments
x An object, typically a formula or list of data.frames.
... Further arguments, passed to render.
labels A list containing labels for variables, strata and groups (see Details).
groupspan A vector of integers specifying the number of strata to group together.
rowlabelhead A heading for the first column of the table, which contains the row labels.
transpose Logical. Should the table be transposed (i.e. strata as rows and variables ascolumns)?
topclass A class attribute for the outermost (i.e. <table>) tag.
footnote A character string to be added as a footnote to the table. The default NULL causesthe footnote to be omitted.
caption A character string to be added as a caption to the table. The default NULL causesthe caption to be omitted.
render A function to render the table cells (see Details).

20 table1
data For the formula interface, a data.frame from which the variables in x shouldbe taken.
overall A label for the "Overall" column. Specify NULL or FALSE to omit the columnaltogether.
droplevels Should empty factor levels be dropped?
Details
For the default version, is is expected that x is a named list of data.frames, one for each stratum,with names corresponding to strata labels.
Value
An object of class "table1".
Methods (by class)
• default: The default interface, where x is a data.frame.
• formula: The formula interface.
Examples
dat <- expand.grid(id=1:10, sex=c("Male", "Female"), treat=c("Treated", "Placebo"))dat$age <- runif(nrow(dat), 10, 50)dat$age[3] <- NA # Add a missing valuedat$wt <- exp(rnorm(nrow(dat), log(70), 0.2))
label(dat$sex) <- "Sex"label(dat$age) <- "Age"label(dat$treat) <- "Treatment Group"label(dat$wt) <- "Weight"
units(dat$age) <- "years"units(dat$wt) <- "kg"
# One level of stratificationtable1(~ sex + age + wt | treat, data=dat)
# Two levels of stratification (nesting)table1(~ age + wt | treat*sex, data=dat)
# Switch the order or nestingtable1(~ age + wt | sex*treat, data=dat)
# No stratificationtable1(~ treat + sex + age + wt, data=dat)
# Something more complicated
dat$dose <- ifelse(dat$treat=="Placebo", "Placebo",

units 21
sample(c("5 mg", "10 mg"), nrow(dat), replace=TRUE))dat$dose <- factor(dat$dose, levels=c("Placebo", "5 mg", "10 mg"))
strata <- c(split(dat, dat$dose),list("All treated"=subset(dat, treat=="Treated")),list(Overall=dat))
labels <- list(variables=list(sex=render.varlabel(dat$sex),
age=render.varlabel(dat$age),wt=render.varlabel(dat$wt)),
groups=list("", "Treated", ""))
my.render.cont <- function(x) {with(stats.default(x),
sprintf("%0.2f (%0.1f)", MEAN, SD))}
table1(strata, labels, groupspan=c(1, 3, 1), render.continuous=my.render.cont)
# Transposed tabletable1(~ age + wt | treat, data=dat, transpose=TRUE)
units Units attribute.
Description
Units attribute.
Usage
units(x)
units(x) <- value
has.units(x)
Arguments
x An object.
value A character specifying the units
Functions
• units<-: Set units attribute.
• has.units: Check for attribute.

22 units
Examples
x <- 1:10units(x) <- "cm"has.units(x)units(x)

Index
∗Topic utilitieseqcut, 2label, 4parse.abbrev.render.code, 5render.categorical.default, 7render.continuous.default, 7render.default, 8render.missing.default, 9render.varlabel, 10signif_pad, 11stats.apply.rounding, 12stats.default, 13subsetp, 15t1read, 15table.rows, 17table1, 18units, 21
cut, 2, 3
data.frame, 15, 18droplevels, 15
eqcut, 2
format, 11formatC, 11
has.label (label), 4has.units (units), 21
knit_print.table1, 4
label, 4, 10, 15label<- (label), 4
matrix, 18
names, 7–10
parse.abbrev.render.code, 5, 9
prettyNum, 11print.table1, 6
quantile, 2, 3, 13
read_yaml, 16render.categorical.default, 7render.continuous.default, 7render.default, 8render.missing.default, 9render.varlabel, 10round, 11, 13round_pad (signif_pad), 11
signif, 11signif_pad, 11, 13stats.apply.rounding, 5, 7–9, 12stats.default, 5, 12, 13, 13subset, 15subsetp, 15
t1read, 15table.data (table.rows), 17table.rows, 17table1, 4, 6–9, 18table1.formula, 10
unit, 10units, 15, 21units<- (units), 21
23