pacific west region, national park service
TRANSCRIPT

1
Study of Climate Change Impacts on Cultural Landscapes in the Pacific West Region, National Park Service
Cultural Landscape Research Group
Department of Landscape Architecture
University of Oregon, Eugene, OR
2016

This project was completed under Task Agreement P15AC01594, U.S. Department of the Interior, National Park Service, Pacific West Region. Additional support provided through a grant from the National Park Service National Center for Preservation Technology and Training and The Office of the Vice-President for Research and Innovation, University of Oregon.

3
Study of Climate Change Impacts on Cultural Landscapes in the Pacific West Region
Cultural Landscape Research GroupDepartment of Landscape ArchitectureUniversity of Oregon, Eugene, OR
Robert Z. Melnick, FASLAVeronica MalinayNoah P. KerrAlison Lewis
December 31, 2016


5
Table of Contents
Introduction & Background
Methods
Six Case Studies
Scotty’s Castle Historic District, Death Valley National Park, CA
Bibliography
Climate Projections within the National Park Service Pacific West Region
Hazards and Impacts
Vulnerability Assessment Matrix
Case Studies
Eugene O’Neill National Historic Site, CA
East Kamiah/Heart of the Monster, Nez Perce National Historical Park, ID
Buckner Homestead Historic District, Lake Chelan National Recreation Area, Managed by North Cascades National Park Service Complex, WA
Pu’ukoholā Heiau National Historic Site, HI
Lyons Ranches Historic District, Redwood National Park, CA
Appendix A: Vulnerability Matrix Example
Appendix B: Current Exposure/GIS Analysis
Appendix C: Projected Exposure Calculations
Acknowledgements
Conclusion and Recommendations
7
15
23
80
81
16
17
18
19
24
34
43
52
61
70
92
86
84
82

6
This project responds to the growing need to understand the potential effects of projected climate trends and events on cultural landscapes.

7
The study of climate change impacts on cultural landscapes in the Pacific West Region (PWR), National Park Service (NPS), was conducted by the Cultural Landscape Research Group (CLRG)+, a unit of the Department of Landscape Architecture at the University of Oregon (UO), in collaboration with the National Park Service. Working with climate scientists, archeologists, ecologists, historians, biologists, botanists, preservationists, and designers CLRG utilized NPS and USGS localized climate projections to assess how cultural landscapes within the PWR have the potential to be affected by climate, and developed recommendations on future research toward the agency’s goal of ensuring cultural landscapes are resilient to climate change.
This project responds to the growing need to understand the potential effects of projected climate trends and events on cultural landscapes. Previous to this study, in 2015, with funding through the National Center for Preservation Technology and Training, the NPS Climate Change and Cultural Resources Programs worked with the UO team to develop a manual entitled “Climate Change and Cultural Landscapes: Research, Planning, and Stewardship.” That manual continued to refine an effort to develop adaptation options for climate change impacts to cultural landscapes by offering a range of potential actions (See Figure 1.3) or ‘decision trees’ for resource managers and decision makers. That project included a study of cultural landscapes in six eastern US national parks*, resulting in the fundamental methodological structure of this work, and the decision tree (See Figure 1.2) that has guided the current effort. This project builds on that previous work and manual.
Introduction and Background
+ UO CLRG members: Robert Z. Melnick, FASLA, PI; Veronica Malinay, MLA; Noah P. Kerr, MS; Alison Lewis, MLA.* Shenandoah National Park, VA; Cape Lookout National Seashore, NC; George Washington National Parkway, VA; Valley Forge National Historical Park, PA; Saint-Gaudens National Historic Site, NH; Gateway National Recreation Area, NY.
Figure 1.1: A cultural landscape in the NPS PWR, The Heart of the Monster is found in the Kamiah Valley in Idaho, the home of the Nez Perce tribe, and is a study site for this project. (Malinay/UO CLRG, 2016)

8
Identify climate related vulnerabilities.
Identify goals, drivers, and robust strategies; envision potential futures.
Identify landscape characteristicsand character-defining features projected to be affected.
Gather climate change projections data.
Complete vulnerability assessmentfor character defining features.
Establish triggers for long term and disaster response.
Identify a range of adaptation and management options. Balance among
constraints and opportunities- budget, priorities, personnel, available knowledge, etc.
Adopt and implement actions.
Monitor and revise as needed.
CLIMATE CHANGE AND CULTURAL LANDSCAPESRE
SEA
RCH
PLA
NN
ING
STEW
ARD
SHIP
Complete cultural landscapeidentification and evaluation(CLI and CLR).
Figure 1.2: The decision tree from the manual, “Climate Change and Cultural Landscapes: Research, Planning, and Stewardship” guides the current effort for this project.

9
Figure 1.3: The range of adaptation options for research managers and decision makers for climate change impacts to cultural resources. These adaptation options were developed over a series of projects by the NPS Climate Change Adaptation Coordinator for Cultural Resources, Preserving Coastal Heritage Workshop (2014), and NPS Coastal Adaptation Handbook. In “Climate Change and Cultural Landscapes: Research, Planning, and Stewardship,” the adaptation options are adapted for their application to cultural landscapes.
iinfo
OFFSET STRESSES IMPROVE RESILIENCE
MANAGE CHANGE
DOCUMENT
RELOCATE/FACILITATEMOVEMENT
INTERPRET THE CHANGE
NO ACTIVE INTERVENTION
ADAPTATIONOPTIONS
For cultural landscapes, this includes monitoring the rate and degree of landscape dynamics, to assess whether or not it is within the historic range.
For cultural landscapes, this includes consideration at a ‘landscape’ scale, to ensure that the effort to deflect or remove a stress does not result in negative impact to the larger ecosystem. As with other cultural resources, this may include both temporary and long-term measures.
For cultural landscapes, plans to address climate adaptation should include hazard and negative impact protection in coordination with standard Cultural Landscape Inventory and Condition Assessment management procedures.
For cultural landscapes, this requires a broader acceptance of change as an essential process and often character-defining aspect.
For cultural landscapes, this is an unusual or rare instance and movement is not feasible for a whole landscape. This option may be an appropriate choice for character-defining features of a landscape once the whole cannot be saved.
For cultural landscapes, it is necessary to document the cultural landscape from multiple aspects and scales, including during different seasons, as conditions will change throughout the yearly cycle.
For cultural landscapes, this includes interpreting landscape change during and since the period of significance, to better demonstrate the impact of climate change within the context of landscape dynamics. Landscape interpretation also provides an opportunity for an educational opportunity, telling the on-going story of the integration of natural and cultural systems.

10
A matrix (See an example in Appendix A: Vulnerability Assessment Matrix) was developed that provides an updated collection and organization of data needed to evaluate the exposure of all cultural landscapes that have completed cultural landscape inventories in the Pacific West Region. The matrix summarizes all of the character-defining features and environmental impacts for 164 cultural landscapes in the Pacific West Region using the data from the NPS Cultural Landscapes Inventory (CLI) database. The matrix summarizes the exposure of the cultural landscapes’ character-defining features to current environmental hazards and to projected changes climate. The exposure to current environmental hazards and project climate change is then scored for each cultural landscape in order to rank the cultural landscapes by these scores to understand the overall exposure of the cultural landscape to current risk and projected future climate change.
CLIMATE DATA• Temperature• Precipitation• Sea Level• Storms
HAZARDS & IMPACTS• Fire• Flood • Landslide• Drought• Erosion• Exposure to elements• Micro-climate• Pest/Disease• Vegetation/Invasive Species• Disruption of Species
CULTURAL LANDSCAPE CHARACTERISTICS• Natural systems and features• Spatial organization• Land use• Cultural traditions• Cluster arrangements• Circulation• Topography• Vegetation• Buildings and structures• Views/vistas• Constructed water features• Small-scale features• Archeological sites
Six case studies were conducted, which include identification of current condition, projected climate change, and recommended management strategies to address current condition deficiencies and areas of future research. Each case study includes a cultural landscape summary, a summary of regional climate change projections, an existing conditions summary, a summary of the hazard exposure, and recommendations for next steps.
CULTURAL LANDSCAPES
• Lyons Ranches Historic District, Redwood National Park, CA
• Scotty’s Castle Historic District, Death Valley National Park, CA
• Pu’ukoholā Heiau National Historic Site, HI
• Eugene O’Neill National Historic Site, CA
• Buckner Homestead Historic District, Lake Chelan National Recreation Area, Managed by North Cascades National Park Service Complex, WA
• East Kamiah/Heart of the Monster, Nez Perce National Historical Park, ID
The study of climate change impacts on cultural landscapes within the Pacific West Region includes two components.CLIMATE CHANGE PROJECTIONS, HAZARDS AND IMPACTS, AND CULTURAL LANDSCAPE DATA
CASE STUDIES

11
Figure 1.4: A cultural landscape in the NPS PWR, Eugene O’Neill National Historic Site sits above Danville, CA. (Kerr/UO CLRG, 2016)

12
The Cultural Landscapes Inventory (CLI) is an evaluated inventory of all landscapes in the National Park System, that have historical significance and are listed or eligible for listing in the National Register of Historic Places, or otherwise managed as cultural resources through a public planning process, and in which the NPS has or plans to acquire any legal interest. The CLI identifies and documents each landscape’s location, size, physical development, landscape characteristics, character-defining features, condition, impacts, as well as other valuable information useful to park management.
The condition of, and impacts to, a cultural landscape are documented in the CLI. To maintain accurate information, the CLI condition and impacts are regularly updated, with condition summaries, and new impact descriptions. In 2014, the standardized list of impacts documented in the CLI was updated to include all potential climate change impacts defined by the Climate Change and Cultural Resources Response Program. In this project, the condition and impacts for each cultural landscape were analyzed with regard to current climate change projection data to identify and potentially quantify anticipated climate change impacts through the existing stewardship framework of the CLI.
Adaptation strategies are being developed for cultural resources management by the NPS to respond to the threat of climate change impacts to cultural resources, including cultural landscapes. Using vulnerability analysis, both short term and long term adaptation and mitigation strategies are being developed to mitigate the threat. In this project, NPS and UO tested and refined the cultural resource climate change response framework through an analysis of projected climate change impacts to cultural landscapes located in the western United States and Pacific Islands.
From this analysis, case study examples were used to identify the current condition of the cultural landscape and how this condition could influence how the cultural landscape could be affected by projected changes in climate. This is the first step in understanding the vulnerability of the cultural landscape to climate change. These case studies helped to confirm the current and projected exposure of the cultural landscape to specific climate variables. Future analysis is needed to understand how sensitive the cultural landscape is to this exposure in order to fully understand the vulnerability of the cultural landscape to climate change and to develop strategies for mitigating the projected effects. Critical to this approach was collaboration in collecting and sharing data between UO CLRG and NPS.
Cultural Landscape Inventory and Climate Adaptation Strategies
1. Collect climate change projection data pertinent to 164 cultural landscapes in 43 parks in the Pacific West Region, including, but not limited to, climate change trends of air temperature, precipitation, sea level, and storms.
OBJECTIVES
The objectives of this study are to:

13
2. Identify anticipated climate change related exposures for each of the 164 cultural landscapes.
3. Conduct six case study cultural landscape condition assessments, using the CLI Professional Procedures condition assessment framework, to verify current condition and impacts, and identify next steps towards ensuring the current impacts are addressed in order to improve the resiliency of the cultural landscape to future impacts.

14
There are two major components to this study: a matrix to evaluate data related to climate exposure of cultural landscapes; and six case studies in which the exposure assessment was tested.

15
Figure 1.5: Buckner Homestead Historic District, one of the six case studies for this project, is located on a horseshoe bend of the Stehekin River in North Cascades National Park Service Complex in the remote North Cascades of central Washington. (Kerr/UO CLRG, 2016)
Methods
Based on a decision tree framework that organizes and prioritizes an approach to addressing the impacts of climate change on cultural landscapes, this project tested and refined an existing framework for managing the projected effects of climate change on cultural landscapes. The project is focused on the “Research” portion of the decision tree (See Figure 1.2). Though the figure illustrates that the decision tree occurs in a linear timeline, the process and its components are complex and robust. It is recommended that the climate data and cultural landscape assessments be periodically updated.
There are two major components to this study: a matrix to evaluate data related to climate exposure of cultural landscapes; and six case studies in which the exposure assessment was tested. Both components require regional climate projections. This exposure data will serve future phases of this study in which the vulnerability of the cultural landscape can be assessed once exposure and sensitivity to the exposure has been identified.
Standard NPS cultural landscape analytical techniques were employed, based on previously collected and analyzed data in the Cultural Landscape Inventory (CLI) for each site.

16
The team primarily considered projections for temperature, precipitation, sea level, and storms; and compiled regional climate projections from published data sources, including National Park Service (NPS) reports, Intergovernmental Panel on Climate Change (IPCC), the National Climate Assessment, and United States Geological Survey (USGS) National Climate Change Viewer. While there are other projections that can also be considered (e.g., snow pack, soil moisture, etc.) the four primary projections were selected due to the availability of data for the study sites and reduced uncertainty in the data. These projections guide the analysis of the hazards and impacts on the cultural landscapes.
The climate projections for this study use the highest emissions scenario from the IPCC. Representative Concentration Pathways (RCP) are four trajectories reported in the IPCC Fifth Assessment Report (AR5). RCP 8.5 is characterized as “business as usual” in which emissions from fossil fuels continues at its current rate. Carbon emmissions have followed, if not exceeded, RCP 8.5 since its introduction in 2007.
CLIMATE PROJECTIONS WITHIN THE NPS PACIFIC WEST REGION
TEMPERATURE PRECIPITATION
SEA LEVEL STORMS
Figure 1.6: Observed emissions and emissions scenarios. Data: CDIAC/GCP/IPCC/Fuss et al, 2014.
EMIS
SIO
NS F
ROM
FO
SSIL
FUEL
S AN
D CE
MEN
T (G
tCO
2/yr)
2016 ESTIMATE
HISTORICAL EMISSIONS
NET-NEGATIVE GLOBAL EMISSIONS
SCENARIO CATEGORIES

17
HAZARDS
Hazards associated with projections for temperature, precipitation, sea level, and storms are evaluated, including: drought, fire, flood, and landslide. The hazard data was derived from established risk data made available by National Park Service (NPS), Federal Emergency Management Agency (FEMA), United States Geological Survey (USGS), and United States Forest Service (USFS). These hazards were selected based on the availability of the data for the study sites. Hazards that did not have available data were not included in this study, and are reflected in the case study maps.
This project incorporates available Geographic Information System (GIS) data pertaining to fire, flood, landslide, and drought for each cultural landscape. Within each site, each feature receives a hazard score between zero and one, based on that feature’s location within fire, flood, landslide, and drought hazard areas (See Figures REDW 1.11, DEVA 1.9, PUHE 1.10, EUON 1.9, NOCA 1.10, and NEPE 1.10). As some contributing features are not located spatially in GIS, the method for analyzing current hazards includes referring to site plans within the CLIs to identify the location of certain features. In general, any feature that cannot be located in space on either the site plan or within GIS, did not receive a hazard score.
IMPACTS
The UO CLRG team used the previously existing identified impacts to the cultural landscape catalogued in the CLI database, including: disruption; loss of plant species; erosion; exposure to elements; neglect; pests/diseases; pruning practices; release to succession; structural deterioration; temperature/hot extremes; temperature/warmer averages; and vegetation/invasive plants, all of which are impacts tracked by NPS for all cultural landscapes. For the case studies, these impacts were verified in the field.
EQUATION
Vulnerability of a resource to an individual hazard = (historical exposure x sensitivity) + (projected exposure x sensitivity).
Exposure is the external trend or event, independent of the resource, and includes historical and projected climate change.
Sensitivity is the inherent susceptibility of a resource and is independent of exposure.
This study focuses on exposure.
The GIS maps included in this study use the best available data. The data collected contributed to the initial research for the field assessment. Because the data are coarse, they lack precision and detail. Finer scale data are needed to further the research.

18
VULNERABILITY ASSESSMENT MATRIX
Exposure is “the presence of people, livelihoods, species or ecosystems, environmental functions, services, and resources, infrastructure, or economic, social, or cultural assets in places and settings that could be adversely affected” (IPCC 2014). For this study, the definition of exposure is amended to focus on how climate change could adversely affect the cultural landscape features. This matrix aggregates a broad range of information including: on-site and geo-spatial analyses, and climate studies and models. The matrix is intended to assist NPS decision-makers in directing further analysis, field assessment, and appropriate treatment measures. The four major criteria included in the ranking system of the matrix are: Condition, Current Exposure, Historical Exposure, and Projected Exposure.
ConditionThis component of the matrix is an overarching, landscape-scale assessment of condition. This includes interpretation of qualitative levels of the condition status described in the CLI. Categories include “Good,” “Fair,” and “Poor”. Each level of condition receives a numerical score from a limited range: 0.33 for a CLI status of “Good”; 0.66=“Fair”; and 1=“Poor.”
Current ExposureCurrent Exposure identifies that the cultural landscape feature is at risk to a hazard and is spatially specific. This assigned value includes current Geographic Information System (GIS) spatial data. The rankings for landslides, drought, and fire range from low to high, with the range 0-1. There is currently no GIS data for water/wind erosion, exposure to elements, micro-climate, pest/disease, invasive plants, and disruption of species.
This assessment consists of analysis between the cultural landscape’s site plan, as found in the Cultural Landscape Inventory, and GIS spatial data. If a CLI was not available, no analysis was conducted as certain information about these sites may only be found in the site plan.
Historical ExposureKnown current and historical impacts are identified, primarily through the CLI. The Condition Assessment section of each CLI includes a listing of discrete impacts that are standardized for NPS use. Each impact identified in this section concerns at least one cultural landscape feature, although in some cases, several may be affected. For each impact identified in the CLI, all relevant contributing features were identified, and assigned a point value to the row of each feature affected.
Point values for each cultural landscape feature are in a tally format by row, where each documented impact constitutes a single, whole-number point increase. For example, a remnant orchard impacted by blight damage (“Pest/Disease” indicator category) would receive a value of ‘1’, whereas a constructed watercourse undermined by erosion and damaged by invasive vegetation would receive a point for each impact, for a total of ‘2.’ Likewise, a single impact may affect several features, generating a point for each in turn. Every point increase is tallied under the appropriate Hazard Indicator column of the assessment (at the feature scale), within “Historical Impact” cells.
Projected ExposureProjected Exposure is a calculation of intensity and confidence of the climate projections data. The data are comprised of the updated regional climate projections by county, and where available, by park scale.
Intensity: estimated magnitude of climate change per climate variable.
Confidence: range of certainty/uncertainty in the climate change projections. (High confidence = 1.0, Medium-High confidence = .75, Medium-Low confidence = .50, Low confidence = .25). Sources: IPCC, NPS reports, USGS National Climate Change Viewer.
A detailed explanation of the scoring system for projected exposure can be found in Appendix C.
The vulnerability assessment matrix (See example in Appendix A) organizes exposure of cultural landscape character defining features according to climate change projection data.
A detailed explanation of the scoring system for each of the four hazards related to Current Exposure can be found in Appendix B.

19
CASE STUDIES
1. The six cultural landscapes for this phase of the project were selected based on three factors: each landscape is in a different Pacific West Region network; at least one of each type of cultural landscape is represented (i.e., historic site, vernacular, design, ethnographic); and there was availability of park staff to participate and assist with the field visit and research. This set of criteria provided for the identification of six cultural landscapes in the Pacific West Region, representing a broad range of landscape types and regional distribution (See Figure 1.8).
2. Following site selection, the team reviewed the CLI for each site and retrieved available climate projection data from published data sources, including NPS reports, Intergovernmental Panel on Climate Change (IPCC), the National Climate Assessment, and United States Geological Survey (USGS) National Climate Change Viewer, resulting in a determination of the potential climate stresses and impacts on previously identified cultural landscape characteristics and features.
3. This was followed by a webinar and meetings with NPS regional and park staff, sharing this information and data, and collecting additional observations, recommendations for current literature and primary source materials, as well as other information and advice from staff.
4. The next step included a field investigation of each study site with regional and park staff, with the goal of gaining, in the field, a better understanding of the current impacts on the contributing cultural landscape features, and to identify opportunities for future studies of attribution of those impacts to climate change on cultural landscapes. These field investigations enabled the team to better understand and evaluate potential climate impacts with NPS staff, raise new questions not apparent in the literature review phase of the project, and gain an overall view of existing conditions of the cultural landscape (See Figure 1.7).
The site visits were critical to the project, but presented some limitations. Primary among these was the relatively short site visit - one season, and in only one year. The project scope did not provide for long-term studies, but did provide for
Figure 1.7: The research team conducts field investigations with NPS staff at Eugene O’Neill National Historic Site (EUON), Buckner Homestead Historic District (NOCA), and Lyons Ranches Historic District (REDW). (Melnick/Malinay/Kerr/UO CLRG, 2016)

20
the incorporation of critical, and often long-term, observations from park staff. The site visits also provided an insight into park priorities, competing demands for staff expertise and funding, and the acknowledged level of unavailable historical and projected climate data.
Tasks included visual inspection of buildings, structures, vegetation, and other landscape features to assess condition and impacts, taking photos, compiling field notes, synthesizing information collected in the field, including organizing notes and photos, and writing descriptions of each impact within the cultural landscape using the CLI Professional Procedures framework for defining impacts.
5. The UO CLRG team and NPS staff then developed recommendations for next steps that work towards improving the resilience of the character-defining features.

21
Buckner Homestead Historic District
Heart of the Monster
Lyons Ranches Historic District
Eugene O’Neill National Historic Site
Scotty’s Castle Historic District
UPPER COLUMBIA BASIN
KLAMATH
SIERRA
MOJAVEDESERT
MEDITERRANEANCOAST
SAN FRANCISCOBAY AREA
NORTH COASTand
CASCADES
PACIFIC ISLANDS
CALIFORNIA
NEVADA
OREGON
WASHINGTON
IDAHO
HAWAII
Pu’ukohola Heiau National Historic Site
Figure 1.8: The six cultural landscapes case studies represent the Pacific West Region networks, different landscape types, and regional distribution.

22

23
Scotty’s Castle Historic District, Death Valley National Park, CA
Eugene O’Neill National Historic Site, CA
East Kamiah/Heart of the Monster, Nez Perce National Historical Park, ID
Buckner Homestead Historic District, Lake Chelan National Recreation Area, Managed by North Cascades National Park Service Complex, WA
Pu’ukoholā Heiau National Historic Site, HI
Lyons Ranches Historic District, Redwood National Park, CA
Case Studies
Figure 1.9: Images from the six case study locations. (UO CLRG, 2016)

24
Figure REDW 1.1: Lyons Ranches, in the Bald Hills of Redwood National Park, is set within the prairies and oakwoods of the Redwood Creek watershed. (Kerr/UO CLRG, 2016)

25
• Size: 5,660.50 acres (2,290 hectares)
• Cultural Landscape Type: Historic Vernacular Landscape
• Period of Significance: 1868 - 1959The District’s period of significance under Criteria A and C begins in 1868, the time by which Jonathan Lyons had settled on land in the District, and continues through 1959. The end date of 1959 represents the end of the period for which sheep ranching was a major economic presence in the Bald Hills.
• National Register Significance: Criterion AThe District is significant under Criterion A at the local level for its association with the history and development of the Bald Hills as a sheep ranching community.
• National Register Significance: Criterion CThe District is significant under Criterion C at the local level as an example of a large-scale sheep ranching landscape in the Bald Hills.
Humboldt County, CAREDWOOD NATIONAL PARK, CA
The Lyons Ranches Historic District (See Figure REDW 1.1) is located within the Bald Hills of Redwood National Park, Humboldt County, California, and is set within the prairies and oakwoods of the Redwood Creek watershed. The District is reached via the Bald Hills Road from State Highway 101 and is approximately nine miles inland from the coast. The 5,660-acre district is comprised of a series of eight prairies and the features within these prairies that remain from the Lyons family sheep ranching era. The eight prairies of the district extend for approximately six miles, with each prairie being no more than a mile from the next. They are located along the ridge of the hills and are naturally occurring features that have been modified over time by the cultural practices of the various groups of people that have inhabited this region.
CULTURAL LANDSCAPE SUMMARY
LYONS RANCHES HISTORIC DISTRICT

Figure REDW 1.6: Home Place 2016 site plan. (NPS PWRO, 2016)
Source: Esri, DigitalGlobe, GeoEye, Earthstar Geographics, CNES/Airbus DS, USDA, USGS, AEX,Getmapping, Aerogrid, IGN, IGP, swisstopo, and the GIS User Community
0 0.05 0.10.025 Miles¯
Redwood National ParkHome Place Site PlanLyons Ranches Historic District Cultural Landscape Inventory
National Park ServiceU.S. Department of the Interior
December 2016Prepared by PWRO Cultural Landscape Program
9
Legend Streams
Trails
1 Lyon’s Ranch Barn2 Lyon’s Bunkhouse3 Lyon’s Shed4 Lyon’s Ranch Outhouse5 Building Pad6 Hay Loading Bay7 Concrete Trough8 Stock Pond9 Cemetery
1v Apple, Plum, Pear, Cherry, English Walnut2v Apple, Plum, Pear, English Walnut3v Rose Hedge
Buildings and Structures
Lyons Road
1
23
4
5
6
7
8
1v
2v3v

Figure REDW 1.3: Elk Camp 2016 site plan. (NPS PWRO, 2016)
Source: Esri, DigitalGlobe, GeoEye, Earthstar Geographics, CNES/Airbus DS, USDA, USGS, AEX,Getmapping, Aerogrid, IGN, IGP, swisstopo, and the GIS User Community
0 0.025 0.050.0125 Miles¯
Redwood National ParkElk Camp Site PlanLyons Ranches Historic District Cultural Landscape Inventory
National Park ServiceU.S. Department of the Interior
December 2016Prepared by PWRO Cultural Landscape Program
Legend Streams Dam
Retaining Wall Buildings and Structures
1v Douglas Fir
Vegetation
2v Madrone3v Chestnut4v English Walnut5v Black Locust6v Maple7v Apple8v Pear9v Unidentified Shrub
1 Lane Ranch Residence2 Elk Camp Garage3 Foundation4 Foundation5 Structure with Wheel6 Barn7 Fence8 Hay Balers (2)9 Outhouse10 Foundation
Hazelnut Hedge
Elk Camp Road
1v
2v 3v
4v
5v
6v
7v
7v7v
3v
4v 5v
3v
8v
8v
1
23
4
5
6
7
8
9
10
9v
Stock Pond
Stock Pond

28
SUMMARY OF HUMBOLDT COUNTY, CALIFORNIA 1 MAXIMUM 2-M AIR TEMPERATURE
1 Maximum 2-m Air Temperature
Figure 1: Seasonal average time series of maximum 2-m air temperature for historical (black), RCP4.5 (blue) and RCP8.5 (red).The historical period ends in 2005 and the future periods begin in 2006. The average of 30 CMIP5 models is indicated by the solidlines and their standard deviations are indicated by the respective shaded envelopes.
Figure 2: Monthly averages of maximum 2-m air temperature for four time periods for the RCP4.5 (left) and RCP8.5 (right)simulations. The average of 30 CMIP5 models is indicated by the solid lines and their standard deviations are indicated by therespective shaded envelopes. Triangle, diamond and square symbols indicate the percent of models that simulate future minuspresent changes that are of the same sign and significant. A two-sided Students t-test is used to establish significance (ρ ≤ 0.05).
1 -Alder and Hostetler, USGS
Model Projections: Maximum Air Temperature
Figure REDW 1.3: Seasonal average time series of maximum 2-m air temperature for historical (black), RCP4.5 (blue) and RCP8.5 (red). The historical period ends in 2005 and the future periods begin in 2006. The average of 30 CMIP5 models is indicated by the solid lines and their standard deviations are indicated by the respective shaded envelopes.Alder, J. R. and S. W. Hostetler, 2013. USGS National Climate Change Viewer. USGS.
Under the Highest emissions projection (IPCC RCP 8.5), average temperature is projected to increase by 3.3°C (6.0°F) by the year 2100 relative to 1950. (See Figure REDW 1.3).
REGIONAL CLIMATE CHANGE PROJECTION SUMMARY Humboldt County, CA

29
SUMMARY OF HUMBOLDT COUNTY, CALIFORNIA 3 PRECIPITATION
3 Precipitation
Figure 5: Seasonal average time series of precipitation for historical (black), RCP4.5 (blue) and RCP8.5 (red). The historicalperiod ends in 2005 and the future periods begin in 2006. The average of 30 CMIP5 models is indicated by the solid lines andtheir standard deviations are indicated by the respective shaded envelopes.
Figure 6: Monthly averages of precipitation for four time periods for the RCP4.5 (left) and RCP8.5 (right) simulations. Theaverage of 30 CMIP5 models is indicated by the solid lines and their standard deviations are indicated by the respective shadedenvelopes. Triangle, diamond and square symbols indicate the percent of models that simulate future minus present changes thatare of the same sign and significant. A two-sided Students t-test is used to establish significance (ρ ≤ 0.05).
3 -Alder and Hostetler, USGS
Model Projections: Precipitation
Figure REDW 1.4: Seasonal average time series of precipitation for historical (black), RCP4.5 (blue) and RCP8.5 (red). The historical period ends in 2005 and the future periods begin in 2006. The average of 30 CMIP5 models is indicated by the solid lines and their standard deviations are indicated by the respective shaded envelopes.Alder, J. R. and S. W. Hostetler, 2013. USGS National Climate Change Viewer. USGS.
For projected average annual precipitation, the climate models do not agree, with over half projecting increases, but many projecting decreases. (See Figure REDW 1.4).
Model Projections: Storms
Figure REDW 1.5: Projected changes in 20-year storm frequency for REDW from the IPCC AR5 (2013). IPCC storm multiplier indicates the projected increase in frequency of 20-year storms. Occurrence indicates how that increase translates in the number of years.
STORM FREQUENCY PROJECTION DATA
CASE STUDY SITE IPCC STORM FREQUENCY MULTIPLIER 20-YEAR STORM OCCURRENCE (YEARS)
REDW 3 6.7

30
• Current site conditions include invasive species; ecological succession; fire and fuel loads; ecological restoration; deteriorated historic materials; changes in land use; and ongoing traditional cultural practices.
• Evident impacts resulting in loss of landscape integrity, and the continued deterioration of pasture edges, grazing patterns, and residential plantings:
• loss of prairie area to exotic invasives and conifer succession (See Figure REDW 1.6);
• sustained exposure to the elements in ranch buildings and agricultural implements;
• wildlife and insect damage (bore holes) to fruit orchard remnants (See Figure REDW 1.7);
• loss of fence lines and utility posts;
• material degradation of water collection and diversion systems; and decline of stock ponds.
• There is apparent loss of integrity in the visibility of landscape organization. Overgrowth and woodland succession exacerbate deteriorated condition of historic archeological features, such as the isolated Home Place cemetery, where oxidation in historic materials may accelerate deterioration.
Figure REDW 1.6: Elk Prairie, view south. Encroaching woody vegetation, such as Douglas fir (Pseudotsuga menziesii) threatens prairie stability. (Kerr/UO CLRG, 2016)
• Historic building fabric remains susceptible to climatic shifts, particularly in the context of projected precipitation increases, possibly accelerating frequency of maintenance cycles to maintain integrity in exposed timber and frame construction (See Figure REDW 1.8). The ranch buildings at Elk Camp and Home Place all exhibit biological growth, desiccation, and deterioration of wood cladding components; these otherwise expected phenomena may be exacerbated by sustained exposure to the elements, and compounded by seasonal extremes and UV light.
• Surviving buildings remain in fair to good condition overall, but a growing contrast between building and landscape maintenance is evident. With the decline in landscape spatial organization, relationships linking built features with their working contexts become less evident.
• Stream-fed stock ponds, key resources in livestock management, continue to be affected by encroaching conifers, as within Elk Camp, and overgrowth and sedimentation, seen at Home Place (See Figure REDW 1.9). Projected change in precipitation and air temperature also threaten to foster microbiological growth in and around the perimeter; subsequent increases in water temperature could support harmful algal and plant blooms. Collectively, these conditions introduce new levels of complexity into the stewardship of prairie ecosystems, and further stress the integrity of historic features.
CURRENT SITE CONDITIONS

31
Figure REDW 1.7: Bore holes on apple tree (Malus sp.), detail view, caused by sapsucker woodpeckers (Sphyrapicus sp.) southeast of the Elk Camp residence. Similar impacts affect orchard remnants like this one across the historic district, and are symptomatic of poor tree health.(Malinay/UO CLRG, 2016)
Figure REDW 1.8: Home Place Barn, view east. Changes in precipitation may alter effects of weather exposure on wood cladding and framing. (Kerr/UO CLRG, 2016)
Figure REDW 1.9: Views and vistas are affected by suburban development, view east. (Malinay/UO CLRG, 2016)
Figure REDW 1.10: Park staff currently manage the landscape and maintain the prairies with prescribed burns. (NPS Redwood National Park staff, 2016)

32
Buckner Homestead Historic DistrictFEMA 100-year Flood
Drought conditions: 2013 Landslide (USGS)
Wildfire Hazard Potential: 2014
Within 100-year Flood ZoneOutside of 100-year Flood Zone
0 6600 13200 19800Feet
High landslide incidence Moderate landslide incidenceHigh susceptibility to landsliding and moderate incidenceHigh susceptibility to landsliding and low incidenceModerate susceptibility to landsliding and low incidenceLow landslide incidence
Very LowLow
ModerateHighVery High
Non-burnable
Water
Abnormally DryModerate Drought
Severe DroughtExtreme DroughtExceptional Drought
N o D a t a
N o D a t a
GIS HAZARD DATA: LYONS RANCHES HISTORIC DISTRICT, REDWWILDFIRE HAZARD POTENTIAL: 2014 FEMA 100-YEAR FLOOD
DROUGHT CONDITIONS: 2013 LANDSLIDE (USGS)
Figure REDW 1.11: GIS analysis. (Lewis/UO CLRG, 2016)
Buckner Homestead Historic District
U.S. Geological Survey
FEMA 100-year Flood
Drought conditions: 2013 Landslide (USGS)
Wildfire Hazard Potential: 2014
Within 100-year Flood ZoneOutside of 100-year Flood Zone
0 340 680 1020Feet
High landslide incidence Moderate landslide incidenceHigh susceptibility to landsliding and moderate incidenceHigh susceptibility to landsliding and low incidenceModerate susceptibility to landsliding and low incidenceLow landslide incidence
Very LowLow
ModerateHighVery High
Non-burnable
Water
Abnormally DryModerate Drought
Severe DroughtExtreme DroughtExceptional Drought
N o D a t a
N o D a t a

33
• Most contributing features are within a high fire hazard zone (See Figure REDW 1.11), especially the landscape’s central and southern areas. Moderate risk of landslides heighten the risk of climate-related impacts on contributing features in the upland Bald Hills terrain. Patterns of circulation along the extensive Bald Hills Road system rely on the stability of hillsides and ridgelines, and contributing segments such as the Road to Home Place may grow in susceptibility to the effects of storm events or precipitation trends.
• The size and extent of hazards and impacts to the historic district as a whole remains difficult to assess, due to the lack of available drought and flood data.
• The complex interplay of climate variables with Bald Hills land systems requires continued analysis. The spatial extent of historic prairie areas remains ambiguous, and underlines the difficulty of assessing climate impacts against a known historical baseline. Traditional land management practices, including those practiced by the Yurok, continue to be a valuable asset in stabilizing the Lyons Ranches cultural landscape.
• More precisely locate and document historic edges for eight contributing prairie areas.
• Prioritize and target ranch cluster and prairie areas for more precise seasonal monitoring of contributing landscape characteristics.
• Further expand efforts to preserve prairie integrity and limit succession, in order to better sustain historic spatial configuration and patterns of use. Mitigation of conifer encroachment and invasive species through expanded disturbance regimes (i.e. low-intensity/high-frequency), where possible, should utilize prescribed burns (See Figure REDW 1.10) or mechanical removal.
• Develop more precise, detailed mapping of extant cultural landscape features, such as ornamental vegetation at Home Place, small-scale features, fencelines, etc.
• Engage skilled orchardist to maintain orchard remnants on a cyclic basis, including the use of historically sensitive pruning techniques.
• Build resilience in contributing vegetation specimens (i.e. orchard trees, ornamentals, etc.) through access to redundant or replacement plants. Where possible, identify varietals and ensure the availability of living genetic matches through public or private partnerships. Germplasm conservation or storage (cryopreservation), offsite, may provide alternative treatments.
• Clear stockpond of sediment as a part of a cyclic maintenance regime, to support the design and implementation of a water temperature-control strategy. This process should weigh the merits of native, non-historic perimeter vegetation as a potential asset.
• Mitigate risk of wildfire events through the selective reduction of fuels near extant buildings and orchard remnants. This should exclude historic, contributing vegetation.
• Explore potential conservation partnerships with Native American tribal stakeholder groups, including the Yurok, to understand traditional land management practices in the Bald Hills region.
SUMMARY OF HAZARD EXPOSURE RECOMMENDATIONS FOR NEXT STEPS

34
Figure DEVA 1.1: Scotty’s Castle Historic District, view southeast. (Kerr/UO CLRG, 2016)

35
• Size: 300 acres (121 hectares)
• Cultural Landscape Type: Designed
• Period of Significance: 1907 - 1954The period of time serves as a reminder of the excesses of mining promotion during the early 20th century, the frontier romanticism connected with it, and the conspicuous consumption practiced by the wealthy during the 1920s.
• National Register Significance: BScotty’s Castle is significant at the regional level under Criterion B for its association with one of the best known and most colorful figures produced by the American mining frontier — Walter Scott (a.k.a. Death Valley Scotty).
• National Register Significance: CScotty’s Castle is significant under Criterion C for its unusual and extravagant use of Spanish-styled architecture built in a remote desert location, and for the use of experimental building techniques and materials by its owner, Albert Johnson.
Inyo County, CADEATH VALLEY NATIONAL PARK, CA
CULTURAL LANDSCAPE SUMMARY
SCOTTY’S CASTLE HISTORIC DISTRICT
Scotty’s Castle (See Figure DEVA 1.1), a part of a historic district covering 300 acres, is located within the Grapevine Canyon at an elevation of 3000 feet. The historic extent of the property is physically defined by a perimeter fence that was built by Albert Johnson in the 1920s. Several buildings and structures remain and are characteristic of a small, working ranch. Features include Scotty’s Castle and annex, the powerhouse, the chimestower, guest house, stables, garage bunkhouse/hotel, entrance gate, and gravel separator.

Figure DEVA 1.2: Scotty’s Castle 2016 site plan. (NPS PWRO, 2016)
0 250 500125 Feet °
Gravel Separator
Powder Storage Ruin
Chimes Tower
Road to Tie Canyon
Bonnie Clare Road
Swimming Pool
Entrance Gates and Dungeon Apartment
Picnic Area
Visitor Parking
Sa� Parking
Gas Tank
Gas Pumps
Long Shed/Bunkhouse
Road to Springhouse Cluster
Stables
Watercourse
Guest House/Hacienda
Scotty’s Original Castle
Gas Tank
Cookhouse
Annex
Solar Water Heater
Grotto/Servant’s QuartersTrail to Scotty’s Gravesite
Powerhouse and PavillionMain House
Wishing Well
Aerial Photo: November 5, 2016
December 2016Prepared by PWRO Cultural Landscape Program
Death Valley National ParkScotty’s Castle Site PlanDeath Valley Scotty Historic District Cultural Landscape Inventory
National Park ServiceU.S. Department of the Interior

37
Figure DEVA 1.3: Seasonal average time series of maximum 2-m air temperature for historical (black), RCP4.5 (blue) and RCP8.5 (red). The historical period ends in 2005 and the future periods begin in 2006. The average of 30 CMIP5 models is indicated by the solid lines and their standard deviations are indicated by the respective shaded envelopes.Alder, J. R. and S. W. Hostetler, 2013. USGS National Climate Change Viewer. USGS.
SUMMARY OF INYO COUNTY, CALIFORNIA 1 MAXIMUM 2-M AIR TEMPERATURE
1 Maximum 2-m Air Temperature
Figure 1: Seasonal average time series of maximum 2-m air temperature for historical (black), RCP4.5 (blue) and RCP8.5 (red).The historical period ends in 2005 and the future periods begin in 2006. The average of 30 CMIP5 models is indicated by the solidlines and their standard deviations are indicated by the respective shaded envelopes.
Figure 2: Monthly averages of maximum 2-m air temperature for four time periods for the RCP4.5 (left) and RCP8.5 (right)simulations. The average of 30 CMIP5 models is indicated by the solid lines and their standard deviations are indicated by therespective shaded envelopes.
1 -Alder and Hostetler, USGS
Model Projections: Maximum Air Temperature
Under the Highest emissions projection (IPCC RCP 8.5), temperature is projected to increase by 5.3°C (9.5°F) by the year 2100 (28.7°C/83.6°F) relative to 1950 (22.5°C/72.5°F) (See Figure DEVA 1.3).
REGIONAL CLIMATE CHANGE PROJECTION SUMMARY Inyo County, CA

38
Figure DEVA 1.4: Seasonal average time series of precipitation for historical (black), RCP4.5 (blue) and RCP8.5 (red). The historical period ends in 2005 and the future periods begin in 2006. The average of 30 CMIP5 models is indicated by the solid lines and their standard deviations are indicated by the respective shaded envelopes.Alder, J. R. and S. W. Hostetler, 2013. USGS National Climate Change Viewer. USGS.
SUMMARY OF INYO COUNTY, CALIFORNIA 3 PRECIPITATION
3 Precipitation
Figure 5: Seasonal average time series of precipitation for historical (black), RCP4.5 (blue) and RCP8.5 (red). The historicalperiod ends in 2005 and the future periods begin in 2006. The average of 30 CMIP5 models is indicated by the solid lines andtheir standard deviations are indicated by the respective shaded envelopes.
Figure 6: Monthly averages of precipitation for four time periods for the RCP4.5 (left) and RCP8.5 (right) simulations. The averageof 30 CMIP5 models is indicated by the solid lines and their standard deviations are indicated by the respective shaded envelopes.
3 -Alder and Hostetler, USGS
Model Projections: Precipitation
Regardless of emissions scenario, uncertainty around precipitation projections show a range of a 0.0 mm/day to a 0.2 mm/day increase. The modern value is 0.5mm/day (See Figure DEVA 1.4).
Model Projections: Storms
Figure DEVA 1.5: Projected changes in 20-year storm frequency for DEVA from the IPCC AR5 (2013). IPCC storm multiplier indicates the projected increase in frequency of 20-year storms. Occurrence indicates how that increase translates in the number of years.
STORM FREQUENCY PROJECTION DATA
CASE STUDY SITE IPCC STORM FREQUENCY MULTIPLIER 20-YEAR STORM OCCURRENCE (YEARS)
DEVA 2 10.0

39
• The October 2015 flood event was a 1000-year flood event that affected the topography, circulation, and structural integrity of Scotty’s Castle Historic District.
• The two major considerations with each flood event are how the flood affects the topography and how topography influences the flood. Flood events erode the topography at Scotty’s Castle, which influences this contributing feature and simultaneously, the topography of Grapevine Canyon channelizes water toward Scotty’s Castle, making this area exposed to future flooding events.
• Growth of California fan palms (Washingtonia filifera), honey mesquite (Prosopis glandulosa), and creosote bush (Larrea tridentata) around the watercourse jeopardize the integrity of the water feature’s concrete base.
Figure DEVA 1.6: Flood stabilization efforts, view east, up Tie Canyon. The flood damaged the topography and vegetation, in addition to depositing large amounts of debris. (Kerr/UO CLRG, 2016)
• Scotty’s Castle Annex is sandbagged for flood mitigation, although there was some cracking of the exterior stucco.
• There is debris and evidence of the flood path above the stables.
• Picnic area is washed away.
• Damage exists to the overall landscape around watercourse. Vegetation is missing in several areas.
CURRENT SITE CONDITIONS

40
Figure DEVA 1.7: Flood destruction. The flood damaged the topography and vegetation, in addition to depositing large amounts of debris. (Kerr/UO CLRG, 2016)
Figure DEVA 1.8: Evidence of moisture staining and sediment deposits on the south stable door and hardware, detail view, seen as a flood impact in the Scotty’s Castle building complex. (Kerr/UO CLRG, 2016)

41
United States Department ofAgriculture (USDA), United StatesForest Service (USFS)
Buckner Homestead Historic District
U.S. Geological Survey
FEMA 100-year Flood
Drought conditions: 2013 Landslide (USGS)
Wildfire Hazard Potential: 2014
Within 100-year Flood ZoneOutside of 100-year Flood Zone
Cultural Resource Structure 0 1400 2800 4200Feet¯
High landslide incidence Moderate landslide incidenceHigh susceptibility to landsliding and moderate incidenceHigh susceptibility to landsliding and low incidenceModerate susceptibility to landsliding and low incidenceLow landslide incidence
Very LowLow
ModerateHighVery High
Non-burnable
Water
Abnormally DryModerate Drought
Severe DroughtExtreme DroughtExceptional Drought
GIS HAZARD DATA: SCOTTY’S CASTLE HISTORIC DISTRICT, DEVAWILDFIRE HAZARD POTENTIAL: 2014 FEMA 100-YEAR FLOOD
DROUGHT CONDITIONS: 2013 LANDSLIDE (USGS)
Figure DEVA 1.9: GIS analysis. (Lewis/UO CLRG, 2016)
Buckner Homestead Historic District
U.S. Geological Survey
FEMA 100-year Flood
Drought conditions: 2013 Landslide (USGS)
Wildfire Hazard Potential: 2014
Within 100-year Flood ZoneOutside of 100-year Flood Zone
0 340 680 1020Feet
High landslide incidence Moderate landslide incidenceHigh susceptibility to landsliding and moderate incidenceHigh susceptibility to landsliding and low incidenceModerate susceptibility to landsliding and low incidenceLow landslide incidence
Very LowLow
ModerateHighVery High
Non-burnable
Water
Abnormally DryModerate Drought
Severe DroughtExtreme DroughtExceptional Drought
N o D a t a
N o D a t a

42
• The park sandbagged many features as part of the flood mitigation efforts and cleared deposits of soil and debris, though additional clean up is needed (see Figure DEVA 1.6). Because of the site’s isolation and topography, measures to mitigate flood damages were delayed following the event (See Figure DEVA 1.7).
• All buildings and structures are exposed to future flood events, including Scotty’s Cabin. A major event could completely destroy this feature, as it is already in severe disrepair (See Figure DEVA 1.8).
• Beyond flooding, fluctuation in temperature and precipitation affect the cultural landscape in unknown ways. If prolonged drought continues, it will not only affect contributing features, but may also create less stable conditions on the hills surrounding Scotty’s Castle.
• Although the GIS data (See Figure DEVA 1.9) places this area in a low fire hazard zone, Scotty’s Castle experienced a fire five-years ago that affected the riparian area, which speaks to highlighting the potential of fire in the future.
• Monitor fluctuations in temperature and precipitation that affect the buildings and vegetation with undetermined consequences.
SUMMARY OF HAZARD EXPOSURE RECOMMENDATIONS FOR NEXT STEPS

43
Figure PUHE 1.1: Pu’ukoholā Heiau National Historical Site, view west. (Malinay/UO CLRG, 2016)

44
• Size: 86.24 acres (34.90 hectares)
• Cultural Landscape Type: Historic Vernacular Landscape
• Period of Significance: 1790 - 1835
Pu’ukohola Heiau National Historic Site is a nationally significant cultural landscape for its association with the life Kamehameha I and the political unification of the Hawaiian Islands.
• National Register Significance: Criterion A
The site is directly associated with the political unification of the Hawaiian Islands under Kamehameha I. Pu’ukohola Heiau was built in response to a religious prophecy that promised political power to Kamehameha I if the heiau was built and dedicated to the Hawaiian War God, Ku ka ‘ili moku.
After completion of the heiau, Kamehameha I defeated his rival thereby consolidating political power and becoming the paramount chief and ruler of Hawai’i.
Hawaii County, HIPU’UKOHOLĀ HEIAU NATIONAL HISTORIC SITE
CULTURAL LANDSCAPE SUMMARY
Pu’ukoholā Heiau National Historic Site (See Figure PUHE 1.1), consisting of 86.24 acres, is located on the Island of Hawai’i on the northwest coast above Kawaihae Bay. The heiau was built by King Kamehameha the Great from 1790 to 1791. It is a sacred site, built of lava rocks, without the use of mortar, cement, or any bonding materials.
• National Register Significance: Criterion B
The site is directly associated with both Kamehameha I and John Young. Kamehameha I facilitated the building of the Pu’ukohola Heiau. As the paramount chief of the Island of Hawai’i, he rose to power and consolidated the Hawaiian Islands under one rule. He built and defended the kingdom while increasing trade in international markets until his death in 1819.
• National Register Significance: Criterion C
The west coast of Hawai’i Island contains a number of significant heiau.
• National Register Significance: Criterion D
Archeological features within the Pu’ukoholā National Historic Site have yet to be thoroughly evaluated. During a century of rapid social change in Hawaiian history, there was a loss of knowledge about these ancient structures, especially Mailekini Heiau, and a lack of reliable means of dating archeological remains.

Figure PUHE 1.2: Pu’ukoholā Heiau National Historical Site 2016 site plan. (NPS PWRO, 2016)
!
! !!!!!!!!!!!
!!!!
!
!!!
!!
!!
!
! !
!
! !
!
! !!
!!!
!!!!!
!
!
!
!
!
!
!!
!!
!
!
John Young Homestead Site (Pahukanilua) (C)
Pu'ukohola Heiau (C)
Poki'iahua/Makeahua Gulch (NC)
Interpretive Trail System (NC)
Leaning Post (C)
Mailekini Heiau (C)
Coconut grove at Pelekane (C)
Scattered native plants along coast (C)
NPS maintenance area
NPS administrative area
NPS visitor center
Hale-o-Kapuni Heiau Site (C)in Pelekane Bay (NC)
Kawaihae Harbor
Highway 270
Spencer Beach Park
Pohaukole Gulch (C)
Coa
stal
Tra
il
Prominent Hill (C)
Pelekane (Kikiako'i) (C)
BC
D
E
F
GH
I
J
Source: Esri, DigitalGlobe, GeoEye, Earthstar Geographics, CNES/Airbus DS, USDA, USGS, AEX,Getmapping, Aerogrid, IGN, IGP, swisstopo, and the GIS User Community
Pu'ukohola Heiau National Historic Site
[0 300 600150
Feet
A
K
L
M
N
! coconut palm tree
gulch
CLI boundary
NHL boundary
trails
park boundary
heiau boundary
Site PlanPacific West Regional Office | Cultural Landscapes Program | Cultural Landscapes Inventory | August 2016
Legend
Source: park geodatabase and 2016 CLI field investigationDrawn in ArcMap 10.3.A-N are boundary points
roads

46
Figure PUHE 1.3: The table gives the historical rate of change per century calculated from data for the period of 1950-2009. The table gives central values with standard errors (historical) and standard deviations (projected).
Gonzalez, Patrick. 2016. Climate Change Trends, Impacts, and Vulnerabilities, Pu`uhonua O Hōnaunau National Historical Park, Hawai‘i. Berkeley, CA: National Park Service, Natural Resource Stewardship and Science.
Model Projections: Maximum Air Temperature
Under the Highest emissions projection (IPCC RCP 8.5), temperature is projected to increase by 3.3°C (6.0°F) by the year 2100 (28.7°C/83.6°F) (See Figure PUHE 1.3).
REGIONAL CLIMATE CHANGE PROJECTION SUMMARY Hawaii County, HI
Model Projections: Precipitation
Under the Highest emissions projection (IPCC RCP 8.5), precipitation is projected to decrease by 17% of the current levels yet with large uncertainty in the projection (See Figure PUHE 1.3).
HISTORICAL RATES OF CHANGE PER CENTURY AND PROJECTED CHANGES IN ANNUAL AVERAGE TEMPERATURE AND ANNUAL TOTAL PRECIPITATION FOR HAWAII
HISTORICAL
1950-2009 2000-2100
+1.5+/- 0.3°C per century (3+/-0.5°F)
PROJECTEDHighest Emissions(IPCC RCP 8.5)Temperature
Precipitation
Temperature
Precipitation -17+/- 16% per century
compared to 1971-2000
+3.3+/-0.7°C per century (+6+/- 1.3°F)
+15 +/-56% per century

47
Model Projections: Storms
Figure PUHE 1.5: Projected changes in 20-year storm frequency for PUHE from the IPCC AR5 (2013). IPCC storm multiplier indicates the projected increase in frequency of 20-year storms. Occurrence indicates how that increase translates in the number of years.
STORM FREQUENCY PROJECTION DATA
CASE STUDY SITE IPCC STORM FREQUENCY MULTIPLIER 20-YEAR STORM OCCURRENCE (YEARS)
PUHE 3 6.7
Model Projections: Sea Level
SEA LEVEL PROJECTION DATA
HISTORICAL SEA LEVEL TREND, 1927-2014 2100 (Highest Emissions Scenario RCP 8.5)
+.12 IN/YEAR +2.21FT
Figure PUHE 1.4: Historical and projected sea level trends for Pu’uhonua O Honaunau National Historical Park. These data represent the available geographically closest sea level projections to Pu’ukoholā Heiau National Historical Site.
Caffrey, M. 2014. Sea Level and Storm Trends, Pu’uhonua O Honaunau National Historical Park. National Park Service Climate Change Response Program. Fort Collins, Colorado.
There is a .01ft/year increase in the historical sea-level trend with projections to rise 2.21ft by 2100 under the Highest emissions scenario (IPCC RCP 8.5). (See Figure PUHE 1.4).

48
• Portions of the landscape are susceptible to sea-level rise, especially a stand of coconut trees (cocos nucifera), a contributing feature, on the west side of the site (See Figure PUHE Image 1.6).
• The contributing stand of coconut trees is also susceptible to the threat of the coconut rhinoceros beetle (Oryctes rhinoceros), and trunk and heart rot (both fungal diseases).
• Grasses encroach many of the structures at the John Young Homestead site.
Figure PUHE 1.6: Coconut Stand, view west. Given this contributing feature’s adjacency to the Pacific Ocean, it is susceptible to rising sea levels. (Malinay/UO CLRG, 2016)
CURRENT SITE CONDITIONS

49
Figure PUHE 1.7: The NPS is in the process of reestablishing native pili grass community, view north. (Malinay/UO CLRG, 2016)
Figure PUHE 1.8: Pu’ukoholā Heiau, view west. Park staff are in the process of addressing the impacts of goats climbing on contributing features. (Malinay/UO CLRG, 2016)

50
Buckner Homestead Historic DistrictFEMA 100-year Flood
Drought conditions: 2013 Landslide (USGS)
Wildfire Hazard Potential: 2014
Within 100-year Flood ZoneOutside of 100-year Flood Zone
0 390 780 1170Feet
High landslide incidence Moderate landslide incidenceHigh susceptibility to landsliding and moderate incidenceHigh susceptibility to landsliding and low incidenceModerate susceptibility to landsliding and low incidenceLow landslide incidence
Very LowLow
ModerateHighVery High
Non-burnable
Water
Abnormally DryModerate Drought
Severe DroughtExtreme DroughtExceptional Drought
N o D a t a
N o D a t a
N o D a t a
GIS HAZARD DATA: PU’UKOHOLA HEIAU NATIONAL HISTORIC SITE, PUHEWILDFIRE HAZARD POTENTIAL: 2014 FEMA 100-YEAR FLOOD
DROUGHT CONDITIONS: 2013 LANDSLIDE (USGS)
Figure PUHE 1.9: GIS analysis. (Lewis/UO CLRG, 2016)
Buckner Homestead Historic District
U.S. Geological Survey
FEMA 100-year Flood
Drought conditions: 2013 Landslide (USGS)
Wildfire Hazard Potential: 2014
Within 100-year Flood ZoneOutside of 100-year Flood Zone
0 340 680 1020Feet
High landslide incidence Moderate landslide incidenceHigh susceptibility to landsliding and moderate incidenceHigh susceptibility to landsliding and low incidenceModerate susceptibility to landsliding and low incidenceLow landslide incidence
Very LowLow
ModerateHighVery High
Non-burnable
Water
Abnormally DryModerate Drought
Severe DroughtExtreme DroughtExceptional Drought
N o D a t a
N o D a t a
51
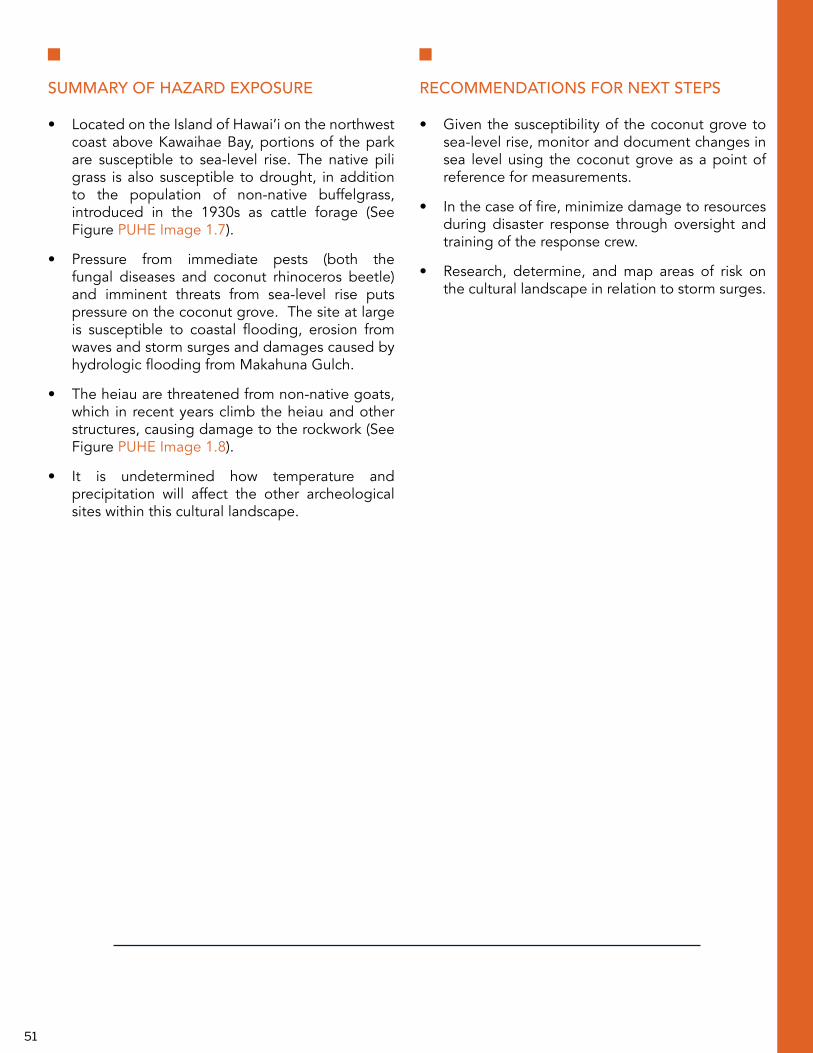
• Located on the Island of Hawai’i on the northwest coast above Kawaihae Bay, portions of the park are susceptible to sea-level rise. The native pili grass is also susceptible to drought, in addition to the population of non-native buffelgrass, introduced in the 1930s as cattle forage (See Figure PUHE Image 1.7).
• Pressure from immediate pests (both the fungal diseases and coconut rhinoceros beetle) and imminent threats from sea-level rise puts pressure on the coconut grove. The site at large is susceptible to coastal flooding, erosion from waves and storm surges and damages caused by hydrologic flooding from Makahuna Gulch.
• The heiau are threatened from non-native goats, which in recent years climb the heiau and other structures, causing damage to the rockwork (See Figure PUHE Image 1.8).
• It is undetermined how temperature and precipitation will affect the other archeological sites within this cultural landscape.
• Given the susceptibility of the coconut grove to sea-level rise, monitor and document changes in sea level using the coconut grove as a point of reference for measurements.
• In the case of fire, minimize damage to resources during disaster response through oversight and training of the response crew.
• Research, determine, and map areas of risk on the cultural landscape in relation to storm surges.
SUMMARY OF HAZARD EXPOSURE RECOMMENDATIONS FOR NEXT STEPS

52
Figure EUON 1.1: Eugene O’Neill National Historic Site. (Kerr/UO CLRG, 2016)

53
• Size: 13.19 acres (5.8 hectares)
• Cultural Landscape Type: Designed
• Period of Significance: 1937 - 1944The period of significance reflects the years when Eugene O’Neill composed some of his most important works and when the Tao House landscape was planned, designed, and constructed under the direction of Eugene and Carlotta O’Neill.
• National Register Significance: Criterion ARegarding criterion A, the Tao House is nationally significant because within this house Eugene O’Neill wrote and completed five plays which are considered among his most important.
• National Register Significance: Criterion BRegarding criterion B, Eugene O’Neill had won three Pulitzer Prizes and the Nobel Prize in Literature for his plays, recognition of both national and international significance as a playwright, before he and his wife built the Tao House.
Contra Costa County, CAEUGENE O’NEILL NATIONAL HISTORIC SITE, CA
Eugene O’Neill National Historic Site (See Figure EUON 1.1) is situated within Las Trampas Hills at 700’ elevation. The historic site is located on the western edge of the city of Danville, California, but is characterized by the wooded areas and open fields that surround the site to the north, south, and west. Within the historic site, buildings, roads, several small orchards, and ornamental vegetation were developed between the years 1880 and 1944, and characterize the property as a small working ranch. Many of the buildings at the historic site were built by the O’Neills (with exception of the old barn) in a vernacular style resembling typical late 19th-century California ranch structures with gable roofs and white painted shiplap or clapboard siding. The Tao House, trunk room, and garage were built in a Spanish Colonial Style and have hipped, black terra cotta roofs. The entry road is narrow, curvilinear, rural in character, and gated from the general public. The orchards include walnut trees to the south, almond trees to the east and various stone fruit trees to the north of the Tao House. Ornamental vegetation surrounds the Tao House.
CULTURAL LANDSCAPE SUMMARY

Source: Esri, DigitalGlobe, GeoEye, Earthstar Geographics, CNES/Airbus DS, USDA, USGS, AEX, Getmapping, Aerogrid, IGN, IGP,swisstopo, and the GIS User Community
0 0.05 0.10.025 Miles ¯
0 0.0075 0.015 Miles ¯
Eug
ene O
’Neill N
ation
al Histo
ric SiteEu
gen
e O’N
eill NH
S Site PlanEu
gen
e O’N
eill Natio
nal H
istoric Site C
ultu
ral Land
scape In
vento
ry
December 2016Prepared by PWRO Cultural Landscape Program
Natio
nal Park Service
U.S. D
epartm
ent o
f the In
terior
1
2
3
456
7
8
9
10
11
1213
Detail: #1 Tao House
14
15
16
Swimming Pool
Fire Road
Legend
Features
Eugene O’Neill CLI Boundary
01 Tao House02 Caretaker’s Residence (Historic site headquarters)03 New Barn04 Old Barn05 Chicken Coop06 Brick Bench07 Old Wagon08 Blemie’s Grave Stone09 Water Storage Tanks (3)10 Potting Shed11 Trunk Room12 Pump House13 Change House14 Birdbath and Stepping Stones15 Ceramic Elephants16 Stone Gateposts
Vegetation Almond Apple Apricot Arborvitae Black Locust CA Black Walnut Chinaberry Tree Chinse Flame Tree Coast Live Oak Coast Redwood Cotoneaster English Boxwood English Hawthorn English Walnut Eucalyptus European Plum Fig Flowering Cherry Horsetail Tree Incense Cedar Italian Cypress Lilac Magnolia Oleander Peach Pear Persimmion Pfitzer Juniper Pine Tree Poplar Privet Purple Leaf Plum Stawberry Tree Sycamore Tamarix Valley Oak Weeping Willow Wisteria Yew Pine Other (Dead or Missing)
Figure EUON 1.2: Eugene O’Neill National Historic Site 2016 site plan. (NPS PWRO, 2016)

55
SUMMARY OF CONTRA COSTA COUNTY, CALIFORNIA 1 MAXIMUM 2-M AIR TEMPERATURE
1 Maximum 2-m Air Temperature
Figure 1: Seasonal average time series of maximum 2-m air temperature for historical (black), RCP4.5 (blue) and RCP8.5 (red).The historical period ends in 2005 and the future periods begin in 2006. The average of 30 CMIP5 models is indicated by the solidlines and their standard deviations are indicated by the respective shaded envelopes.
Figure 2: Monthly averages of maximum 2-m air temperature for four time periods for the RCP4.5 (left) and RCP8.5 (right)simulations. The average of 30 CMIP5 models is indicated by the solid lines and their standard deviations are indicated by therespective shaded envelopes.
1 -Alder and Hostetler, USGS
Model Projections: Maximum Air Temperature
Figure EUON 1.3: Seasonal average time series of maximum 2-m air temperature for historical (black), RCP4.5 (blue) and RCP8.5 (red). The historical period ends in 2005 and the future periods begin in 2006. The average of 30 CMIP5 models is indicated by the solid lines and their standard deviations are indicated by the respective shaded envelopes.
Alder, J. R. and S. W. Hostetler, 2013. USGS National Climate Change Viewer. USGS.
Under the Highest emissions projection (IPCC RCP 8.5), average temperature is projected to increase by 4.9°C (8.8°F) by the year 2100 relative to 1950 (See Figure EUON 1.3).
REGIONAL CLIMATE CHANGE PROJECTION SUMMARY Contra Costa County, CA

56
SUMMARY OF CONTRA COSTA COUNTY, CALIFORNIA 3 PRECIPITATION
3 Precipitation
Figure 5: Seasonal average time series of precipitation for historical (black), RCP4.5 (blue) and RCP8.5 (red). The historicalperiod ends in 2005 and the future periods begin in 2006. The average of 30 CMIP5 models is indicated by the solid lines andtheir standard deviations are indicated by the respective shaded envelopes.
Figure 6: Monthly averages of precipitation for four time periods for the RCP4.5 (left) and RCP8.5 (right) simulations. The averageof 30 CMIP5 models is indicated by the solid lines and their standard deviations are indicated by the respective shaded envelopes.
3 -Alder and Hostetler, USGS
Model Projections: Precipitation
Figure EUON 1.4: Seasonal average time series of precipitation for historical (black), RCP4.5 (blue) and RCP8.5 (red). The historical period ends in 2005 and the future periods begin in 2006. The average of 30 CMIP5 models is indicated by the solid lines and their standard deviations are indicated by the respective shaded envelopes.Alder, J. R. and S. W. Hostetler, 2013. USGS National Climate Change Viewer. USGS.
There is no significant change (See Figure EUON 1.4).
Model Projections: Storms
Figure EUON 1.5: Projected changes in 20-year storm frequency for EUON from the IPCC AR5 (2013). IPCC storm multiplier indicates the projected increase in frequency of 20-year storms. Occurrence indicates how that increase translates in the number of years.
STORM FREQUENCY PROJECTION DATA
CASE STUDY SITE IPCC STORM FREQUENCY MULTIPLIER 20-YEAR STORM OCCURRENCE (YEARS)
EUON 3 6.7
57
• Soil slumping on the steep southwestern edge of the site, possibly related to a spring-fed seep.
• Additional issues include seasonal and cumulative effects of decreased irrigation on courtyard plantings, i.e., lawn and shrubs, and exterior fruit and nut orchards.
• Relative stability appears to characterize the resource overall, although current impacts and climate-related susceptibility was noted.
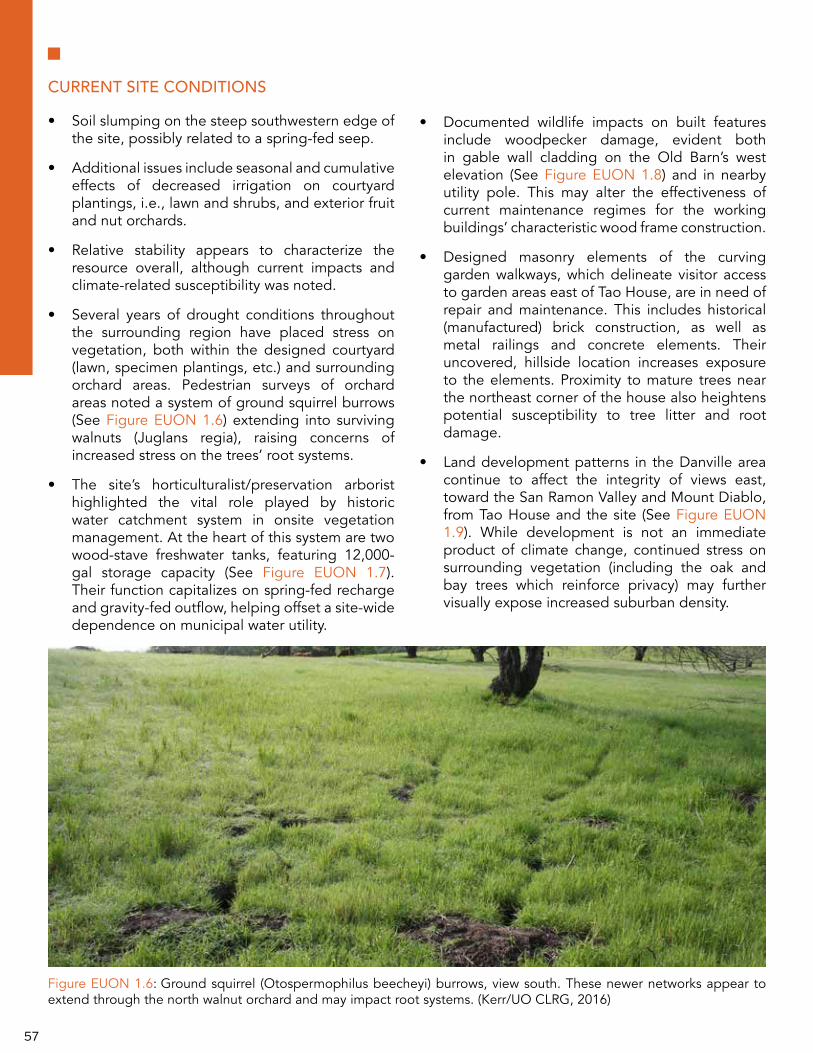
• Several years of drought conditions throughout the surrounding region have placed stress on vegetation, both within the designed courtyard (lawn, specimen plantings, etc.) and surrounding orchard areas. Pedestrian surveys of orchard areas noted a system of ground squirrel burrows (See Figure EUON 1.6) extending into surviving walnuts (Juglans regia), raising concerns of increased stress on the trees’ root systems.
• The site’s horticulturalist/preservation arborist highlighted the vital role played by historic water catchment system in onsite vegetation management. At the heart of this system are two wood-stave freshwater tanks, featuring 12,000-gal storage capacity (See Figure EUON 1.7). Their function capitalizes on spring-fed recharge and gravity-fed outflow, helping offset a site-wide dependence on municipal water utility.
Figure EUON 1.6: Ground squirrel (Otospermophilus beecheyi) burrows, view south. These newer networks appear to extend through the north walnut orchard and may impact root systems. (Kerr/UO CLRG, 2016)
• Documented wildlife impacts on built features include woodpecker damage, evident both in gable wall cladding on the Old Barn’s west elevation (See Figure EUON 1.8) and in nearby utility pole. This may alter the effectiveness of current maintenance regimes for the working buildings’ characteristic wood frame construction.
• Designed masonry elements of the curving garden walkways, which delineate visitor access to garden areas east of Tao House, are in need of repair and maintenance. This includes historical (manufactured) brick construction, as well as metal railings and concrete elements. Their uncovered, hillside location increases exposure to the elements. Proximity to mature trees near the northeast corner of the house also heightens potential susceptibility to tree litter and root damage.
• Land development patterns in the Danville area continue to affect the integrity of views east, toward the San Ramon Valley and Mount Diablo, from Tao House and the site (See Figure EUON 1.9). While development is not an immediate product of climate change, continued stress on surrounding vegetation (including the oak and bay trees which reinforce privacy) may further visually expose increased suburban density.
CURRENT SITE CONDITIONS

58
Figure EUON 1.7: Two freshwater tanks remain operational today onsite, view northeast. These serve both as historic features and wayfinding point for a contributing viewshed. (Kerr/UO CLRG, 2016)
Figure EUON 1.8: Woodpecker bore-holes are evident across the west gable of the Old Barn. Note synthetic mesh netting, hung to deter further damage. (Malinay/UO CLRG, 2016)
Figure EUON 1.9: Views and vistas are affected by suburban development, view east. (Malinay/UO CLRG, 2016)

59
Buckner Homestead Historic District
U.S. Geological Survey
FEMA 100-year Flood
Drought conditions: 2013 Landslide (USGS)
Wildfire Hazard Potential: 2014
Within 100-year Flood ZoneOutside of 100-year Flood Zone
0 190 380 570Feet
High landslide incidence Moderate landslide incidenceHigh susceptibility to landsliding and moderate incidenceHigh susceptibility to landsliding and low incidenceModerate susceptibility to landsliding and low incidenceLow landslide incidence
Very LowLow
ModerateHighVery High
Non-burnable
Water
Abnormally DryModerate Drought
Severe DroughtExtreme DroughtExceptional Drought
N o D a t a
GIS HAZARD DATA: EUGENE O’NEILL NATIONAL HISTORIC SITE, EUONWILDFIRE HAZARD POTENTIAL: 2014 FEMA 100-YEAR FLOOD
DROUGHT CONDITIONS: 2013 LANDSLIDE (USGS)
Figure EUON 1.10: GIS analysis. (Lewis/UO CLRG, 2016)
Buckner Homestead Historic District
U.S. Geological Survey
FEMA 100-year Flood
Drought conditions: 2013 Landslide (USGS)
Wildfire Hazard Potential: 2014
Within 100-year Flood ZoneOutside of 100-year Flood Zone
0 340 680 1020Feet
High landslide incidence Moderate landslide incidenceHigh susceptibility to landsliding and moderate incidenceHigh susceptibility to landsliding and low incidenceModerate susceptibility to landsliding and low incidenceLow landslide incidence
Very LowLow
ModerateHighVery High
Non-burnable
Water
Abnormally DryModerate Drought
Severe DroughtExtreme DroughtExceptional Drought
N o D a t a
N o D a t a

60
• A majority of the cultural landscape boundary lies within a high-risk area for landslide conditions. This overlap underscores the possible influence of Las Trampas foothills topography and vegetation on overall site exposure. Projected increases in temperature, for instance, could place long-term stress trends on both canopy and understory vegetation to the west and upslope from the site—in turn affecting hillside soil stability. A similar analysis of fire hazard zones suggests a low current exposure. All contributing features within the cultural landscape remain outside of the current 100-year flood zone (See Figure 1.10).
• Possible climate vulnerability stems from this cultural landscape’s water-dependent design intent, projected changes in temperature, and partial dependence on municipal water resources. Visitor use does not currently appear to exacerbate the effects of site exposure. The potential appeal of historic vegetation features to climate-stressed wildlife and pests, however, remains a concern.
• Monitor impact of continuing drought stress on garden and orchard vegetation, taking into account deferred maintenance and growth of aggressive plant species, including ice plants (Carpobrotus edulis). Also known as highway ice plant, this species comprise a historic feature within the designed landscape, but have begun to overtake nearby garden areas and walkways south of the Tao House courtyard.
• Develop and implement vegetation management plan for managing the Tao House courtyard area, with special attention given to reduced irrigation and rationed watering regimes. If possible, this process should seek to delineate thresholds for the loss of historic integrity; identify compatible species for replacing contributing specimens; and consult historic planting lists (where applicable).
• Establish cyclical pruning for ice plants and other exterior garden over-growth.
• Work with the East Bay Regional Park District (EBRPD) to maintain spring-fed infrastructure necessary for supporting site irrigation—including refreshing water tanks. Access to the spring site (located beyond the cultural landscape boundary) currently relies on a Memorandum of Understanding with EBRPD, but entering into a formal agreement may be desirable step toward achieving landscape resilience.
• Assess condition of both extant historic water tanks and irrigation systems, and conduct necessary preservation repairs.
• Prune and maintain orchard remnants on a regular basis, utilizing best practices for historic orchard preservation management.
SUMMARY OF HAZARD EXPOSURE RECOMMENDATIONS FOR NEXT STEPS

61
Figure NOCA 1.1: Buckner Homestead Historic District, Lake Chelan National Recreation Area, view northwest. (Malinay/UO CLRG, 2016)

62
• Size: 105.50 acres (42.69 hectares)
• Cultural Landscape Type: Historic Vernacular Landscape
• Period of Significance: 1889 - 1955
The period of significance reflects the early establishment of nearby William Buzzard homestead, the Buckner family land purchase and improvements made after 1910, and the development of orchard cultivation.
• National Register Significance: Criterion AThe Buckner Homestead Historic District is locally significant under Criterion A for its association with early settlement and agricultural development in the North Cascades.
Chelan County, WAMANAGED BY NORTH CASCADES NATIONAL PARK SERVICE COMPLEX, WA
CULTURAL LANDSCAPE SUMMARY
LAKE CHELAN NATIONAL RECREATION AREA
The Buckner Homestead Historic District (See Figure NOCA 1.1) is located on a horseshoe bend of the Stehekin River in Lake Chelan National Recreation Area in the remote North Cascades of central Washington State. Access to the site is limited; however, boat and/or plane service is offered to/from Stehekin. The 160-acre homestead was first developed by William Buzzard, an early settler to the Stehekin Valley, between 1889 and 1910. During this period, Buzzard built a small log cabin and cleared many acres of land for pasture and cultivation. In 1910, Buzzard sold the homestead to William Van and May Buckner who made many improvements to the property, which included establishment of approximately 50 acres of fruit trees and construction of several buildings and structures that supported residential activities as well as the orchard operation.
BUCKNER HOMESTEAD HISTORIC DISTRICT

Figure NOCA 1.2: Buckner Homestead Historic District 2016 site plan. (NPS PWRO, 2016)
1
2
3
6
5
7 8
Historic Entrance Road
Clearing/Pasture
Apple Orchard(south block)
Apple Orchard(north block)
Apple Orchard(east block)
Gate #2
Footbridge
Footbridge
Footbridge
Footbridge
Footbridge
Gate #1 and concrete channel
Seedling
Wood Stave Culvert
Gate #3
Knoll
Stehekin Valley Road
Stehekin River
Rainbow Creek
Wood Flume
Old Wagon Road (remnant)
Buckner Homestead Access Road
* ***
*
Pears
4
List of Resources1. Stehekin Residence 1082. Stehekin Residence 1073. North Orchard Outhouse4. Packing Shed Foundation5. Sprayer Shed6. Swimming Pool (site)7. Packers Cabin West8. Pumhouse9. Buckner/Garfoot Residence10. Privy11. Harness/Wood Shed12. Playhouse13. Smoke/Delco House14. Root Cellar15. Buzzard Cabin16. Brooder House17. Chicken House18. Barn/Shop19. Packers Cabin East20. Milk Separator21. Wagon Lean-to22. Fuel Drum Rack23. Barn Ruins24. Corral25. Badminton Court26. Volleyball Court, Fire Ring, Horseshoe Pit27. Fire Ring28. Parking29. Sundial30. Outdoor Fireplace31. Wash Sink32. Vegetable Garden
9
1011
1213
14
1516
17
18
1920
21
22
23
24
25
282930
31
Historic District Boundary
Historic District Boundary
Intake and diversion ditch
Source: Park geodatabase, 2013 CLI field investigation, 2014 draft National Register ammendment.
Drawn in Adobe Illustrator Enterprise 2015.
Road to Clearing
Sout
hern
Acc
ess
Road
Buckner Homestead Access RoadNorthern Segment (non-contributing)
Main
Ditc
h an
d Bu
ckne
r Lan
e
Main Ditch
North and East Feeder Ditch
Milk Separator Ditch
ResidentialArea Ditch
Pasture Ditch
North Field Ditch
Non-contributing resourcesRoads (contributing)Fences (non-contributing)Irrigation ditches (contributing)Orchard ditches (contributing)Site
32
Drivewayto workshop
Main
Ditc
h an
d Bu
ckne
r Lan
e
Mai
n Di
tch
Drivewayto packing shed
27
26
North Cascades National ParkBuckner Homestead Historic District - Existing Conditions Site Plan Pacifi c West Regional Offi ce | Cultural Landscapes Program | Cultural Landscape Inventory | March 2016

64
SUMMARY OF CHELAN COUNTY, WASHINGTON 1 MAXIMUM 2-M AIR TEMPERATURE
1 Maximum 2-m Air Temperature
Figure 1: Seasonal average time series of maximum 2-m air temperature for historical (black), RCP4.5 (blue) and RCP8.5 (red).The historical period ends in 2005 and the future periods begin in 2006. The average of 30 CMIP5 models is indicated by the solidlines and their standard deviations are indicated by the respective shaded envelopes.
Figure 2: Monthly averages of maximum 2-m air temperature for four time periods for the RCP4.5 (left) and RCP8.5 (right)simulations. The average of 30 CMIP5 models is indicated by the solid lines and their standard deviations are indicated by therespective shaded envelopes. Triangle, diamond and square symbols indicate the percent of models that simulate future minuspresent changes that are of the same sign and significant. A two-sided Students t-test is used to establish significance (ρ ≤ 0.05).
1 -Alder and Hostetler, USGS
Model Projections: Maximum Air Temperature
Figure NOCA 1.3: Seasonal average time series of maximum 2-m air temperature for historical (black), RCP4.5 (blue) and RCP8.5 (red). The historical period ends in 2005 and the future periods begin in 2006. The average of 30 CMIP5 models is indicated by the solid lines and their standard deviations are indicated by the respective shaded envelopes.Alder, J. R. and S. W. Hostetler, 2013. USGS National Climate Change Viewer. USGS.
Under the Highest emissions projection (IPCC RCP 8.5), average temperature is projected to increase by 4.9°C (8.8°F) by the year 2100 relative to 1950. (See Figure NOCA 1.3).
REGIONAL CLIMATE CHANGE PROJECTION SUMMARY Chelan County, WA

65
SUMMARY OF CHELAN COUNTY, WASHINGTON 3 PRECIPITATION
3 Precipitation
Figure 5: Seasonal average time series of precipitation for historical (black), RCP4.5 (blue) and RCP8.5 (red). The historicalperiod ends in 2005 and the future periods begin in 2006. The average of 30 CMIP5 models is indicated by the solid lines andtheir standard deviations are indicated by the respective shaded envelopes.
Figure 6: Monthly averages of precipitation for four time periods for the RCP4.5 (left) and RCP8.5 (right) simulations. Theaverage of 30 CMIP5 models is indicated by the solid lines and their standard deviations are indicated by the respective shadedenvelopes. Triangle, diamond and square symbols indicate the percent of models that simulate future minus present changes thatare of the same sign and significant. A two-sided Students t-test is used to establish significance (ρ ≤ 0.05).
3 -Alder and Hostetler, USGS
Model Projections: Precipitation
Figure NOCA 1.4: Seasonal average time series of precipitation for historical (black), RCP4.5 (blue) and RCP8.5 (red). The historical period ends in 2005 and the future periods begin in 2006. The average of 30 CMIP5 models is indicated by the solid lines and their standard deviations are indicated by the respective shaded envelopes.Alder, J. R. and S. W. Hostetler, 2013. USGS National Climate Change Viewer. USGS.
Under the Highest emissions projection (IPCC RCP 8.5), average precipitation is projected to increase by 9% by the year 2100 relative to 1950. (See Figure NOCA 1.4).
Model Projections: Storms
Figure NOCA 1.5: Projected changes in 20-year storm frequency for NOCA from the IPCC AR5 (2013). IPCC storm multiplier indicates the projected increase in frequency of 20-year storms. Occurrence indicates how that increase translates in the number of years.
STORM FREQUENCY PROJECTION DATA
CASE STUDY SITE IPCC STORM FREQUENCY MULTIPLIER 20-YEAR STORM OCCURRENCE (YEARS)
NOCA 4 5.0

66
• Forest succession has impacted selected views outward from the site, as density has increased with conifer (Douglas fir) growth and filtered sunlight reduced.
• Softening of landscape edges due to conifer encroachment into the historic pasture area and along periphery of orchard blocks.
• Historic buildings onsite (See Figure NOCA 1.6) range from poor to good condition, with preservation repairs currently underway on the Buckner/Garfoot cabin.
• Extensive system of hand-dug feeder, irrigation, and ancillary supply ditches, central to orchard health and fed by nearby Rainbow Creek, remains operational across much of the 105.50-acre (42.69 hectare) landscape, although a number of junctions require maintenance.
• River bank erosion undermines the southwestern edge of the site (See Figure NOCA 1.7), and integrity of contributing pasture area and site organization.
• Stehekin flood events have affected archaeological resources, eroding and disturbing the Lower Can Dump, located east of the former pasture area (not yet reflected in CLI mapping). Potential channel migration may further undermine historic
Figure NOCA 1.6: Root Cellar and Buzzard Cabin, view northeast toward north orchard block. (Kerr/UO CLRG, 2016)
integrity in this contributing feature.
• Integrating historic orchard husbandry practices has done much to sustain key vegetation features and overarching spatial organization (See Figure NOCA 1.8). Buckner Homestead’s orchardist highlighted the potential long-term value of inaugurating the collection of scion wood for orchard resilience through propagation of historic specimens, alongside practices which have already been implemented—including delaying replacement of dead trees 7-10 years, to allow replanting in the same location without risk of disease infection (See Figure NOCA 1.9).
• Local deer populations are encouraged to browse fallen fruit within gated north-block orchard during warmer months, reducing the attractiveness of decaying fruit to rodents as well as bear and elk, all of whom pose a hazard to trees’ health and structure.
• Shifts in temperature and precipitation, with the potential for milder and wetter winters, raise possibilities of pest damage to orchard specimens. Traces of powdery mildew were apparent on apple leaves.
CURRENT SITE CONDITIONS

67
Figure NOCA 1.7: Stehekin River bank erosion impacts historic pasture features and spatial organization, view southeast. (Kerr/UO CLRG, 2016)
Figure NOCA 1.8: Buckner apple orchard (north block), view north. (Malinay/UO CLRG, 2016)
Figure NOCA 1.9: Former location of historic fruit tree within Buckner Orchard, view south. Propagation of a grafted cultivar will occur in the same place, sustaining spatial organization, after 7-10 years, to reduce risk of disease infection in the new tree. Note hand-dug irrigation ditches, immediately parallel to each row. (Kerr/UO CLRG, 2016)

68
Buckner Homestead Historic District
U.S. Geological Survey
FEMA 100-year Flood
Drought conditions: 2013 Landslide (USGS)
Wildfire Hazard Potential: 2014
Within 100-year Flood ZoneOutside of 100-year Flood Zone
0 90 180 270Feet
High landslide incidence Moderate landslide incidenceHigh susceptibility to landsliding and moderate incidenceHigh susceptibility to landsliding and low incidenceModerate susceptibility to landsliding and low incidenceLow landslide incidence
Very LowLow
ModerateHighVery High
Non-burnable
Water
Abnormally DryModerate Drought
Severe DroughtExtreme DroughtExceptional Drought
N o D a t a
N o D a t a
GIS HAZARD DATA: BUCKNER HOMESTEAD HISTORIC DISTRICT, NOCAWILDFIRE HAZARD POTENTIAL: 2014 FEMA 100-YEAR FLOOD
DROUGHT CONDITIONS: 2013 LANDSLIDE (USGS)
Figure NOCA 1.10: GIS analysis. (Lewis/UO CLRG, 2016)
Buckner Homestead Historic District
U.S. Geological Survey
FEMA 100-year Flood
Drought conditions: 2013 Landslide (USGS)
Wildfire Hazard Potential: 2014
Within 100-year Flood ZoneOutside of 100-year Flood Zone
0 340 680 1020Feet
High landslide incidence Moderate landslide incidenceHigh susceptibility to landsliding and moderate incidenceHigh susceptibility to landsliding and low incidenceModerate susceptibility to landsliding and low incidenceLow landslide incidence
Very LowLow
ModerateHighVery High
Non-burnable
Water
Abnormally DryModerate Drought
Severe DroughtExtreme DroughtExceptional Drought
N o D a t a
N o D a t a

69
• This cultural landscape is within a low-hazard area for landslide events. Specific FEMA and drought data remain unavailable for the locale. Analysis of fire spatial data reflects a similar classification (low- to very low hazard), although wildfire conditions similar to the 2015 Wolverine event and 2007 Domke Lake complex (which evacuated nearby Holden Village) urge heightened caution in readiness planning for future events and trends. The unprecedented severity of the 2014 and 2015 Washington state fire seasons only underline this concern, reflected locally in the Okanogan Complex and Carleton Complex fire events. Of this apparent conflict between current GIS data and field conditions, further critical analysis is needed, with attention to the potential for exposure to catastrophic climate events. Continued planning for defensible space in the Stehekin Valley likewise requires care for those contributing landscape features and systems at Buckner Homestead (See Figure 1.10).
• Channel instability on the Stehekin River Valley is a concern. Flood events pose a continuous risk to site stability, in light of apparent increases in severe event frequency since 1995 and the site’s position relative to the 100 year FEMA floodplain below McGregor Meadows. Projected shifts in climate variables highlight precipitation changes that could exacerbate this risk.
• Impact analysis identifies heavy snow loading as the source of damage to the Buzzard Cabin roof with potential for increased precipitation. Heightened weather exposure could result in decline in the many contributing agricultural implements onsite, as well as degradation of archaeological resources. The sensitivity of built resources’ materiality and construction to increased seasonal moisture also risks their accelerated decline. Snow loading, in addition, can weaken and damage the scaffold limbs of historic fruit trees. At present, the orchardist uses the traditional technique of supporting branches with wooden props to protect tree structure and health.
• Implement 0.2-acre bank restoration to stabilize soil and reduce pasture integrity loss (see Stehekin River Corridor Implementation Plan, 2013)
• Develop and implement strategies to strengthen resilience in rare historic orchard remnants, drawing on cultural landscape management principles of genetic redundancy (e.g. gathering scion wood, to be stored in an offsite repository) and diversity.
• Establish monitoring regime for air and soil temperature in core orchard area to better understand effects of projected temperature change.
• Re-establish landscape edge for orchard and pasture by removing encroaching (woody) vegetation on an annual basis.
• Reduce or remove fuel loads in and around the cultural landscape boundary, using treatments sensitive to the preservation of orchard features and homestead buildings.
• Develop more detailed documentation in support of cyclic maintenance for historic irrigation system. This might comprise monitoring flows from the Rainbow Falls/Creek inlet; precise, comprehensive geospatial mapping of feeder, orchard and ancillary ditches, noting mature trees (outside orchard) and embankment vegetation; and schematics drawn for historic built features, including earthen/log cribbing, box culverts, and earthen embankments,
• Document and stabilize archaeological features (i.e., lower Stehekin can dump), increase data retrieval efforts in consultation with historical archaeologist.
• Monitor and control continued interest by wildlife in orchard vegetation as a seasonal food source.
SUMMARY OF HAZARD EXPOSURE RECOMMENDATIONS FOR NEXT STEPS

70
Figure NEPE 1.1: Heart of the Monster, Nez Perce National Historical Park, view west. (Malinay/UO CLRG, 2016)

71
• Size: 53 acres (21.45 hectares)
• Cultural Landscape Type: Historic Site
• Period of Significance: 8,800 BCE - 1805 CE, 1806 CE - 1877 CE, and 1887 CE - 1950 CE
The first period of significance is based on archeological evidence that ancestors of the Nez Perce inhabited the Clearwater Valley as early as 10,800 years ago (or 8,800 BCE).
The second period begins in 1806 with the Lewis and Clark Expedition that camped within the Kamiah valley and ends with the War of 1877.
The beginning of the third period of significance is marked by the General Allotment Act of 1887 and ends in 1950 with the completion of Highway 12, which bisected the present-day East Kamiah.
• National Register Significance: Criterion AEast Kamiah is significant under Criterion A for its association with events that have made a significant contribution to the broad patterns of our
Idaho County, IDNEZ PERCE NATIONAL HISTORICAL PARK, ID
CULTURAL LANDSCAPE SUMMARY
EAST KAMIAH/HEART OF THE MONSTER
history, including the War of 1877, the Allotment Era, early homesteading in the American West, and early cultural and spiritual beliefs of the Nez Perce.
• National Register Significance: Criterion DEast Kamiah is significant under Criterion D as a site that has potential to reveal prehistoric and historic information through archeological excavation.
East Kamiah, also known as “Heart of the Monster,” (See Figure NEPE 1.1) is one of 38 sites that compose the Nez Perce National Historical Park. It is situated on approximately 53 acres of National Park Service owned land near Kamiah, Idaho. The site is bounded by the Clearwater River on the west and by privately owned properties along all other boundaries. Highway 12 intersects the site, dividing it into two portions. Approximately 43 acres are located on the west side of the highway, between the road and the river. The remaining 10 acres are located on the eastern side of the highway, between the road and the foothills of the Kamiah valley wall.

Figure NEPE 1.2: East Kamiah/Heart of the Monster, Nez Perce National Historical Park 2016 site plan. (NPS PWRO, 2016)
Source: Esri, DigitalGlobe, GeoEye, Earthstar Geographics, CNES/Airbus DS, USDA, USGS, AEX,Getmapping, Aerogrid, IGN, IGP, swisstopo, and the GIS User Community
0 0.05 0.10.025 Miles ¯
Nez Perce National Historical ParkEast Kamiah/Heart of the Monster Site PlanEast Kamiah/Heart of the Monster Cultural Landscape Inventory
National Park ServiceU.S. Department of the Interior
December 2016Prepared by PWRO Cultural Landscape Program
Interpretive Shelter
Maintenance Building
Restrooms
Picnic Area/Audio Station
Heart of the Monster
Picnic Area
Liver of the Monster
Foundation
Pump House & StorageOutbuilding Storage
Hig
hw
ay 2
Concrete Stairsand Slab
LegendEast Kamiah/Heart of the Monster CLI Boundary
Trails

73
SUMMARY OF IDAHO COUNTY, IDAHO 1 MAXIMUM 2-M AIR TEMPERATURE
1 Maximum 2-m Air Temperature
Figure 1: Seasonal average time series of maximum 2-m air temperature for historical (black), RCP4.5 (blue) and RCP8.5 (red).The historical period ends in 2005 and the future periods begin in 2006. The average of 30 CMIP5 models is indicated by the solidlines and their standard deviations are indicated by the respective shaded envelopes.
Figure 2: Monthly averages of maximum 2-m air temperature for four time periods for the RCP4.5 (left) and RCP8.5 (right)simulations. The average of 30 CMIP5 models is indicated by the solid lines and their standard deviations are indicated by therespective shaded envelopes.
1 -Alder and Hostetler, USGS
Model Projections: Maximum Air Temperature
Figure NEPE 1.3: Seasonal average time series of maximum 2-m air temperature for historical (black), RCP4.5 (blue) and RCP8.5 (red). The historical period ends in 2005 and the future periods begin in 2006. The average of 30 CMIP5 models is indicated by the solid lines and their standard deviations are indicated by the respective shaded envelopes.Alder, J. R. and S. W. Hostetler, 2013. USGS National Climate Change Viewer. USGS.
Under the Highest emissions projection (IPCC RCP 8.5), average temperature is projected to increase by 6.2°C (11.2°F) by the year 2100 relative to 1950 (See Figure NEPE 1.3).
REGIONAL CLIMATE CHANGE PROJECTION SUMMARY Idaho County, ID

74
SUMMARY OF IDAHO COUNTY, IDAHO 3 PRECIPITATION
3 Precipitation
Figure 5: Seasonal average time series of precipitation for historical (black), RCP4.5 (blue) and RCP8.5 (red). The historicalperiod ends in 2005 and the future periods begin in 2006. The average of 30 CMIP5 models is indicated by the solid lines andtheir standard deviations are indicated by the respective shaded envelopes.
Figure 6: Monthly averages of precipitation for four time periods for the RCP4.5 (left) and RCP8.5 (right) simulations. The averageof 30 CMIP5 models is indicated by the solid lines and their standard deviations are indicated by the respective shaded envelopes.
3 -Alder and Hostetler, USGS
Model Projections: Precipitation
Figure NEPE 1.4: Seasonal average time series of precipitation for historical (black), RCP4.5 (blue) and RCP8.5 (red). The historical period ends in 2005 and the future periods begin in 2006. The average of 30 CMIP5 models is indicated by the solid lines and their standard deviations are indicated by the respective shaded envelopes.Alder, J. R. and S. W. Hostetler, 2013. USGS National Climate Change Viewer. USGS.
For projected average annual precipitation, there is large uncertainty in the projections, with the average of all models projecting 0.4mm/day (1.4in/day) increase (RCP8.5) (See Figure NEPE 1.4).
Model Projections: Storms
Figure NEPE 1.5: Projected changes in 20-year storm frequency for EUON from the IPCC AR5 (2013). IPCC storm multiplier indicates the projected increase in frequency of 20-year storms. Occurrence indicates how that increase translates in the number of years.
STORM FREQUENCY PROJECTION DATA
CASE STUDY SITE IPCC STORM FREQUENCY MULTIPLIER 20-YEAR STORM OCCURRENCE (YEARS)
NEPE 3 6.7

75
• The “Heart” and “Liver” are stable and largely unaffected by historic and current temperature and precipitation.
• Fires do occur in the area, but the site is relatively protected, as it is from landslide potential, due to its location across Highway 12 from the adjacent hillside.
• Invasive plants include black locust, knapweed (Centaurea maculosa), Scotch thistle (Onopordon acanthium) (See NEPE 1.6), and teasle (Disacus sylvestris). Additional invasive plants observed during site visit: Lomasium, and Dog vein (native hemp).
• Invasive species are a continual challenge, as is erosion along the creek (See NEPE 1.7). It is not clear to what extent these two trends have evolved in recent years.
• NPS staff reports that in recent years snow pack is typically gone in the area by the 1st week of June (rather than lasting through July). This leads
Figure NEPE 1.6: Invasive Scotch thistle (Onopordon acanthium) is pictured in the foreground, view east. (Malinay/UO CLRG, 2016)
to earlier bloom times and could impact wildlife, insects, and pollinators, in addition to the park’s maintenance regime.
• The adjacency to Highway 12 offers accessibility, which proves to be both positive, in the case of natural disasters, and negative, as it provides easy access to people wishing to cross the site off-road, bound for the river for recreation purposes, which seems to be damaging to the East Kamiah grassland ecosystem.
CURRENT SITE CONDITIONS

76
Figure NEPE 1.7: Clearwater River bank erosion. (Malinay/UO CLRG, 2016)

77
Buckner Homestead Historic District
U.S. Geological Survey
FEMA 100-year Flood
Drought conditions: 2013 Landslide (USGS)
Wildfire Hazard Potential: 2014
Within 100-year Flood ZoneOutside of 100-year Flood Zone
0 340 680 1020Feet
High landslide incidence Moderate landslide incidenceHigh susceptibility to landsliding and moderate incidenceHigh susceptibility to landsliding and low incidenceModerate susceptibility to landsliding and low incidenceLow landslide incidence
Very LowLow
ModerateHighVery High
Non-burnable
Water
Abnormally DryModerate Drought
Severe DroughtExtreme DroughtExceptional Drought
N o D a t a
N o D a t a
GIS HAZARD DATA: EAST KAMIAH/HEART OF THE MONSTER, NEPEWILDFIRE HAZARD POTENTIAL: 2014 FEMA 100-YEAR FLOOD
DROUGHT CONDITIONS: 2013 LANDSLIDE (USGS)
Figure NEPE 1.8: GIS analysis. (Lewis/UO CLRG, 2016)
Buckner Homestead Historic District
U.S. Geological Survey
FEMA 100-year Flood
Drought conditions: 2013 Landslide (USGS)
Wildfire Hazard Potential: 2014
Within 100-year Flood ZoneOutside of 100-year Flood Zone
0 340 680 1020Feet
High landslide incidence Moderate landslide incidenceHigh susceptibility to landsliding and moderate incidenceHigh susceptibility to landsliding and low incidenceModerate susceptibility to landsliding and low incidenceLow landslide incidence
Very LowLow
ModerateHighVery High
Non-burnable
Water
Abnormally DryModerate Drought
Severe DroughtExtreme DroughtExceptional Drought
N o D a t a
N o D a t a

78
• Based on the GIS data, the features in moderate to high fire hazard zones are: the apple tree that is 100-years old and cherry trees northeast of heart, Siberian elm, lilacs, daffodils, and roses are all in a moderate fire hazard zone. The black walnut and black locust are in a high fire hazard zone. The heart of the Monster basalt outcropping is also in a high fire hazard zone, however given its material, is relatively stable in the face of this hazard (see NEPE Image 1.8W).
• Large parts of Kamiah burned last summer, although this cultural landscape was relatively protected from this fire.
• In the case of prolonged periods of drought, vegetation on site is more susceptible to fire.
• Park staff is currently managing vegetation in partnership with the Nez Perce tribe. Erosion is evidence of the Clearwater River banks slumping (see NEPE Image 1.7). This has the potential to affect the cultural resources along the river.
• Continue to monitor contributing vegetation, water level and bank stability, prairie condition, and the basalt outcroppings.
SUMMARY OF HAZARD EXPOSURE RECOMMENDATIONS FOR NEXT STEPS

79

80
Conclusion and Recommendations
What is at risk?The cultural landscapes within the Pacific West Region vary geographically, ecologically and historically, and will therefore be affected differently by hazards related to climate change. Arid landscapes are at risk to longer periods of drought. Coastal and riparian areas are exposed to greater impacts of flooding and erosion. All landscapes are exposed to projected higher temperatures. Future stabilization efforts need to be prioritized where there are cultural landscapes significantly vulnerable to projected climate change effects. What comes next? It is important to consider and assess cultural landscape systems at multiple scales, and to regularly update cultural landscape inventories and other tools and documents. Climate and its known and projected impacts affects cultural landscapes in multiple ways and should always be included in any research or management effort.
Some cultural landscapes, however, are more vulnerable than others to climate change impacts. Further research is necessary to address prioritization of where there is considerable projected risk to cultural landscapes. Additionally, there is a need to examine the rates at which a hazard occurs on the cultural landscape. The extent, rate, and magnitude to which cultural landscapes are threatened is not known or easily understood. Delving deeper
into the history of impacts on the 164 cultural landscapes within the PWR will provide greater opportunity to understand future projections.
Consider different climate variables for different types of areas such as urban/rural, mountain/valley, or coastal/inland.
Have a consistent approach to timing of field investigations, such as annually or seasonally, as well as the research tools that are used, such as GIS data, current climate projections at similar scales, and others. This will aid in longitudinal studies.
There is value in linking this line of inquiry with FMSS protocols, so that climate research can directly informs preservation repairs.
What is the timeline?Phase 1 of this project dates from September 2015 to December 2016. Future phases of this work will include development of vulnerability assessments for selected cultural landscapes within the Pacific West Region and preparation of adaptation strategies for selected cultural landscapes that are identified as highly vulnerable. This project will contribute to a greater public understanding of how climate change could potentially affect cultural landscapes by providing a detailed analysis of climate change projections with current cultural landscape data.
The study of climate change impacts on cultural landscapes in the Pacific West Region can serve as a model and essential building block for a series of studies directed towards a deeper analysis and evaluation of how cultural landscapes are at risk to the projected effects of climate change. This work is not undertaken in isolation, and requires multiple experts in diverse fields to address this complex issue. The necessary collaboration strengthens the research, and progresses the understanding of what cultural landscapes face now and into the future.

Good=0.33, Fair=0.66, Poor=1.0
Landscape Characteristic
Analysis Evaluation Features ID Feature Name
Condition (0.33-1)
Fire Hazard (blank, 0-1)
Flood Hazard (blank, 0-1)
Landslide Hazard (blank, 0-1)
Drought Hazard (blank, 0-1)
Average Hazard Score
Water/ Wind Erosion
Coastal or Shoreline Erosion/ Inundation/Flooding Drought Fire
Exposure to Elements
Micro-climate
Pest / Disease
Vegetation/ Invasive Plants
Disruption of Species
Average Impact Score
Condition x (Hazard + Impact)
Projection of change in average annual temperature in degrees Celsius
Projection of change in average annual precipitation by percentage ((change/historic period)100)
Projection of sea-level rise in meters
Projection of frequency of 20-Year Storm Events in years (20/multiplier) Intensity Confidence
Projected Exposure=
(Intensity x Confidence)
Archeological Sites 105681 Pelekane 0.66 0 1 1 0.22 14.67% 3.3 15 0.7 6.7 3.93 0.75 2.95
Archeological Sites 105682The John Young Homestead Site 0.66 0 1 1 0.22 14.67% 3.3 15 0.7 6.7 3.93 0.75 2.95
Buildings And Structures 105683 Leaning Post 0.66 0 1 0.11 7.33% 3.3 15 0.7 6.7 3.93 0.75 2.95Buildings And Structures 105684 Mailekini Heiau 0.66 0 1 0.11 7.33% 3.3 15 0.7 6.7 3.93 0.75 2.95Buildings And Structures 105685 Pu'ukohola Heiau 0.66 0 1 0.11 7.33% 3.3 15 0.7 6.7 3.93 0.75 2.95
Buildings And Structures 105686Stone walls around Pu'ukohola Heiau 0.66 0 1 0.11 7.33% 3.3 15 0.7 6.7 3.93 0.75 2.95
Buildings And Structures 105687Stone walls below Mailekini Heiau 0.66 0 1 0.11 7.33% 3.3 15 0.7 6.7 3.93 0.75 2.95
Cultural Traditions n/a Application of kapu system 0.66 0 0.00 0.00% 3.3 15 0.7 6.7 3.93 0.75 2.95
Cultural Traditions n/a Presence of two other heiau 0.66 0 0.00 0.00% 3.3 15 0.7 6.7 3.93 0.75 2.95
Cultural Traditions n/aEvidence of traditional building techniques 0.66 0 0.00 0.00% 3.3 15 0.7 6.7 3.93 0.75 2.95
Cultural Traditions n/aStructures relating to aquaculture 0.66 0 0 0.00 0.00% 3.3 15 0.7 6.7 3.93 0.75 2.95
Cultural Traditions n/aUse of marine resource offshore 0.66 0 0.00 0.00% 3.3 15 0.7 6.7 3.93 0.75 2.95
Spatial Organization 105689
Spatial relationship between Pu'ukohola Heiau, Mailekini Heiau and Pelekane 0.66 1 0.25 0.00 16.50% 3.3 15 0.7 6.7 3.93 0.75 2.95
Topography 105692 Prominent Hill 0.66 1 0.25 0.00 16.50% 3.3 15 0.7 6.7 3.93 0.75 2.95Vegetation 105695 Coconut grove at Pelekane 0.66 0 0.00 0.00% 3.3 15 0.7 6.7 3.93 0.75 2.95
Vegetation 105699Scattered native plants along coast 0.66 0 0 1 0.11 7.33% 3.3 15 0.7 6.7 3.93 0.75 2.95
Views And Vistas 105701
Views from Pelekane Bay towards Pelekane, Mailekini and Pu'ukohola heiau 0.66 0 0 0.00 0.00% 3.3 15 0.7 6.7 3.93 0.75 2.95
Views And Vistas 95606Views from Pu'ukohola Heiau to the east 0.66 0 0.00 0.00% 3.3 15 0.7 6.7 3.93 0.75 2.95
Views And Vistas 95607Views from Pu'ukohola Heiau to the west 0.66 0 0.00 0.00% 3.3 15 0.7 6.7 3.93 0.75 2.95
Views And Vistas 95609
Views from the Pelekane upslope toward Pu'ukohola Heiau 0.66 0 0 0.00 0.00% 3.3 15 0.7 6.7 3.93 0.75 2.95
Current Exposure Historical Exposure Projected Exposure
GIS hazard data (either blank for no data, or 0-1) CLI Impact (either blank=0 or 1+)
Appendix A: Vulnerability Matrix example
PUHE

82
Appendix B: Current Exposure/GIS Analysis
Because this analysis considers all 13 Landscape Characteristics, the features for each park received the same treatment. These scores will contribute to the site’s vulnerability assessment. The following guidelines were followed while conducting the spatial analysis component of this project:
• Any feature that is constructed, such as Buildings and Structures, Small-Scale Features, and roads, under Circulation, does not receive a drought hazard score.
• Geography, under Natural Systems and Features, does not receive a drought hazard score.
• Circulation patterns, such as trails and walkways, do receive a drought hazard score. After prolonged periods of drought resulting in damage to vegetation, these features areas are more susceptible to erosion, which may directly affect a trail’s alignment or visibility.
• Views and Vistas that include any feature outside of the cultural landscape’s boundary did not receive a score for any of the four hazards.
• General features such as pervasive vegetation patterns under Natural Systems and Features, climate, general topographic characteristics, or any other feature that is not specifically located on either the site plan or within GIS, do not receive a score.
• When a road is identified as a cultural landscape feature, any related feature, such as grade and alignment, receives hazards scores as these features are spatially linked to the road itself.
• Spatial organization for specific areas within the cultural landscape site receives hazard scores, so long as these areas may be specifically located.
In general, any feature that cannot be located in space on either the site plan or within GIS, did not receive a hazard score.

83
Drought:Any feature that falls within a drought hazard area, receives the corresponding drought hazard ranking of 0-1, where 0.3 is an abnormally dry drought hazard, 0.6 is a moderate to severe drought hazard, and 1 is exceptional to extreme drought hazard. If a feature falls within multiple drought hazard classifications, that feature receives the highest ranking. For example, if an orchard as a contributing feature traverses an area, which has low, moderate, and high drought danger classifications, the orchard as a contributing feature will receive a ranking of 1.
Fire:Any feature that falls within a fire hazard area, receives the corresponding fire hazard ranking of 0-1, where 0 is water or no-burn areas, 0.3 is a low fire hazard, 0.6 is a moderate fire hazard, and 1 is a high fire hazard. If a feature falls within multiple fire hazard classifications, that feature receives the highest ranking. For example, if an orchard as a contributing feature traverses an area, which has low, moderate, and high fire danger classifications, the orchard as a contributing feature receives a ranking of 1.
Flood:Any feature that falls within a 100-year flood hazard area, receives the corresponding flood hazard ranking of 0-1, where 0 is outside of the 100-year flood and 1 is within the 100-year flood zone. If a feature falls within multiple flood hazard classifications, that feature receives the highest ranking. For example, if a road traverses a large area, which has low, moderate, and high flood hazard danger classifications, the road as a contributing feature will receive a ranking of 1.
Landslide:Any feature that falls within a landslide hazard area, receives the corresponding landslide hazard ranking of 0-1, where 0 is a low landslide hazard, 0.5 is a moderate landslide hazard, and 1 is a high landslide hazard. If a feature falls within multiple landslide hazard classifications, that feature receives the highest ranking. For example, if a road as a contributing feature traverses a large area, which has low, moderate, and high danger for landslides, the road as a contributing feature will receive a ranking of 1.

84
Appendix C: Projected Exposure Calculations
In order to calculate the exposure to climate change, the following equation is presented:
Projected Exposure = Intensity x Confidence
Intensity: estimated magnitude of climate change per climate variable.
Representing the magnitude of climate change per climate variable, a multiplier is assigned per range of change. Rankings for the climate change variables are equally binned to create a range of values to be used in the equation above. For intensity, the higher the number for the ranking value, the more severe the climate change variable affects the contributing features.
Change in temperature (*C): score0-2 = 13-4 = 25-6 = 37-8 = 49-10 = 5
Change in precipitation (%): score0% = 1+/- 10% = 2+/- 20% = 3+/- 30% = 4> +/- 40% = 5
Change in sea-level (m): score0 - 0.2 = 10.3 - 0.4 = 20.5 - 0.6 = 30.7 - 0.8 = 40.9 - 1.0 = 5

85
Storm frequency: Projections of frequency of 20-year storm events are taken from the National Oceanic and Atmospheric Administration (NOAA) National Climatic Data Center (NCDC), and consider both potential increase and decrease in frequency. Determination of projected frequency is calculated by dividing the historic storm frequency (20) by the future change multiplier.
Projected storm frequency = historic storm frequency/future change multiplier
For example, if there is a projected 5x increase in 20 year storm frequency, then the storm is projected to occur once every 4 years.
20 year storm frequency/5 future change multiplier = projected storm frequency of 4 years
This means the storm is 5x more likely to occur than prior probabilities.
Confidence: range of uncertainty in the climate change projections. (High confidence = 1.0, Medium-High confidence = .75, Medium-Low confidence = .50, Low confidence = .25). Source: IPCC, P.Gonzalez reports, USGS National Climate Change Viewer
% uncertainty in climate change variable : score+/- 100% = .25+/- 75% = .50+/- 50% = .75+/-25% = 1.0
End of the century climate change projections are extracted from reliable sources including the Intergovernmental Panel on Climate Change Assessment Reports, the National Park Service, and the United States Geological Survey (USGS).

86
Bibliography
General Cultural Landscapes and Climate Change
Alder, J. R., and S. W. Hostetler. 2013. USGS National Climate Change Viewer. US Geological Survey. http://www.usgs.gov/climate_landuse/clu_rd/nccv.asp. doi:10.5066/F7W9575T
Beagan, Chris and Susan Dolan. 2015. “Integrating Components of Resilient Systems Into Cultural Landscape Management Practices.” Change Over Time. no. 5.2: 180-199.
Glick, P., B.A. Stein, and N.A. Edelson, eds. 2011. Scanning the Conservation Horizon: A Guide to Climate Change Vulnerability Assessment. Washington, D.C.: National Wildlife Federation.
Gonzalez, Patrick. 2011. “Climate change impacts and carbon in U.S. national parks.” Park Science 28, no 2: 10-15.
Intergovernmental Panel on Climate Change. 2013. “Summary for Policymakers.” In Climate Change 2013: The Physical Science Basis. Contribution of Working Group I to the Fifth Assessment Report of the Intergovernmental Panel on Climate Change. Edited by Stocker, T.F., D. Qin, G.-K. Plattner, M. Tignor, S. K. Allen, J. Boschung, A. Nauels, Y. Xia, V. Bex, and P.M. Midgley. New York: Cambridge University Press.
Intergovernmental Panel on Climate Change. 2014. Climate Change 2014: Impacts, Adaptation, and Vulnerability. Part A: Global and Sectoral Aspects. Contribution of Working Group II to the FifthAssessment Report of the Intergovernmental Panel on Climate Change. Edited by C.B., Field, V.R. Barros, D.J. Dokken, K.J. Mach, M.D. Mastrandrea, T.E. Bilir, M. Chatterjee, K.L. Ebi, Y.O. Estrada, R.C. Genova, B. Girma, E.S. Kissel, A.N. Levy, S. MacCracken, P.R. Mastrandrea, and L.L. White. New York: Cambridge University Press.
Melnick, Robert Z., Olivia Burry-Trice, and Veronica Malinay. 2015. Climate Change and Cultural Landscapes: Research, Planning, and Stewardship. Unpublished draft. Eugene, OR.: Department of Landscape Architecture, University of Oregon.
Melnick, Robert Z. 2015. “Climate Change Challenges and Cultural Landscape Viability.” In: Taylor, Ken, Nora Mitchell, and Archer St Clair Harvey, eds. Conserving Cultural Landscapes: Challenges and New Directions. 295-308. New York and London: Routledge .
Melnick, Robert Z. 2009. “Climate Change and Landscape Preservation: A Twenty-First-Century Conundrum.” APT Bulletin: Journal of Preservation Technology. no. 40:3-4 :35-42.
National Academies of Sciences, Engineering, and Medicine. 2016. Attribution of Extreme Weather Events in the Context of Climate Change. Washington, DC: The National Academies Press. doi: 10.17226/21852.
National Park Service. 2013. Using Scenarios to Explore Climate Change: A Handbook for Practitioners. Fort Collins, CO: National Park Service Climate Change Response Program.
National Park Service Climate Change Response Program. 2014. Planning Brief: Flexible Planning in an Era of Uncertainty. Washington, D.C.: United States Department of the Interior.
National Park Service. 2014. Preserving Coastal Heritage Workshop Summary Report. New York, April 3-4.

87
Page, Robert R., Jeffrey Killion, and Gretchen Hilyard. 2009. National Park Service Cultural Landscapes Inventory Professional Procedures Guide. Washington, DC: United States Department of the Interior, National Park Service, Cultural Resource Stewardship and Partnerships, Park Historic Structures and Cultural Landscapes Program.
Rockman, Marcy. 2015. “An NPS Framework for Addressing Climate Change with Cultural Resources.” George Wright Forum 32, no. 1: 37-50.
Walsh, J., D. Wuebbles, K. Hayhoe, J. Kossin, K. Kunkel, G. Stephens, P. Thorne, R. Vose, M. Wehner, J. Willis, D. Anderson, S. Doney, R. Feely, P. Hennon, V. Kharin, T. Knutson, F. Landerer, T. Lenton, J. Kennedy, and R. Somerville. 2014. Ch. 2: Our Changing Climate. Climate Change Impacts in the United States: The Third National Climate Assessment. Edited by J. M. Melillo, Terese (T.C.) Richmond, and G. W. Yohe. Washington, D.C.: U.S. Global Change Research Program. doi:10.7930/J0KW5CXT.
Case Study: Lyons Ranches Historic District, Redwood National Park
“Fire Monitoring Plan: Redwood National Park.” National Park Service. https://www.nps.gov/redw/learn/management/upload/Appendix%20M%20Fire%20Monitoring%20Plan.pdf
Brabec, Elizabeth, and Elizabeth Chilton. 2015. “Toward an Ecology of Cultural Heritage.” Change Over Time 5, no. 2: 267-268.
Dalton, Meghan M., Philip W. Mote, and Amy K. Snover, eds. 2013. Climate Change in the Northwest: Implications for Our Landscapes, Communities, and Waters. Washington, D.C.: Island Press.
Gonzalez, Patrick, and John J. Battles. 2013. California Vegetation Carbon Changes and Uncertainties 2001-2008. Technical report. U.S. Department of the Interior. http://www.patrickgonzalez.net/images/Gonzalez_and_Battles_California_carbon.pdf (accessed July 2, 2016).
Gonzalez, Patrick. 2015. Climate Change Trends, Vulnerabilities, and Ecosystem Carbon, Redwood National Park, California. Natural Resource Stewardship and Science, U.S. National Park Service, Washington, DC.
Livingston, Amy C. 2014. “Plant Community Responses to Fire Exclusion, Species Invasions, and Restoration in California Woodlands and Grasslands.” Master’s thesis. Arcata, CA: Humboldt State University.
Luellen, M., and S. Provencher. 2010. Lyons Ranches Historic District: Cultural Landscape Inventory, Redwood National Park, National Park Service. Cultural Landscape Inventories. 700005. San Francisco: NPS Pacific West Regional Office.
Monahan, William B., and Nicholas A. Fisichelli. 2014. “Climate Exposure of U.S. National Parks in a New Era of Change.” PLoS ONE 9, no. 7. Accessed May 17, 2016. doi:10.1371/journal.pone.0101302.
Sugihara, Neil G., Lois J. Reed, and James M. Lenihan. 1987. “Vegetation of the Bald Hills Oak Woodlands, Redwood National Park, California.” Madrono 34, no. 3: 193-208.

88
Underwood, Stephen, Leonel Arguello, and Nelson Siefkin. “Restoring Ethnographic Landscapes and Natural Elements in Redwood National Park.” Ecological Restoration 21, no. 4 (December 2003): 278-283.
Varner, J. Morgan et al. 2012. Ecology of the Bald Hills and Little Bald Hills of Redwood National Park: An Assessment of Vegetation Change. Ashland, OR: National Park Service, Klamath Network.
Case Study: Scotty’s Castle Historic District, Death Valley National Park
Barrows, Cameron W., Josh Hoines, Kathleen D. Fleming, Michael S. Vamstad, Michelle Murphy-Mariscal, Kristen Lalumiere, and Mitzi Harding. 2014. “Designing a Sustainable Monitoring Framework for Assessing Impacts of Climate Change at Joshua Tree National Park, USA.” Biodiversity and Conservation 23, no. 13: 3263-285. doi:10.1007/s10531-014-0779-2.
Germano, V. et al. 2012. Bonnie Clare Road: Cultural Landscapes Inventory, Death Valley National Park, National Park Service. Cultural Landscape Inventories. San Francisco: NPS Pacific West Regional Office.
Hankinson, M. and C. Cain. 2011. Scotty’s Castle: Cultural Landscape Inventory, Death Valley National Park, National Park Service. Cultural Landscape Inventories. 725096. San Francisco: NPS Pacific West Regional Office.
Jones, Barclay G. 1986. “Preventing Damage.” Protecting Historic Architecture and Museum Collections from Natural Disasters. Stoneham, MA: Butterworth.
Richman, Angela. 2015. “Every Place Has a Climate Story,” George Wright Forum 32, no. 1: 71-76.
Belnap J. et al. 2008. Monitoring Ecosystem Quality and Function in Arid Settings of the Mojave Desert, Recoverability and Vulnerability of Desert Ecosystems. Scientific Investigations Report 2008-5064. Reston, VA: U.S. Geological Survey.
Bowers, J.C. 1990. Potential Hazards from Floodflows in Grapevine Canyon, Death Valley National Monument, California and Nevada. Water-Resources Investigations Report 89-4063. Sacramento, CA: U.S. Geological Survey.
Davey, C.A. et al. 2007. Weather and Climate Inventory, National Park Service, Mojave Desert Network. Natural Resource Technical Report. NPS/MOJN/NRTR—2007/007. Fort Collins, CO: National Park Service.
Fisichelli, N.A., and P.S. Ziesler. 2015. “Death Valley National Park: How might future warming alter visitation?” Fort Collins, CO: National Park Service, Natural Resource Stewardship & Science.
Mojave Desert Network. 2012. Mojave Desert Network: Climate Change Resource Brief. Boulder City, NV: Mojave Desert Network.
Monahan, W.B., and N.A. Fisichelli. 2014. Recent Climate Change Exposure of Death Valley National Park. Climate Change Resource Brief. National Park Service. https://irma.nps.gov/DataStore/DownloadFile/497045.

89
Case Study: Buckner Homestead Historic District, Lake Chelan National Recreation Area,
North Cascades National Park Complex
Beason, Scott R. et al. 2011. “Landscape response to climate change and its role in infrastructure protection and management at Mount Rainier National Park.” Park Science 28, no. 2: 31-35.Dolan, Susan A. 2009. Fruitful Legacy: A Historic Context of Orchards in the United States. Washington, D.C.: National Park Service.
Dolan. 2012. Historic Orchard and Fruit Tree Stabilization. Washington, D.C.: National Park Service.Drake, C. and K. Kopper. “North Pacific/Columbia Basin, Fire Ecology Annual Report: Calendar Year 2013.” 2211281. National Park Service.
Gonzalez, P. 2015. Climate Change Trends, North Cascades National Park, Ross Lake National Recreation Area, and Lake Chelan National Recreation Area, Washington. Washington, D.C.: National Park Service Climate Change Response Program.
North Cascades National Park Service Complex. 2012. Stehekin River Corridor Implementation Plan Final Environmental Impact Statement. Lake Chelan National Recreation Area.
Owens, Erica, Cortney Cain Gjesfjeld, and Vida Germano. 2016. Buckner Homestead Historic District: Cultural Landscapes Inventory, North Cascades National Park Complex, National Park Service. Cultural Landscape Inventories. San Francisco: NPS Pacific West Regional Office.
Pepper, Charlie, and Susan Dolan. 2014. “Maintained Landscapes in the National Park Service.” George Wright Forum 31, no. 4: 45-52.
Riedel, J.L. 1993. Stehekin River Floodplain mapping project, Lake Chelan National Recreational Area. NPS/PNRNOCA/NRTR-93/011. Seattle, WA: National Park Service.
Riedel. 2008. “White Paper #1: Stehekin River Information Base.” Lake Chelan National Recreation Area. https://parkplanning.nps.gov/showFile.cfm?projectID=20331&MIMEType=application%252Fpdf&filename=White_Paper__1_Stehekin_River_Information_Base.pdf&sfid=148769 (accessed May 2, 2016).
Washington State Department of Natural Resources. 2008. “Stehekin Valley Community Wildfire Protection Plan.” http://file.dnr.wa.gov/publications/rp_burn_cwpp_stehekinvalley.pdf (accessed May 22, 2016).
Case Study: Pu’ukoholā Heiau National Historic Site
Caffrey M. 2014. Sea Level and Storm Trends, Haleakala National Park. National Park Service Climate Change Response Program. Fort Collins, Colorado.
Cogan, D., K. Schulz., D. Benitez, G. Kudray, and A. Ainsworth. 2011. Vegetation inventory project: Pu‘ukoholā Heiau National Historic Site. Natural Resource Report NPS/PUHE/NRR—2011/459. Fort Collins, CO: National Park Service.

90
Gonzalez, Patrick. 2016. Climate Change Trends, Impacts, and Vulnerabilities, Pu`uhonua O Hōnaunau National Historical Park, Hawai‘i. Berkeley, CA: National Park Service, Natural Resource Stewardship and Science.
National Park Service Sustainable Operations and Climate Change Branch. 2015. Coastal Hazards & Climate Change Asset Vulnerability Assessment Protocol Project Description and Methodology. Washington, D.C.: United States Department of the Interior.
Vitousek, S., M. M. Barbee, C. H. Fletcher, B. M. Richmond, and A. S. Genz. 2010. Pu’ukoholā Heiau National Historic Site and Kaloko-Honokōhau Historical Park, Big Island of Hawai’i: Coastal hazard analysis report. Natural Resource Technical Report NPS/NRPC/NRTR/GRD— 2010/387. Fort Collins, CO: National Park Service.
Waite, M. 2009. Mapping and inventory of plants at Pu`ukohola Heiau National Historic Site. Hawaii National Park, HI: National Park Service, Inventory & Monitoring Program.
Case Study: Eugene O’Neill National Historic Site
Berenfeld, Michelle L. 2015. “Planning for Permanent Emergency: ‘Triage’ as a Strategy for Managing Cultural Resources threatened by Climate Change.” George Wright Forum 32, no. 1: 5-12.
Hankinson, M. 2004. Eugene O’Neill National Historic Site: Cultural Landscape Inventory, Eugene O’Neill National Historic Site, National Park Service. Cultural Landscape Inventories. 725018. San Francisco: NPS Pacific West Regional Office.
Jepsen, E.P., and A.G. Murdock. 2002. “Inventory of Native and Non-native Vegetation on John Muir National Historic Site, Eugene O’Neill National Historic Site, and Port Chicago National Monument.” National Park Service, San Francisco Bay Area Network. http://www.sfnps.org/download_product/2606/0 (accessed March 17, 2016)
Monahan, W.B. and N.A. Fisichelli. 2014. Recent Climate Change Exposure of Eugene O’Neill National Historic Site. Climate Change Resource Brief. National Park Service. https://irma.nps.gov/DataStore/DownloadFile/497421
Sullivan, T.J. et al. 2011. Evaluation of the sensitivity of inventory and monitoring national parks to nutrient enrichment effects from atmospheric nitrogen deposition: San Francisco Bay Area Network (SFAN). Natural Resource Report. NPS/NRPC/ARD/NRR—2011/325. Denver, CO: National Park Service, Natural Resource Program Center.
Case Study: East Kamiah/Heart of the Monster, Nez Perce National Historical Park
Bingham, B. et al. 2011. Enhanced monitoring to better address rapid climate change in high-elevation parks: a multi-network strategy. Natural Resource Report. NPS/IMR/NRR—2011/285. Fort Collins, CO: National Park Service, Natural Resource Program Center.

91
Davey, C.A. et al. 2006. Weather and Climate Inventory, National Park Service, Upper Columbia Basin Network. Natural Resource Technical Report. NPS/UCBN/NRTR—2006/012. Fort Collins, CO: National Park Service.
Erixson, J. et al. 2010. Natural resource condition assessment: Nez Perce National Historic Park. Natural Resource Technical Report. NPS/UCBN/NRTR—2010/333. Fort Collins, CO: Natural Resource Program Center.
Fisichelli, N.A. and P.S. Ziesler. 2015. “Nez Perce National Historical Park: How might future warming alter visitation?” Fort Collins, CO: National Park Service, Natural Resource Stewardship & Science.
Jean, C. et al. 2011. High elevation national parks: 2010 climate summary report. Natural Resource Data Series. NPS/GRYN/NRDS—2011/203. Fort Collins, CO: National Park Service, Natural Resource Stewardship and Science.
Monahan, W.B. and N.A. Fisichelli. 2014. Recent Climate Change Exposure of Nez Perce National Historical Park. 2213505. Climate Change Resource Brief. National Park Service.
Owens, E. et al. 2003. East Kamiah/Heart of the Monster: Cultural Landscape Inventory, Nez Perce National Historical Park, National Park Service. Cultural Landscape Inventories. 400162. San Francisco: NPS Pacific West Regional Office.
Climate Change at Nez Perce National Historical Park. 2011. Upper Columbia Basin Network Resource Brief. 2203762. National Park Service.
Geo-spatial (GIS) Data*
Utah Department of Natural Resources. 2013. “Drought Conditions.” http://tiles.arcgis.com/tiles/IZtlGBUe4KTzLOl4/arcgis/rest/services. (June 1, 2016). Using ArcGIS [GIS software]. Version 10.3. ArcGIS Map Services.
U.S. Geological Survey. ArcGIS Map Service. “USGS_Landslides.” http://maps1.arcgisonline.com/ArcGIS/services (June 1, 2016). Using ArcGIS [GIS software]. Version 10.3. ArcGIS Map Services.
United States Department of Agriculture (USDA), United States Forest Service (USFS). “U.S. Forest Service - Wildfire Hazard Potential.” http://maps7.arcgisonline.com/arcgis/services. (June 1, 2016). Using ArcGIS [GIS software]. Version 10.3. ArcGIS Map Services.
Federal Emergency Management Agency. FEMA 100-year flood zone. http://msc.fema.gov/portal/advanceSearch#searchresultsanchor. (June 1, 2016). Using ArcGIS [GIS software]. Version 10.3. ArcGIS Map Services.
National Park Service. 2016. Pacific West Regional Office: Cultural Landscapes. National Park Service, Cultural Landscapes Division. San Francisco, California.
*Maps throughout this document were created using ArcGIS® software by Esri. ArcGIS® and ArcMap™ are the intellectual property of Esri and are used herein under license. Copyright © Esri. All rights reserved. For more information about Esri® software, please visit www.esri.com.

92
Acknowledgements
NPS PACIFIC WEST REGIONAL OFFICEVida Germano, Cultural Landscape Program CoordinatorDavid Louter, PhD., Chief of Cultural ResourcesStanton Enomoto, Climate Change Cultural Adaptation CoordinatorCortney Cain Gjesfjeld, Historical Landscape ArchitectShannon Sawyer, Historical Landscape Architect
NPS NATURAL RESOURCE STEWARDSHIP AND SCIENCEPatrick Gonzalez, Principal Climate Change Scientist
NPS, OFFICE OF THE ASSOCIATE DIRECTOR, CULTURAL RESOURCES, PARTNERSHIPS, AND SCIENCEMarcy Rockman, Climate Change Adaptation Coordinator for Cultural Resources
NPS PARK CULTURAL LANDSCAPES PROGRAMSusan Dolan, Program Manager
REDWOOD NATIONAL PARK, CAKarin Grantham, Joint Chief Resource Management and ScienceLeonel Arguello, Chief of Vegetation ManagementKevin McArdle, Cultural Resource Specialist / Historical Landscape ArchitectJohn McClelland, Fuels/Prescribed Fire TechnicianJames O’Barr, Museum Curator
DEATH VALLEY NATIONAL PARK, CAMary-Blair Davenport, Cultural ResourcesJosh Hoines, Chief of ResourcesGretchen Voeks, Scotty’s Castle Museum Curator
PU’UKOHOLĀ HEIAU NATIONAL HISTORIC SITE, HIElizabeth Gordon, Archeologist, Acting Section 106 CoordinatorAdam Johnson, Chief of Resources, Archeologist
EUGENE O’NEILL NATIONAL HISTORIC SITE, CAPaul Scolari, Chief of Natural and Cultural Resource ManagementKeith Park, Horticulturalist and Preservation Arboriculturalist
NORTH CASCADES NATIONAL PARK, WAKim Kwarsick, Archeologist, Section 106 CoordinatorLaurie Thompson, OrchardistVicki Gempo, Stehekin Natural Resources Program ManagerRoger Christopherson, Wildlife Biologist
NEZ PERCE NATIONAL HISTORICAL PARK, IDDr. Tabitha (Beth) Erdey, Archivist and Research Center DirectorJason Lyon, Integrated Resource Program Manager

93