pacific economic monitor - adb.org · timor-leste 15 economic policy and management 17 ... fiscal...
TRANSCRIPT

Pacific Economic Monitor
The Monitor provides an update of developments in Pacific economies and explores topical policy issues.
July 2010 www.adb.org/pacmonitor
Contents Highlights 1 The economic setting 3 Economic conditions Pacific Islands 5 Papua New Guinea 14 Timor-Leste 15
Economic policy and management 17 Data 28
How to reach us E-mail
Asian Development Bank Pacific Department
Apia Level 6 Central Bank of Samoa Bldg. Apia, Samoa Telephone: +685 34332 Dili ADB–World Bank Bldg., Avenida dos Direitos Humanos, Dili, Timor-Leste Telephone: +670 332 4801 Honiara Mud Alley Honiara, Solomon Islands Telephone: +677 21444 Manila 6 ADB Avenue, Mandaluyong City 1550 Metro Manila, Philippines Telephone: +63 2 632 4444 Nuku'alofa Fatafehi Street Tonga Development Bank Building Nuku’alofa, Tonga Telephone: +676 28290 Port Moresby Level 13 Deloitte Tower Port Moresby, Papua New Guinea Telephone: +675 321 0400/0408 Port Vila Level 5 Reserve Bank of Vanuatu Bldg. Port Vila, Vanuatu Telephone: +678 23610 Suva 5th Floor, Ra Marama Building 91 Gordon Street, Suva, Fiji Islands Telephone: +679 331 8101 Sydney Level 18, One Margaret Street Sydney, NSW 2000, Australia Telephone: +612 8270 9444
Highlights
Projected 2010 economic growth in the Pacific islands remains unchanged at 0.5% overall. An upgrade of projected growth in Solomon Islands, from 2.0% to 3.5%, is offset by downgrades for the Cook Islands, Kiribati, Nauru, Tonga, and Vanuatu. The downgrades reflect weaker than expected tourism growth outside the Fiji Islands and slower than expected implementation of public investment programs. Economic growth is still expected to improve slightly in 2011 to 1.3%.
Stronger than expected growth in Timor-Leste has resulted in an upgrade of projected economic growth in the Pacific region (comprising the Pacific islands, Papua New Guinea, and Timor-Leste) to 4.3% in 2010. Timor-Leste’s growth is driven by a large increase in expected government expenditures.
Inflation projections have been revised upward, reflecting the earlier than expected inflation increases in major trading partners. Inflation is now projected to reach 5.0% in the Pacific islands in 2010, and 5.9% in the Pacific region as a whole.
The post-crisis rise in world oil prices is a primary cause of inflation. Pacific economies are particularly sensitive to high oil prices because they pay more for fuel than other regions. The consequences of high fuel prices are highlighted by international comparisons of the general price levels presented in this Monitor.
Using these comparisons, illustrative estimates of per capita incomes are presented in purchasing power parity terms. They indicate that real incomes in many Pacific economies have been below much of developing Asia.
The potential for better structural policy to reduce costs and hence prices in the Pacific is explored. The good progress made in telecommunications such as in Palau and Tonga, is illustrated by a regional comparison of telecommunication prices. However, telecommunications prices remain very high in some Pacific island economies, a problem that could be addressed by better structural policy.
Strengthened structural policy also holds considerable potential for lowering the price of fuel and electricity. These possibilities are explored as well.
The management of rising revenue from mining and petroleum is an important emerging issue for the region. This issue of the Monitor provides an overview of the sovereign wealth funds proposed for Papua New Guinea (PNG). Recent proposals are well-aligned with best practice standards, and could optimize the benefits of mining and petroleum development in PNG. Possible enhancements to the proposals are discussed, notably the use of funds to address a backlog of infrastructure maintenance and to provide a catalyst for PNG’s public–private partnership program.

HIGHLIGHTS
2
Abbreviations $ US dollars, unless otherwise
stated ABS Australian Bureau of
Statistics ADB Asian Development Bank ADO Asian Development Outlook A$ Australian dollar b budget CPI consumer price index e estimate fas free along side fob free on board FSM Federated States of
Micronesia FY fiscal year GDP gross domestic product IMF International Monetary Fund lhs left hand scale LNG liquefied natural gas m.a. moving average NZL New Zealand p projection PEM Pacific Economic Management PNG Papua New Guinea rhs right hand scale RMI Republic of the Marshall Islands US United States y-o-y year-on-year
Latest Asian Development Bank projections
Real GDP growth
-2 0 2 4 6 8 10 12
Cook Islands
Fiji Islands
Tonga
Nauru
Kiribati
Marshall Islands
FSM
Palau
Samoa
Tuvalu
Solomon Islands
Vanuatu
Papua New Guinea
Timor-Leste
Change in real GDP (%)
-3
0
3
6
9
2007 08 09e 10p 11p
Pacific Region
Pacific Islands
2010 2011
Inflation
0 2 4 6 8 10
Papua New Guinea
Fiji Islands
Solomon Islands
Kiribati
Timor-Leste
Vanuatu
Marshall Islands
Palau
Cook Islands
FSM
Tuvalu
Nauru
Tonga
Samoa
Change in consumer price index (%, annual average)
0
4
8
12
2007 08 09e 10p 11p
Pacific Region
Pacific Islands
2010 2011
Note: Projections are for fiscal years. Regional averages of gross domestic product (GDP) growth and inflation are computed using weights derived from levels of gross national income in current US dollars following the World Bank Atlas method. Averages for the Pacific islands exclude Papua New Guinea and Timor-Leste. Source: ADB estimates.
NotesThis Monitor uses year-on-year percentage changes and 3-month moving averages. The use of year-on-year percentage changes reduces the impact of seasonality. The use of 3-month moving averages reduces the impact of volatility in monthly data.
Fiscal years are the end of June for the Cook Islands, Nauru, Samoa, and Tonga (e.g., FY2010 is the year ended 30 June 2010); the end of September in the Marshall Islands, the Federated States of Micronesia (FSM), and Palau; and end of December elsewhere.
© 2010 Asian Development Bank All rights reserved. Published 2010. Printed in the Philippines. Publication Stock No: RPS090535 Cataloging-In-Publication Data Asian Development Bank. Pacific Economic Monitor, July 2010. Mandaluyong City, Philippines: Asian Development Bank, 2010. This edition of the Monitor was prepared by Emma Ferguson, Vivian Francisco, Joel Hernandez, Milovan Lucich, Dominic Mellor, Adolf Moises Nicolas, Rommel Rabanal, Craig Sugden, Raquel Tabanao, and Laisiasa Tora of the Pacific Department. The views expressed in this publication are those of the authors and do not necessarily reflect the views and policies of the Asian Development Bank (ADB) or its Board of Governors or the governments they represent. ADB does not guarantee the accuracy of the data included in this publication and accepts no responsibility for any consequence of their use. By making any designation of or reference to a particular territory or geographic area, or by using the term “country” in this document, ADB does not intend to make any judgements as to the legal or other status of any territory or area. ADB encourages printing or copying information exclusively for personal and noncommercial use with proper acknowledgement of ADB. Users are restricted from reselling, redistributing, or creating derivative works for commercial purposes without the express, written consent of ADB.

3
THE ECONOMIC SETTING
Developments overseas
Real GDP growth (%, annual)
-3
0
3
6
9
12
2007 08 09e 10p 11p
AustraliaNZLUSDeveloping Asia
e=estimate, p=projection Source: ADB. 2010. Asian Development Outlook 2010. Manila; and IMF. 2010. World Economic Outlook. Washington D.C. (April and July). Pacific Islanders in New Zealand (quarterly)
0
50
100
150
Sep08 Dec Mar09 Jun Sep Dec Mar100
5
10
15
20Employed persons ('000, lhs)Unemployment rate (%, rhs)
Source: Statistics New Zealand. Inflation (y-o-y % change in CPI; quarterly)
0
2
4
6
Sep07 Mar08 Sep Mar09 Sep Mar10
Australia
NZL
CPI= consumer price index. Sources: ABS and Reserve Bank of New Zealand.
This section draws on ADB. 2010. Asia Development Outlook 2010. Manila and latest IMF. 2010. World Economic Outlook, Washington D.C. (April and July). Lead author: PEM Research Team
Global recovery underway, with emerging risks
The world economy is expected to make a solid recovery from last year’s contraction and achieve growth of 4.6% in 2010, according to the International Monetary Fund’s (IMF) World Economic Outlook Update. This projection hinges on achieving an orderly withdrawal of accommodative fiscal and monetary policies to begin bringing down public debt to more sustainable levels, and avoiding sovereign debt contagion. Advanced economies are projected to grow by only 2.6%. Emerging and developing economies are poised to lead the recovery; the latest Asian Development Bank (ADB) projection for growth in developing Asia is 7.5%.
Large budget deficits in developed economies are adding to the risk of sovereign debt defaults in some European economies. This is contributing to uncertainty and volatility in financial markets, and poses a key risk to medium-term growth prospects.
Major stock market indexes have recently retreated to multi-month lows over uncertainty about sovereign debt markets and possible contagion effects.
Unemployment is tapering off, but remains high
The New Zealand unemployment rate fell sharply to 6.0% in the March quarter 2010, down from 7.1% in the December quarter 2009. However, unemployment among Pacific islanders in New Zealand remains more than twice the average, at 13.3%.
The Australian unemployment rate edged slightly lower in the June quarter 2010, but remained at a moderately high 5.1%
The United States (US) unemployment rate eased to 9.5% in June 2010, down slightly from January levels. US manufacturing overtime hours, a leading indicator for labor demand, fell slightly to 2.9 hours in June 2010.
Inflation rising overseas
Inflation is starting to increase again, lifted by rising world oil and commodity prices. The Reserve Bank of Australia raised its benchmark interest rate to 4.5% in May 2010—its sixth interest rate hike since October 2009—to curb inflationary pressures. Australia’s inflation rate reached 2.9% in the March quarter 2010.
The Reserve Bank of New Zealand raised its interest rate to 2.75% in June to counter rising inflation, the first increase in 3 years.
Inflation is also trending upward in Indonesia, Singapore, and much of developing Asia.
4
THE ECONOMIC SETTING
A view from neighboring economies Rising commodity prices to help exporters
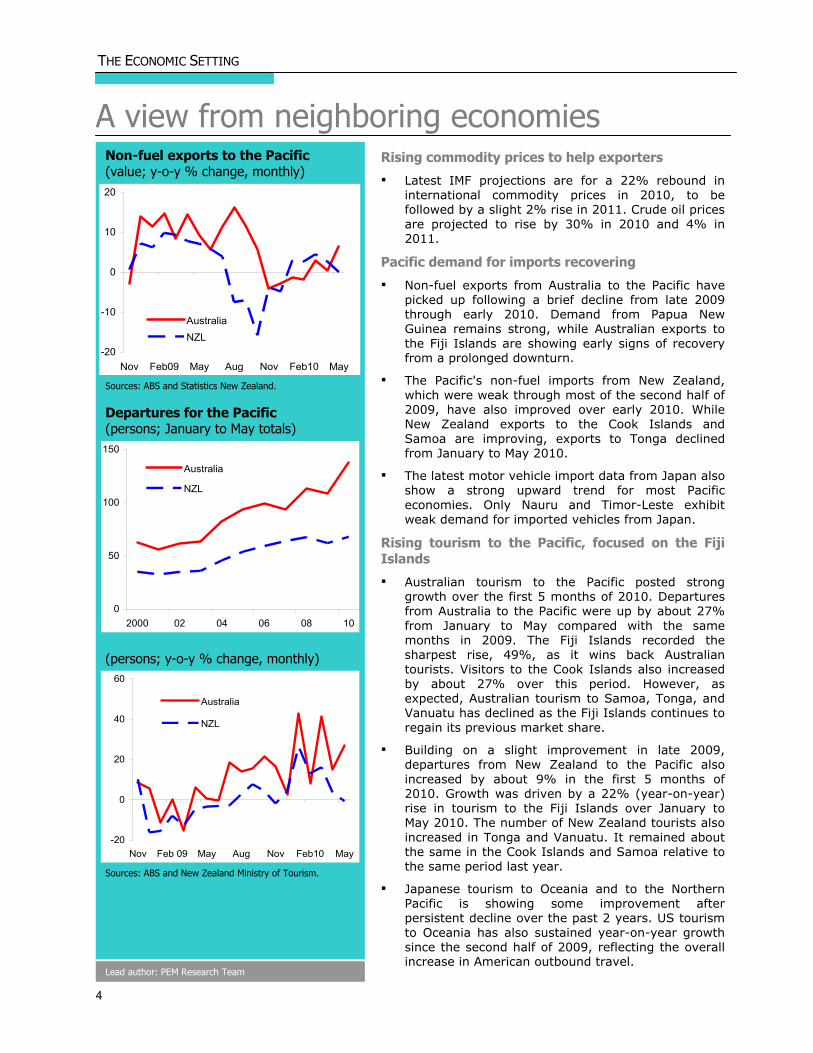
Latest IMF projections are for a 22% rebound in international commodity prices in 2010, to be followed by a slight 2% rise in 2011. Crude oil prices are projected to rise by 30% in 2010 and 4% in 2011.
Pacific demand for imports recovering
Non-fuel exports from Australia to the Pacific have picked up following a brief decline from late 2009 through early 2010. Demand from Papua New Guinea remains strong, while Australian exports to the Fiji Islands are showing early signs of recovery from a prolonged downturn.
The Pacific's non-fuel imports from New Zealand, which were weak through most of the second half of 2009, have also improved over early 2010. While New Zealand exports to the Cook Islands and Samoa are improving, exports to Tonga declined from January to May 2010.
The latest motor vehicle import data from Japan also show a strong upward trend for most Pacific economies. Only Nauru and Timor-Leste exhibit weak demand for imported vehicles from Japan.
Rising tourism to the Pacific, focused on the Fiji Islands
Australian tourism to the Pacific posted strong growth over the first 5 months of 2010. Departures from Australia to the Pacific were up by about 27% from January to May compared with the same months in 2009. The Fiji Islands recorded the sharpest rise, 49%, as it wins back Australian tourists. Visitors to the Cook Islands also increased by about 27% over this period. However, as expected, Australian tourism to Samoa, Tonga, and Vanuatu has declined as the Fiji Islands continues to regain its previous market share.
Building on a slight improvement in late 2009, departures from New Zealand to the Pacific also increased by about 9% in the first 5 months of 2010. Growth was driven by a 22% (year-on-year) rise in tourism to the Fiji Islands over January to May 2010. The number of New Zealand tourists also increased in Tonga and Vanuatu. It remained about the same in the Cook Islands and Samoa relative to the same period last year.
Japanese tourism to Oceania and to the Northern Pacific is showing some improvement after persistent decline over the past 2 years. US tourism to Oceania has also sustained year-on-year growth since the second half of 2009, reflecting the overall increase in American outbound travel.
Non-fuel exports to the Pacific (value; y-o-y % change, monthly)
-20
-10
0
10
20
Nov Feb09 May Aug Nov Feb10 May
AustraliaNZL
Sources: ABS and Statistics New Zealand. Departures for the Pacific (persons; January to May totals)
0
50
100
150
2000 02 04 06 08 10
Australia
NZL
(persons; y-o-y % change, monthly)
-20
0
20
40
60
Nov Feb 09 May Aug Nov Feb10 May
Australia
NZL
Sources: ABS and New Zealand Ministry of Tourism.
Lead author: PEM Research Team
5
ECONOMIC CONDITIONS
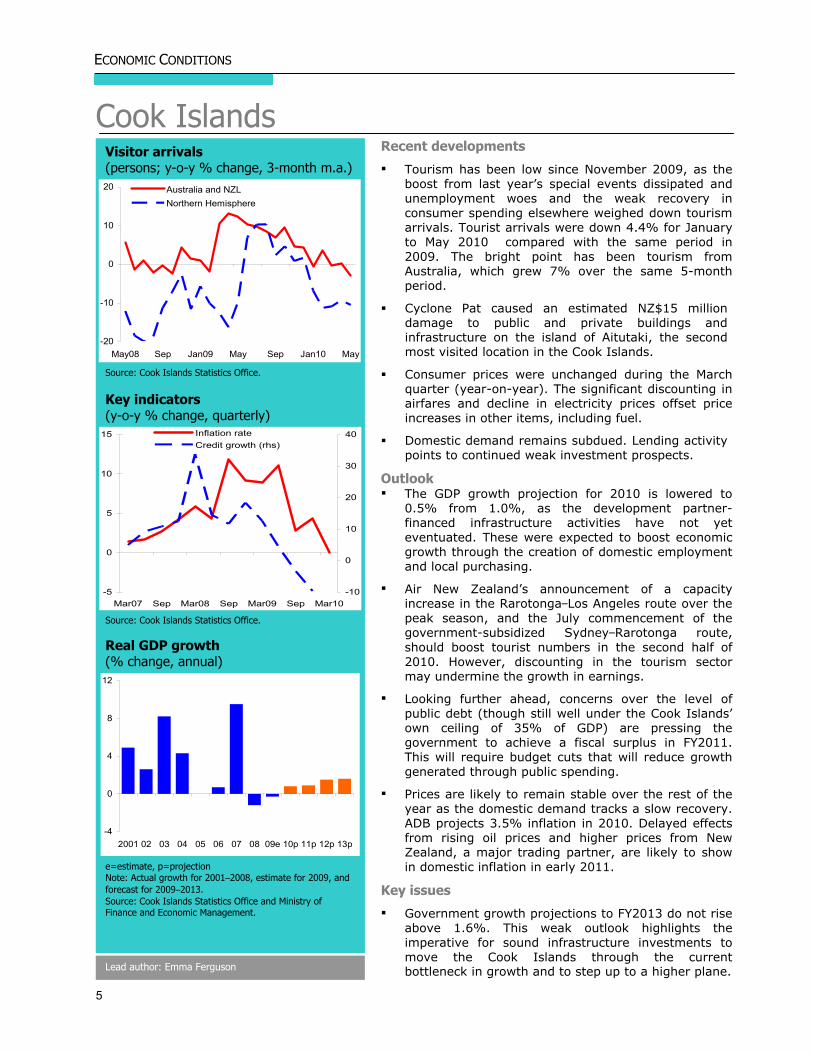
Cook Islands Visitor arrivals (persons; y-o-y % change, 3-month m.a.)
-20
-10
0
10
20
May08 Sep Jan09 May Sep Jan10 May
Australia and NZLNorthern Hemisphere
Source: Cook Islands Statistics Office. Key indicators (y-o-y % change, quarterly)
-5
0
5
10
15
Mar07 Sep Mar08 Sep Mar09 Sep Mar10-10
0
10
20
30
40Inflation rateCredit growth (rhs)
Source: Cook Islands Statistics Office.
Real GDP growth (% change, annual)
-4
0
4
8
12
2001 02 03 04 05 06 07 08 09e 10p 11p 12p 13p
e=estimate, p=projection Note: Actual growth for 2001–2008, estimate for 2009, and forecast for 2009–2013. Source: Cook Islands Statistics Office and Ministry of Finance and Economic Management.
Recent developments
Tourism has been low since November 2009, as the boost from last year’s special events dissipated and unemployment woes and the weak recovery in consumer spending elsewhere weighed down tourism arrivals. Tourist arrivals were down 4.4% for January to May 2010 compared with the same period in 2009. The bright point has been tourism from Australia, which grew 7% over the same 5-month period.
Cyclone Pat caused an estimated NZ$15 million damage to public and private buildings and infrastructure on the island of Aitutaki, the second most visited location in the Cook Islands.
Consumer prices were unchanged during the March quarter (year-on-year). The significant discounting in airfares and decline in electricity prices offset price increases in other items, including fuel.
Domestic demand remains subdued. Lending activity points to continued weak investment prospects.
Outlook The GDP growth projection for 2010 is lowered to
0.5% from 1.0%, as the development partner-financed infrastructure activities have not yet eventuated. These were expected to boost economic growth through the creation of domestic employment and local purchasing.
Air New Zealand’s announcement of a capacity increase in the Rarotonga–Los Angeles route over the peak season, and the July commencement of the government-subsidized Sydney–Rarotonga route, should boost tourist numbers in the second half of 2010. However, discounting in the tourism sector may undermine the growth in earnings.
Looking further ahead, concerns over the level of public debt (though still well under the Cook Islands’ own ceiling of 35% of GDP) are pressing the government to achieve a fiscal surplus in FY2011. This will require budget cuts that will reduce growth generated through public spending.
Prices are likely to remain stable over the rest of the year as the domestic demand tracks a slow recovery. ADB projects 3.5% inflation in 2010. Delayed effects from rising oil prices and higher prices from New Zealand, a major trading partner, are likely to show in domestic inflation in early 2011.
Key issues
Government growth projections to FY2013 do not rise above 1.6%. This weak outlook highlights the imperative for sound infrastructure investments to move the Cook Islands through the current bottleneck in growth and to step up to a higher plane. Lead author: Emma Ferguson

6
ECONOMIC CONDITIONS
Fiji Islands Resident departures to Fiji Islands
(‘000 persons; monthly)
0
10
20
30
Nov Feb09 May Aug Nov Feb10 May
From Australia
From NZL
Source: ABS and New Zealand Ministry of Tourism. Monetary indicators (y-o-y % change, monthly)
-20
-10
0
10
20
Nov Feb09 May Aug Nov Feb10 May
Inflation Broad money Credit growth
Source: Reserve Bank of Fiji. Foreign reserves (months of import cover, quarterly)
0
1
2
3
4
Jun07 Dec Jun08 Dec Jun09 Dec Jun10
Source: Reserve Bank of Fiji.
Recent developments and outlook
The economy contracted by 2.2% in 2009, less than initially estimated. ADB still expects the economy to contract by 0.5% in 2010 on the back of delayed land tenure and sugar industry reforms, sluggish private credit growth, and the adverse impacts of rising inflation.
Inflation soared in the first 5 months of 2010 due to the removal of some price controls, higher fuel prices, and increased liquidity in the banking system. The Reserve Bank of Fiji raised the reserve requirement, a sign of monetary tightening ahead. This is inopportune, as private sector credit is declining.
A revised 2010 budget was released in late June. The revisions accommodate the expenditure demands following the cyclones of early 2010 and ongoing termite infestation. The revisions were conservative, with no major shifts in policy direction. Tourism and agriculture are seen as drivers of economic growth, and import substitution and export promotion remain front and center for government. The outlook for the macroeconomic framework remains optimistic and the deficit target remains at 3.5% of GDP.
The official 2010 growth forecast of 1.8% depends heavily on increases in sugar earnings and tourism. The Fiji Sugar Corporation reports cane production is down from 2009, and there have been some initial delays in sugarcane crushing with the extensive mill upgrades, to improve mill operations. While in the first 4 months of 2010 tourist numbers were up 22.7% over 2009 (which was far below average due to the impact of severe flooding), this is not expected to be maintained. Heavy discounting remains in place, reducing the economic benefits of increased arrivals.
Key issues
The Fiji Islands faces a large external financing gap in the near term. The $150 million sovereign bond matures in late 2011, and revenues from export, tourism, and workers’ remittances remain weak.
The revised budget does not provide the degree of fiscal consolidation that conditions suggest may be required, and underlying fiscal risk remains. Actions on the revenue side are particularly weak, and it is not clear if those actions will provide for an overall gain. Any further unanticipated expenditures, or a revenue slowdown, would place the achievement of the planned deficit in doubt.
Target expenditure savings rely on continued non-filling of vacant government positions and across-the-board operational cuts. Both have negative implications for the government’s already stretched capacity to provide services.
Lead author: Emma Ferguson

7
ECONOMIC CONDITIONS
Kiribati
Nauru
Growth expectations in 2010 have been lowered to 0.5% from 0.8%. Remittances continue to decline, and demand for copra from major consumers, such as the People’s Republic of China and India, is lower than expected. The 2010 inflation forecast is likewise revised down to 5.4% from 5.9% due to the weak domestic demand.
Looking further ahead, the projected recovery in the world production of copra substitutes, such as soybean oil, has tempered expectations of higher copra prices. Despite the recovery in global trade, the number of i-Kiribati seafarers is expected to decline, which will further undermine remittance flows.
Returns from offshore investments held in the Revenue Equalization Reserve Fund (RERF), which underwrites recurrent expenditure, are likely to fall this year as international capital markets consolidate.
The government has adopted measures to reduce the budget deficit, lessening the pressure on the RERF. This will improve revenue compliance measures and reduce overall expenditure in the 2010 budget (by A$2 million over 2009). While these actions are fiscally sound, they are also dampening economic activity.
Lead authors: Emma Ferguson and Laiassa Tora.
Real GDP growth and inflation (%, annual)
-3
0
3
6
9
12
05 06 07 08 09e 10p 11p
GDP growth rate
Inflation rate
e=estimate, p=projection Source: Kiribati National Statistics Office.
Real GDP growth (%, annual)
-30
-20
-10
0
10
FY2005 FY06 FY07 FY08 FY09e FY10p FY11p
%
e=estimate, FY=fiscal year, p=projection Source: ADB estimates.
Lead author: Milovan Lucich
GDP projections for FY2010 have been downgraded to 0%, as damage to the port mooring buoys has still not been fully repaired. This, together with more recent damage to the cantilevers, has severely restricted phosphate exports.
Nauru recently received A$10 million in aid from Russia following the decision to recognize the republics of Abkhazia and South Ossetia. This money will largely be used to repair the mooring facilities. Together with an ongoing recovery in phosphate demand, this should support a return to positive growth in 2011.
The recent performance of the Nauruan economy has highlighted the poor state of the country's economic infrastructure assets and the effect this has on growth prospects. Obsolete and worn-out equipment is only one of the problems; many individual service providers within infrastructure subsectors are performing poorly. Performance contracts and other typical accountability measures (such as governance arrangements to measure actual to agreed outcomes) cannot be used in Nauru because the policy and legal framework within which state-owned enterprises (SOEs) operate either does not exist (as in the case of the utilities authority) or lacks sufficient requirements for monitoring and evaluation.
Lead author: Laisiasa Tora
8
ECONOMIC CONDITIONS
Northern Pacific States
Federated States of Micronesia
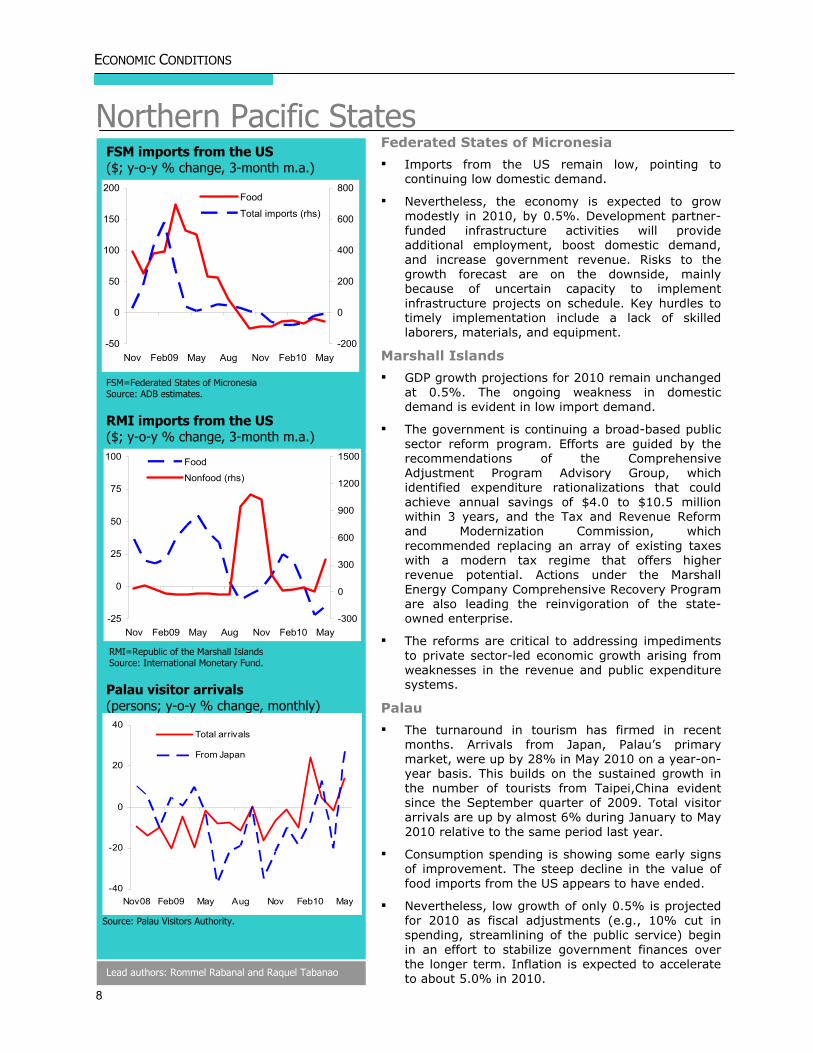
Imports from the US remain low, pointing to continuing low domestic demand.
Nevertheless, the economy is expected to grow modestly in 2010, by 0.5%. Development partner-funded infrastructure activities will provide additional employment, boost domestic demand, and increase government revenue. Risks to the growth forecast are on the downside, mainly because of uncertain capacity to implement infrastructure projects on schedule. Key hurdles to timely implementation include a lack of skilled laborers, materials, and equipment.
Marshall Islands
GDP growth projections for 2010 remain unchanged at 0.5%. The ongoing weakness in domestic demand is evident in low import demand.
The government is continuing a broad-based public sector reform program. Efforts are guided by the recommendations of the Comprehensive Adjustment Program Advisory Group, which identified expenditure rationalizations that could achieve annual savings of $4.0 to $10.5 million within 3 years, and the Tax and Revenue Reform and Modernization Commission, which recommended replacing an array of existing taxes with a modern tax regime that offers higher revenue potential. Actions under the Marshall Energy Company Comprehensive Recovery Program are also leading the reinvigoration of the state-owned enterprise.
The reforms are critical to addressing impediments to private sector-led economic growth arising from weaknesses in the revenue and public expenditure systems.
Palau
The turnaround in tourism has firmed in recent months. Arrivals from Japan, Palau’s primary market, were up by 28% in May 2010 on a year-on-year basis. This builds on the sustained growth in the number of tourists from Taipei,China evident since the September quarter of 2009. Total visitor arrivals are up by almost 6% during January to May 2010 relative to the same period last year.
Consumption spending is showing some early signs of improvement. The steep decline in the value of food imports from the US appears to have ended.
Nevertheless, low growth of only 0.5% is projected for 2010 as fiscal adjustments (e.g., 10% cut in spending, streamlining of the public service) begin in an effort to stabilize government finances over the longer term. Inflation is expected to accelerate to about 5.0% in 2010.
FSM imports from the US ($; y-o-y % change, 3-month m.a.)
-50
0
50
100
150
200
Nov Feb09 May Aug Nov Feb10 May-200
0
200
400
600
800Food
Total imports (rhs)
FSM=Federated States of Micronesia Source: ADB estimates. RMI imports from the US ($; y-o-y % change, 3-month m.a.)
-25
0
25
50
75
100
Nov Feb09 May Aug Nov Feb10 May-300
0
300
600
900
1200
1500Food
Nonfood (rhs)
RMI=Republic of the Marshall Islands Source: International Monetary Fund. Palau visitor arrivals (persons; y-o-y % change, monthly)
-40
-20
0
20
40
Nov08 Feb09 May Aug Nov Feb10 May
Total arrivals
From Japan
Source: Palau Visitors Authority.
Lead authors: Rommel Rabanal and Raquel Tabanao

9
ECONOMIC CONDITIONS
Samoa
Recent developments and outlook
The economy grew 0.7% in the December quarter of 2009 after 5 consecutive quarters of negative growth. Growth is picking up in manufacturing after several quarters of marked contractions, while other sectors (fisheries, public administration, finance, and transportation) posted solid growth throughout the year. Post-tsunami reconstruction is progressing on schedule. ADB’s outlook remains at 0.5% growth for 2010.
The government plans to maintain an expansionary policy in FY2011 through the continuation of tsunami-related reconstruction and increased spending in education, health, and agriculture. The budget deficit is set to reach 9.4% in FY2011 from 7.6% in FY2010, the financing of which will require further borrowing.
Deflation returned with a 0.1% year-on-year decline in the consumer price index (CPI) in April. However, inflationary pressures are expected over 2010 as the effects of higher fuel prices and the higher inflation in New Zealand feed through the economy. ADB expects inflation to be just 1.0% in 2010.
Visitor arrivals for the first 4 months of 2010 were down 4.5% year-on-year. Tourism receipts have been below the previous year’s levels in every month but one since September 2009. Nonetheless, real tourism receipts are being helped by firm prices. Departures from New Zealand to Samoa was flat in January to May, while Australian tourist number declined by 5.6%.
Real private remittances have trended downward year-on-year since January. It appears that remittances, like travel of friends and relatives, were brought forward in late 2009 to assist family members affected by the tsunami. Weak labor markets in source economies are likely to sustain these trends in both remittances and tourism.
Key issues
The post-tsunami increases in grants, remittances and visitor arrivals appear to have ended. Relatively strong results for these indicators in December quarter of 2009 were followed by weak performance in March quarter of 2010, which points to slow growth in 2010.
The FY2011 budget strategy statement acknowledges that fiscal consolidation may not be achievable until after FY2013 due to ongoing post-tsunami reconstruction. The macroeconomic framework shows public debt peaking at 52% of GDP in FY2013 (in net present value terms). The government has not yet released the details of how the deficit will be contained and debt returned to below the threshold target of 40% of GDP. Lead author: Emma Ferguson
Real GDP and manufacturing growth (y-o-y % change, quarterly)
-8
-4
0
4
8
12
2007Q1 Q3 2008Q1 Q3 2009Q1 Q3-40
-20
0
20
40GDP growth (lhs)
Manufacturing (rhs)
Source: Samoa Department of Statistics Remittances (tala million, 3-month m.a.)
-40
-20
0
20
40
60
Mar08 Jul Nov Mar09 Jul Nov Mar10
Nominal terms Real terms
Note: Real values derived using consumer price index. Source: Central Bank of Samoa.
Tourism
(y-o-y % change, 3-month m.a.)
-20
-10
0
10
20
Oct Jan09 Apr Jul Oct Jan10 Apr
Visitor arrivals (persons)
Tourism receipts (real)
Note: Real values derived using tourism price index. Source: Central Bank of Samoa.

10
ECONOMIC CONDITIONS
Solomon Islands
Recent developments
The GDP growth projection for 2010 has been revised up to 3.5%, reflecting a stronger than expected recovery in commodities. Logging, cocoa, fish, and palm oil all experienced higher production and exports in the first 5 months of 2010, assisted by modest increases in world market prices for most of these commodities.
The current recovery has not been evenly spread across all sectors. A recent ADB business expectations survey showed that 61% of businesses surveyed in June reported flat or declining sales compared with the same quarter the previous year. However, 56% of businesses expect sales to improve over the next 3 months.
Reflecting the uneven nature of the recovery, government finances continue to be strained. Revenue collections were short of budget up to the end of May. The cumulative revenue shortfall to the end of May was around SI$26.3 million. However, there has been substantial underspending, mainly in development expenditures. Payrolls, however, have been around 10% over budgeted levels. The total deficit at end May was SI$25.2 million.
Key issues
Solomon Islands initiated a wide-ranging policy program to counter the effects of the global economic crisis and to reduce its dependency on logging and foreign aid. Development partners are actively supporting the program, including through the provision of targeted budget support. In March 2010, ADB approved a 2-year Economic Recovery Support Program. This supports government efforts to improve economic and fiscal management. A $5 million grant is provided with the program, with a second grant scheduled for release in early 2011. Australia and New Zealand provided an additional $4.5 million in budget support in early 2010, and the European Commission may provide $15 million before the end of 2010. The IMF also approved a standby arrangement in June 2010.
National elections will be held in early August 2010. The new government will face significant challenges as economic prospects remain uncertain due to the medium-term decline in logging. It will be important for the incoming government to develop and implement programs and policies that continue to place the economy on a sustainable growth path. Priorities include improving infrastructure, such as through contracting out of maintenance and rehabilitation and the use of public–private partnerships; opening the telecommunications industry to competition; reforming SOEs; simplifying the licensing and tax systems; and improving access to land.
Production of key commodities (% change, May 2010 year-to-date)
‐20% 0% 20% 40%
Logs
Fish
Copra
Palm Oil
Cocoa
Source: Central Bank of Solomon Islands; ADB estimate.
ADB Solomon Islands Business Expectations Survey (June 2010)
Were sales over the last 3 months up on last year?
0%
10%
20%
30%
40%
50%
60%
70%
No Yes Other
Do you expect sales to improve over
the next 3 months?
0%
10%
20%
30%
40%
50%
60%
No Yes Other
Sources: ADB Business Expectations Survey.
Lead author: Milovan Lucich

11
ECONOMIC CONDITIONS
Tonga
Private sector credit (y-o-y % change, monthly)
-30
-15
0
15
30
Nov Feb09 May Aug Nov Feb10 May
Private sector credit
To households
To business
Source: National Reserve Bank of Tonga. Remittances and tourism receipts (pa’anga; y-o-y % change, 3-month m.a.)
-40
0
40
80
Nov Feb09 May Aug Nov Feb10 May
Real tourism receipts (rhs)
Real remittance
Sources: National Reserve Bank of Tonga and Tonga Ministry of Finance and National Planning. Inflation and domestic credit (y-o-y % change, monthly)
-10
-5
0
5
10
15
Nov Feb09 May Aug Nov Feb10 May
InflationMoney supplyImported inflation
Source: National Reserve Bank of Tonga.
Lead author: Laisiasa Tora
Key developments
ADB projects the economy to contract by 0.4% in 2010, down from earlier expectations for a slight expansion. The expected contraction is due to delays in public infrastructure spending, and concomitant weakness in remittances, tourism receipts, and domestic demand.
Continued high unemployment in major source markets such as the US means that remittance flows to Tonga will continue to decline. Recorded remittances in the 12 months to May 2010 were still 12% below the same period last year.
Tourist arrivals fell by 8.5% in March quarter 2010 compared with the same period in 2009. Consequently, earnings from tourism fell by 14% in May on a year-on-year basis, following a decline of 11% the previous month.
Private sector credit continues to contract, as consolidation in the banking sector was followed by more stringent lending conditions in the latter half of 2009. Commercial banks are expected to maintain this stance over the next 6 to 12 months. The contraction in credit to businesses has been sharper and deeper compared with that of households due to the excessive credit growth that occurred over most of 2008.
Inflation has been rising since November 2009, reaching 4.6% in April, mainly due to higher oil prices. Inflation is expected to average about 3.5% in 2010 as oil prices stabilize later in the year.
Key issues
Significant reductions in public debt are needed to relieve pressure on a worsening fiscal position. Key debt sustainability indicators such as the ratio of net present value of external debt to GDP, and the debt-to-exports ratio, indicate that Tonga’s debt levels have exceeded target thresholds (by 11% and 26%, respectively). The government intends to reduce the debt by prioritizing the achievement of primary surpluses in FY2012 and FY2013.
Efforts to strengthen public financial management are even more critical given the limited fiscal space envisaged over the medium term as government implements its fiscal consolidation program. Moreover, momentum must be sustained on reforms in SOEs, the business regulatory environment, and strategic economic management (encompassing planning and budgeting) for benefits to eventuate.

12
ECONOMIC CONDITIONS
Tuvalu
Vanuatu
Visitor arrivals (persons; y-o-y % change, 3-month m.a.)
-10
0
10
20
30
May Sep Jan09 May Sep Jan10 May
Source: Vanuatu National Statistics Office.
Recent developments
There was a reversal in total tourist arrivals in January to May 2010. After growing by 10.8% in 2009, the number of monthly visitors contracted on the average by 6.0% as arrivals from Australia slowed.
Weak domestic demand is evident in slower growth in total import demand and a sustained decline in private sector credit growth. Imports from Australia contracted by 5.9% in the March quarter. The size of monthly contractions has declined, however, indicating the potential for stabilization in coming months.
Sluggish growth in private sector credit continued from 2009 to May 2010. Value-added tax receipts have also declined, with January and February figures below their 2009 levels.
Recent developments and outlook
Economic growth projection for 2010 remains at 1.6% as the expected flow-on effects of the increase in government expenditure—ostensibly to generate short-term growth—are dampened by the inflationary impacts of rising oil prices. Inflation is expected to rise to 3.5% in 2010.
Distributions from the Tuvalu Trust Fund to the government, which fund about 15% of the recurrent budget, are unlikely in 2010. In the second half of 2009, the market value of the Tuvalu Trust Fund increased by around 4.4% but remained below the maintained value (a condition for distributions).
Remittances from seafarers have been declining for some years. The recent economic slowdown exacerbated this trend in 2009. The underlying problem of weakening demand from shipping agencies remains.
The 2010 budget, including supplementary appropriations, projects a deficit of A$10.8 million based on a 14.1% expenditure increase (A$4.4 million), accompanied by a 13% revenue decrease (A$3.8 million). Further deficits of A$6.4 million are projected for 2011 and A$7.0 million for 2012.
Key issue
Without expenditure cuts or other remedial action, the government’s cash and Consolidated Investment Fund reserves will likely be exhausted in 2011. It is critical that the government adopt a prudent fiscal stance and improve the quality of its decision making to achieve macroeconomic and fiscal stability over the medium term.
The lead author of the section is…
Budget balance (% of GDP, annual)
-40
-30
-20
-10
0
09e 10p 11p 12p
e=estimate, p=projection Source: Tuvalu Trust Fund Advisory Committee, 2010 First Half Report, May 2010.
Imports from Australia (tons; y-o-y % change, 3-month m.a.)
-200
-100
0
100
200
300
400
May08 Sep Jan09 May Sep Jan10 May
Chicken
Flour
Source: ABS.
Lead author: Laisiasa Tora

13
ECONOMIC CONDITIONS
Vanuatu
Inflation stabilized at 2.8% during the March quarter.
Outlook
Tourism’s contribution to growth is expected to decline in 2010 due to vigorous marketing and heavy discounting by the Fiji Islands and the Cook Islands. This may require Vanuatu to offer competing discounts.
The projected 2010 GDP growth has been revised down to 4.0% from 4.6%, primarily because of the weaker than expected performance in tourism, which contributes approximately 20% of economic output.
Inflation is likely to exceed both the government's target maximum of 4.0% and the 2009 rate of 4.5%. The projected inflation rate for 2010 remains at 5.0%. Key upside risks to inflation include the recent imposition of excise taxes on drinks and tobacco and imported inflation due to increasing international commodity prices.
Key issues
While Vanuatu's recent growth has been impressive, further reforms are required to sustain medium-term growth. In particular, there is a strong need to improve the performance and accountability of SOEs so that they operate efficiently and allow room for the private sector.
SOEs absorb large amounts of scarce capital on which they provide very low returns, divert government resources from vital social investments in health and education, and drive up the costs of doing business where they are the sole service providers. While poor financial reporting practices make it difficult to accurately estimate the extent of the fiscal strain represented by SOEs, a recent audit of one of the larger SOEs revealed that its accumulated losses totaled $20 million. Moreover, recent court rulings have affirmed that under the 2006 Public Finance and Economic Management Act, the government can be considered a guarantor of the debts of SOEs. Vanuatu has 20 SOEs, 14 of which are engaged in commercial activities (6 perform various noncommercial functions for government). Of the 14, the central government is the majority owner of 9 and a minority shareholder in the remainder. Only 4 of the 14 commercial SOEs have reported producing commercially acceptable returns in the past 5 years.
Key indicators (%, quarterly)
0
2
4
6
8
Mar07 Sep Mar08 Sep Mar07 Sep Mar100
10
20
30
40
50
Inflation rate
Credit growth
Sources: Vanuatu National Statistics Office and Reserve Bank of Vanuatu.
Imports (value; y-o-y % change, quarterly)
-40
-20
0
20
40
60
Mar07 Sep Mar08 Sep Mar09 Sep Mar10
Total imports
Imports fromAustralia
Sources: ABS and Reserve Bank of Vanuatu.
Value-added tax revenue (million vatu, quarterly)
0
400
800
1200
1600
Q1 '08 Q2 Q3 Q4 Q1 '09 Q2 Q3 Q4 Q1 '10
Source: Reserve Bank of Vanuatu.
Lead author: Milovan Lucich

ECONOMIC CONDITIONS
14
Papua New Guinea Agricultural and mineral exports (index: Dec 2003=100, quarterly)
0
100
200
300
400
Jun04
Dec04
Jun05
Dec05
Jun06
Dec06
Jun07
Dec07
Jun08
Dec08
Jun09
Dec09
Jun10
Volume (agriculture and log)
Price (agriculture and log)
Volume (mining and oil)
Price (mining and oil)
Source: Bank of PNG; ADB estimates.
Cumulative trust fund spending (million kina, quarterly)
0
500
1000
1500
2000
2500
Q1 Q2 Q3 Q4
2008 2009
Source: PNG Ministry of Treasury.
Inflation (year-average % change, quarterly)
0
3
6
9
12
Jun08 Dec Jun09 Dec Jun10 Dec10p Jun11p Dec11p
p=projection Source: Bank of PNG; ADB estimates.
Recent developments
The joint Treasury and Bank of PNG Sovereign Wealth Fund Working Group, established in March 2010 was scheduled to submit a report to the National Executive Council at the end of June 2010. The report outlined suggestions on how best to implement the sovereign wealth fund proposed by the government. (Key policy issues are explored on pages 25–27).
PNG merchandise exports have recovered. The US dollar value of exports increased by 1% over the 12 months to June 2010, after falling by 24% during 2009. The weighted kina export price rebounded by 38% over the 12 months to June 2010 (9% for the non-mineral sector and 41% for the mineral sector).
However, in real terms, government revenues were down by 18% in the 12 months to March 2010. Taxes on income and profits remain subdued, particularly in the mineral sector. However, real public expenditures increased by about 2% over the same period, supported by K2.4 billion trust fund drawdowns over 2009 (equivalent to 11% of GDP).
Despite rising government expenditure, annual inflation trended down to 5.6% on a year-average basis to June 2010.
In July 2010, the Bank of PNG reconfirmed its commitment to a policy indicator rate of 7% for the seventh consecutive month.
Outlook
ADB’s growth projections for PNG remain unchanged at 5.5% in 2010 and 7.7% in 2011. As anticipated in the Asian Development Outlook 2010, there were delays in the construction phase of the liquefied natural gas (LNG) project due to land access and compensation issues and a shortage of skilled labor. These delays are shifting the growth contribution of the project into 2011.
Inflation is anticipated to remain relatively high at 7.1% in 2010 and 7.7% in 2011. Price pressure is being generated from high levels of private sector activity as well as the delayed impact of rapid trust fund expenditures by the public sector in 2009.
Domestic risks to the 2010 projections remain slightly on the upside. GDP could be slightly higher than forecast if landowner compensation disputes related to the LNG project can be resolved quickly, and if project developers are able to secure the necessary equipment, material, and skilled labor inputs to ramp up plant construction. This may, however, be at the expense of growth in the non-mineral sector. Lead author: Dominic Mellor

ECONOMIC CONDITIONS
15
Timor-Leste Real GDP growth
(%, annual)
0
5
10
15
2007 08 09e 10p 11p
e=estimate, p=projection Sources: Timor-Leste Ministry of Finance, National Directorate of Macroeconomics, and National Directorate of Statistics.
Own-funded government expenditure ($ million, quarterly)
0
100
200
300
Mar07 Mar08 Mar09 Mar10
Sources: Timor-Leste Ministry of Finance, National Directorate of Statistics. Quarterly Statistical Indicators. various quarters.
Own-funded government expenditure (by category; $ million, annual)
0
100
200
300
Wages andsalaries
Goods andservices
Transfers Capital
08
09
10b
b=budget, e=estimate, p=projection Note: Own-funded government expenditure shown Sources: Timor-Leste Ministry of Finance, General Budget of State, various years.
Recent developments
Official estimates of economic growth for 2009 have been upgraded from 6%–8% to 12.2%. The upgrade is driven by a higher than expected level of own-funded government expenditure. Improved agricultural performance, a result of the spread of higher yield seeds and increased use of key inputs such as fertilizer and tractors, has also accelerated growth.
Only 45% of the own-funded portion of the 2009 budget had been recorded as spent at the end of the September quarter 2009. The low rate of budget execution underpinned official preliminary estimates of decline in own-funded expenditure in 2009. A 9.5% decline, from $553 million in 2008 to $501 million, was expected in 2009. There was, however, a surge in expenditure in December quarter 2009. About 89% of the own-funded portion of the 2009 budget was ultimately spent, and own-funded expenditure rose by 9.3% to $604 million in 2009.
Most of the additional expenditure was on capital expenditure and wages and salaries. Recorded capital expenditure surged in December quarter 2009 as contractors took advantage of the dry season, as quickly implemented small-scale projects were undertaken and earlier expenditure commitments were brought into the accounts.
Consistent with the high rate of economic expansion, imports of merchandise goods were up considerably in 2009. The total value of merchandise imports rose by 9.9%. Excluding petroleum and cereal, which fell in price over the year, the value of imports rose by 26.4% in 2009. Capital goods imports increased by 36.6% in 2009 as construction activity and equipment purchases surged. Imports have begun to pick up after slowing during 2009. In the first 5 months of 2010, the value of non-petroleum and cereal imports was 8.8% above that of the same period in 2009.
Merchandise exports, mainly coffee, remain low. The trade deficit to non-petroleum GDP reached nearly 45% over 2009.
The rate of money supply growth has eased. After almost doubling in 2008, broad money grew by 39.6% over 2009. It then rose by 5.0% over the first 5 months of 2010. Commercial bank lending to the private sector remains flat, reflecting the government-oriented nature of construction and other investment activity. Nonperforming loans have increased and by mid-2010 accounted for 45% of loans to the private sector (provisioning for bad debts exceeds the level of nonperforming loans).
Inflation is on the rise. After ending 2009 at 1.6%, inflation had reached 6.6% by June on a year-on-year basis.
16
ECONOMIC CONDITIONS
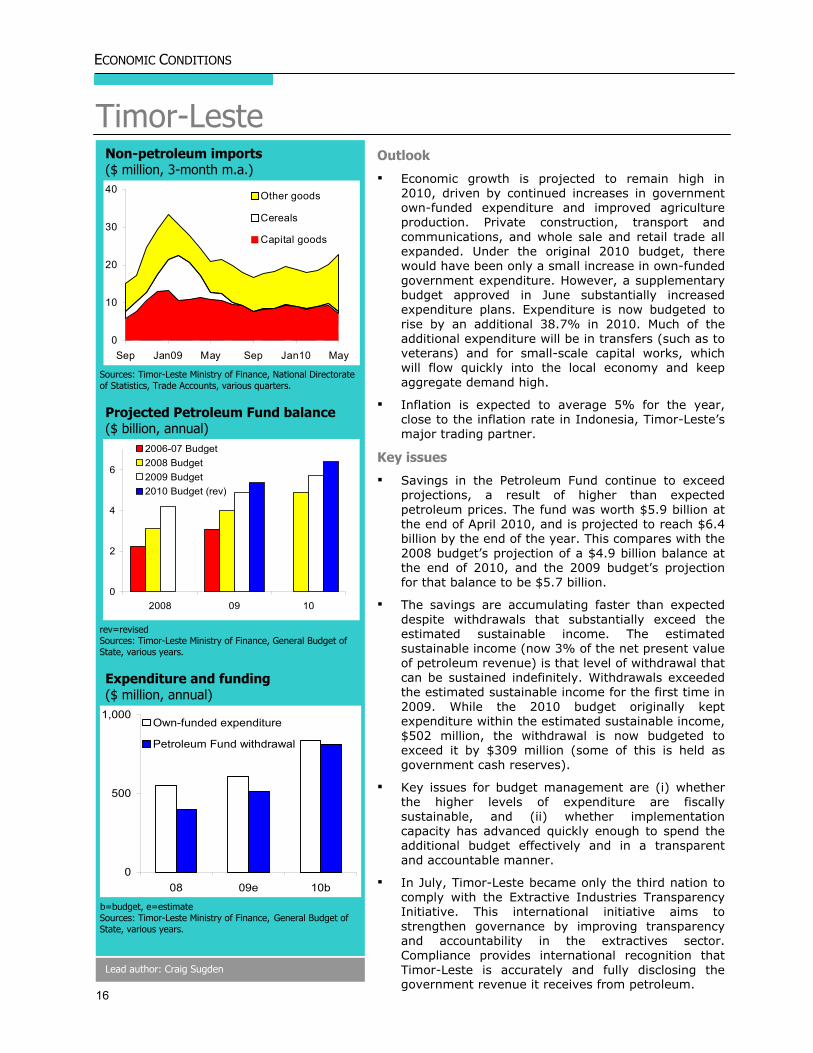
Timor-LesteNon-petroleum imports
($ million, 3-month m.a.)
0
10
20
30
40
Sep Jan09 May Sep Jan10 May
Other goods
Cereals
Capital goods
Sources: Timor-Leste Ministry of Finance, National Directorate of Statistics, Trade Accounts, various quarters. Projected Petroleum Fund balance
($ billion, annual)
0
2
4
6
2008 09 10
2006-07 Budget2008 Budget2009 Budget2010 Budget (rev)
rev=revised Sources: Timor-Leste Ministry of Finance, General Budget of State, various years. Expenditure and funding
($ million, annual)
0
500
1,000
08 09e 10b
Own-funded expenditure
Petroleum Fund withdrawal
b=budget, e=estimate Sources: Timor-Leste Ministry of Finance, General Budget of State, various years.
Outlook
Economic growth is projected to remain high in 2010, driven by continued increases in government own-funded expenditure and improved agriculture production. Private construction, transport and communications, and whole sale and retail trade all expanded. Under the original 2010 budget, there would have been only a small increase in own-funded government expenditure. However, a supplementary budget approved in June substantially increased expenditure plans. Expenditure is now budgeted to rise by an additional 38.7% in 2010. Much of the additional expenditure will be in transfers (such as to veterans) and for small-scale capital works, which will flow quickly into the local economy and keep aggregate demand high.
Inflation is expected to average 5% for the year, close to the inflation rate in Indonesia, Timor-Leste’s major trading partner.
Key issues
Savings in the Petroleum Fund continue to exceed projections, a result of higher than expected petroleum prices. The fund was worth $5.9 billion at the end of April 2010, and is projected to reach $6.4 billion by the end of the year. This compares with the 2008 budget’s projection of a $4.9 billion balance at the end of 2010, and the 2009 budget’s projection for that balance to be $5.7 billion.
The savings are accumulating faster than expected despite withdrawals that substantially exceed the estimated sustainable income. The estimated sustainable income (now 3% of the net present value of petroleum revenue) is that level of withdrawal that can be sustained indefinitely. Withdrawals exceeded the estimated sustainable income for the first time in 2009. While the 2010 budget originally kept expenditure within the estimated sustainable income, $502 million, the withdrawal is now budgeted to exceed it by $309 million (some of this is held as government cash reserves).
Key issues for budget management are (i) whether the higher levels of expenditure are fiscally sustainable, and (ii) whether implementation capacity has advanced quickly enough to spend the additional budget effectively and in a transparent and accountable manner.
In July, Timor-Leste became only the third nation to comply with the Extractive Industries Transparency Initiative. This international initiative aims to strengthen governance by improving transparency and accountability in the extractives sector. Compliance provides international recognition that Timor-Leste is accurately and fully disclosing the government revenue it receives from petroleum.
Lead author: Craig Sugden

ECONOMIC POLICY AND MANAGEMENT
17
Income−who scores highest? Purchasing power parity
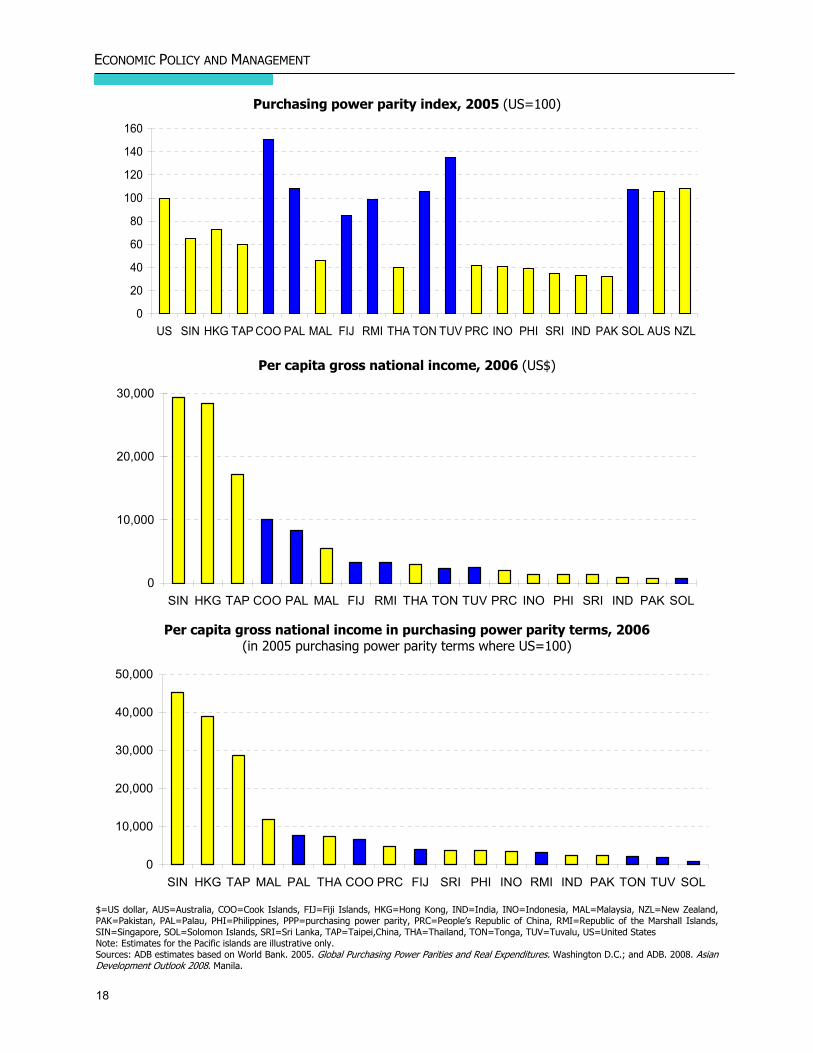
Average incomes in the Pacific, measured by per capita gross national income, compare favorably to those in developing Asia. Many Pacific island nations report a higher per capita gross income than much of developing Asia. But the comparison is potentially misleading. This is because it ignores the disadvantage that arises from the Pacific’s very high cost structure and the resulting high price levels. A similar argument can be made when comparing incomes within the Pacific. Comparisons within the Pacific will be most meaningful if they factor in the consequences of different cost structures and price levels.
More meaningful comparisons are made when undertaken in purchasing power parity terms. A dollar equivalent (i.e., $1 worth of local currency) in one country can have a very different purchasing power to a dollar equivalent held in another country. Specifically, a dollar equivalent held in a lower income country will normally buy more goods and services than a dollar equivalent held in a higher income country. This is because prices in a lower-income economy are normally lower than prices in higher-income economies. Purchasing power parities can be thought of as conversion factors that ensure a common purchasing power over a given set of goods and services (see the special chapter on Comparing Poverty Across Countries: The Role of Purchasing Power Parities in the ADB publication Key Indicators 2008.)
Methodology
The International Comparison Program led by the World Bank, provides the key source of purchasing power parity adjustment factors. The most recent estimates from the program are for 2005, which fortunately included the Fiji Islands, This was the first time a Pacific Island economy was included in the program.
The purchasing power parity index for the Fiji Islands was estimated at 208 when expressed relative to Asia (i.e., the average index for Asia is 100). That is, $2.08 in the Fiji Islands was found to have the same purchasing power, on average, as $1 in Asia. When expressed relative to the US (i.e., the average index for the US is 100), the Fiji Islands’ index was 85. This means the Fiji Islands is a lower-cost economy than the US. This compares with a typical index for Asian economies of around 50 when expressed relative to the US.
It is possible use to the index for the Fiji Islands as a benchmark for preparing estimates of the purchasing power parity index for other Pacific economies. This is done by using detailed price information from the consumer price index. Specifically, prices in a typical year are compared (in the levels) for a selection of goods that are in the consumer price index basket for the Fiji Islands and another Pacific Island economy. This comparison is used to estimate the aggregate difference in price levels between the two economies. Such estimates can only be considered illustrative. The comparison is undertaken for a sample of goods, and this sample varies across countries. Ideally the estimates would be based on comparisons of goods that are the same across countries. A further limitation is that the goods being compared may not be strictly comparable (e.g., because of differences in quality).
Results
Illustrative purchasing power indexes were prepared for the Cook Islands, the Marshall Islands, Palau, Solomon Islands, Tonga, and Tuvalu. Each had a higher index than the Fiji Islands.
Thus most Pacific island economies are found to be higher price economies than the US. Most are found to have a price level comparable to or above Australia and New Zealand, that are slightly higher price economies than the US. The much higher cost structures in the Pacific compared to Asia stand out from the international comparisons.
Of this group, the Cook Islands was found to be the highest-cost economy, with an index of 150 expressed relative to the US. Tuvalu’s index was estimated at 135, and the remaining countries between 100 and 110.
The purchasing power parity index is used to prepare adjusted estimates of per capita gross national income. When income levels are expressed in purchasing power parity terms, lower-income countries will normally appear better off relative to higher-income countries (in contrast to measuring incomes in standard terms). The opposite applies to the Pacific island countries, which are high-cost economies. Importantly, the data suggest real incomes in the Pacific are, on average, below that of most of developing Asia.
Lead authors: Raquel Tabanao and Craig Sudgen
18
ECONOMIC POLICY AND MANAGEMENT
Purchasing power parity index, 2005 (US=100)
0
20
40
60
80
100
120
140
160
US SIN HKG TAP COO PAL MAL FIJ RMI THA TON TUV PRC INO PHI SRI IND PAK SOL AUS NZL
Per capita gross national income, 2006 (US$)
0
10,000
20,000
30,000
SIN HKG TAP COO PAL MAL FIJ RMI THA TON TUV PRC INO PHI SRI IND PAK SOL
Per capita gross national income in purchasing power parity terms, 2006 (in 2005 purchasing power parity terms where US=100)
0
10,000
20,000
30,000
40,000
50,000
SIN HKG TAP MAL PAL THA COO PRC FIJ SRI PHI INO RMI IND PAK TON TUV SOL
$=US dollar, AUS=Australia, COO=Cook Islands, FIJ=Fiji Islands, HKG=Hong Kong, IND=India, INO=Indonesia, MAL=Malaysia, NZL=New Zealand, PAK=Pakistan, PAL=Palau, PHI=Philippines, PPP=purchasing power parity, PRC=People’s Republic of China, RMI=Republic of the Marshall Islands, SIN=Singapore, SOL=Solomon Islands, SRI=Sri Lanka, TAP=Taipei,China, THA=Thailand, TON=Tonga, TUV=Tuvalu, US=United States Note: Estimates for the Pacific islands are illustrative only. Sources: ADB estimates based on World Bank. 2005. Global Purchasing Power Parities and Real Expenditures. Washington D.C.; and ADB. 2008. Asian Development Outlook 2008. Manila.

19
ECONOMIC POLICY AND MANAGEMENT
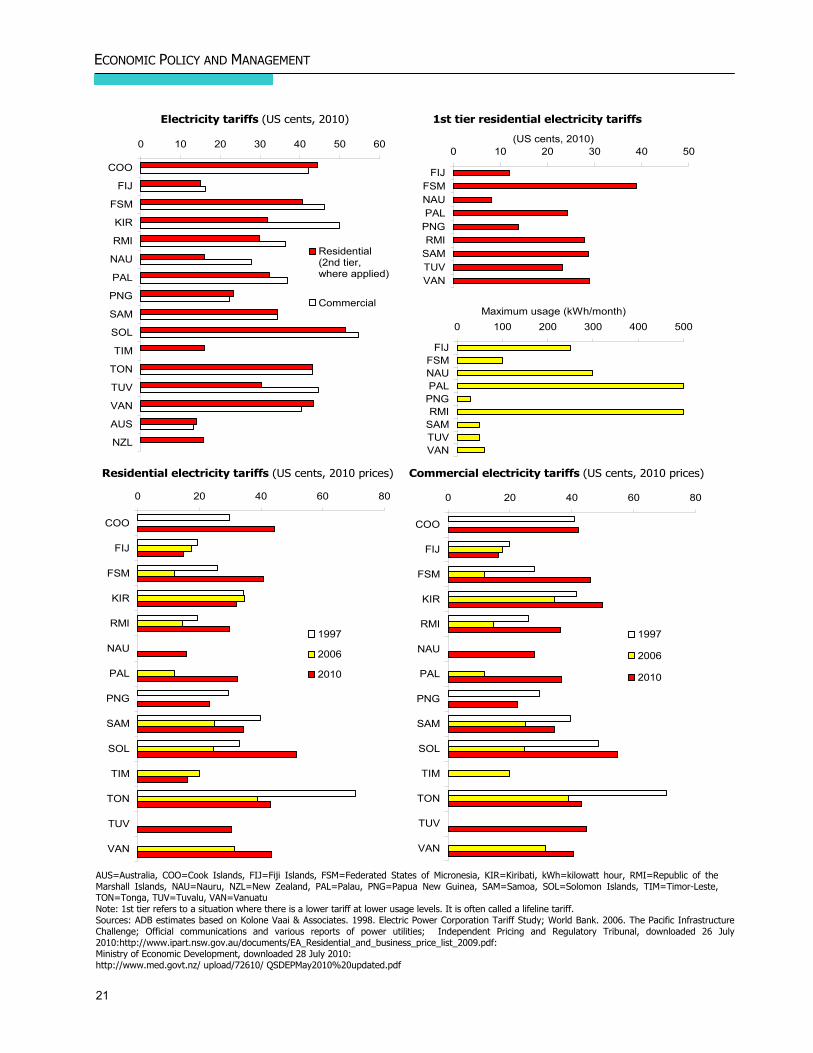
Tackling fuel prices The Pacific’s high cost structure and resultant high prices impair the region’s international competitiveness. Lowering the cost structure through productivity improvements would raise purchasing power, thereby lifting real incomes. It would also help expand exports and make local production more competitive against imports. Lower costs would assist the production of agricultural commodities and other goods, and help expand tourism and other services. But can the region’s high cost structure be reduced? If so, how, and what are the priorities for action? Understanding the answers to these questions can help in formulating the policies needed to make the region more competitive. The Pacific’s remoteness from major markets and its small, dispersed communities are obvious causes of high costs. These factors contribute to high transport costs and mean that production often takes place at the upper end of cost curves. The importance of transport costs is readily evident from a comparison of fuel prices. Economies with a relatively high purchasing power parity index also tend to have relatively high fuel costs, and vice versa. The Cook Islands, for example, has both the highest purchasing power parity index and the highest fuel prices, while the Fiji Islands has the lowest index and low fuel prices. High fuel prices add to an economy’s cost structure, both directly through use in vehicles, boats, and ships, and indirectly through the transport services embedded in other goods. In most economies, the penalty of remoteness and smallness is compounded by special taxes and levies on fuel. The penalty of high fuel prices can also be seen in electricity prices. Fuel accounts for more than 50% to 70% of operating costs for the diesel-dependent utilities in the region. Across the Pacific, electricity prices tend to be higher where the price of fuel is higher. For example, the Cook Islands has the highest fuel prices and among the highest electricity prices. But the correlation is not perfect, as the link between fuel and electricity prices is not complete. One reason is the presence of subsidies. In 2009, operating costs for the small to mid-sized diesel-dependent utilities were probably in the range of 25 to 40 cents per
kilowatt-hour. However, some governments were providing large electricity subsidies, which kept prices below operating costs. Kiribati, the Federated States of Micronesia, the Marshall Islands, Nauru, Timor-Leste, and Tuvalu have been among the largest subsidizing countries, in some cases helped by development partner funding for fuel. Elsewhere, the presence of private or commercialized operators (such as in the Fiji Islands, PNG, Samoa, Tonga, and Vanuatu) tend to keep prices closer to total costs (i.e., operating plus capital costs). A second reason is the advantage of hydropower. For example, the Fiji Islands and PNG benefit from lower prices than other countries because of both their size (they can better take advantage of economies of scale) and the high share of electricity supplied from hydropower (accounting for 60%–65% of generated power). Samoa also benefits from having around half of its electricity generated from hydropower. While subsidies reduce electricity prices, they do not offer savings in fuel costs—they simply shift fuel costs from users to taxpayers. Taking into account transport, electricity, and other needs, the ratio of fuel imports to GDP ranges up to almost 30%. Additional fuel costs are also embedded in the cost of transporting merchandise imports and people to and from the region. High fuel costs thus have an extensive reach in the Pacific economies. The high fuel costs in the Pacific can be traced to the long freight routes, multiple interisland handling, and suboptimally small shipment sizes. But high fuel and electricity prices are not all about smallness and dispersed populations. A 2006 World Bank study highlighted that countries with open market international tendering processes and price regulation, such as Samoa and Solomon Islands, have lower fuel prices than those without price regulation and closed market monopoly suppliers, such as Kiribati and Vanuatu (World Bank. 2006. The Pacific Infrastructure Challenge—A review of the obstacles and opportunities for improving performance in the Pacific Islands. Washington D.C.) Samoa’s experience is widely cited. It has the lowest fuel costs in the region, helped by a competitive allocation of the rights to use a government-owned fuel farm. Finding ways to tackle fuel prices, as Samoa has, falls under the umbrella of structural policy. Enhancing competition in fuel supply is one way to

20
ECONOMIC POLICY AND MANAGEMENT
Petrol prices (US$ per liter, 2009) Diesel prices (US$ per liter, 2009)
PPP and the fuel price Fuel imports to GDP ratio (%, latest year)
0.0 0.5 1.0 1.5 2.0
COO
FIJ
PAL
PNG
RMI
SAM
SOL
TIM
TON
TUV
VAN
PPP Index(US=1.0)
Pre-tax petrolprice in 2009($/liter)
0.0 0.5 1.0 1.5 2.0
AUS
NZL
VAN
TUV
TON
TIM
SOL
SAM
RMI
PNG
PAL
FIJ
COO
Without taxesand duties
Taxes andduties
0.0 0.5 1.0 1.5 2.0
AUS
NZL
VAN
TON
SAM
PNG
PAL
FIJ
Without taxesand duties
Taxes andduties
0 10 20 30 40
COO
FIJ
FSM
KIR
NAU
PAL
PNG
RMI
SAM
SOL
TIM
TON
TUV
VAN
AUS=Australia, COO=Cook Islands, FIJ=Fiji Islands, GDP=gross domestic product, NZL=New Zealand, PAL=Palau, PNG=Papua New Guinea, PPP=purchasing power parity, RMI=Republic of the Marshall Islands, SAM=Samoa, SOL=Solomon Islands, TIM=Timor-Leste, TON=Tonga, TUV=Tuvalu, VAN=Vanuatu Note: The countries used various commodity classifications such as the Standard International Trade Classification (SITC), Broad Economic Categories (BEC) 1, and Harmonized Commodity Description and Coding System (HS) 2. Due to unavailability of more disaggregated data, resulting fuel imports share could be understated or overstated as it includes other non-fuel products such as minerals and lubricants. Source: ADB estimates based on fuel prices from statistical agencies and various reports of government agencies, reserve banks, and newspapers; data from the Pacific Forum Islands Secretariat. 2007. Pacific Fuel Price Monitor. May; and World Bank. 2005. Global Purchasing Power Parities and Real Expenditures. Washington D.C.
21
ECONOMIC POLICY AND MANAGEMENT
Electricity tariffs (US cents, 2010) 1st tier residential electricity tariffs
Residential electricity tariffs (US cents, 2010 prices) Commercial electricity tariffs (US cents, 2010 prices)
0 20 40 60 80
COO
FIJ
FSM
KIR
RMI
NAU
PAL
PNG
SAM
SOL
TIM
TON
TUV
VAN
1997
2006
2010
0 20 40 60 80
COO
FIJ
FSM
KIR
RMI
NAU
PAL
PNG
SAM
SOL
TIM
TON
TUV
VAN
1997
2006
2010
0 10 20 30 40 50 60
COO
FIJ
FSM
KIR
RMI
NAU
PAL
PNG
SAM
SOL
TIM
TON
TUV
VAN
AUS
NZL
Residential(2nd tier,where applied)
Commercial
(US cents, 2010)0 10 20 30 40 50
FIJFSMNAUPAL
PNGRMI
SAMTUVVAN
Maximum usage (kWh/month)0 100 200 300 400 500
FIJFSMNAUPAL
PNGRMI
SAMTUVVAN
AUS=Australia, COO=Cook Islands, FIJ=Fiji Islands, FSM=Federated States of Micronesia, KIR=Kiribati, kWh=kilowatt hour, RMI=Republic of the Marshall Islands, NAU=Nauru, NZL=New Zealand, PAL=Palau, PNG=Papua New Guinea, SAM=Samoa, SOL=Solomon Islands, TIM=Timor-Leste, TON=Tonga, TUV=Tuvalu, VAN=Vanuatu Note: 1st tier refers to a situation where there is a lower tariff at lower usage levels. It is often called a lifeline tariff. Sources: ADB estimates based on Kolone Vaai & Associates. 1998. Electric Power Corporation Tariff Study; World Bank. 2006. The Pacific Infrastructure Challenge; Official communications and various reports of power utilities; Independent Pricing and Regulatory Tribunal, downloaded 26 July 2010:http://www.ipart.nsw.gov.au/documents/EA_Residential_and_business_price_list_2009.pdf: Ministry of Economic Development, downloaded 28 July 2010: http://www.med.govt.nz/ upload/72610/ QSDEPMay2010%20updated.pdf
22
ECONOMIC POLICY AND MANAGEMENT
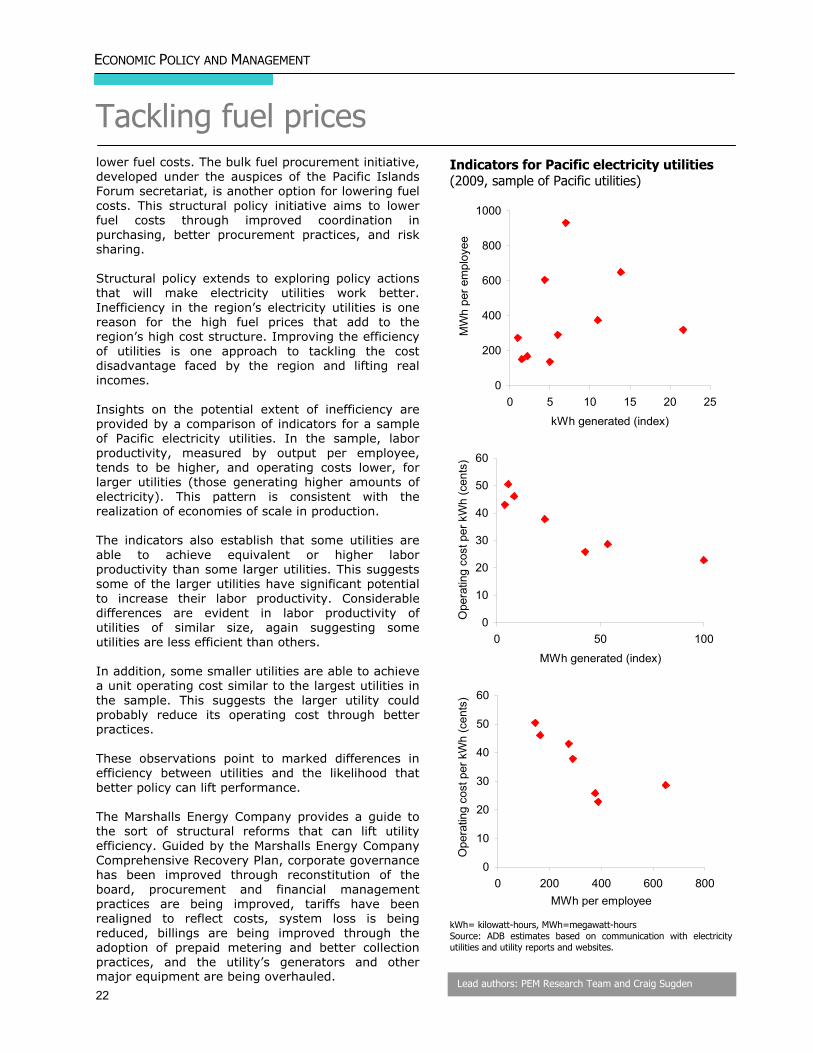
Tackling fuel prices lower fuel costs. The bulk fuel procurement initiative, developed under the auspices of the Pacific Islands Forum secretariat, is another option for lowering fuel costs. This structural policy initiative aims to lower fuel costs through improved coordination in purchasing, better procurement practices, and risk sharing. Structural policy extends to exploring policy actions that will make electricity utilities work better. Inefficiency in the region’s electricity utilities is one reason for the high fuel prices that add to the region’s high cost structure. Improving the efficiency of utilities is one approach to tackling the cost disadvantage faced by the region and lifting real incomes. Insights on the potential extent of inefficiency are provided by a comparison of indicators for a sample of Pacific electricity utilities. In the sample, labor productivity, measured by output per employee, tends to be higher, and operating costs lower, for larger utilities (those generating higher amounts of electricity). This pattern is consistent with the realization of economies of scale in production. The indicators also establish that some utilities are able to achieve equivalent or higher labor productivity than some larger utilities. This suggests some of the larger utilities have significant potential to increase their labor productivity. Considerable differences are evident in labor productivity of utilities of similar size, again suggesting some utilities are less efficient than others. In addition, some smaller utilities are able to achieve a unit operating cost similar to the largest utilities in the sample. This suggests the larger utility could probably reduce its operating cost through better practices. These observations point to marked differences in efficiency between utilities and the likelihood that better policy can lift performance. The Marshalls Energy Company provides a guide to the sort of structural reforms that can lift utility efficiency. Guided by the Marshalls Energy Company Comprehensive Recovery Plan, corporate governance has been improved through reconstitution of the board, procurement and financial management practices are being improved, tariffs have been realigned to reflect costs, system loss is being reduced, billings are being improved through the adoption of prepaid metering and better collection practices, and the utility’s generators and other major equipment are being overhauled.
Indicators for Pacific electricity utilities (2009, sample of Pacific utilities)
0
10
20
30
40
50
60
0 200 400 600 800MWh per employee
Ope
ratin
g co
st p
er k
Wh
(cen
ts)
0
10
20
30
40
50
60
0 50 100
MWh generated (index)
Ope
ratin
g co
st p
er k
Wh
(cen
ts)
0
200
400
600
800
1000
0 5 10 15 20 25
kWh generated (index)
MW
h pe
r em
ploy
ee
kWh= kilowatt-hours, MWh=megawatt-hours Source: ADB estimates based on communication with electricity utilities and utility reports and websites.
Lead authors: PEM Research Team and Craig Sugden

23
ECONOMIC POLICY AND MANAGEMENT
Changing the rules−telecommunications The telecommunication industry provides the region’s most graphic example of the benefits of sound structural policy. In telecommunications, changing the rules in favor of competition and performance has made users much better off while also helping ensure that suppliers are financially sustainable. Performance in the industry is dominated by the quality of structural policy. Industry structure, which is largely determined by whether government policy allows new players, is a key determinant of performance. More open industries are associated with lower tariffs and charges, and better service quality and coverage. Quality economic regulation that seeks to lower charges and raise service standards is also important to ensure better industry performance. Actions to aggressively take advantage of new technology and fast-track the spread of mobile and wireless telecommunications have helped overcome the limits of landline services. In particular, low-cost access to mobile phones allows users to avoid the high fixed cost of landline services, providing many people access to telecommunications for the first time. Tonga led the way in this regard, but similar structural reforms have now spread through almost the entire region. The wide range of services and pricing structures across providers complicates comparisons of telecommunications prices. To overcome this, a telecommunications price index is computed based on a basket of services likely to be used by a typical household. The basket includes the monthly subscription fee for a landline connection and the cost of a representative bundle of local and international calls from landline and mobile phones. The lowest-price country, Tonga, has an index of 1, with prices in other economies expressed relative to Tonga. Kiribati is found to be the highest-price country, with the bundle of services 4 times that of Tonga. This can be traced back to the presence of a single government provider. The high prices in the Cook Islands and Timor-Leste can also be traced back to the presence of one operator. In this case, the operator is privately run, but economic regulation is inefficient and has tolerated damaging monopolistic practices. Both countries are considering structural reform of their industries. The countries with lower prices, such as Tonga and Palau, are characterized by competition. One interesting observation is that the presence of a government provider has not necessarily been a barrier to lower prices. But this appears to be the case only when the government player operates on an independent, commercial basis. Lead authors: PEM Research Team and Craig Sugden
Landline subscription fee ($, monthly)
0 10 20 30
COO
FIJ
KIR
RMI
FSM
PAL
PNG
SAM
TIM
TON
VAN
Residential
Commercial/industrial
Price of a bundle of residential services (index: Tonga=1.0)
0 1 2 3 4 5 6
COO
FIJ
KIR
RMI
FSM
PAL
PNG
SAM
TIM
TON
VAN
COO=Cook Islands, FIJ=Fiji Islands, FSM=Federated States of Micronesia, KIR=Kiribati, RMI=Republic of Marshall Islands, PAL=Palau, PNG=Papua New Guinea, SAM=Samoa, TIM=Timor-Leste, TON=Tonga, VAN=Vanuatu. Source: ADB estimates based on communication with telecommunication providers and provider reports and websites.

24
ECONOMIC POLICY AND MANAGEMENT
Telecommunication charges ($, 2009 or 2010) COO FIJ KIR RMI FSM PAL PNG SAM TIM TON VAN AUS NZ
Landline servicesResidential
Installation fee 53 41 56 35 24 20 4 20 40 30 83 172 38Monthly subscription fee 7 5 6 12 8 12 3 8 10 3 14 20 46Local call rate (per minute)a 0.01 0.08 0.02 0.00 0.00 0.00 0.02 0.02 0.11 0.03 0.23 0.18 0.00
Commercial/ industrialInstallation fee 53 41 56 35 24 20 18 20 40 30 83 100 35Monthly subscription fee 13 7 11 30 16 24 3 12 10 6 14 29 33Local call rate (per minute)a 0.01 0.00 0.04 0.00 0.00 0.00 0.02 … 0.13 0.03 0.23 0.12 0.03
Mobile call rates (per minute) b
Mobile to landline 0.51 0.19 0.40 0.10 0.10 0.21 0.52 0.21 0.27 0.09 0.21 0.72 0.38Mobile to mobile 0.51 0.18 0.24 0.10 0.10 0.21 0.45 0.17 0.23 0.10 0.21 0.72 0.38
International call rate (per minute)c
Average across all destinations 1.75 0.57 2.80 1.25 1.71 1.04 1.06 0.56 0.87 0.61 0.89 1.95 0.74Average for AUS, NZL and US 1.23 0.27 3.27 1.25 1.08 0.35 0.90 0.52 0.59 0.35 0.42 … …
… = not available, AUS=Australia, COO=Cook Islands, FIJ=Fiji Islands, FSM=Federated States of Micronesia, KIR=Kiribati, NZL=New Zealand, RMI=Republicthe Marshall Islands, PAL=Palau, PNG=Papua New Guinea, SAM=Samoa, TIM=Timor-Leste, TON=Tonga, VAN=Vanuatu, US=United States a For a local call of 3 minutes, averaged across providers, excluding special offers. b Average of prepaid and postpaid rates during peak hours, averaged across providers, excluding special offers. c Average rate from a landline and mobile call during peak hours including tax, averaged across providers, excluding special offers. Sources: ADB estimates based on communication with telecommunication providers and provider reports and web sites.
Industry players
Privately owned Government owned
High tariffs KIR Telecom Services Kiribati LimitedDigicel LimitedTelecom Vanuatu Limited
COO Telecom Cook Islands (majority)Bemobile LimitedTelikom PNG
TIM Timor TelecomDigicel Limited Vodafone Fiji Limited
RMI National Telecommunications AuthoritySAM Digicel Limited Samoatel LimitedFSM FSM Telecommunications Corporation
Low tariffs TON Digicel Limited Tonga Communications Corporation and charges PAL Palau Mobile Corporation Palau National Communications Corp.
FIJ Telecomm Fiji Limited
and chargesVAN
PNG Digicel Limited
COO=Cook Islands, FIJ=Fiji Islands, FSM=Federated States of Micronesia, KIR=Kiribati, RMI=Republic of the Marshall Islands, PAL=Palau, PNG=Papua New Guinea, SAM=Samoa, TIM=Timor-Leste, TON=Tonga, VAN=Vanuatu Sources: ADB estimates based on communication with telecommunication providers and provider reports and web sites.

25
ECONOMIC POLICY AND MANAGEMENT
Sovereign wealth management in PNG In 2009, though, fiscal discipline weakened. Payments from trust funds equaled 10.8% of GDP, constituting 81% of total trust fund expenditures since 2005. These drawdowns were far above a limit set in the Medium-Term Fiscal Strategy. They were presented as an economic stimulus, but this did not appear necessary given that the economy was already achieving solid growth. Moreover, the channeling of spending outside the national budget meant it was not integrated into the macroeconomic framework. The national government channels a significant amount of trust fund monies through local administrations, which have limited capacity to implement development projects. It is unlikely that all spending went as planned on development priority projects, given the rapid pace of drawdowns and lack of transparency in the spending. Public revenue from the LNG project will provide PNG with another chance to increase productive economic capacity and raise living standards. This time, development objectives are more likely be achieved and macroeconomic stability maintained if the rules of the medium-term fiscal strategy are followed strictly, monetary and fiscal policy are closely coordinated, and a sovereign wealth fund is established and then integrated into the policy framework. In light of this challenge, the government established a joint Department of Treasury and Bank of PNG Sovereign Wealth Fund Working Group in March 2010. The working group was responsible for reviewing past experience and suggesting suitable sovereign wealth fund options. After seeking feedback from domestic and international stakeholders, the Working Group was scheduled to report back to the National Executive Council at the end of June 2010. Onshore or offshore
There has been much public debate about whether the sovereign wealth fund should be kept onshore or offshore. There are political dimensions to this important policy issue. The Working Group recommends an offshore fund as it will assist in achieving macroeconomic stabilization. There is, however, a widespread alternative view that the fund should be kept onshore and invested directly in rural areas where many Papua New Guineans face considerable hardship. Further, some argue that the government should bring revenues onshore in a local currency fund, as this will reduce the cost of living and increase purchasing power.
The $15 billion Exxon Mobil led liquefied natural gas (LNG) project is fueling expectations of an economic and social transformation in Papua New Guinea (PNG). The project looks likely to eclipse the now closed Panguna mine in Bougainville to become the largest in the country’s history. If petroleum prices stay high, as expected, output value could reach $150 billion over its 30-year life and provide as much as $30 billion in revenue for the government and landowners. Additional LNG projects are in the pipeline. The potential adverse macroeconomic implications of these large resource projects will need to be managed skillfully. Only then will the benefits of the project be equitably shared among PNG’s 6.5 million citizens and future generations. This is not the first time that PNG has had the opportunity to grow from its resource wealth. The Panguna mine led to a surge in economic activity and government revenue in the 1970s and 1980s. Landowner unrest linked to concerns over the distribution of benefits contributed to its abrupt closure in 1989. This initiated a chain of events that culminated in economic and fiscal crisis despite extensive international support. Other major mining projects and the commencement of petroleum production subsequently refueled the economy. But the 1990s became known as the “lost decade” because PNG did not translate high levels of mining and petroleum revenue into improved living standards. The government had set up a Mineral Revenue Stabilization Fund in 1974 to help manage the volatility in mining revenue. However, weaknesses in the design and operation of the fund, including a lack of transparency and accountability, meant the fund failed to generate the anticipated benefits. The government learned from that experience, and has better managed the windfall revenues earned from the recent commodity boom. A series of important reforms over the past 10 years, notably in the early 2000s, have been critical to improving economic management. The Bank of PNG became more independent, while the Medium-Term Fiscal Strategy and Fiscal Responsibility Act provided a robust framework for prudent fiscal management. Disciplined fiscal policies enabled the government to accumulate windfall revenue, which it saved in trust funds earmarked for development purposes and public debt repayment.

26
ECONOMIC POLICY AND MANAGEMENT
Sovereign wealth management in PNG Absorptive capacity constraints
The Sovereign Wealth Fund Working Group recommended that drawdowns be calibrated subject to capacity constraints within the domestic economy. This makes good sense. Capacity constraints within both the private and public sectors need to be considered. If public expenditure exceeds the absorptive capacity of the PNG economy, then increased spending now will create inflationary pressures. This would particularly hurt small and medium-sized enterprises by increasing both the cost of production and the cost of living for Papua New Guineans. It would also reduce value-for-money on public investments. This has been evident in the civil works sector during the recent commodity boom. As well as calibrating the rate of drawdown to capacity, the government could also carefully target public expenditure by investing in sectors and regions of the economy with spare capacity. For example, in the current climate the government could target unskilled labor-intensive public works in regions that are not directly benefiting from the LNG project. Other sovereign wealth fund design elements
A whole-of-government consensus is emerging on many of the other design elements recommended by the Sovereign Wealth Fund Working Group. Notably, it is generally agreed that sovereign wealth funds should be fully integrated with the budget and fiscal framework, and that funds should be subject to best practice governance standards, drawing on the wealth of international experience, tailored to the PNG country context. Public financial management
It is important to stress that while a well-designed sovereign wealth fund can support a sound fiscal framework, it should not divert attention and scarce resources from the need to undertake key fiscal reforms. There are pressing fiscal management issues that need to be addressed if the sovereign wealth fund is to be effective. These primarily relate to the efficiency and equity of public expenditure. As a saving mechanism, recent trust fund experience was relatively successful; however, expenditure management proved more challenging. Expenditure-side public financial management shortcomings need to be addressed if future episodes of fiscal blowouts are to be avoided.
It is important to distinguish between where the government saves and where it eventually invests the nation’s resource wealth. Maintaining an offshore sovereign wealth fund means that resource revenues are only temporarily held overseas but eventually they will be invested in PNG. It makes sense to save funds until public expenditures achieve value-for-money and the return from public investment is maximized. It is not possible to spend all resource revenues when they accrue because of capacity constraints in both the private and public sectors. This was evident in the recent experience where rapid drawdowns from trust fund accounts in 2009 exceeded the capacity to use funds well. The effective interest rate currently earned on trust funds kept at commercial banks is -4.5% (1% deposit interest is earned from commercial banks, while the central bank absorbs this liquidity by paying the commercial banks 5.5% through the issuance of central bank bills). The value of trust funds accumulated during the recent commodity boom was K4.3 billion. Foregone 4.5% interest income on these savings is equivalent to K194 million per year. To put this in perspective, this money could have financed the annual maintenance of all national highways. Another issue is whether or not to try mitigating the impact of large foreign currency inflow or to allow the kina to appreciate. While a higher kina value would help keep the domestic cost of imports down, it would however also reduce the incentive for cash crop production. Prices of PNG’s main cash crops are set in US dollars on the international market. A higher kina will reduce the kina income of producers. Cash crops are an important source of income at the national and household levels, while renewable resource sectors are an important source of income for rural villages, which account for 87% of the population. Depreciations in the kina since it was floated in 1994 have led to increased local production and an improved capacity for major urban centers to feed themselves. The weaker kina has increased the price of imports, which in turn has increased the demand for what became relatively cheaper locally grown food. This helped spur local production. Lower prices on domestic staple goods have helped to contain inflation and the cost of living by counteracting imported inflation. Reversing these beneficial changes by allowing the kina to appreciate would be costly for the large majority of the population.

27
ECONOMIC POLICY AND MANAGEMENT
Sovereign wealth management in PNG
administered by different institutions. Likewise, sound governance, transparency, disclosure, and accountability practices are very important.
Consultation
The government’s commitment to developing the sovereign wealth fund architecture through a consultative process is a positive development. In addition to the Sovereign Wealth Fund Working Group, stakeholder workshops have been convened. A broad-based consensus between all domestic stakeholders will help to mitigate political economy risk and optimize the funds technical design. LNG project revenue flows will not be significant until after 2015. There is enough time to reach broad-based consensus and to address some existing public financial management reforms that would enhance the effectiveness of the proposed sovereign wealth fund. There is no need to rush the consultation process. Making the time to reach a whole-of-government consensus that is widely accepted in the community would be a sound investment. Sufficient time and resources should also be set aside for an exerted public consultation campaign to obtain community feedback and avoid the emergence of any misconceptions. Concluding remarks
The design elements proposed by the Sovereign Wealth Fund Working Group are sound. Key recommendations relate to the integration of all sovereign wealth funds with the budget and fiscal framework, the calibration of drawdowns to capacity constraints, and the establishment of best practice governance standards tailored to the PNG country context. It is preferable to maintain sovereign wealth funds offshore. There would also be value in clarifying the overall policy objective of the sovereign wealth fund as maximizing wealth, broadly defined. It is important that the government takes action to strengthen public expenditure management. This will support more effective use of the sovereign wealth funds. Finally, the consultation process should be allowed to play out its natural course and reach a whole-of-government position. This, combined with an exerted public consultation campaign, will encourage buy-in and help ensure that political economy issues are factored in.
Wealth creation
It appears to be implicitly accepted that the purpose of the sovereign wealth fund is to maximize wealth, broadly defined. The final design of the fund and future evaluations would be assisted by establishing this as a clear, explicit statement of the fund’s objective. How could such an objective be met? It would require achievement of intergenerational equity in the use of nonrenewable resources, as well as countering the adverse effects of the resource curse and revenue volatility. Investment in both physical infrastructure and human capital would be vital. Ideally, this would entail adequate funding for maintenance of infrastructure. Irregularity of annual budget funding for maintenance has contributed to the rapid deterioration of economic and social infrastructure. Insufficient funding has created a large maintenance backlog. Delays and uncertainty in disbursements have created interruptions in implementation. The problem is aggravated by the landslides and floods common to PNG, which often damage critical network links and force the reallocation of funds from routine maintenance to emergency works. The infrastructure fund
The government has announced that it is considering both a stabilization fund and an infrastructure fund that would finance government development projects. The creation of an infrastructure fund is an opportunity to lock in a reliable stream of counterpart government funding for projects implemented through public–private partnerships. A public–private partnerships program is being established and the availability of such long term public funding will reduce payment risks associated with public–private partnerships projects. This will make PNG more attractive to potential investors. Although the proposed infrastructure fund and stabilization fund each has a different purpose and mandate, the optimal design elements are similar. For example, the rate of drawdown for infrastructure investments needs to be carefully calibrated according to the economy’s capacity to ensure efficient expenditure. Effective macroeconomic management would require that all sovereign wealth fund funds be fully integrated into the budget and fiscal framework. Institutional arrangements would be challenging and need to be carefully considered if the various trust funds are
Lead author: Dominic Mellor

DATA
28
Non-fuel merchandise exports from Australia (A$; y-o-y % change, 3-month m.a.)
Fiji Islands
-60
-40
-20
0
20
Nov Feb09 May Aug Nov Feb10 May
Papua New Guinea
-20
0
20
40
Nov Feb09 May Aug Nov Feb10 May
-100
0
100
200
300
Nov Feb09 May Aug Nov Feb10 May
Solomon Islands
Nauru
-60
-30
0
30
60
Nov Feb09 May Aug Nov Feb10 May
Vanuatu
Kiribati
A$=Australian dollars Source: Australian Bureau of Statistics.
Non-fuel merchandise exports from New Zealand and the United States (y-o-y % change, 3-month m.a.)
From New Zealand(NZ$ million, fob)
-25
0
25
50
Nov Feb09 May Aug Nov Feb10 May
Cook IslandsSamoaTonga
From US($ million, fas)
-150
0
150
300
Nov Feb09 May Aug Nov Feb10 May
FSM RMIPalau
FSM=Federated States of Micronesia, fas=free alongside, fob=free on board, m.a.=moving average, NZ=New Zealand, RMI=Republic of the Marshall Islands, US=United States Note: The Cook Islands–Fiji Islands shipping route was lost during 2009 and into 2010, with only the New Zealand route remaining. Sources: Statistics New Zealand and US Census Bureau.

29
DATA
Motor vehicle imports from Japan
(number; y-o-y % change, 3-month m.a.)
Cook Islands
-100
-50
0
50
100
Nov Feb09 May Aug Nov Feb10 May
Federated States of Micronesia
-25
0
25
50
75
100
Nov Feb09 May Aug Nov Feb10 May
Nauru
-100
0
100
200
Nov Feb09 May Aug Nov Feb10 May
Palau
-80
0
80
160
Nov Feb09 May Aug Nov Feb10 May
Papua New Guinea
-80
0
80
160
Nov Feb09 May Aug Nov Feb10 May
Samoa
0
600
1,200
1,800
Nov Feb09 May Aug Nov Feb10 May
Solomon Islands
-75
0
75
150
Nov Feb09 May Aug Nov Feb10 May
Timor-Leste
-100
0
100
200
300
Nov Feb09 May Aug Nov Feb10 May
Vanuatu
-100
0
100
200
300
400
Nov Feb09 May Aug Nov Feb10 May
Tonga
-150
0
150
300
Nov Feb09 May Aug Nov Feb10 May
Fiji Islands
-100
-50
0
50
100
Sep08 Dec Mar09 Jun Sep Dec Mar10
Kiribati
-300
0
300
600
900
Nov Feb09 May Aug Nov Feb10 May
Source: Japan e-Stats website.

DATA
30
Departures from Australia to the Pacific (monthly)
Fiji Islands
-20
0
20
40
Nov Feb09 May Aug Nov Feb10 May-50
0
50
100
persons ('000)
y-o-y % change
Samoa
-4
-2
0
2
4
Nov Feb09 May Aug Nov Feb10 May-50
-25
0
25
50
persons ('000)
y-o-y % change( h )
Tonga
-2
0
2
4
Nov Feb09 May Aug Nov Feb10 May-90
0
90
180
persons ('000)
y-o-y % change( h )
Vanuatu
-4
0
4
8
Nov Feb09 May Aug Nov Feb10 May-40
0
40
80
persons ('000)
y-o-y % change (rhs)
Cook Islands
-1
0
1
2
3
Nov Feb09 May Aug Nov Feb10 May-80
0
80
160
persons ('000)
y-o-y % change
Major destinations
-15
0
15
30
45
Nov Feb09 May Aug Nov Feb10 May-20
0
20
40
60
persons ('000)
y-o-y % change (rhs)
Major destinations
-20
0
20
40
May00 May01 May02 May03 May04 May05 May06 May07 May08 May09 May10-60
0
60
120
persons ('000)y-o-y % change (rhs)
Sources: Australian Bureau of Statistics.

DATA
31
Departures from New Zealand to the Pacific (monthly)
Cook Islands
-15
-10
-5
0
5
10
Nov Feb09 May Aug Nov Feb10 May-30
-20
-10
0
10
20
persons ('000)
y-o-y % change (rhs)
Fiji Islands
-10
0
10
20
Nov Feb09 May Aug Nov Feb10 May-40
0
40
80
persons ('000)
y-o-y % change (rhs)
Samoa
-2
0
2
4
6
Nov Feb09 May Aug Nov Feb10 May-20
0
20
40
60
persons ('000)
y-o-y % change (rhs)
Tonga
-1
0
1
2
3
Nov Feb09 May Aug Nov Feb10 May-40
-20
0
20
40
60
persons ('000)
y-o-y % change (rhs)
Vanuatu
-6
-3
0
3
Nov Feb09 May Aug Nov Feb10 May-50
-25
0
25
persons ('000)
y-o-y % change (rhs)
Major destinations
-15
0
15
30
Nov Feb09 May Aug Nov Feb10 May-20
0
20
40
persons ('000)
y-o-y % change (rhs)
Major destinations
-20
0
20
40
May00 May01 May02 May03 May04 May05 May06 May07 May08 May09 May10-60
0
60
120
persons ('000)y-o-y % change (rhs)
Source: New Zealand Ministry of Tourism.

DATA
32
Latest Economic Updates GDP
Growth InflationCredit
GrowthaTrade
Balance Import CoverFiscal
Balance
(%, 2010f) (%, y-o-y) (%) (% of GDP) (months) (% of GDP)
Cook Islands 0.5 0.0 0.2 -90.4 --- -11.7(Mar-Q 2010) (Dec 2009) (2009e) (FY2009)
Fiji Islands -0.5 5.5 0.5 -30.8 3.5 -2.5(Jun 2010) (Apr 2010) (2009e) (Jun 2010) (2009e)
FSM 0.5 9.7 --- -51.8 3.8 -1.0(Jun-Q 2009) (2009f) (2008) (2009e)
Kiribati 0.5 6.6 --- -57.6 --- 1.7(2009f) (2008) (2009)
Marshall Islands 0.5 5.6 --- -46.9 --- -0.3(Mar-Q 2009) (2008) (FY2009)
Naurub 0.0 7.6 --- --- --- 0.4(Aug 2009) (FY2009)
Palau 0.5 1.7 --- --- --- -4.8(Jun-Q 2009) (FY2008)
PNG 5.5 6.2 17.7 19.2 16.0 0.9(Jun-Q 2010) (Mar 2010) (2009p) (Mar 2010) (Mar 2010)
Samoa 0.5 -0.3 5.9 -34.8 7.0 -4.2
(Jun 2010) (May 2010) (2009) (May 2010) (FY2009)Solomon Islands 3.5 1.1 -0.5 -28.1 6.2 0.0
(Apr 2010) (May 2010) (2008) (May 2010) (2009e)Timor-Lestec 10.4 3.7 12.2 -46.4 --- 101.4
(Mar-Q 2010) (May 2010) (2009) (2009e)Tonga -0.4 2.5 -15.2 -54.2 7.1 3.7
(May 2010) (May 2010) (2009) (Jun 2010) (FY2009e)Tuvalu 1.6 --- --- --- --- -7.3
(2009)Vanuatu 4.0 2.8 10.5 -33.4 5.9 0.1
(Mar-Q 2010) (Feb 2010) (2009) (Feb 2010) (2009e) --- = not available, e=estimate, f=forecast, FSM=Federated States of Micronesia, GDP=gross domestic product, PNG=Papua New Guinea, p=preliminary, Q=quarter, y-o-y=year on year aCredit growth refers to growth in total loans and advances to the private sector. bInflation for Nauru is on a year-to-date basis. cCredit growth includes loans and advances by commercial banks to both the public and private sectors. Notes: Period of latest data shown in brackets; import cover for PNG is months of non-mining and oil imports. Sources: ADB. 2010. Asian Development Outlook 2010. Manila; and statistical releases of the region’s central banks, finance ministries and treasuries, and statistical bureaus. Key data sources:
Data used in the Pacific Economic Monitor are in the ADB PacMonitor database, available in spreadsheet form at www.adb.org/pacmonitor.
About the Asian Development Bank ADB's vision is an Asia and Pacific region free of poverty. Its mission is to help its developing member countries substantially reduce poverty and improve the quality of life of their people. Despite the region’s many successes, it remains home to two-thirds of the world’s poor: 1.8 billion people who live on less than $2 a day, with 903 million struggling on less than $1.25 a day. ADB is committed to reducing poverty through inclusive economic growth, environmentally sustainable growth, and regional integration. Based in Manila, ADB is owned by 67 members, including 48 from the region. Its main instruments for helping its developing member countries are policy dialogue, loans, equity investments, guarantees, grants, and technical assistance. Asian Development Bank 6 ADB Avenue, Mandaluyong City 1550 Metro Manila, Philippines www.adb.org