pacific continental corporation form 10-k 2008 · additional capital through a private equity...
TRANSCRIPT

SECURITIES & EXCHANGE COMMISSION
Washington D.C. 20549
FORM 10-K
[ X ] ANNUAL REPORT PURSUANT TO SECTION 13 OR 15(d) OF THE SECURITIES EXCHANGE ACTOF 1934.
[ ] TRANSITION REPORT PURSUANT TO SECTION 13 OR 15(d) OF THE SECURITIES EXCHANGEACT OF 1934
FOR THE FISCAL YEAR ENDED DECEMBER 31, 2008
COMMISSION FILE NUMBER 0-30106
PACIFIC CONTINENTAL CORPORATION(Exact name of registrant as specified in its charter)
OREGON 93-1269184(State of Incorporation) (IRS Employer Identification No)
111 West 7th AvenueEugene, Oregon 97401
(Address of principal executive offices)
(541) 686-8685(Registrant’s telephone number)
Securities registered pursuant to section 12(b) of the Act:Title of Each Class Name of Each Exchange on Which Registered
Common Stock, No par value per share Nasdaq Global Select Market
Securities registered pursuant to 12(g) of the Act:None
Indicate by check mark if the registrant is a well-known seasoned issuer, as defined in Rule 405 of the SecuritiesAct Yes __ No X
Indicate by check mark if the registrant is not required to file report pursuant to Section 13 or Section 15(d) of theAct Yes __ No X
Check whether the registrant (1) has filed all reports required to be filed by Section 13 or 15(d) of the SecuritiesExchange Act of 1934 during the preceding 12 months (or for such shorter period that the registrant was requiredto file such reports), and (2) has been subject to such filing requirements for the past 90 days. Yes X No ___
Check if there is no disclosure of delinquent filers in response to item 405 of Regulation S-K contained in thisform, and no disclosure will be contained, to the best of the registrant’s knowledge, in definitive proxy orinformation statements incorporated by reference in Part III of this form 10-K or any amendment to this Form 10-K. ( )
Indicate by check mark whether the registrant is a large accelerated filer, an accelerated filer, a non-acceleratedfiler, or a smaller reporting company.Large accelerated filer __ Accelerated filer X Non-accelerated filer __ Smaller Reporting Company __
Indicate by check mark whether the registrant is a shell company (as defined in Rule 12b-2 of the Exchange ActYes __ No X
The aggregate market value of the voting stock held by non-affiliates of the registrant at June 30, 2008 (the lastbusiness day of the most recent second quarter) was $154,698,279 based on the closing price as quoted on theNASDAQ Global Market on that date.
The number of shares outstanding of each of the registrant’s classes of common stock, as of March 6, 2009, was12,862,691 shares of no par value Common Stock.
DOCUMENTS INCORPORATED BY REFERENCE
Part III incorporates by reference information from the registrant’s definitive proxy statement for the 2009 annualmeeting of shareholders.

PACIFIC CONTINENTAL CORPORATIONFORM 10-K
ANNUAL REPORTTABLE OF CONTENTS
PART 1 PageItem 1: Business 3
Item 1a: Risk Factors 18
Item 1b: Unresolved Staff Comments 21
Item 2: Properties 21
Item 3: Legal Proceedings 22
Item 4: Submission of Matters to a Vote of Security Holders 22
PART II
Item 5: Market for Company’s Common Equity, Related 22Stockholder Matters, and Issuer Purchases of Equity Securities
Item 6: Selected Financial Data 25
Item 7: Management’s Discussion and Analysis of Financial 26Condition and Results of Operations
Item 7a: Quantitative and Qualitative Disclosures About Market Risk 41
Item 8: Financial Statements and Supplementary Data 44
Item 9: Changes In and Disagreements with Accountants 75on Accounting and Financial Disclosure
Item 9a: Controls and Procedures 75
Item 9b: Other Information 75
PART III (Items 10 through 14 are incorporated by reference fromPacific Continental Corporation’s definitive proxy statement for theannual meeting of shareholders scheduled for April 20, 2009)
Item 10: Directors, Executive Officers and Corporate Governance 75
Item 11: Executive Compensation 76
Item 12: Security Ownership of Certain Beneficial Owners 76and Management and Related Stockholder Matters
Item 13: Certain Relationships, Related Transactions and Director Independence 76
Item 14: Principal Accounting Fees and Services 76
PART IV
Item 15: Exhibits and Financial Statement Schedules 77
SIGNATURES 78
CERTIFICATIONS 79

-3-
PART I
Item 1. BusinessGeneral
Pacific Continental Corporation (the “Company” or the “Registrant”) is an Oregon corporation andregistered bank holding company located in Eugene, Oregon. The Company was organized on June 7,1999, pursuant to a holding company reorganization of Pacific Continental Bank, its wholly-ownedsubsidiary.
The Company’s principal business activities are conducted through its full-service commercial banksubsidiary, Pacific Continental Bank (the “Bank”), an Oregon state-chartered bank with deposits insured bythe Federal Deposit Insurance Corporation (“FDIC”). The Bank has two subsidiaries, PCB ServiceCorporation (presently inactive), which holds and manages Bank property, and PCB Loan Services(presently inactive), which manages certain other real estate owned.
The Bank operates in three primary markets: Portland, Oregon / Southwest Washington; Seattle,Washington; and Eugene, Oregon. At December 31, 2008, the Bank operated fourteen full-service officesin six Oregon and three Washington cities.
Results
For the year ended December 31, 2008, the consolidated net income of the Company was $12.9 million or$1.08 per diluted share. At December 31, 2008, the consolidated equity of the Company was $116.2million with 12.1 million shares outstanding and a book value of $9.62 per share. Total assets were$1,090.8 million. Loans, including loans held for sale, net of allowance for loan losses and unearned fees,were $945.8 million at December 31, 2008 and represented 87% of total assets. Deposits totaled $722.4million at year-end 2008 with core deposits representing 85% or $615.8 of total deposits. At December 31,2008, the Company had a total risk-based capital ratio of 11.11% and was rated as “well-capitalized” underFDIC guidelines. Subsequent to the end of the year, the company raised approximately $9.7 million inadditional capital through a private equity placement that is expected to increase the total risk-based capitalratio to more than 12%. In addition, in December 2008, the Company received preliminary approval toreceive up to $30 million in capital in the form of preferred stock through the Federal Government’sTroubled Asset Relief Program. In January 2009, the Company announced that it had determined not toparticipate in this program. For more information regarding the Company’s financial condition and resultsof operations, see “Management’s Discussion and Analysis of Financial Condition and Results ofOperations” and “Financial Statements and Supplementary Data” in sections 7 and 8 of this Form 10-K.
THE BANK
General
The Bank commenced operations on August 15, 1972. At December 31, 2008, the Bank operated fourteenbanking offices in Oregon and Washington. The primary business strategy of the Bank is to providecomprehensive banking and related services tailored to community-based business, not-for-profits,professional service providers and private banking services for business owners and executives. The Bankemphasizes the diversity of its product lines, high levels of personal service, and through technology, offersconvenient access typically associated with larger financial institutions, while maintaining local decision-making authority and market knowledge, typical of a local community bank. More information on the Bankand its banking services can be found on its Website. The Bank operates under the banking laws of theState of Oregon, State of Washington and the rules and regulations of the FDIC and the Federal ReserveBank of San Francisco.
Primary Market Area
The Bank’s primary markets consist of metropolitan Portland, which includes Southwest Washington, andmetropolitan Eugene in the State of Oregon and metropolitan Seattle in the State of Washington. The Bankhas five full-service banking offices in the metropolitan Portland and Southwest Washington area, seven
-4-
full-service banking offices in the metropolitan Eugene area, and two full-service offices in the metropolitanSeattle area. The Bank has its headquarters and administrative office in Eugene, Oregon.
Competition
Commercial banking in the states of Oregon and Washington is highly competitive with respect to providingbanking services, including making loans and attracting deposits. The Bank competes with other banks, aswell as with savings and loan associations, savings banks, credit unions, mortgage companies, investmentbanks, insurance companies, and other financial institutions. Banking in Oregon and Washington isdominated by several large banking institutions, including U.S. Bank, Wells Fargo Bank, Bank of America,and JP Morgan, which together account for a majority of the total commercial and savings bank deposits inOregon and Washington. These competitors have significantly greater financial resources and offer a muchgreater number of branch locations. The Bank has attempted to offset the advantage of the largercompetitors by focusing on certain market segments, providing high levels of customization and personalservice, and tailoring its technology, products, and services to the specific market segments that the Bankserves.
In addition to larger institutions, numerous “community” banks and credit unions have been formed,expanded or moved into the Bank’s three primary areas and have developed a similar focus to the Bank.These institutions have further increased competition in all three of the Bank’s primary markets. Thisgrowing number of similar financial institutions and an increased focus by larger institutions in the Bank’sprimary markets has led to intensified competition in all aspects of the Bank’s business, particularly in thearea of loan and deposit pricing.
The adoption of the Gramm-Leach-Bliley Act of 1999 (the “GLB Act”) has led to further intensification ofcompetition in the financial services industry. The GLB Act has eliminated many of the barriers toaffiliation among providers of various types of financial services and has permitted business combinationsamong financial service providers such as banks, insurance companies, securities or brokerage firms, andother financial service providers. Additionally, the rapid adoption of financial services through theInternet has reduced or even eliminated many barriers to entry by financial services providers physicallylocated outside our market area. For example, remote deposit services allow depository companiesphysically located in other geographical markets to service local businesses with minimal cost of entry.Although the Bank has been able to compete effectively in the financial services business in its markets todate, there can be no assurance that it will be able to continue to do so in the future.
The financial services industry has experienced widespread consolidation over the last decade. TheCompany anticipates that consolidation among financial institutions in its market area will continue. Inparticular, the current economic conditions suggest a number of bank failures are possible in theCompany’s market areas that will lead to additional consolidation in the industry. The Company seeksacquisition opportunities, including FDIC assisted takeovers, from time to time, in its existing markets andin new markets of strategic importance. However, other financial institutions aggressively competeagainst the Bank in the acquisition market. Some of these institutions may have greater access to capitalmarkets, larger cash reserves, and stock for use in acquisitions that is more liquid and more highly valuedby the market.
Services Provided
Lending Activities
The Bank emphasizes specific areas of lending within its primary market areas: loans to community-basedbusinesses, professional service providers, not-for-profit organizations and private banking services forbusiness owners and executives.
Commercial loans, secured and unsecured, are made primarily to professionals, community-basedbusinesses, and not-for-profit organizations. These loans are available for general operating purposes,acquisition of fixed assets, purchases of equipment and machinery, financing of inventory and accountsreceivable, and other business purposes. The Bank also originates Small Business Administration (“SBA”)loans and enjoys a national preferred lender status with the SBA.

-5-
Within its primary markets, the Bank also concentrates on permanent and construction loan financing forcommercial facilities and for pre-sold, custom, and speculative home construction. The major thrust ofresidential construction lending is smaller in-fill construction projects consisting of single-familyresidences. However, in fourth quarter 2007, due to the rapid deterioration in the national and regionalhousing market, the Bank severely restricted lending on speculative home construction and significantlyreduced its exposure to residential construction lending. The Bank also finances requests for multi-familyresidences.
Fixed-rate and variable rate residential mortgage loans are offered through the Bank’s mortgage loandepartment. Most residential mortgage loans originated are sold in the secondary market along with themortgage loan servicing rights.
The Bank makes secured and unsecured loans to individuals for various purposes including purchases ofautomobiles, mobile homes, boats, and other recreational vehicles, home improvements, education, andpersonal investment.
The Bank offers credit card services to its business customers and uses an outside vendor for credit cardprocessing. In addition, the Bank provides merchant bankcard processing services through an outsideprocessor, for its client base, including businesses, not-for-profits, and professional service providers.
The Board of Directors has approved specific lending policies and procedures for the Bank andmanagement is responsible for implementation of the policies. The lending policies and procedures includeguidelines for loan term, loan-to-value ratios, collateral appraisals, and cash flow coverage. The loanpolicies also vest varying levels of loan authority in management, the Bank’s Loan Committee, and theBoard of Directors. Bank management monitors lending activities through management meetings, loancommittee meetings, monthly reporting, and periodic review of loans by third-party contractors.
Deposit Services
The Bank offers a full range of deposit services that are typically available in most banks and other financialinstitutions, including checking, savings, money market accounts, and time deposits. The transactionaccounts and time deposits are tailored to the Bank’s primary markets and market segments at ratescompetitive with those offered in the area. Additional deposits are generated through national networks forinstitutional deposits and the State of Oregon and State of Washington for public time deposits. All depositaccounts are insured by the FDIC to the maximum amount permitted by law.
Subsequent to the end of the year, as a result of a financial institution failure in the State of Washington, theBank was assessed $9 thousand for uninsured public deposits at the failed institution. The assessment wasbased upon the Bank’s pro rata share of public deposits as of December 31, 2008, which amounted to lessthan one-tenth of one percent. However, due to the increased risk of future bank failures in Washington, theBank chose to exit the public deposit pool in order to minimize its exposure to possible assessments foruninsured deposits. The Bank will continue to have a potential liability for uninsured deposits for a periodof one year following its exit from the state public deposit pool.
The Bank has invested continuously in image technology since 1994 for the processing of checks. TheBank was the first financial institution in Lane, Multnomah, Clackamas, and Washington Counties to offerthis service. Due to this investment in image technology, commencing in July 2007, the Bank has been ableto accelerate its funds availability by presenting all items for clearing to its correspondent banks via animaged file. In addition, the Bank provides on-line cash management, remote deposit capture, and bankingservices to businesses and consumers. The Bank also allows 24-hour customer access to deposit and loaninformation via telephone and on-line cash management products.
Merchant Card Services
The Bank provides merchant card services to its clients, which includes processing of credit cardtransactions and issuance of business credit cards. This service is an integral part of the Bank’s strategy to

-6-
focus on marketing to community-based business, not-for-profits, and service providers. During 2008, theCompany processed approximately $190 million in credit card transactions for its merchant clients.
Other Services
The Bank provides other traditional commercial and consumer banking services, including cashmanagement products for businesses, on-line banking, safe deposit services, debit and ATM cards, ACHtransactions, savings bonds, cashier’s checks, travelers’ checks, notary services and others. The Bank is amember of numerous ATM networks and utilizes an outside processor for the processing of these automatedtransactions.
Employees
At December 31, 2008, the Bank employed 255 full-time equivalent (FTE) employees with 29 FTE’s in theSeattle market, 49 FTE’s in the Portland market, 83 FTE’s in the Eugene market, and 94 FTE’s inadministrative functions located in Eugene, Oregon. None of these employees are represented by laborunions, and management believes that the Company’s relationship with employees is good. The Companyemphasizes a positive work environment for its employees, which is validated by recognition fromindependent third parties. In December 2008, the Bank was recognized for the second consecutive year asone of Oregon’s ten most admired companies in the Portland Business Journal’s Most Admired Companiessurvey. During 2008, the Bank was also recognized for the seventh consecutive year by Oregon BusinessMagazine as one of Oregon’s Best 100 Companies for which to work, and was the highest rated financialinstitution in the state. In addition, in 2004, the Bank was named as the number one small company(employees under 250) to work for in the State of Oregon by Oregon Business Magazine. The Bank and itsemployees have also been recognized for their involvement in the community. Management continuallystrives to retain and attract top talent as well as provide career development opportunities to enhance skilllevels. A number of benefit programs are available to eligible employees, including group medical plans,paid sick leave, paid vacation, group life insurance, 401(k) plans, and equity compensation plans.
Supervision and Regulation
General
The following discussion describes elements of the extensive regulatory framework applicable to theCompany and the Bank. This regulatory framework is primarily designed for the protection of depositors,federal deposit insurance funds and the banking system as a whole, rather than specifically for theprotection of shareholders. Due to the breadth of this regulatory framework, our costs of compliancecontinue to increase in order to monitor and satisfy these requirements.
To the extent that this section describes statutory and regulatory provisions, it is qualified in its entirety byreference to those provisions. These statutes and regulations, as well as related policies, are subject tochange by Congress, state legislatures and federal and state regulators. Changes in statutes, regulations orregulatory policies applicable to us, including the interpretation or implementation thereof, could have amaterial effect on our business or operations.
Federal Bank Holding Company Regulation
General. The Company is a bank holding company as defined in the Bank Holding Company Act of 1956,as amended (“BHCA”), and is therefore subject to regulation, supervision and examination by the FederalReserve. In general, the BHCA limits the business of bank holding companies to owning or controllingbanks and engaging in other activities closely related to banking. The Company must file reports with andprovide the Federal Reserve such additional information as it may require. Under the Financial ServicesModernization Act of 1999, a bank holding company may apply to the Federal Reserve to become afinancial holding company, and thereby engage (directly or through a subsidiary) in certain expandedactivities deemed financial in nature, such as securities brokerage and insurance underwriting.
Holding Company Bank Ownership. The BHCA requires every bank holding company to obtain the priorapproval of the Federal Reserve before (i) acquiring, directly or indirectly, ownership or control of any

-7-
voting shares of another bank or bank holding company if, after such acquisition, it would own or controlmore than 5% of such shares; (ii) acquiring all or substantially all of the assets of another bank or bankholding company; or (iii) merging or consolidating with another bank holding company.
Holding Company Control of Nonbanks. With some exceptions, the BHCA also prohibits a bank holdingcompany from acquiring or retaining direct or indirect ownership or control of more than 5% of the votingshares of any company which is not a bank or bank holding company, or from engaging directly orindirectly in activities other than those of banking, managing or controlling banks, or providing services forits subsidiaries. The principal exceptions to these prohibitions involve certain non-bank activities that, bystatute or by Federal Reserve regulation or order, have been identified as activities closely related to thebusiness of banking or of managing or controlling banks.
Transactions with Affiliates. Subsidiary banks of a bank holding company are subject to restrictionsimposed by the Federal Reserve Act on extensions of credit to the holding company or its subsidiaries, oninvestments in their securities and on the use of their securities as collateral for loans to any borrower.These regulations and restrictions may limit the Company’s ability to obtain funds from the Bank for itscash needs, including funds for payment of dividends, interest and operational expenses.
Tying Arrangements. We are prohibited from engaging in certain tie-in arrangements in connection withany extension of credit, sale or lease of property or furnishing of services. For example, with certainexceptions, neither the Company nor its subsidiaries may condition an extension of credit to a customer oneither (i) a requirement that the customer obtain additional services provided by us; or (ii) an agreement bythe customer to refrain from obtaining other services from a competitor.
Support of Subsidiary Banks. Under Federal Reserve policy, the Company is expected to act as a source offinancial and managerial strength to the Bank. This means that the Company is required to commit, asnecessary, resources to support the Bank. Any capital loans a bank holding company makes to its subsidiarybanks are subordinate to deposits and to certain other indebtedness of those subsidiary banks.
State Law Restrictions. As an Oregon corporation, the Company is subject to certain limitations andrestrictions under applicable Oregon corporate law. For example, state law restrictions in Oregon includeindemnification of directors, distributions to shareholders, transactions involving directors, officers orinterested shareholders, maintenance of books, records and minutes, and observance of certain corporateformalities.
Federal and State Regulation of Pacific Continental Bank
General. The Bank is an Oregon commercial bank operating in Oregon and Washington with depositsinsured by the FDIC. As a result, the Bank is subject to supervision and regulation by the OregonDepartment of Consumer and Business Services and the FDIC. These agencies have the authority toprohibit banks from engaging in what they believe constitute unsafe or unsound bankingpractices. Additionally, the Bank’s branches in Washington are subject to supervision and regulation by theWashington Department of Financial Institutions and must comply with applicable Washington lawsregarding community reinvestment, consumer protection, fair lending and intrastate branching.
Community Reinvestment. The Community Reinvestment Act of 1977 requires that, in connection withexaminations of financial institutions within their jurisdiction, the Federal Reserve or the FDIC evaluate therecord of the financial institution in meeting the credit needs of its local communities, including low andmoderate-income neighborhoods, consistent with the safe and sound operation of the institution. A bank’scommunity reinvestment record is also considered by the applicable banking agencies in evaluatingmergers, acquisitions and applications to open a branch or facility.
Insider Credit Transactions. Banks are also subject to certain restrictions imposed by the Federal ReserveAct on extensions of credit to executive officers, directors, principal shareholders or any related interests ofsuch persons. Extensions of credit (i) must be made on substantially the same terms, including interest ratesand collateral, and follow credit underwriting procedures that are at least as stringent as those prevailing atthe time for comparable transactions with persons not covered above and who are not employees; and (ii)must not involve more than the normal risk of repayment or present other unfavorable features. Banks are

-8-
also subject to certain lending limits and restrictions on overdrafts to insiders. A violation of theserestrictions may result in the assessment of substantial civil monetary penalties, the imposition of a ceaseand desist order, and other regulatory sanctions.
Regulation of Management. Federal law (i) sets forth circumstances under which officers or directors of abank may be removed by the institution's federal supervisory agency; (ii) places restraints on lending by abank to its executive officers, directors, principal shareholders, and their related interests; and (iii) prohibitsmanagement personnel of a bank from serving as a director or in other management positions of anotherfinancial institution whose assets exceed a specified amount or which has an office within a specifiedgeographic area.
Safety and Soundness Standards. Federal law imposes certain non-capital safety and soundness standardsupon banks. These standards cover internal controls, information systems and internal audit systems, loandocumentation, credit underwriting, interest rate exposure, asset growth, compensation, fees and benefits,such other operational and managerial standards as the agency determines to be appropriate, and standardsfor asset quality, earnings and stock valuation. An institution that fails to meet these standards must developa plan acceptable to its regulators, specifying the steps that the institution will take to meet the standards.Failure to submit or implement such a plan may subject the institution to regulatory sanctions.
State Assessments. Washington state banks and out of state banks with branches in Oregon that hold publicfunds are considered public depositories and are subject to pro rata assessments for the loss of publicdeposits held at a failed Washington or Oregon bank, respectively, that exceed federal deposit insurancelimits and other coverage. Due to the current economic climate it is anticipated that there will be bankfailures nationwide, and we may face increased costs if a Washington or Oregon state public depositorybank fails and we are assessed for a net losses of such public deposits held at the failed institution.
Interstate Banking and Branching
The Riegle-Neal Interstate Banking and Branching Efficiency Act of 1994 (“Interstate Act”) relaxed priorinterstate branching restrictions under federal law by permitting nationwide interstate banking andbranching under certain circumstances. Generally, bank holding companies may purchase banks in anystate, and states may not prohibit these purchases. Additionally, banks are permitted to merge with banks inother states, as long as the home state of neither merging bank has opted out under the legislation. TheInterstate Act requires regulators to consult with community organizations before permitting an interstateinstitution to close a branch in a low-income area. Federal banking agency regulations prohibit banks fromusing their interstate branches primarily for deposit production and the federal banking agencies haveimplemented a loan-to-deposit ratio screen to ensure compliance with this prohibition.
Oregon and Washington have both enacted “opting in” legislation in accordance with the Interstate Actprovisions allowing banks to engage in interstate merger transactions, subject to certain “aging”requirements. Oregon restricts an out-of-state bank from opening de novo branches. However, once an out-of-state bank has acquired a bank within Oregon, either through merger or acquisition of all or substantiallyall of the bank's assets, the out-of-state bank may open additional branches within Oregon. UnderWashington law, an out-of-state bank may, subject to Department of Financial Institutions’ approval, opende novo branches in Washington or acquire an in-state branch so long as the home state of the out-of-statebank has reciprocal laws with respect to de novo branching or branch acquisitions.
Dividends
The principal source of the Company’s cash is from dividends received from the Bank, which are subject togovernment regulation and limitations. Regulatory authorities may prohibit banks and bank holdingcompanies from paying dividends in a manner that would constitute an unsafe or unsound banking practiceor would reduce the amount of its capital below that necessary to meet minimum applicable regulatorycapital requirements. Oregon law also limits a bank’s ability to pay dividends that are greater than retainedearnings without approval of the Oregon Department.

-9-
Capital Adequacy
Regulatory Capital Guidelines. Federal bank regulatory agencies use capital adequacy guidelines in theexamination and regulation of bank holding companies and banks. The guidelines are “risk-based,” meaningthat they are designed to make capital requirements more sensitive to differences in risk profiles amongbanks and bank holding companies.
Tier I and Tier II Capital. Under the guidelines, an institution’s capital is divided into two broad categories,Tier I capital and Tier II capital. Tier I capital generally consists of common stockholders’ equity, surplusand undivided profits. Tier II capital generally consists of the allowance for loan losses, hybrid capitalinstruments, and subordinated debt. The sum of Tier I capital and Tier II capital represents an institution’stotal capital. The guidelines require that at least 50% of an institution’s total capital consist of Tier Icapital.
Risk-based Capital Ratios. The adequacy of an institution’s capital is gauged primarily with reference tothe institution’s risk-weighted assets. The guidelines assign risk weightings to an institution’s assets in aneffort to quantify the relative risk of each asset and to determine the minimum capital required to supportthat risk. An institution’s risk-weighted assets are then compared with its Tier I capital and total capital toarrive at a Tier I risk-based ratio and a total risk-based ratio, respectively. The guidelines provide that aninstitution must have a minimum Tier I risk-based ratio of 4% and a minimum total risk-based ratio of 8%.
Leverage Ratio. The guidelines also employ a leverage ratio, which is Tier I capital as a percentage ofaverage total assets, less intangibles. The principal objective of the leverage ratio is to constrain themaximum degree to which a bank holding company may leverage its equity capital base. The minimumleverage ratio is 3%; however, for all but the most highly rated bank holding companies and for bankholding companies seeking to expand, regulators expect an additional cushion of at least 1% to 2%.
Prompt Corrective Action. Under the guidelines, an institution is assigned to one of five capital categoriesdepending on its total risk-based capital ratio, Tier I risk-based capital ratio, and leverage ratio, togetherwith certain subjective factors. The categories range from “well capitalized” to “criticallyundercapitalized.” Institutions that are “undercapitalized” or lower are subject to certain mandatorysupervisory corrective actions.
In 2007, the federal banking agencies, including the FDIC and the Federal Reserve, approved final rules toimplement new risk-based capital requirements. Presently, this new advanced capital adequacy framework,called Basel II, is applicable only to large and internationally active banking organizations. Basel II changesthe existing risk-based capital framework by enhancing its risk sensitivity. Whether Basel II will beexpanded to apply to banking organizations that are the size of the Company or the Bank is unclear at thistime, and what effect such regulations would have on us cannot be predicted, but we do not expect ouroperations would be significantly impacted.
Regulatory Oversight and Examination
The Federal Reserve conducts periodic inspections of bank holding companies, which are performed bothonsite and offsite. The supervisory objectives of the inspection program are to ascertain whether thefinancial strength of the bank holding company is being maintained on an ongoing basis and to determinethe effects or consequences of transactions between a holding company or its non-banking subsidiaries andits subsidiary banks. For holding companies under $10 billion in assets, the inspection type and frequencyvaries depending on asset size, complexity of the organization, and the holding company’s rating at its lastinspection.
Banks are subject to periodic examinations by their primary regulators. Bank examinations have evolvedfrom reliance on transaction testing in assessing a bank’s condition to a risk-focused approach. Theseexaminations are extensive and cover the entire breadth of operations of the bank. Generally, safety andsoundness examinations occur on an 18-month cycle for banks under $500 million in total assets that arewell capitalized and without regulatory issues, and 12-months otherwise. Examinations alternate betweenthe federal and state bank regulatory agency or may occur on a combined schedule. The frequency ofconsumer compliance and CRA examinations is linked to the size of the institution and its compliance and

-10-
CRA ratings at its most recent examinations. However, the examination authority of the Federal Reserveand the FDIC allows them to examine supervised banks as frequently as deemed necessary based on thecondition of the bank or as a result of certain triggering events.
Recent Legislation
Emergency Economic Stabilization Act of 2008. In response to the recent financial crisis, the UnitedStates government passed the Emergency Economic Stabilization Act of 2008 (the “EESA”) on October 3,2008, which provides the United States Department of the Treasury (the “Treasury”) with broad authorityto implement certain actions intended to help restore stability and liquidity to the U.S. financial markets.
Insurance of Deposit Accounts. The EESA included a provision for a temporary increase from $100,000 to$250,000 per depositor in deposit insurance effective October 3, 2008 through December 31, 2009. AfterDecember 31, 2009, deposit accounts are expected to again be insured by the FDIC, generally up to amaximum of $100,000 per separately insured depositor and up to a maximum of $250,000 for self-directedretirement accounts.
The FDIC imposes an assessment against institutions for deposit insurance. This assessment is based onthe risk category of the institution and ranges from 5 to 43 basis points of the institution’s deposits. InDecember, 2008, the FDIC adopted a rule that raises the current deposit insurance assessment ratesuniformly for all institutions by 7 basis points (to a range from 12 to 50 basis points) for the first quarter of2009. The rule also gives the FDIC the authority to alter the way it calculates federal deposit insuranceassessment rates beginning in the second quarter of 2009 and thereafter, and as necessary, to implementemergency special assessments to maintain the deposit insurance fund.
In 2006, federal deposit insurance reform legislation was enacted that (i) required the FDIC to merge theBank Insurance Fund and the Savings Association Insurance Fund into a newly created Deposit InsuranceFund; (ii) increases the amount of deposit insurance coverage for retirement accounts; (iii) allows fordeposit insurance coverage on individual accounts to be indexed for inflation starting in 2010;(iv) provides the FDIC more flexibility in setting and imposing deposit insurance assessments; and(v) provides eligible institutions credits on future assessments.
Troubled Asset Relief Program. Pursuant to the EESA, the Treasury has the ability to purchase or insure upto $700 billion in troubled assets held by financial institutions under the Troubled Asset Relief Program(“TARP”). On October 14, 2008, the Treasury announced it would initially purchase equity stakes infinancial institutions under a Capital Purchase Program (the “CPP”) of up to $350 billion of the$700 billion authorized under the TARP legislation. The CPP provides direct equity investment ofperpetual preferred stock by the Treasury in qualified financial institutions, as well as a warrant to purchasecommon stock. The Company has decided not to participate in the CPP in light of its strong capital positionin part due to a successful common stock offering during the first week of January 2009.
Temporary Liquidity Guarantee Program. In October 2008, the FDIC announced the Temporary LiquidityGuarantee Program, which has two components--the Debt Guarantee Program and the TransactionAccount Guarantee Program. Under the Transaction Account Guarantee Program any participatingdepository institution is able to provide full deposit insurance coverage for non-interest bearing transactionaccounts, regardless of the dollar amount. Under the program, effective November 14, 2008, insureddepository institutions that have not opted out of the FDIC Temporary Liquidity Guarantee Program willbe subject to a 0.10% surcharge applied to non-interest bearing transaction deposit account balances inexcess of $250,000, which surcharge will be added to the institution’s existing risk-based depositinsurance assessments. Under the Debt Guarantee Program, qualifying unsecured senior debt issued by aparticipating institution can be guaranteed by the FDIC. The Company and the Bank chose to participate inboth components of the FDIC Temporary Liquidity Guaranty Program.
American Recovery and Reinvestment Act of 2009. On February 17, 2009, the American Recovery andReinvestment Act of 2009 (“ARRA”) was signed into law. ARRA is intended to help stimulate theeconomy and is a combination of tax cuts and spending provisions applicable to a broad range of areaswith an estimated cost of $787 billion. The impact that ARRA may have on the US economy, theCompany and the Bank cannot be predicted with certainty.

-11-
Proposed Legislation
As of early 2009, additional legislation has been promulgated or is pending under EESA which is intendedto provide among other things, an injection of more capital from Treasury into financial institutionsthrough the Capital Assistance Program, establishment of a public-private investment fund for thepurchase of troubled assets and expansion of the Term Asset-Backed Securities Loan Facility to includecommercial mortgage backed-securities.
Proposed legislation is introduced in almost every legislative session that would dramatically affect theregulation of the banking industry. In light of the 2008 financial crisis and a new administration in theExecutive Branch of the federal government, it is anticipated that legislation reshaping the regulatorylandscape could be proposed in 2009. We cannot predict if any such legislation will be adopted or if it isadopted how it would affect the business of the Company or the Bank. Past history has demonstrated thatnew legislation or changes to existing laws or regulations usually results in a greater compliance burdenand therefore generally increases the cost of doing business.
Corporate Governance and Accounting Legislation
Sarbanes-Oxley Act of 2002 The Sarbanes-Oxley Act of 2002 (the “Act”) addresses, among other things,corporate governance, auditing and accounting, enhanced and timely disclosure of corporate information,and penalties for non-compliance. Generally, the Act (i) requires chief executive officers and chief financialofficers to certify to the accuracy of periodic reports filed with the Securities and Exchange Commission(the “SEC”); (ii) imposes specific and enhanced corporate disclosure requirements; (iii) accelerates the timeframe for reporting of insider transactions and periodic disclosures by public companies; (iv) requirescompanies to adopt and disclose information about corporate governance practices, including whether ornot they have adopted a code of ethics for senior financial officers and whether the audit committee includesat least one “audit committee financial expert;” and (v) requires the SEC, based on certain enumeratedfactors, to regularly and systematically review corporate filings.
To deter wrongdoing, the Act (i) subjects bonuses issued to top executives to disgorgement if a restatementof a company's financial statements was due to corporate misconduct; (ii) prohibits an officer or directormisleading or coercing an auditor; (iii) prohibits insider trades during pension fund “blackout periods”; (iv)imposes new criminal penalties for fraud and other wrongful acts; and (v) extends the period during whichcertain securities fraud lawsuits can be brought against a company or its officers.
As a publicly reporting company, we are subject to the requirements of the Act and related rules andregulations issued by the SEC and NASDAQ. After enactment, we updated our policies and procedures tocomply with the Act’s requirements and have found that such compliance, including compliance withSection 404 of the Act relating to management control over financial reporting, has resulted in significantadditional expense for the Company. We anticipate that we will continue to incur such additional expense inour ongoing compliance.
Anti-terrorism Legislation
USA Patriot Act of 2001. The Uniting and Strengthening America by Providing Appropriate ToolsRequired to Intercept and Obstruct Terrorism Act of 2001, intended to combat terrorism, was renewed withcertain amendments in 2006 (the “Patriot Act”). Certain provisions of the Patriot Act were made permanentand other sections were made subject to extended “sunset” provisions. The Patriot Act, in relevant part, (i)prohibits banks from providing correspondent accounts directly to foreign shell banks; (ii) imposes duediligence requirements on banks opening or holding accounts for foreign financial institutions or wealthyforeign individuals; (iii) requires financial institutions to establish an anti-money-laundering complianceprogram; and (iv) eliminates civil liability for persons who file suspicious activity reports. The Act alsoincludes provisions providing the government with power to investigate terrorism, including expandedgovernment access to bank account records. While the Patriot Act has had minimal affect on our recordkeeping and reporting expenses, we do not believe that the renewal and amendment will have an adverseeffect on our business or operations.

-12-
Financial Services Modernization
Gramm-Leach-Bliley Act of 1999. The Gramm-Leach-Bliley Financial Services Modernization Act of1999 brought about significant changes to the laws affecting banks and bank holding companies. Generally,the Act (i) repeals historical restrictions on preventing banks from affiliating with securities firms; (ii)provides a uniform framework for the activities of banks, savings institutions and their holding companies;(iii) broadens the activities that may be conducted by national banks and banking subsidiaries of bankholding companies; (iv) provides an enhanced framework for protecting the privacy of consumerinformation and requires notification to consumers of bank privacy policies; and (v) addresses a variety ofother legal and regulatory issues affecting both day-to-day operations and long-term activities of financialinstitutions. Bank holding companies that qualify and elect to become financial holding companies canengage in a wider variety of financial activities than permitted under previous law, particularly with respectto insurance and securities underwriting activities.
Financial Services Regulatory Relief Act of 2006. In 2006, the President signed the Financial ServicesRegulatory Relief Act of 2006 into law (the “Relief Act”). The Relief Act amends several existing bankinglaws and regulations, eliminates some unnecessary and overly burdensome regulations of depositoryinstitutions and clarifies several existing regulations. The Relief Act, among other things, (i) authorizes theFederal Reserve Board to set reserve ratios; (ii) amends regulations of national banks relating to shareholdervoting and granting of dividends; (iii) amends several provisions relating to loans to insiders, regulatoryapplications, privacy notices, and golden parachute payments; and (iv) expands and clarifies theenforcement authority of federal banking regulators. Our business, expenses, and operations have not beensignificantly impacted by this legislation.
Effects of Government Monetary Policy
Our earnings and growth are affected not only by general economic conditions, but also by the fiscal andmonetary policies of the federal government, particularly the Federal Reserve. The Federal Reserveimplements national monetary policy for such purposes as curbing inflation and combating recession, andits open market operations in U.S. government securities, control of the discount rate applicable toborrowings from the Federal Reserve, and establishment of reserve requirements against certain deposits,influence the growth of bank loans, investments and deposits, and also affect interest rates charged on loansor paid on deposits. The nature and impact of future changes in monetary policies, such as the recentlowering of the Federal Reserve’s discount rate, and their impact on us cannot be predicted with certainty.

-13-
Statistical Information
Selected Quarterly Information
The following chart contains data for the last eight quarters ending December 31, 2008. All data, exceptnumber of shares and per share data, is in thousands of dollars.
YEAR
QUARTER Fourth Third Second First Fourth Third Second First
Interest income $ 16,544 $ 16,680 $ 16,215 $ 16,506 $ 17,350 $ 17,419 $ 17,751 $ 16,647
Interest expense 3,350 4,377 4,057 4,890 6,157 6,441 6,813 6,329
Net interest income 13,194 12,203 12,158 11,616 11,193 10,978 10,938 10,318
Provision for loan loss 1,050 1,050 925 575 275 125 125 200
Noninterest income 1,042 1,047 1,163 1,017 1,030 997 949 948
Noninterest expense 7,435 7,497 7,463 7,167 6,591 6,399 6,513 6,358
Net income 3,833 3,020 3,007 3,079 3,307 3,421 3,211 2,996
PER COMMON
SHARE DATA (1)
Net income (basic) $ 0.32 $ 0.25 $ 0.25 $ 0.26 $ 0.28 $ 0.29 $ 0.26 $ 0.25
Net income (diluted) $ 0.32 $ 0.25 $ 0.25 $ 0.26 $ 0.28 $ 0.29 $ 0.26 $ 0.25
Cash dividends $ 0.10 $ 0.10 $ 0.10 $ 0.10 $ 0.09 $ 0.09 $ 0.09 $ 0.08
WEIGHTED
AVERAGE SHARES
OUTSTANDING
Basic 12,039,081 11,978,460 11,962,560 11,940,064 11,896,187 11,848,059 11,814,931 11,761,039
Diluted 12,095,066 12,033,898 12,030,063 12,005,710 11,995,087 11,981,303 11,971,279 11,967,135
(1) All prior year per share data has been retroactively adjusted for the 10% stock dividend paid in June 2007.
2008 2007
Investment Portfolio
The following chart contains information regarding the Company’s investment portfolio. All of the Company’sinvestment securities are accounted for as available-for-sale and are reported at estimated fair value. Thedifference between estimated fair value and amortized cost, net of deferred taxes, is recorded as a separatecomponent of stockholders’ equity.
2008 2007 2006
US Treasury, US Government agencies and corporations $ 2,029 $ 10,541 $ 14,501Obligations of states and political subdivisions 7,485 7,514 5,596
Other mortgage-backed securities 45,419 35,939 18,686
Total $ 54,933 $ 53,994 $ 38,783
(dollars in thousands)
December 31,
INVESTMENT PORTFOLIOESTIMATED FAIR VALUE

-14-
The following chart presents the fair value of each investment category by maturity date and includes aweighted average yield for each period. Mortgage-backed securities have been classified based on theirDecember 31, 2008 projected average life.
After One After Five
Year But Years ButWithin Within Within After Ten
One Year Five Years Ten Years YearsAmount Yield Amount Yield Amount Yield Amount Yield
US Treasury, US Government
agencies and agency
mortgage-backed securities $16,984 4.19% $27,875 6.32% $ 1,691 5.52% $ 898 6.29%
Obligations of states and
political subdivisions 1,026 3.39% 1,498 4.34% 4,961 3.87% -
Total $18,010 4.15% $29,373 6.21% $ 6,652 4.29% $ 898 6.29%
SECURITIES AVAILABLE-FOR-SALE
(dollars in thousands)
Loan Portfolio
Loans represent a significant portion of the Company’s total assets. Average balance and average rates paid bycategory of loan for the fourth quarter and full year 2008 is included in the Company’s “Management’sDiscussion and Analysis of Financial Condition and Results of Operations” included later in this report. Thefollowing tables contain information related to the Company’s loan portfolio, including loans held for sale, forthe five-year period ended December 31, 2008.
LOAN PORTFOLIO
December 31,
2008 2007 2006 2005 2004
Commercial loans $ 233,513 $ 188,940 $ 169,566 $ 160,988 $ 107,538
Real estate loans 717,119 627,140 590,855 507,479 341,111Real estate loans held for sale 410 - 2,140 642 2,072
Consumer loans 7,455 8,226 9,168 12,463 10,380958,497 824,306 771,729 681,572 461,101
Deferred loan origination fees, net (1,730) (1,984) (2,489) (2,609) (2,061)956,767 822,322 769,240 678,963 459,040
Allowance for loan losses (10,980) (8,675) (8,284) (7,792) (5,224)
$ 945,787 $ 813,647 $ 760,956 $ 671,171 $ 453,816
(dollars in thousands)
The following table presents loan portfolio information by loan category related to maturity and repricingsensitivity. Variable rate loans are included in the time frame in which the interest rate on the loan could befirst adjusted. At December 31, 2008, the Bank had approximately $280,000 of variable rate loans at theirfloors that are included in the below analysis. Real Estate loans include Loans Held for Sale

-15-
MATURITY AND REPRICING DATA FOR LOANS
Commercial Real Estate Consumer Total(dollars in thousands)
Three months or less $ 88,576 $ 306,399 $ 5,143 $ 400,118
Over three months through 12 months 3,518 46,267 432 50,217
Over 1 year through 3 years 27,758 128,628 489 156,875
Over 3 years through 5 years 49,594 166,595 818 217,007
Over 5 years through 15 years 62,177 53,672 476 116,325
Thereafter 1,890 15,968 97 17,955
Total loans $ 233,513 $ 717,529 $ 7,455 $ 958,497
Loan Concentrations
At December 31, 2008, loans to dental professionals totaled $122,205 and represented 12.8% ofoutstanding loans. At December 31, 2008, residential construction loans totaled $74,532 and represented7.8% of outstanding loans. In addition, at December 31, 2008, unfunded loan commitments for residentialconstruction totaled $19,818. Approximately 75.0% of the Bank’s loans are secured by real estate.Management believes the granular nature of the portfolio, from industry mix, geographic location and loansize, continues to disperse risk concentration to some degree.
Nonperforming Assets
The following table presents nonperforming loans and assets as of the date shown.
2008 2007 2006 2005 2004
Nonaccrual loans $ 4,137 $ 4,122 $ - $ 180 $ 1,004
90 or more days past due and still accruing - - - - 213
Total nonperforming loans 4,137 4,122 - 180 1,217
Government guarantees (239) (451) - (28) (101)
Net nonperforming loans 3,898 3,671 - 152 1,116
Foreclosed assets 3,806 423 - 131 262
Total nonperforming assets $ 7,704 $ 4,094 $ - $ 283 $ 1,378
Nonperforming assets as a percentage of
of total assets 0.71% 0.43% 0.00% 0.04% 0.27%
NONPERFORMING ASSETS
December 31,
(dollars in thousands)
If interest on nonaccrual loans had been accrued, such income would have been approximately $173, $140, and$14, respectively, for years 2008, 2007 and 2006. The above table does not include $2,234 of impaired loansless than 90 days past due and still accruing interest as of December 31, 2008.
Allowance for Loan Loss
The following chart presents information about the Company’s allowances for loan losses. Management andthe Board of Directors evaluate the allowance monthly and consider the amount to be adequate to absorbpossible loan losses.

-16-
ALLOWANCE FOR LOAN LOSS
December 31,
2008 2007 2006 2005 2004
Balance at beginning of year $ 8,675 $ 8,284 $ 7,792 $ 5,224 $ 5,225
Charges to the allowanceReal estate loans (1,235) - - (214) (79)
Consumer loans (118) (46) (71) (106) (269)Commercial (124) (350) (152) (316) (168)
Total charges to the allowance (1,477) (396) (223) (636) (516)Recoveries against the allowance
Real estate loans 128 15 4 37 73
Consumer loans 23 27 20 56 54Commercial 31 20 91 31 70
Total recoveries against the allowance 182 62 115 124 197
Acquisition - - - 2,014 -Provisions 3,600 725 600 1,100 500
Unfunded commitments * - - - (34) (182)Balance at end of the year $10,980 $ 8,675 $ 8,284 $ 7,792 $ 5,224
Net charge offs as a percentage of totalaverage loans 0.15% 0.04% 0.01% 0.10% 0.08%
(dollars in thousands)
* Allowance for unfunded commitments is presented as part of the other liabilities in the balance sheet and hasbeen omitted from this table since implementation of this accounting practice in 2005.
The following table sets forth the allowance for loan losses allocated by loan type at December 31, 2008:
Real estate loans 7,586$
Consumer loans 63
Commercial 2,253
Unallocated 1,078
Allowance for loan losses 10,980$
During 2008, the Bank recorded a provision for loan losses of $3,600 compared to $725 for the year 2007.The increase in the loan loss provision was related to loan growth and moderate deterioration in the overallcredit quality of the loan portfolio during 2008. At December 31, 2008, the recorded investment in certainloans totaling $6,132, net of government guarantees, was considered impaired. A specific reserve of $887 isprovided for these loans and is included in the $10,980 allowance for loan losses at December 31, 2008.
Deposits
Deposits represent a significant portion of the Company’s liabilities. Average balance and average rates paidby category of deposit is included in the Company’s “Management’s Discussion and Analysis of FinancialCondition and Results of Operations” of this report. The chart below details the Company’s time deposits atDecember 31, 2008. The Company does not have any foreign deposits. Variable rate deposits are listed byfirst repricing opportunity.

-17-
Time Deposits Time Depositsof $100,000 of less than Total
Or more $100,000 Time Deposits(dollars in thousands)
Three months or less $ 45,558 $ 43,940 $ 89,498
Over three months through twelve months 8,153 25,521 33,674Over one year through three years 9,596 11,886 21,482Over three years 3,788 2,103 5,891
$ 67,095 $ 83,450 $ 150,545
TIME DEPOSITS
Short-term Borrowings
The Company uses short-term borrowings to fund fluctuations in deposits and loan demand. The Company’ssubsidiary, Pacific Continental Bank, has access to both secured and unsecured overnight borrowing lines. AtDecember 31, 2008, the Bank had lines totaling approximately $495,188. The Federal Home Loan Bank ofSeattle (FHLB) also provides a secured borrowing line using a blanket pledge of commercial real estate loans.The Bank’s FHLB borrowing limit at December 31, 2008 was 30% of assets or $327,253, subject to sufficientcollateral and stock investment. At December 31, 2008, available unsecured borrowing lines with variouscorrespondent banks and a secured line with the Federal Reserve Bank of San Francisco was approximately$167,935.
2008 2007 2006 2005
Federal Funds Purchased, FHLB CMA, Federal Reserve,& Short Term Advances
Average interest rateAt year end 0.48% 4.39% 5.55% 4.33%
For the year 2.25% 5.25% 5.31% 3.35%
Average amount outstanding for the year $ 182,301 $ 93,733 $ 73,171 $ 17,693
Maximum amount outstanding at any month end $ 213,225 $ 151,360 $ 99,410 $ 34,825
Amount outstanding at year end $ 193,000 $ 151,360 $ 99,410 $ 24,000
SHORT-TERM BORROWINGS
(dollars in thousands)
Long-term Borrowings
In addition to the short-term borrowings, at December 31, 2008, the Bank had other FHLB borrowings totaling$45,500 with a weighted average interest rate of 4.14% and a remaining average maturity of approximately 2.3years.
The Company’s long-term borrowings consist of $8,248 in junior subordinated debentures originated onNovember 28, 2005 and due on January 7, 2036. The interest rate on the debentures is 6.265% untilNovember 2010 after which it is converted to a floating rate of three-month LIBOR plus 135 basis points.

-18-
ITEM 1A Risk Factors
The following is a discussion of the most significant risks and uncertainties that may affect our business,financial condition and future results.
We cannot predict the effect of the national economic situation on our future results of operations orstock trading price.
The national economy and the financial services sector in particular, are currently facing challenges of ascope unprecedented in recent history. No one can predict the severity or duration of this nationaldownturn, which has adversely impacted the markets we serve. Any further deterioration in our marketswould have an adverse effect on our business, financial condition, results of operations and prospects, andcould also cause the trading price of our stock to decline.
We cannot predict the effect of recent and pending federal legislation.
On October 3, 2008, Congress enacted the Emergency Economic Stabilization Act of 2008 (“EESA”),which provides the United States Treasury Department (“Treasury”) with broad authority to implementaction intended to help restore stability and liquidity to the US financial markets. The EESA also increasesthe amount of deposit account insurance coverage from $100,000 to $250,000 effective until December 31,2009.
As of early 2009, additional legislation has been promulgated or is pending under EESA which is intendedto provide, among other things, an injection of capital from the Treasury into financial institutions throughthe Capital Assistance Program, establishment of a public-private investment fund for the purchase oftroubled assets, and the expansion of the Term Asset-Backed Securities Loan Facility to includecommercial mortgage backed-securities.
The full effect of the broad legislation already enacted and related legislation expected to be enacted in thenear future on the national economy and financial institutions, particularly on mid-sized institutions like us,cannot now be predicted.
Our ability to access markets for funding and acquire and retain customers could be adverselyaffected to the extent the financial service industry’s reputation is damaged.
Reputation risk is the risk to liquidity, earnings and capital arising from negative publicity regarding thefinancial services industry. The financial services industry continues to be featured in negative headlinesabout the global and national credit crisis and the resulting stabilization legislation enacted by the U.S.federal government. These reports can be damaging to the industry’s image and potentially erode consumerconfidence in insured financial institutions, such as our banking subsidiary.
Fluctuating interest rates can adversely affect our profitability
Our profitability is dependent to a large extent upon net interest income, which is the difference (or“spread”) between the interest earned on loans, securities and other interest-earning assets and interest paidon deposits, borrowings, and other interest-bearing liabilities. Because of the differences in maturities andrepricing characteristics of our interest-earning assets and interest-bearing liabilities, changes in interestrates do not produce equivalent changes in interest income earned on interest-earning assets and interestpaid on interest-bearing liabilities. Accordingly, fluctuations in interest rates could adversely affect ourinterest rate spread, and, in turn, our profitability. We seek to manage our interest rate risk within wellestablished guidelines. Generally, the Company seeks an asset and liability structure that insulates netinterest income from large deviations attributable to changes in market rates.
The current economic downturn in the market areas we serve may cause us to have lower earningsand could increase our credit risk associated with our loan portfolio.
The inability of borrowers to repay loans can erode our earnings. Substantially all of our loans are tobusinesses and individuals in Washington and Oregon, and a continuing decline in the economy of these

-19-
market areas could impact us adversely. Recently, a series of large Puget Sound-based businesses,including Microsoft, Starbucks, and Boeing, have announced or began to implement substantial employeelayoffs and scaled back plans for future growth. Additionally, the recent acquisition of Washington Mutualby JPMorgan Chase & Co. has also resulted in substantial employee layoffs, and is expected to result in asubstantial increase in office space availability in downtown Seattle. Oregon has also seen a similar patternof large lay offs in major metropolitan areas, a continued decline in housing prices, and a significantincrease in the state’s unemployment rate. A further deterioration in economic conditions in the marketareas we serve could result in the following consequences, any of which could have an adverse impact onour prospects, results of operations and financial condition:
loan delinquencies may increase further, migrating into our substantial commercial real estateand business lending portfolios;
collateral for loans made may decline further in value, in turn reducing customers’ borrowingpower, reducing the value of assets and collateral associated with existing loans;
demand for banking products and services may decline; and
low cost or non-interest bearing deposits may decrease.
Our allowance for loan losses may not be adequate to cover actual loan losses, which could adverselyaffect our earnings
We maintain an allowance for loan losses in an amount that we believe is adequate to provide for lossesinherent in the portfolio. While we strive to carefully manage and monitor credit quality and to identifyloans that may become nonperforming, at any time there are loans included in the portfolio that will resultin losses, but that have not been identified as nonperforming or potential problem loans. By managing ourcredit quality, we attempt to identify deteriorating loans before they become nonperforming assets andadjust the loan loss reserve accordingly. However, because future events are uncertain, there may be loansthat deteriorate to a nonperforming status in an accelerated time frame. As a result, future additions to theallowance may be necessary. Because the loan portfolio contains a significant number of commercial andcommercial real estate loans with relatively large balances, the deterioration of one or a few of these loansmay cause a significant increase in nonperforming loans, requiring an increase to the loan loss allowance.Additionally, future additions to the allowance may be required based on changes in the loans comprisingthe portfolio and changes in the financial condition of borrowers, such as may result from changes ineconomic conditions or as a result of incorrect assumptions by management in determining the allowance.Additionally, federal banking regulators, as an integral part of their supervisory function, periodicallyreview our allowance for loan losses. These regulatory agencies may require us to recognize further loanloss provisions or charge-offs based upon their judgments, which may be different from ours. Any increasein the allowance for loan losses could have a negative effect on our financial condition and results ofoperation.
Concentration in real estate market
We have a high concentration of loans secured by real estate. While the Pacific Northwest typically lagsthe national economy, the affects of the economic deterioration are now significantly impacting our marketarea. Our business activities and credit exposure are concentrated in loans secured by real estate. Furtherdecline in the real estate markets that we serve could negatively affect our business because the collateralsecuring those loans may decrease in value. A continued downturn in the local economy could have amaterial adverse effect both on the borrowers’ ability to repay these loans, as well as the value of the realproperty held as collateral. Our ability to recover on defaulted loans by foreclosing and selling the realestate collateral would then be diminished and we be would more likely to suffer losses on defaulted loans.
Tightening of credit markets and liquidity risk
A continued tightening of the credit market and the inability to obtain adequate money to fund continuedloan growth may negatively affect our asset growth and liquidity position and, therefore, our earnings

-20-
capability. In addition to core deposit growth, maturity of investment securities and loan payments, theCompany also relies on alternative funding sources through correspondent banking and a borrowing linewith the FHLB to fund loans. In the event the current economic downturn continues, particularly in thehousing market, these resources could be negatively affected, both as to price and availability, which wouldlimit and or raise the cost of the funds available to the Company.
If the goodwill we have recorded in connection with acquisitions becomes impaired, it could have anadverse impact on our earnings and capital.
Accounting standards require that we account for acquisitions using the purchase method of accounting.Under purchase accounting, if the purchase price of an acquired company exceeds the fair value of its netassets, the excess is carried on the acquirer’s balance sheet as goodwill. At December 31, 2008, we hadapproximately $22,031 of goodwill on our balance sheet. In accordance with generally accepted accountingprinciples, our goodwill is not amortized but rather evaluated for impairment on an annual basis or morefrequently if events or circumstances indicate that a potential impairment exists. Such evaluation is basedon a variety of factors, including the quoted price of our common stock, market prices of common stocks ofother banking organizations, common stock trading multiples, discounted cash flows, and data fromcomparable acquisitions. There can be no assurance that future evaluations of goodwill will not result infindings of impairment and write-downs, which could be material.
We may be required in the future to recognize an impairment with respect to investment securities,including the FHLB stock we hold.
Under the current economic downturn, investment portfolios continue to record significant unrecognizedlosses. The Company’s current securities portfolio contains credit risk associated with whole loan privatemortgage-backed securities. The Company may continue to observe declines in the fair market value ofthese securities. The company evaluates the securities portfolio for any other than temporary impairmentunder EITF 03-1 on a monthly basis, and as of December 31, 2008, we did not recognize any securities asother than temporarily impaired. There can be no assurance, however, that future evaluations of thesecurities portfolio will not require us to recognize an impairment charge with respect to such holdings.
In addition, as a condition to membership in the Federal Home Loan Bank of Seattle (“FHLB”), we arerequired to purchase and hold a certain amount of FHLB stock. Our stock purchase requirement is based, inpart, upon the outstanding principal balance of advances from the FHLB. The FHLB stock held by theCompany is carried at cost and is subject to recoverability testing under applicable accounting standards.The FHLB recently reported that due to ongoing turmoil in the capital and mortgage markets, it will likelyreport a risk-based capital deficiency as of December 31, 2008. The FHLB has indicated that it believesthat it has adequate capital to cover the risks reflected on its balance sheet. Accordingly, as of December31, 2008, we did not recognize an impairment charge related to our FHLB stock holdings. There can be noassurance, however, that future negative changes to the financial condition of the FHLB may not require usto recognize an impairment charge with respect to such holdings.
The FDIC has increased insurance premiums to rebuild and maintain the federal deposit insurancefund and we may separately incur state statutory assessments in the future.
Based on recent events and the state of the economy, the FDIC has increased federal deposit insurancepremiums by 7 basis points for the first quarter of 2009. The increase of these premiums will add to ourcost of operations and could have a significant impact on the Company. New rules governing depositinsurance premiums are expected to go into effect on April 1, 2009. These new rules are intended to makeassessments more balanced by requiring riskier institutions to pay a larger share.
On February 27, 2009, the FDIC adopted an interim rule imposing an emergency special assessment of 20basis points on insured institutions, and granting the FDIC the authority to impose an additional emergencyspecial assessment after June 30, 2009 of up to 10 basis points if necessary. The assessment will becalculated on June 30, 2009 deposit balances and collected on September 30, 2009. Based on theCompany’s December 31, 2008 deposits subject to FDIC insurance assessments, the special assessment willbe approximately $1.5 million. Depending on any future losses that the FDIC insurance fund may suffer

-21-
due to failed institutions, there can be no assurance that there will not be additional significant premiumincreases or special assessments in order to replenish the fund.
Further, under Oregon and Washington state laws, the Company may incur additional costs if one or moreOregon or Washington state banks that hold public deposits fail, since, as a public depositary, we aresubject to Oregon and Washington statutory pro-rata assessments to cover any net losses in public depositsnot otherwise covered by federal deposit insurance or other means.
We operate in a highly regulated environment and may be adversely affected by changes in federalstate and local laws and regulations.
We are subject to extensive regulation, supervision and examination by federal and state bankingauthorities. Any change in applicable regulations or federal, state or local legislation could have asubstantial impact on us and our operations. Additional legislation and regulations that could significantlyaffect our powers, authority and operations may be enacted or adopted in the future, which could have amaterial adverse effect on our financial condition and results of operations. Further, regulators havesignificant discretion and authority to prevent or remedy unsafe or unsound practices or violations of lawsor regulations by financial institutions and holding companies in the performance of their supervisory andenforcement duties. These powers recently have been utilized more frequently due to the serious national,regional and local economic conditions we are facing. The exercise of regulatory authority may have anegative impact on our financial condition and results of operations.
ITEM 1B Unresolved Staff Comments
None
ITEM 2 Properties
The principal properties of the registrant are comprised of the banking facilities owned by the Bank. TheBank operates fourteen full service facilities. The Bank owns a total of eight buildings and, with theexception of two buildings, owns the land on which these buildings are situated. Significant propertiesowned by the Bank are as follows:
1) Three-story building and land with approximately 30,000 square feet located on Olive Street in Eugene,Oregon.
2) Building with approximately 4,000 square feet located on West 11th Avenue in Eugene, Oregon. Thebuilding is on leased land.
3) Building and land with approximately 8,000 square feet located on High Street in Eugene, Oregon.
4) Three-story building and land with approximately 31,000 square feet located in Springfield, Oregon.The Bank occupies approximately 5,500 square feet of the first floor and approximately 5,900 squarefeet on the second floor and leases out, or is seeking to lease out, the remaining space.
5) Building and land with approximately 3,500 square feet located in Beaverton, Oregon.
6) Building and land with approximately 2,000 square feet located in Junction City, Oregon.
7) Building and land with approximately 5,000 square feet located near the Convention Center inPortland, Oregon.
8) Building with approximately 6,800 square feet located at the Nyberg Shopping Center in Tualatin,Oregon. The building is on leased land.
The Bank leases facilities for branch offices in Downtown Seattle, Washington, Downtown Bellevue,Washington, Downtown Portland, Oregon, and Vancouver, Washington. During 2008, the Bank expandedits leased facilities in Downtown Bellevue and Downtown Portland. In addition, the Bank leases a portion

-22-
of an adjoining building to the High Street office for administrative and training functions. Managementconsiders all owned and leased facilities adequate for current use.
ITEM 3 Legal Proceedings
As of the date of this report, neither the Company nor the Bank or any of its subsidiaries is party to any materialpending legal proceedings, including proceedings of governmental authorities, other than ordinary routinelitigation incidental to the business of the Bank.
ITEM 4 Submissions of Matters to a Vote of Security Holders
There were no matters submitted to a vote of security holders during the fourth quarter of 2008.
PART II
ITEM 5 Market for Company’s Common Equity, Related Stockholder Matters and Purchases ofEquity Securities
Issuer Purchases of Securities
The Company did not repurchase any shares of its common stock during the fourth quarter of 2008. TheCompany had no sales of securities during the past three years, other than those issued pursuant to its stockoption plans.
Dividends
The Company pays cash dividends on a quarterly basis, typically in March, June, September and Decemberof each year. The Board of Directors considers the dividend amount quarterly and takes a broadperspective in its dividend deliberations including a review of recent operating performance, capital levels,and loan concentrations as a percentage of capital, and growth projections. The Board also considersdividend payout ratios, dividend yield, and other financial metrics in setting the quarterly dividend. TheCompany declared and paid cash dividends of $0.40 per share for the year 2008. That compares to cashdividends of $0.35 per share paid for the year 2007, when adjusted for the 10% stock dividend paid in June2007.
Equity Compensation Plan Information
Year Ended December 31, 2008Number of Shares to beIssued Upon Exercise ofOutstanding Options,
Warrants and Rights (2)
Weighted-Average ExercisePrice of Outstanding
Options, Warrants andRights (2)
Number of Shares RemainingAvailable for Future IssuanceUnder Equity Compensation
Plans (2)
Equity compensation plansapproved by securityholders(1)
895,095 $ 14.24 174,906
Equity compensation plansnot approved by securityholders
0 $0 0
(1) Under the Company’s respective equity compensation plans, the Company may grant incentive stockoptions and non-qualified stock options, restricted stock, restricted stock units and stock appreciationrights to its employees and directors, however only employees may receive incentive stock options.
(2) All amounts have been adjusted to reflect subsequent stock splits and stock dividends.

-23-
Market Information
The Company’s common stock trades on the NASDAQ Global Market under the symbol PCBK. At March6, 2009, the Company had 12,862,691 shares of common stock outstanding held by approximately 1,000shareholders.
The high, low and closing sales prices (based on daily closing price) for the last eight quarters are shown inthe table below. All share prices for the first and second quarters of 2007 have been retroactively adjustedto reflect the 10% stock dividend paid in June 2007.
YEAR 2008 2007
QUARTER Fourth Third Second First Fourth Third Second First
Market value:
High $15.00 $15.22 $14.93 $14.44 $16.00 $16.41 $17.27 $18.95
Low 11.58 9.26 10.99 13.75 12.00 14.32 15.18 16.86
Close 14.97 14.64 10.99 13.90 12.52 15.57 16.20 17.03
The information contained in the following chart entitled “Total Return Performance” is not considered tobe “soliciting material”, or “filed”, or incorporated by reference in any past or future filing by the Companyunder the Securities Exchange Act of 1934 or the Securities Act of 1933 unless and only to the extent thatthe Company specifically incorporates it by reference.
STOCK PERFORMANCE GRAPH
Total Return Performance
75
100
125
150
175
12/31/03 12/31/04 12/31/05 12/31/06 12/31/07 12/31/08
Ind
ex
Va
lue
Pacific Continental Corporation
Russell 2000
SNL Bank $500M-$1B Index
The above graph and following table compares the total cumulative shareholder return on the Company’sCommon Stock, based on reinvestment of all dividends, to the cumulative total returns of the Russell 2000

-24-
Index and SNL Securities $500 to $1 Billion Bank Asset Size Index. The graph assumes $100 invested onDecember 31, 2003, in the Company’s Common Stock and each of the indices.
Period Ending
Index 12/31/03 12/31/04 12/31/05 12/31/06 12/31/07 12/31/08
Pacific Continental Corporation 100.00 126.31 129.69 161.66 117.02 144.10Russell 2000 100.00 118.33 123.72 146.44 144.15 95.44SNL Bank $500M-$1B Index 100.00 123.42 121.31 140.38 102.26 84.81

-25-
ITEM 6 Selected Financial Data
Selected financial data for the past five years is shown in the table below.($ in thousands, except for per share data)
2008 2007 2006 2005 2004
For the yearNet interest income 49,271$ 43,426$ 40,057$ 30,240$ 24,952$
Provision for loan losses 3,600$ 725$ 600$ 1,100$ 500$
Noninterest income 4,269$ 3,925$ 4,401$ 4,083$ 4,463$Noninterest expense 29,562$ 25,861$ 23,791$ 18,134$ 16,041$
Income taxes 7,439$ 7,830$ 7,412$ 5,510$ 4,925$Net income 12,939$ 12,935$ 12,655$ 9,578$ 7,948$
Cash dividends 4,797$ 4,175$ 3,381$ 2,556$ 2,164$
Per common share data (1)
Net income:Basic 1.08$ 1.09$ 1.09$ 0.98$ 0.84$
Diluted 1.08$ 1.08$ 1.08$ 0.95$ 0.82$Cash dividends 0.40$ 0.35$ 0.29$ 0.25$ 0.23$
Market value, end of year 14.97$ 12.52$ 17.68$ 14.45$ 14.32$
At year endAssets 1,090,843$ 949,271$ 885,351$ 791,794$ 516,630$
Loans, less allowance for loan loss (2) 945,787$ 813,647$ 760,957$ 671,171$ 453,817$
Core deposits 615,832$ 615,892$ 580,210$ 529,794$ 381,601$Total deposits 722,437$ 644,424$ 641,272$ 604,271$ 403,791$
Shareholders' equity 116,165$ 107,509$ 95,735$ 81,412$ 49,392$Tangible Equity (3) 93,261$ 84,382$ 72,109$ 57,211$ 49,116$
Average for the year
Assets 1,019,040$ 903,932$ 825,671$ 573,717$ 463,509$
Earning assets 945,856$ 832,451$ 755,680$ 533,930$ 431,374$Loans, less allowance for loan losses 882,742$ 785,132$ 712,563$ 501,541$ 398,739$
Core deposits 613,244$ 590,714$ 533,861$ 425,716$ 352,693$Total deposits 669,624$ 654,631$ 605,814$ 461,013$ 379,618$
Interest-paying liabilities 732,466$ 627,569$ 567,708$ 372,880$ 290,569$Shareholders' equity 111,868$ 103,089$ 90,238$ 54,528$ 46,043$
Financial ratios
Return on average:
Assets 1.27% 1.43% 1.53% 1.67% 1.71%Equity 11.57% 12.55% 14.02% 17.57% 17.26%
Tangible Equity (3) 14.56% 16.23% 19.12% 18.25% 17.26%Avg shareholders' equity / avg assets 10.98% 11.40% 10.93% 9.50% 9.93%
Dividend payout ratio 37.07% 32.28% 26.72% 26.69% 27.23%Risk-based capital:
Tier I capital 10.02% 10.01% 9.93% 9.32% 10.19%Total capital 11.11% 10.97% 10.98% 10.48% 11.29%
(1) Per common share data is retroactively adjusted to reflect the 10% stock dividend
and 5-for-4 stock split of 2007 and 2004, respectively.(2) Outstanding loans include loans held for sale.
(3) Tangible equity excludes goodwill and core deposit intangible related to acquisitions.

-26-
ITEM 7 Management’s Discussion and Analysis of Financial Condition and Results of Operations
The following discussion is intended to provide a more comprehensive review of the Company’s operatingresults and financial condition than can be obtained from reading the Consolidated Financial Statementsalone. The discussion should be read in conjunction with the audited financial statements and the notesincluded later in this report. All numbers, except per share data, are expressed in thousands of dollars.
In addition to historical information, this report may contain forward-looking statements within the meaningof the Private Securities Litigation Reform Act of 1995. These forward-looking statements include, but arenot limited to, statements about management’s plans, objectives, expectations and intentions that are nothistorical facts, and other statements identified by words such as “expects,” “anticipates,” “intends,”“plans,” “believes,” “should,” “projects,” “seeks,” “estimates” or words of similar meaning. These forward-looking statements are based on current beliefs and expectations of management and are inherently subjectto significant business, economic and competitive uncertainties and contingencies, many of which arebeyond the Company’s control. In addition, these forward-looking statements are subject to assumptionswith respect to future business strategies and decisions that are subject to change. The following factors,among others, could cause actual results to differ materially from the anticipated results or otherexpectations in the forward-looking statements, including those set forth in this report, or the documentsincorporated by reference:
o the risks associated with lending and potential adverse changes in credit quality;o increased loan delinquency rates;o the risks presented by a continued economic slowdown, which could adversely affect credit
quality, loan collateral values, investment values, liquidity levels, and loan originations;o changes in market interest rates, which could adversely affect our net interest income and
profitability;o legislative or regulatory changes that adversely affect our business or our ability to complete
pending or prospective future acquisitions;o reduced demand for banking products and services;o the risks presented by public stock market volatility, which could adversely affect the Company’s
stock value and the ability to raise capital in the future;o competition from other financial services companies in our markets; ando the Company’s success in managing risks involved in the foregoing.
Additional factors that could cause actual results to differ materially from those expressed in the forward-looking statements are discussed in Risk Factors in Item 1A. Please take into account that forward-lookingstatements speak only as of the date of this report or documents incorporated by reference. The Companydoes not undertake any obligation to publicly correct or update any forward-looking statement if we laterbecome aware that it is not likely to be achieved.

-27-
HIGHLIGHTS
% Change % Change2008 2007 2008 vs. 2007 2006 2007 vs. 2006
Operating revenue(1) $53,540 $47,351 13% $44,458 7%
Net income $12,939 $12,935 0% $12,655 2%
Earnings per share(2)
Basic $1.08 $1.09 -1% $1.09 0%Diluted $1.08 $1.08 0% $1.08 0%
Assets, period-end $1,090,843 $949,271 15% $885,351 7%Deposits, period-end $722,437 $644,424 12% $641,272 0%
Return on assets 1.27% 1.43% 1.53%
Return on equity 11.57% 12.55% 14.02%
Return on tangible equity(3) 14.56% 16.23% 19.12%
(1) Operating income is defined as net interest income plus noninterest income.
(2) Per share data for 2006 was retroactively adjusted to reflect the 10% stock dividend paid in June 2007.
(3) Tangible equity excludes goodwill and core deposit intangible related to acquisitions.
Net income for the year 2008 was $12,939, an increase of $4 over the $12,935 reported for the year 2007.Net income improvement in 2008 over 2007 was modest due to a significant increase in the provision forloan losses, plus growth in noninterest expenses, which offset increased operating revenues. Operatingrevenue for the year 2008 was up 13% over the year 2007 and was primarily driven by growth in netinterest income, which accounted for 92% of total operating revenue in 2008. The improvement in 2008net interest income was the result of 14% growth in average earning assets combined with a stable netinterest margin.
The Company earned $12,935 in 2007 compared to $12,655 in 2006. Growth in operating revenue wasprimarily responsible for the increased earnings in 2007 over 2006. Operating revenues were $47,351 in2007, up $2,893 or 7% over 2006. Growth in operating revenues resulted from increased net interestincome, which accounted for 92% of total operating revenue in 2007. While average earning assetsincreased 10% in 2007 over 2006, growth in net interest income in 2007 was slowed by an 8 basis pointcompression in the net interest margin.
Period-end assets at December 31, 2008 were $1,090,843, compared to $949,271 at December 31, 2007.Core deposits, which are defined as demand deposits, interest checking, money market accounts, and localtime deposits (including local time deposits over $100 thousand) constitute 85% of December 31, 2008outstanding deposits. Non-interest bearing deposits were $178,957 or 25% of total deposits at year-endDecember 31, 2008.
During 2009, the Company believes the following factors could impact reported financial results:
The current national, regional, and local recession and the effect on loan demand, the credit qualityof existing clients with lending relationships, and vacancy rates of commercial real estate properties,since a significant portion of our loan portfolio is secured by real estate.
A slowing real estate market and increases in residential home inventories for sale and the impact onresidential construction lending, delinquency and default rates of existing residential constructionloans in the Bank’s portfolio, residential mortgage lending, and refinancing activities of existinghomeowners.

-28-
The ability to grow core deposits during 2009 in a highly competitive environment where manyfinancial institutions are experiencing liquidity problems.
The availability of alternative funding sources due to disruption in the financial and capital marketsflowing from the significant downturn in the housing industry
The ability to manage noninterest expense growth in light of anticipated significant increases inregulatory costs.
The ability to attract and retain qualified and experienced bankers in all markets.
SUMMARY OF CRITICAL ACCOUNTING POLICIES
The SEC defines “critical accounting policies” as those that require the application of management’s mostdifficult, subjective, or complex judgments, often as a result of the need to make estimates about the effectof matters that are inherently uncertain and may change in future periods. Significant accounting policiesare described in Note 1 of the Notes to Consolidated Financial Statements for the year ended December 31,2008 in Item 8 of this report. Management believes that the following policies and those disclosed in theNotes to Consolidated Financial Statements should be considered critical under the SEC definition:
Allowance for Loan Losses and Reserve for Unfunded Commitments
The allowance for outstanding loans is classified as a contra-asset account offsetting outstanding loans, andthe allowance for unfunded commitments is classified as an “other” liability on the balance sheet. Theallowance for loan losses is established through a provision for loan losses charged against earnings. Thebalances of the allowance for loan losses for outstanding loans and unfunded commitments are maintainedat an amount management believes will be adequate to absorb known and inherent losses in the loanportfolio and commitments to loan funds. The appropriate balance of the allowance for loan losses isdetermined by applying loss factors to the credit exposure from outstanding loans and unfunded loancommitments. Estimated loss factors are based on subjective measurements including management’sassessment of the internal risk classifications, changes in the nature of the loan portfolios, industryconcentrations, and the impact of current local, regional, and national economic factors on the quality of theloan portfolio. Changes in these estimates and assumptions are reasonably possible and may have amaterial impact on the Company’s consolidated financial statements, results of operations, or liquidity.
Goodwill and Intangible Assets
At December 31, 2008, the Company had $22,904 in goodwill and other intangible assets. In accordancewith Financial Accounting Standard 142, Goodwill and Other Intangible Assets, assets with indefinite livesare no longer amortized, but instead are periodically tested for impairment. Management performs animpairment analysis of the intangible assets with indefinite lives at least annually and has determined thatthere was no impairment as of December 31, 2008, 2007, and 2006.
Share-based Compensation
In December 2004, the Financial Accounting Standards Board (“FASB”) issued SFAS 123(R), Share BasedPayment, a revision to the previously issued guidance on accounting for stock options and other forms ofequity-based forms of compensation issued to employees. This standard became effective in the firstquarter of 2006. The Company uses the Black-Scholes option pricing model to measure fair value underSFAS 123(R) which is further discussed in Note 1 of the Notes to Consolidated Financial Statements inItem 8 below.
The Company adopted SFAS 123(R) using the modified prospective method. Therefore, previouslyreported financial data was not restated, and expenses related to equity-based payments granted and vestingduring 2006, 2007, and 2008 were recorded as compensation expense.

-29-
Recent Accounting Pronouncements
Recent accounting pronouncements are discussed in Note 1 of the Notes to the Consolidated FinancialStatements for the year ended December 31, 2008 in item 8 of this report. None of these pronouncementsare expected to have a significant effect on the Company’s financial condition or results of operations.
RESULTS OF OPERATIONS
Net Interest Income
The largest component of the Company’s earnings is net interest income. Net interest income is thedifference between interest income derived from earning assets, principally loans, and the interest expenseassociated with interest-bearing liabilities, principally deposits. The volume and mix of earning assets andfunding sources, market rates of interest, demand for loans, and the availability of deposits affect netinterest income.
4th Quarter 2008 Compared to 4th Quarter 2007
Two tables follow which analyze the changes in net interest income for the fourth quarter 2008 and fourthquarter 2007. Table I “Average Balance Analysis of Net Interest Earnings”, provides information withregard to average balances of assets and liabilities, as well as associated dollar amounts of interest incomeand interest expense, relevant average yields or rates, and net interest income as a percent of averageearning assets. Table II “Analysis of Changes in Interest Income and Interest Expense”, shows the increase(decrease) in the dollar amount of interest income and interest expense and the differences attributable tochanges in either volume or rates.
The Bank’s net interest margin for the fourth quarter 2008 was 5.28% compared to 5.15% for the fourthquarter 2007. Table I shows that earning asset yields for the fourth quarter 2008 of 6.63% were down 135basis points from fourth quarter 2007 earning asset yields due primarily to a 144 basis point decline in theyield on net loans. The decline in loan yields was due to the rapid decline in market interest rates during2008, which lowered yields on the Bank’s variable rate loan portfolio. However, the Bank’s practice ofincluding floors on most of its variable rate loans mitigated additional declines in loan yields during thisfalling rate environment. During the third and fourth quarters 2008, loan yields stabilized due to theactivation of interest rate floors on approximately $280,000 of the Bank’s variable rate loan portfolio, thusprotecting the net interest margin.
Table I shows that the rates paid on interest-bearing core deposits moved down faster than yields on earningassets as evidenced by the 168 basis point decline from 3.24% to 1.56%. In addition, the cost of alternativefunding has moved down at a faster rate than core deposits, down 296 basis points from 4.88% to 1.92%.This rapid fall in the cost of alternative funding was due to a planned strategy to maintain a relatively shortmaturity structure on the Bank’s alternative funding, which permitted the Bank to refinance this funding atconsistently lower rates during a rapidly declining interest rate environment. Overall, the cost of interest-bearing liabilities of the Bank, which includes both core deposits and alternative funding, has fallen by 205basis points in fourth quarter 2008 from fourth quarter 2007.
Table I also shows the difference between the cost of interest-bearing core deposits and alternative funding.Overall, interest-bearing core deposits have a rate of 1.56% or 36 basis points lower than alternativefunding costs at 1.92%. However, this spread between core deposit rates and alternative funding rates hascompressed significantly during the last half of 2008 when compared to the first half of the year when thisspread ranged between 140 and 150 basis points. This narrowing spread is again the result of the relativelyshort maturity structure of the Bank’s alternative funding, Federal Reserve actions to lower rates during thefourth quarter 2008, and the relatively high cost of core deposits in a very competitive rate environment.
Table II shows the changes in net interest income due to rate and volume for the quarter ended December31, 2008. Interest income including loan fees for the fourth quarter 2008 declined by $806 from the sameperiod last year. Higher volumes of earning assets increased interest income by $2,605, while lower yieldson earning assets, primarily loans, decreased interest income by $3,411. The rate/volume analysis showsthat interest expense for the quarter ended December 31, 2008 decreased by $2,807 from last year, as

-30-
changes in mix and higher volumes caused interest expense to increase by $1,496, which was more thanoffset by a decrease in interest expense of $4,303 due to lower rates. Most of the decline in interest expensewas due to lower rates and was in the Bank’s core deposit base, which illustrates the Bank’s ability toquickly reprice its core deposits. In addition, the Bank also benefited from the short maturity structure of itsalternative funding, which permitted refinancing at lower rates in a rapidly falling interest rate environment.

-31-
Interest Average Interest AverageAverage Income or Yields or Average Income or Yields or
Balance Expense Rates Balance Expense RatesInterest Earning Assets
Federal funds sold and interest-bearing deposits in banks 497$ 2$ 1.60% 809$ 10$ 4.90%
Securities available for sale:
Taxable (1) 57,972 627 4.30% 52,756 622 4.68%Tax-exempt 5,187 49 3.76% 5,247 49 3.71%
Loans, net of allowancefor loan losses(2)(3)(4) 929,522 15,866 6.79% 803,999 16,669 8.23%
Total interest earning assets 993,178 16,544 6.63% 862,811 17,350 7.98%
Non Earning AssetsCash and due from banks 17,928 19,623
Premises and equipment 20,892 20,856Goodwill & other intangibles 22,935 23,159
Interest receivable and other 14,845 6,925Total non interest assets 76,600 70,563
Total assets 1,069,778$ 933,374$
Interest-Bearing LiabilitiesMoney market and NOW accounts 382,144$ (1,367)$ -1.42% 378,845$ (3,066)$ -3.21%
Savings deposits 21,058 (39) -0.74% 20,650 (82) -1.58%
Time deposits - core (5) 44,776 (355) -3.15% 38,313 (424) -4.39%
Total interest-bearing core deposits 447,978 (1,761) -1.56% 437,808 (3,572) -3.24%
Time deposits - non-core 72,052 (536) -2.96% 49,588 (651) -5.21%Federal funds purchased 9,005 (24) -1.06% 16,579 (212) -5.07%
FHLB & FRB borrowings 239,599 (904) -1.50% 135,748 (1,594) -4.66%
Junior subordinated debentures 8,248 (125) -6.03% 8,248 (128) -6.16%Total interest-bearing alternative funding 328,904 (1,589) -1.92% 210,163 (2,585) -4.88%
Total interest-bearing liabilities 776,882 (3,350) -1.72% 647,971 (6,157) -3.77%
Noninterest-Bearing LiabilitiesDemand deposits 170,897 173,706
Interest payable and other 7,040 4,326Total noninterest liabilities 177,937 178,032
Total liabilities 954,819 826,003Stockholders' equity 114,959 107,371
Total liabilities and stockholders' equity 1,069,778$ 933,374$
Net Interest Income 13,194$ 11,193$
Net Interest Income as a Percent of Earning Assets 5.28% 5.15%
(1) Federal Home Loan Bank stock is included in securities available for sale.
(2) Nonaccrual loans have been included in average balance totals.
(3) Interest income includes recognized loan origination fees of $224 and $447 for the three months endedDecember 31, 2008 and 2007, respectively.
(4) Total includes loans held for sale.(5) Core time deposits include all non-public time deposits, including non-public time deposits over $100.
Table I
Average Balance Analysis of Net Interest Earnings
(dollars in thousands)
Quarter Ended
December 31, 2008
Quarter Ended
December 31, 2007

-32-
Table II
Analysis of Changes in Interest Income and Interest Expense(dollars in thousands)
Volume Rate Net
Interest earned on:Federal funds sold and interest
bearing deposits in banks (4)$ (4)$ (8)$Securities available-for-sale:
Taxable 60 (55) 5
Tax-exempt (1) 1 -Loans, net of allowance for loan losses 2,550 (3,353) (803)
Total interest income 2,605$ (3,411)$ (806)$
Interest paid on:Money market and NOW accounts (18) 1,717 1,699
Savings deposits (1) 44 43Time deposits - core (70) 139 69
Total interest-bearing core deposits (89) 1,900 1,811
Time deposits - non-core (292) 407 115
Federal funds purchased 97 91 188
FHLB & FRB borrowings (1,212) 1,902 690Junior subordinated debentures - 3 3
Total interest-bearing alternative funding (1,407) 2,403 996
Total interest expense (1,496)$ 4,303$ 2,807$
Net interest income 1,109$ 892$ 2,001$
Increase (decrease) due to
Three Months Ended
December 31, 2008 compared to December 31, 2007
2008 Compared to 2007
Two tables follow which analyze the changes in net interest income for the years 2008, 2007, and 2006.Table III “Average Balance Analysis of Net Interest Earnings”, provides information with regard to averagebalances of assets and liabilities, as well as associated dollar amounts of interest income and interestexpense, relevant average yields or rates, and net interest income as a percent of average earning assets.Table IV, “Analysis of Changes in Interest Income and Interest Expense”, shows the increase (decrease) inthe dollar amount of interest income and interest expense and the differences attributable to changes ineither volume or rates.
The net interest margin for the full year 2008 was 5.21%, a decline of 1 basis point from the 5.22% netinterest margin reported for the year 2007. Table III shows that earning asset yields declined by 134 basispoints for the year 2008 when compared to 2007 from 8.31% to 6.97%. The decline in earning assets yieldswas due primarily to the 141 basis point drop in yields on loans, which resulted from the rapidly declininginterest rate environment experienced throughout 2008 that lowered yields on the Bank’s variable rate loanportfolio. As noted above, the Bank’s use of interest rate floors on its variable rate loan portfolio mitigatedfurther decline in loan yields during the last half of 2008.
Table III also shows the overall cost of interest-bearing liabilities for the year 2007 was down 182 basispoints from 4.10% in 2007 to 2.28% in 2008. This decline can be also be attributed to the falling rateenvironment during 2008, plus the relatively short-maturity structure of the Bank’s alternative funding,which permitted rapid refinancing of funding at much lower rates throughout the year. Table III also

-33-
illustrates the difference between the cost of interest-bearing core deposits for the year 2008 as compared tothe cost of interest-bearing alternative funding. The cost of interest-bearing core deposits was 1.85% or 108basis points less than the 2.93% cost of alternative funding.
The year-to-date December 31, 2008 rate/volume analysis shows that interest income including loan feesdeclined by $3,221 from last year. Higher volumes of earning assets increased interest income by $9,047and lower yields on loans decreased interest income by $12,268. The rate/volume analysis shows thatinterest expense for the year 2008 decreased by $9,066 from last year, as higher volumes on all depositcategories caused interest expense to increase by $5,045, which was more than offset by lower rates, whichdecreased interest expense by $14,111.
2007 Compared to 2006
The net interest margin for the full year 2007 was 5.22%, a decline of 8 basis points from the 5.30% netinterest margin reported for the year 2006. Table III shows that earning asset yields improved by 11 basispoints for the year 2007 when compared to 2006 from 8.20% to 8.31%. Compression in the net interestmargin was primarily due to the increase in the Bank’s cost of funding, which more than offset the growthin earning asset yields. Table III shows the overall cost of interest-bearing liabilities for the year 2007 wasup 24 basis points from 3.86% in 2006 to 4.10% in 2007. Table III also illustrates the difference betweenthe cost of interest-bearing core deposits for the year 2007 as compared to the cost of interest-bearingalternative funding. The cost of interest-bearing core deposits was 3.61% or 150 basis points less than the5.11% cost of alternative funding.
The year-to-date December 31, 2007 rate/volume analysis shows that interest income, including loan fees,improved by $7,194 over last year. Higher volumes of earning assets increased interest income by $6,301and higher yields on loans increased interest income by $893. The rate/volume analysis shows that interestexpense for the year 2007 increased by $3,825 over last year, as higher volumes on all deposit categoriescaused interest expense to increase by $2,157, combined with higher rates, which increased interest expenseby $1,668.

-34
-
Av
erag
eIn
tere
stA
vera
ge
Av
era
ge
Inte
rest
Av
era
geA
ver
age
Inte
rest
Av
era
ge
Ba
lan
ceIn
com
e/(E
xpen
se)
Yie
ld/(
Cos
t)B
ala
nce
Inco
me/
(Exp
ense
)Y
ield
/(C
ost
)B
ala
nce
Inco
me/
(Ex
pen
se)
Yie
ld/(
Co
st)
(do
lla
rsin
thou
san
ds)
(do
llar
sin
tho
usa
nd
s)(d
oll
ars
inth
ou
san
ds)
Inte
rest
Ea
rnin
gA
sset
sF
eder
alfu
nds
sold
and
inte
rest
-b
eari
ng
dep
osi
tsin
ban
ks
554
$20
$3
.61
%9
81
$51
$5
.20
%9
60$
44
$4.
58%
Sec
uri
ties
avai
lab
lefo
rsa
le:
Tax
able
(1)
57,
260
2,6
824
.68
%4
1,1
12
1,8
374
.47
%3
8,8
551
,54
63.
98%
Tax
-exe
mp
t5,
300
196
3.7
0%
5,2
26
156
2.9
9%
3,3
021
25
3.7
9%L
oan
s,n
eto
fal
low
ance
for
loan
loss
es(2
)(3
)(4
)8
82,
742
63,
047
7.1
4%
78
5,1
32
67
,122
8.5
5%
71
2,5
636
0,2
57
8.4
6%
To
tal
inte
rest
earn
ing
asse
ts9
45,
856
65,
945
6.9
7%
83
2,4
51
69
,166
8.3
1%
75
5,6
806
1,9
72
8.2
0%
Non
Ea
rnin
gA
sset
sC
ash
and
due
fro
mb
anks
18,
241
21
,66
22
3,2
72P
rem
ises
and
equ
ipm
ent
20,
955
19
,75
51
7,6
94G
ood
wil
l&
oth
erin
tan
gib
les
23,
018
23
,37
62
4,0
57
Inte
rest
rece
ivab
lean
dot
her
10,
970
6,6
88
4,9
68T
ota
ln
on
inte
rest
earn
ing
asse
ts7
3,1
847
1,4
81
69
,991
To
tal
asse
ts1
,01
9,0
40$
90
3,9
32
$8
25
,671
$
Inte
rest
-Bea
rin
gL
iab
ilit
ies
Mo
ney
mar
ket
and
NO
Wac
cou
nts
37
9,6
57$
(6,5
84)
$-1
.73
%3
64
,78
0$
(13
,358
)$
-3.6
6%
30
7,0
54$
(10
,55
1)
$-3
.44%
Sav
ing
sd
epo
sits
21,
228
(183
)-0
.86
%2
4,3
09
(486
)-2
.00
%2
3,5
59(3
60
)-1
.53%
Tim
ede
po
sits
-co
re4
2,5
66(1
,427
)-3
.35
%3
2,5
89
(1,3
81)
-4.2
4%
40
,989
(1,4
66
)-3
.58%
To
tal
inte
rest
-bea
ring
core
dep
osi
ts4
43,
451
(8,1
94)
-1.8
5%
42
1,6
78
(15
,225
)-3
.61
%3
71
,602
(12
,37
7)
-3.3
3%
Tim
ede
po
sits
-no
n-c
ore
56,
380
(1,9
48)
-3.4
6%
63
,91
8(3
,347
)-5
.24
%7
1,9
54(3
,50
4)
-4.8
7%F
eder
alfu
nds
pu
rch
ased
22,
094
(578
)-2
.62
%1
0,1
28
(539
)-5
.32
%7
,580
(38
0)
-5.0
1%F
HL
B&
FR
Bb
orro
win
gs2
02,
293
(5,4
56)
-2.7
0%
12
3,5
97
(6,1
21)
-4.9
5%
10
8,3
24(5
,14
4)
-4.7
5%T
rust
pre
ferr
ed8,
248
(498
)-6
.04
%8
,24
8(5
08)
-6.1
6%
8,2
48(5
10
)-6
.18%
To
tal
inte
rest
-bea
ring
alte
rnat
ive
fun
din
g2
89,
015
(8,4
80)
-2.9
3%
20
5,8
91
(10
,515
)-5
.11
%1
96
,106
(9,5
38
)-4
.86%
To
tal
inte
rest
-bea
ring
liab
ilit
ies
73
2,4
66(1
6,6
74)
-2.2
8%
62
7,5
69
(25
,740
)-4
.10
%5
67
,708
(21
,91
5)
-3.8
6%
Non
inte
rest
-Bea
rin
gL
iab
ilit
ies
Dem
and
dep
osi
ts1
69,
792
16
9,0
35
16
2,2
59In
tere
stp
ayab
lean
do
ther
4,9
144
,23
95
,466
To
tal
no
nin
tere
st-b
eari
ngli
abil
itie
s1
74,
706
17
3,2
74
16
7,7
25
To
tal
liab
ilit
ies
90
7,1
728
00
,84
37
35
,433
Sto
ckh
old
ers'
equ
ity
11
1,8
681
03
,08
99
0,2
38T
ota
lli
abil
itie
san
dst
ock
hold
ers'
equi
ty1
,01
9,0
40$
90
3,9
32
$8
25
,671
$
Net
Inte
rest
Inco
me
49,
271
$4
3,4
26$
40
,05
7$
Net
Inte
rest
Inco
me
as
aP
erce
nt
of
Ea
rnin
gA
sset
s5
.21%
5.2
2%
5.3
0%
(1)
Fed
eral
Ho
me
Loa
nB
ank
sto
ckis
incl
uded
inse
curi
ties
avai
lab
lefo
rsa
le.
(2)
No
nacc
rual
loan
sha
ve
bee
nin
clud
edin
aver
age
bal
ance
tota
ls.
(3)
Inte
rest
inco
me
incl
ude
sre
cog
nize
dlo
ano
rig
inat
ion
fees
of
$1,8
43
,$2
,06
5an
d$2
,09
9fo
rth
eye
ars
end
ed20
08
,20
07,
and
200
6,
rep
ecti
vel
y.
(4)
Tot
alin
clu
des
loan
sh
eld
for
sale
.(5
)C
ore
tim
ede
po
sits
incl
ude
all
loca
lti
me
dep
osi
ts,
incl
udi
ng
loca
lti
me
dep
osit
so
ver
$10
0.
20
0620
07
20
08
Ta
ble
III
Ave
rag
eB
ala
nce
An
aly
sis
of
Net
Inte
rest
Ear
nin
gs

-35-
Table IV
Analysis of Changes in Interest Income and Interest Expense
Volume Rate Net Volume Rate Net
(dollars in thousands)Interest earned on:
Federal funds sold and interestbearing deposits in banks (22)$ (9)$ (31)$ 1$ 6$ 7$
Securities available-for-sale:Taxable 722 123 845 90 201 291
Tax-exempt 2 38 40 73 (42) 31Loans, net of allowance for loan
losses 8,345 (12,420) (4,075) 6,137 728 6,865
Total interest income 9,047$ (12,268)$ (3,221)$ 6,301$ 893$ 7,194$
Interest paid on:
Money market and NOW accounts (545) 7,319 6,774 (1,984) (823) (2,807)Savings deposits 62 241 303 (11) (115) (126)
Time deposits (423) 377 (46) 300 (215) 85
Total interest-bearing core deposits (906) 7,937 7,031 (1,695) (1,153) (2,848)
Time deposits - non-core 395 1,004 1,399 391 (234) 157Federal funds purchased (637) 598 (39) (128) (31) (159)
FHLB borrowings (3,897) 4,562 665 (725) (252) (977)Trust preferred - 10 10 - 2 2Total interest-bearing alternative funding (4,139) 6,174 2,035 (462) (515) (977)
Total interest expense (5,045)$ 14,111$ 9,066$ (2,157)$ (1,668)$ (3,825)$
Net interest income 4,002$ 1,843$ 5,845$ 4,144$ (775)$ 3,369$
2008 compared to 2007 2007 compared to 2006Increase (decrease) due to Increase (decrease) due to
Provision for Possible Loan Losses
Management provides for possible loan losses by maintaining an allowance. The level of the allowance isdetermined based upon judgments regarding the size and nature of the loan portfolio, historical lossexperience, the financial condition of borrowers, the level of nonperforming loans, and current generaleconomic conditions. Additions to the allowance are charged to expense. Loans are charged against theallowance when management believes the collection of principal is unlikely.
The provision for loan losses totaled $3,600 in 2008, $725 in 2007, and $600 in 2006. The increase in theprovision for 2008 when compared to 2007 was due to loan growth, moderate deterioration in creditquality, and an increase in unallocated reserves in light of significant economic uncertainty. The increase inthe provision for 2007 when compared to 2006 was due to loan growth and some increased economicuncertainty.
At December 31, 2008, the Bank had $7,704 or 0.71% of total assets in nonperforming assets, net ofgovernment guarantees compared to $4,094 or 0.43% of total assets at December 31, 2007. Nonperformingassets at December 31, 2008 consist of $3,898 of nonaccrual loans (net of $239 in government guarantees)and $3,806 of other real estate owned. Nonperforming assets do not include $2,234 of impaired loans lessthan 90 days past due and continuing to accrue interest as of December 31, 2008. At December 31, 2008,approximately $1,181 of the nonaccrual loans were consumer residential construction loans. Other realestate owned consisted of 17 completed consumer construction residential properties and seven individualresidential building lots. Losses on these or any future nonperforming loans in the consumer residential

-36-
construction segment of the loan portfolio are mitigated due to a cash-secured 20% principal guarantee foreach of these loans. In addition, no special allocation to the allowance for loan losses for these specificloans is expected.
The allowance for loan losses at December 31, 2008 was $10,980 (1.15% of outstanding loans, net of loansheld for sale) compared to $8,675 (1.05% of loans) and $8,284 (1.08% of loans) at years end 2007 and2006, respectively. At December 31, 2008, the Bank also has reserved $196 for possible losses onunfunded loan commitments, which is classified in other liabilities. The 2008 ending allowance includes$887 in specific allowance for $6,132 in impaired loans (net of government guarantees). At December 31,2007, the Company had $3,671 of impaired loans (net of government guarantees) with a specific allowanceassigned of $160.
Net loan charge offs were $1,295 in 2008 compared to $334 in 2007, and $108 in 2006. Net charge offs asa percentage of average loans were 0.15%, 0.04%, and 0.01% for 2008, 2007, and 2006, respectively.
Noninterest Income
Noninterest income is derived from sources other than fees and interest on earning assets. The Company’sprimary sources of noninterest income are service charge fees on deposit accounts, merchant bankcardactivity, income derived from mortgage banking services, and gains on the sale of loans.
2008 Compared to 2007
Noninterest income in 2008 was $4,269, up $344 or 9% from the $3,925 reported for the year 2007. Theincrease in 2008 noninterest income when compared to 2007 was primarily attributable to a $267 increasein service charges on deposit accounts and a $193 increase in other fee income, principally bankcardprocessing fee income. Service charges on deposit accounts increased due to lower earnings credit rate,which increased fees on analyzed business accounts. Bankcard processing fee income accounted for $114of this increase. Increases in these categories were partially offset by a $15 decrease in mortgage bankingincome. The decline in mortgage banking income was attributable to a significant slow down in theresidential housing market. The other income category in 2008 was $330, an $87 or 21% decrease from the$417 reported in the other income category for the year 2007. The decrease in the other income categorywas due to collection of approximately $70 in loan referral fees during the year 2007.
2007 Compared to 2006
Noninterest income in 2007 was $3,925, down $476 or 11% from the $4,401 reported for the year 2006.Excluding the one-time gain of $335 on the sale of property included in 2006 results, noninterest income in2007 was down $141 or 3% from 2006. The following discussion excludes the effect of the gain on sale ofproperty in 2006. The $141 decline in 2007 noninterest income when compared to 2006 was primarily dueto a $435 decrease in mortgage banking income. The decline in mortgage banking income was attributableto a significant slow down in the residential housing market. The decline in mortgage banking income waspartially offset by increases in service charges on deposit accounts, other fee income, principally bankcardprocessing fee income, and the other income category. Service charges on deposit accounts increased $76or 6% due to lower earnings credit rate, which increased fees on analyzed business accounts. Other feeincome, principally bankcard processing fee income in 2007 increased $135 or 9% over 2006. Bankcardprocessing fee income accounted for $53 of this increase, while other service charge income, primarily wiretransfer fees accounted for $68 of this increase. The other income category in 2007 was $417, a $94 or29% increase over the $323 reported in the other income category for the year 2006. The increase in theother income category was due to collection of approximately $70 in loan referral fees during the year2007.

-37-
Noninterest Expense
Noninterest expense represents all expenses other than the provision for loan losses and interest costsassociated with deposits and other interest-bearing liabilities. It incorporates personnel, premises andequipment, data processing and other operating expenses.
2008 Compared to 2007
Noninterest expense for the year 2008 was $29,562, up $3,701 or 14% over the $25,861 reported for theyear 2007. Personnel expense in 2008 was up $2,422 and accounted for 65% of the total increase innoninterest expense in the year. Total salary expense was up $1,699 or 16% and benefits and taxes were up$780 or 16% over last year. Approximately $442 of the increase in salary expense was due to lower loanorigination costs, which are a direct offset to salary expense. Higher benefits and taxes expense in 2008resulted from increased group insurance, and accruals for officer incentives. The other expense categoryaccounted for the majority of the remaining increase in noninterest expense in 2008 over 2007. Otherexpenses were $5,490 in 2008, up $588 or 12% over 2007 other expenses of $4,902. The increase in theother expense category can be attributed to the following areas: 1) increased FDIC assessment of $231; 2)increased travel expense of $89; 3) increased other real estate expense of $125 due to increases in other realestate owned; and 4) increased repossession and collection expense of $23 related to increases in non-performing loans.
2007 Compared to 2006
Noninterest expense for the year 2007 was $25,861, up $2,070 or 9% over the $23,791 reported for the year2006. All noninterest expense categories showed an increase in 2007 when compared to 2006. Personnelexpense in 2007 was up $1,089 and accounted for 53% of the total increase in noninterest expense in theyear. Total salary expense was up $515 or 5% and benefits and taxes were up $823 or 20% over last yeardue to performance increases for existing employees, increased group insurance, and increased accruals forofficer incentives. These increases were partially offset by a decline in commission expense in 2007 from2006. The other expense category accounted for the majority of the remaining increase in noninterestexpense in 2007 over 2006. Other expenses were $4,902 in 2007, up $708 or 17% over 2006 otherexpenses of $4,194. The increase in the other expense category can be attributed to the following areas: 1)increased FDIC assessment of $146; 2) increased communications expense (primarily armored car andcourier services) of $133; 3) increased other data processing expense of $199 due to new contracts in place;4) increased expense related to the unfunded loan commitment of $196; and 5) increased local taxes(Multnomah County and State of Washington B&O taxes) of $107.
BALANCE SHEET
Loans
At December 31, 2008, outstanding loans, net of deferred loan fees and excluding loans held for sale, were$956,357, up $134,035 over outstanding loans of $822,322 at December 31, 2007. A summary of loangrowth by market for the year 2008 follows:
Balance Balance $ Increase % IncreaseDec. 31, 2008 Dec. 31, 2007 (Decrease) (Decrease
Eugene Market 237,604$ 217,962$ 19,642$ 9.01%
Portland Market 432,961 389,053 43,908 11.29%
Seattle Market 285,792 215,307 70,485 32.74%
Total 956,357$ 822,322$ 134,035$ 16.30%

-38-
The Seattle market was primarily responsible for the majority of the growth in outstanding loans for theCompany during 2008, but both the Portland and Eugene markets also showed solid year-over-year loangrowth. The growth in all three markets can be attributed to increased commercial real estate lending andloans to dental professionals throughout the year, combined with a lessening of competition for loans.Throughout 2008, many financial institutions experiencing credit quality problems and significantly reducedtheir lending activities, thus increasing the opportunity for the Bank to grow its loan portfolio. Moreinformation on the loan portfolio can be found in statistical information in Item 1 and in Note 4 of the Notesto Consolidated Financial Statements in Item 8 below.
Goodwill and Intangible Assets
At December 31, 2008, the Company had a recorded balance of $22,031 in goodwill from theNovember 30, 2005 acquisition of NWB Financial Corporation and its wholly-owned subsidiary NorthwestBusiness Bank (NWBF). In addition, at December 31, 2008 the Company had $873 core deposit intangibleassets resulting from the acquisition of NWBF. The core deposit intangible was determined to have anexpected life of approximately seven years and is being amortized over that period using the straight-linemethod. During 2008, the Company amortized $223 of the core deposit intangible. In accordance withStatement of Financial Accounting Standard (“SFAS”) 142, Goodwill and Other Intangible Assets, theCompany does not amortize goodwill or other intangible assets with indefinite lives, but instead periodicallytests these assets for impairment. Management performed an impairment analysis at December 31, 2008and determined there was no impairment of the goodwill at the time of the analysis.
Deposits
Outstanding deposits at December 31, 2008 were $722,437, an increase of $78,013 over outstandingdeposits of $644,424 at December 31, 2007. Core deposits, which are defined by the Company as demand,interest checking, money market, savings, and local time deposits, including local time deposits in excess of$100 thousand, were $615,832, down $60 from outstanding core deposits of $615,892 at December 31,2007. At December 31, 2008 and 2007, respectively, core deposits represented 85% and 96% of totaldeposits, respectively. A summary of deposit growth by market for the year 2008 follows:
Balance Balance $ Increase % IncreaseDec. 31, 2008 Dec. 31, 2007 (Decrease) (Decrease
Eugene Market core deposits 406,098$ 405,351$ 747$ 0.18%
Portland Market core deposits 110,287 109,698 589 0.54%
Seattle Market core deposits 99,447 100,843 (1,396) -1.38%
Total core deposits 615,832 615,892 (60) -0.01%
Other deposits 106,605 28,532 78,073 273.63%
Total 722,437$ 644,424$ 78,013$ 12.11%
Outstanding core deposits at December 31, 2008 in all three markets were virtually flat from one year agoprimarily due to the highly competitive environment for these deposits with other financial institutions in allthree of the Bank’s primary markets. This increased competition for core deposits, primarily based onprice, was driven by liquidity problems experienced by the entire industry during the last six months of2008 as financial markets experienced significant disruption. In addition, core deposit growth was affectedby a deterioration in economic conditions in all three markets that negatively impacted the cash flow, andthus the deposit levels of many of the Bank’s existing clients. As a result of no growth in core deposits, theBank experienced growth of more than $78,000 in other deposits, which consisted primarily of brokeredand public time deposits.

-39-
Junior Subordinated Debentures
The Company had $8,248 in junior subordinated debentures at December 31, 2008, which were issued inconjunction with the acquisition of NWBF. At December 31, 2008, the entire $8,248 in junior subordinateddebentures had an interest rate of 6.265% that is fixed through November 2010. As of December 31, 2008,the entire balance of the junior subordinated debentures qualified as Tier 1 capital under regulatory capitalpurposes. Additional information regarding the terms of the junior subordinated debentures, includingmaturity/repricing dates and interest rate, is included in Note 12 of the Notes to Consolidated FinancialStatements in Item 8 below.
CAPITAL RESOURCES
Capital is the stockholders’ investment in the Company. Capital grows through the retention of earningsand the issuance of new stock through the exercise of stock options. Capital formation allows the Companyto grow assets and provides flexibility in times of adversity.
Stockholders’ equity at December 31, 2008 was $116,165, an increase of $8,656 or 8% from December 31,2007. The increase in stockholders’ equity during 2008 was due to the retention of approximately $8,142net income for the year and the exercise of stock options and the related tax benefit accounted for another$1,504.
The Federal Reserve Board and the FDIC have in place guidelines for risk-based capital requirementsapplicable to U.S. banks and bank holding companies. These risk-based capital guidelines take intoconsideration risk factors, as defined by regulation, associated with various categories of assets, both on andoff-balance sheet. Under the guidelines, capital strength is measured in two tiers, which are used inconjunction with risk-adjusted assets to determine the risk-based capital ratios. These guidelines require aminimum of 8% total risk-based capital ratio, of which 4% must be Tier I capital. The regulations alsospecify that a 10% total risk-based capital ratio is required to be designated “well-capitalized” (the highestFDIC capital rating) by the FDIC. The Company’s Tier I capital, which consists of stockholders’ equityand qualifying trust preferred securities, less other comprehensive income, goodwill (net of the deferred taxassociated with goodwill), and deposit-based intangibles, totaled $102,424 at December 31, 2008. Tier IIcapital components include all, or a portion of the allowance for loan losses and the portion of trustpreferred securities in excess of Tier I statutory limits. The total of Tier I and Tier II capital components isreferred to as Total Risk-Based Capital, and was $113,600 at December 31, 2008. The Bank’s total risk-based capital ratio was 11.11%, at December 31, 2008 compared to 10.97% at December 31, 2007.
Subsequent to year-end December 31, 2008, the Company raised approximately $9,700 of additional capitalthrough a private equity placement of 750 thousand shares of stock at $13.50 per share. This additionalcapital is expected to increase the Company’s total risk-based capital ratio to more than 12% at the end offirst quarter 2009. In addition, during December 2008, the Company was granted preliminary approvalunder TARP by the Treasury to receive $30 million of additional capital in the form of preferred stock. InJanuary 2009, the Company announced it had determined not to participate in this program.
The Company pays cash dividends on a quarterly basis, typically in March, June, September and Decemberof each year. The Board of Directors considers the dividend amount quarterly and takes a broadperspective in its dividend deliberations including a review of recent operating performance, capital levels,and concentrations of loans as a percentage of capital, and growth projections. The Board also considersdividend payout ratios, dividend yield, and other financial metrics in setting the quarterly dividend. TheCompany declared and paid cash dividends of $0.40 per share for the year 2008. That compares todividends of $0.35 per share for the year 2007 when adjusted for the 10% stock dividend paid in June 2007.
The Board of Directors, at its February 17, 2009 meeting, approved a dividend of $0.10 per share forstockholders of record as of March 3, 2009. If continued for each quarter during 2009, this would result inno change in 2009 dividends over 2008 dividends.

-40-
The Company projects that earnings retention and existing capital will be sufficient to fund anticipatedorganic asset growth, while maintaining a well-capitalized designation from all regulatory agencies.
OFF-BALANCE SHEET ARRANGEMENTS AND COMMITMENTS
In the normal course of business, the Bank commits to extensions of credit and issues letters of credit. TheBank uses the same credit policies in making commitments to lend funds and conditional obligations as itdoes for other credit products. In the event of nonperformance by the customer, the Bank’s exposure tocredit loss is represented by the contractual amount of the instruments. Commitments to extend credit areagreements to lend to a customer as long as there is no violation of any condition established by thecontract. Since some commitments may expire without being drawn upon, the total commitment amountsdo not necessarily represent future cash requirements. At December 31, 2008, the Bank had $182,609 incommitments to extend credit.
Letters of credit written are conditional commitments issued by the Bank to guarantee performance of acustomer to a third party. The credit risk involved is essentially the same as that involved in extending loanfacilities to customers. At December 31, 2008, the Bank had $2,298 in letters of credit and financialguarantees written.
The Bank also has internal guidance lines of credit established for certain borrowers, primarily in theresidential construction industry. These guidance lines are not contractual commitments to extend credit,and may be terminated by the Bank for any reason without any obligation to the borrower. These linesprovide the Bank’s lenders limits on future extensions of credit to certain borrowers. The Bank uses thesame credit policies in establishing internal guidance lines as it does for other credit products. At December31, 2008, the Bank had established unused and uncommitted guidance lines totaling approximately $1,387compared to unused and uncommitted guidance lines of $38,321 at December 31, 2007.
The Company has certain other financial commitments. These future financial commitments are outlinedbelow:
Contractual Obligations(dollars in thousands) Total
Junior subordinated debenture 8,248$ -$ -$ -$ 8,248$FHLB borrowings 194,500 159,500 21,500 11,500 2,000
Federal Reserve borrowings 20,000 20,000 - - -
Time Deposits 150,545 123,172 21,482 5,891 -
Operating lease obligations 6,848 954 1,177 932 3,785
380,141$ 303,626$ 44,159$ 18,323$ 14,033$
Less than
One Year 1 - 3 Years 3 - 5 Years
More than
5 Years
LIQUIDITY
Liquidity is the term used to define the Company’s ability to meet its financial commitments. The Companymaintains sufficient liquidity to ensure funds are available for both lending needs and the withdrawal ofdeposit funds. The Company derives liquidity through core deposit growth, maturity of investmentsecurities, and loan payments. Core deposits include demand, interest checking, money market, savings,and local time deposits, including local time deposits in excess of $100. Additional liquidity and fundingsources are provided through the sale of loans, sales of securities, access to national CD markets, and bothsecured and unsecured borrowings.
The Company uses a number of measurements to monitor its liquidity position on a daily, weekly, andmonthly basis. During the third and fourth quarters of 2008 during significant disruption of financialmarkets that created liquidity problems for a number of financial institutions, the Company heightened its

-41-
liquidity monitoring and also put into place a number of programs to increase its core deposit base,including deposit promotions in all three markets.
Core deposits at December 31, 2008 were 85% of total deposits compared to 96% at December 31, 2007.Core deposits at December 31, 2008 were virtually flat with one year ago due to increased competition forcore deposits by all financial institutions, combined with deteriorating economic conditions. Loan growthwas funded primarily through alternative funding sources, including overnight borrowed funds, FederalHome Loan Bank advances, Federal Reserve Bank of San Francisco advances, public deposits availablefrom the State of Oregon and State of Washington, national market time deposits, and brokered timedeposits.
The Company has deposit relationships with several large clients, which are closely monitored by Bankofficers. At December 31, 2008, 29 large deposit relationships with the Bank account for $206,026 or 29%of total deposits. The single largest client represented 8% of total deposits at December 31, 2008. The lossof this deposit relationship or other large deposit relationships could cause an adverse effect on short-termliquidity. The Company expects to maintain these relationships and believes it has sufficient sources ofliquidity to mitigate the loss of one or more of these clients.
Borrowing lines have been established at various correspondent banks, the Federal Home Loan Bank ofSeattle and with the Federal Reserve Bank of San Francisco. At December 31, 2008, the Bank had securedand unsecured borrowing lines totaling approximately $495,188 consisting of $327,253 with the FederalHome Loan Bank of Seattle, $118,000 with various correspondent banks, and $49,935 with the FederalReserve Bank of San Francisco. The Federal Home Loan Bank borrowing line is limited to the amount ofcollateral pledged. At December 31, 2008, the Bank had collateral pledged to the FHLB in the form ofcommercial real estate loans, first and second lien single family residential loans, multi-family loans, andmortgage-backed securities that had a discounted collateral value of approximately $273,978 for this line.The $49,935 borrowing line with the Federal Reserve Bank of San Francisco is also secured through thepledging of commercial loans under the Bank’s Borrower-In-Custody program. The $118,000 in borrowinglines with correspondent banks is unsecured. At December 31, 2008, the Bank had $194,500 in borrowingsoutstanding from the FHLB of Seattle and $24,000 outstanding on its overnight correspondent bank lines,and $20,000 outstanding with the Federal Reserve Bank of San Francisco. In addition, the Bank is part ofthe State of Oregon and State of Washington community bank time deposit program and at December 31,2008 had approximately $500 available from these sources. The Bank’s loan portfolio also containsapproximately $31,689 in guaranteed government loans, which can be sold on the secondary market.
Subsequent to the end of the year, as a result of a financial institution failure in the State of Washington, theBank was assessed $9 thousand for uninsured public deposits at the failed institution. The assessment wasbased upon the Bank’s pro rata share of public deposits as of December 31, 2008, which amounted to lessthan one-tenth of one percent. However, due to the increased risk of future bank failures in Washington, theBank chose to exit the public deposit pool in order to minimize its exposure to possible assessments foruninsured deposits. The Bank will continue to have a potential liability for uninsured deposits for a periodof one year following its exit from the state public deposit pool.
INFLATION
Substantially all of the assets and liabilities of the Company are monetary. Therefore, inflation has a lesssignificant impact on the Company than does fluctuation in market interest rates. Inflation can lead toaccelerated growth in noninterest expenses, which impacts net earnings. During the last two years,inflation, as measured by the Consumer Price Index, has not changed significantly. The effects of thisinflation have not had a material impact on the Company.
ITEM 7A Quantitative and Qualitative Disclosures About Market Risk
The Company’s results of operations are largely dependent upon its ability to manage market risks. Changes ininterest rates can have a significant effect on the Company’s financial condition and results of operations.Although permitted by its funds management policy, the Company does not presently use derivatives such as

-42-
forward and futures contracts, options, or interest rate swaps to manage interest rate risk. Other types of marketrisk such as foreign currency exchange rate risk and commodity price risk do not arise in the normal course ofthe Company’s business activities.
Interest rate risk generally arises when the maturity or repricing structure of the Company’s assets andliabilities differ significantly. Asset and liability management, which among other things addresses suchrisk, is the process of developing, testing and implementing strategies that seek to maximize net interestincome while maintaining sufficient liquidity. This process includes monitoring contractual maturity andprepayment expectations together with expected repricing of assets and liabilities under different interestrate scenarios. Generally, the Company seeks a structure that insulates net interest income from largedeviations attributable to changes in market rates.
Interest rate risk is managed through the monitoring of the Company’s balance sheet by subjecting variousasset and liability categories to interest rate shocks and gradual interest rate movements over a one-year periodof time. Interest rate shocks use an instantaneous adjustment in market rates of large magnitudes on a staticbalance sheet to determine the effect such a change in interest rates would have on the Company’s net interestincome and capital for the succeeding twelve-month period. Such an extreme change in interest rates and theassumption that management would take no steps to restructure the balance sheet does limit the usefulness ofthis type of analysis. This type of analysis tends to provide a best-case or worst-case scenario. In addition tothe interest rate shock analysis, the company also prepares a rolling four quarter forecast of the balance sheetand income statement using a flat rate scenario i.e. rates unchanged and a most-likely rate scenario where ratesare projected to change based on management’s analysis of expected economic conditions and interest rateenvironment. This analysis takes into account growth in loans and deposits and management strategies thatcould be employed to maximize the net interest margin and net interest income.
The Company utilizes in-house asset/liability modeling software, ProfitStar to determine the effect changes ininterest rates have on net interest income. Interest rate shock scenarios are modeled in a parallel shift of theyield curve in 100 basis point increments (plus or minus) in the federal funds rate. Although certain assets andliabilities may have similar repricing characteristics, they may not react correspondingly to changes in marketinterest rates. In the event of a change in interest rates, prepayment of loans and early withdrawal of timedeposits would likely deviate from those previously assumed. Increases in market rates may also affect theability of certain borrowers to make scheduled principal payments.
The model attempts to account for such limitations by imposing weights on the differences between repricingassets and repricing liabilities within each time segment. These weights are based on the ratio between theamount of rate change of each category of asset or liability, and the amount of change in the federal funds rate.Certain non-maturing liabilities such as checking accounts and money market deposit accounts are allocatedamong the various repricing time segments to meet local competitive conditions and management’s strategies.
During the first six months of 2008, the model indicated that the Company was asset sensitive and projectedrising margins in a rising rate environment. However during the last six months of 2008 and at December31, 2008, the Profit Star model showed the Company had become liability sensitive, meaning that in a risingrate environment, the net interest margin and net interest income would decline. The change in theCompany’s interest rate risk position was due primarily to the activation of floors on approximately$280,000 of variable rate loans, combined with the relatively short maturity structure of the Company’salternative funding. The following table shows the estimated impact of interest rate changes plus 300 basispoints and minus 300 basis points on net interest income in 100 basis point increments. The base figure of$54,940 used in the analysis differs from actual net interest income for 2008 due to instruments being priced atoffering rates, factoring in run-off assumptions. Due to the various assumptions used for this modeling andpotential balance sheet strategies management may implement to mitigate interest rate risk, no assurance can begiven that projections will reflect actual results.

-43-
Interest Rate Shock AnalysisNet Interest Income and Market Value Performance($ in thousands)
Projected Net Interest Income
Interest Estimated $ Change % Change
Rate Change Value From Base From Base
+300 $ 49,100 $ (5,840) (10.63)%
+200 50,475 (4,465) (8.13)%
+100 51,657 (3,283) (5.98)%
Base 54,940 0 0.00%
-100 56,926 1,986 3.62%
-200 57,574 2,634 4.79%
-300 57,581 2,641 4.81%

-44-
ITEM 8 Financial Statements and Supplementary Data
Report of Independent Registered Public Accounting Firm
To the Board of Directors and StockholdersPacific Continental Corporation and Subsidiary
We have audited the accompanying consolidated balance sheets of Pacific Continental Corporation andSubsidiary (Company) as of December 31, 2008 and 2007, and the related consolidated statements ofincome, changes in stockholders’ equity, comprehensive income and cash flows for each of the years in thethree-year period ended December 31, 2008. We also have audited the Company’s internal control overfinancial reporting as of December 31, 2008, based on criteria established in Internal Control - IntegratedFramework issued by the Committee of Sponsoring Organizations of the Treadway Commission (COSO).The Company’s management is responsible for these financial statements, for maintaining effectiveinternal control over financial reporting, and for its assessment of the effectiveness of internal control overfinancial reporting included in the accompanying Report of Management on Internal Control overFinancial Reporting. Our responsibility is to express an opinion on these financial statements and anopinion on the effectiveness of the Company's internal control over financial reporting based on our audit.
We conducted our audit in accordance with auditing standards of the Public Company AccountingOversight Board (United States). Those standards require that we plan and perform the audits to obtainreasonable assurance about whether the financial statements are free of material misstatement and whethereffective internal control over financial reporting was maintained in all material respects. Our audit of thefinancial statements included examining, on a test basis, evidence supporting the amounts and disclosuresin the financial statements, assessing the accounting principles used and significant estimates made bymanagement, and evaluating the overall financial statement presentation. Our audit of internal controlover financial reporting included obtaining an understanding of internal control over financial reporting,assessing the risk that a material weakness exists, and testing and evaluating the design and operatingeffectiveness of internal control based on the assessed risks. Our audits also included performing suchother procedures as we considered necessary in the circumstances. We believe that our audits provide areasonable basis for our opinions.
A company’s internal control over financial reporting is a process designed to provide reasonableassurance regarding the reliability of financial reporting and the preparation of financial statements forexternal purposes in accordance with generally accepted accounting principles. A company’s internalcontrol over financial reporting includes those policies and procedures that (1) pertain to the maintenanceof records that, in reasonable detail, accurately and fairly reflect the transactions and dispositions of theassets of the company; (2) provide reasonable assurance that transactions are recorded as necessary topermit preparation of financial statements in accordance with generally accepted accounting principles,and that receipts and expenditures of the company are being made only in accordance with authorizationsof management and directors of the company; and (3) provide reasonable assurance regarding preventionor timely detection of unauthorized acquisition, use, or disposition of the company's assets that could havea material effect on the financial statements.
Because of its inherent limitations, internal control over financial reporting may not prevent or detectmisstatements. Also, projections of any evaluation of effectiveness to future periods are subject to the riskthat controls may become inadequate because of changes in conditions, or that the degree of compliancewith the policies or procedures may deteriorate.

-45-
Report of Independent Registered Public Accounting Firm
Page Two
In our opinion, the consolidated financial statements referred to above present fairly, in all materialrespects, the consolidated financial position of Pacific Continental Corporation and Subsidiary as ofDecember 31, 2008 and 2007, and the results of their operations and their cash flows for each of the yearsin the three-year period ended December 31, 2008 in conformity with accounting principles generallyaccepted in the United States of America. Also in our opinion, Pacific Continental Corporation andSubsidiary maintained, in all material respects, effective internal control over financial reporting as ofDecember 31, 2008 based on criteria established in Internal Control - Integrated Framework issued by theCommittee of Sponsoring Organizations of the Treadway Commission (COSO).
Portland, OregonMarch 12, 2009

-46-
Pacific Continental Corporation and SubsidiariesConsolidated Balance Sheets
December 31, December 31,2008 2007
ASSETSCash and due from banks 20,172$ 23,809$Federal funds sold 69 1,857Interest-bearing deposits with banks 214 410
Total cash and cash equivalents 20,455 26,076
Securities available-for-sale 54,933 53,994Loans held for sale 410 -Loans, less allowance for loan losses and net deferred fees 945,377 813,647Interest receivable 4,021 3,652Federal Home Loan Bank stock 10,652 3,795Property, plant and equipment, net of accumulated depreciation 20,763 20,876Goodwill and other intangible assets 22,904 23,127Other real estate owned 3,806 423Other assets 7,522 3,681
Total assets 1,090,843$ 949,271$
LIABILITIES AND STOCKHOLDERS' EQUITYDeposits
Noninterest-bearing demand 178,957$ 175,941$Savings and interest-bearing checking 392,935 401,714Time $100,000 and over 67,095 31,856Other time 83,450 34,913
Total deposits 722,437 644,424
Federal funds purchased 44,000 5,360Federal Home Loan Bank borrowings 194,500 179,500Junior subordinated debentures 8,248 8,248Accrued interest and other payables 5,493 4,230
Total liabilities 974,678 841,762
Commitments and contingencies (Notes 5, 16, and 18)
Stockholders' equityCommon stock, 25,000,000 shares authorized 80,019 77,909
issued & outstanding: 12,079,691 at December 31, 2008and 11,934,866 at December 31, 2007
Retained earnings 37,764 29,622Accumulated other comprehensive loss (1,618) (22)
116,165 107,509
Total liabilities and stockholders’ equity 1,090,843$ 949,271$
See accompanying notes.

-47-
Pacific Continental Corporation and SubsidiariesConsolidated Statements of Income
2008 2007 2006Interest and dividend income
Loans 63,047$ 67,122$ 60,257$Securities 2,787 1,973 1,667Dividends on Federal Home Loan Bank stock 91 21 4Federal funds sold & Interest-bearing deposits with banks 20 50 44
65,945 69,166 61,972
Interest expenseDeposits 10,142 18,572 15,881Federal Home Loan Bank & Federal Reserve borrowings 5,456 6,160 5,144Junior subordinated debentures 498 508 510Federal funds purchased 578 500 380
16,674 25,740 21,915
Net interest income 49,271 43,426 40,057
Provision for loan losses 3,600 725 600Net interest income after provision for loan losses 45,671 42,701 39,457
Noninterest incomeService charges on deposit accounts 1,676 1,409 1,333Other fee income, principally bankcard 1,823 1,630 1,495Loan servicing fees 85 99 109Mortgage banking income 355 370 805Other noninterest income 330 417 659
4,269 3,925 4,401
Noninterest expenseSalaries and employee benefits 18,089 15,667 14,578Premises and equipment 3,990 3,281 3,065Bankcard processing 546 524 510Business development 1,447 1,487 1,444Other noninterest expense 5,490 4,902 4,194
29,562 25,861 23,791
Income before provision for income taxes 20,378 20,765 20,067Provision for income taxes 7,439 7,830 7,412
Net income 12,939$ 12,935$ 12,655$
Earnings per shareBasic 1.08$ 1.09$ 1.09$Diluted 1.08$ 1.08$ 1.08$
See accompanying notes.
Year Ended December 31,December 31,

-48-
Pacific Continental Corporation and SubsidiariesConsolidated Statements of Changes in Stockholders’ Equity
For the Years Ended December 31, 2008, 2007, and 2006
Accumulated
Other
Number Common Retained Comprehensive
of Shares Stock Earnings Loss Total
Balance, January 1, 2006 10,233,580 53,319$ 28,451$ (358)$ 81,412$
Net income 12,655 12,655
Other comprehensive income:
Unrealized gains on securities 184
Deferred income taxes (71)
Other comprehensive income 113 113
Comprehensive income 12,768
Stock options exercised and related tax benefit 413,684 4,350 4,350
Share-based payments 586 586
Cash dividends (3,381) (3,381)
Balance, December 31, 2006 10,647,264 58,255 37,725 (245) 95,735
Net income 12,935 12,935
Other comprehensive income:
Unrealized gains on securities 362
Deferred income taxes (139)
Other comprehensive income 223 223
Comprehensive income 13,158
Stock options exercised and related tax benefit 212,823 2,240 2,240
Stock dividend - 10% 1,074,779 16,863 (16,863)
Share-based payments 551 551
Cash dividends (4,175) (4,175)
Balance, December 31, 2007 11,934,866 77,909 29,622 (22) 107,509
Net income 12,939 12,939
Other comprehensive loss:
Unrealized losses on securities (2,555)
Deferred income taxes 959
Other comprehensive loss (1,596) (1,596)
Comprehensive income 11,343
Stock options exercised and related tax benefit 144,825 1,521 1,521
Share-based payments 589 589
Cash dividends (4,797) (4,797)
Balance, December 31, 2008 12,079,691 80,019$ 37,764$ (1,618)$ 116,165$
See accompanying notes.

-49-
Pacific Continental Corporation and SubsidiariesConsolidated Statements of Cash Flows
2008 2007 2006
Cash flows from operating activities:Net income 12,939$ 12,935$ 12,655$
Adjustments to reconcile net income to net cashfrom operating activities:
Depreciation and amortization, net of accretion 1,396 1,399 1,673Gain on sale of property - - (335)Loss on sale or write-down of property and equipment (25) - 6Provision for loan losses 3,600 725 600Losses (Gains) on foreclosed assets 119 - (42)Deferred income taxes (1,633) (334) (1,049)Share-based compensation 626 577 586Excess tax benefit of stock options exercised (59) (201) (272)Change in:
Interest receivable (369) 346 (654)Deferred loan fees (270) (450) (121)Capitalized loan servicing rights - - 5Production of mortgage loans held-for-sale (13,103) (11,235) (31,988)Proceeds from the sale of mortgage loans held-for-sale 12,693 13,375 30,490Accrued interest payable and other liabilities 637 214 (1,157)Income taxes payable (1,258) 451 891Other assets 3,139 (801) (233)
Net cash provided by operating activities 18,432 17,001 11,055
Cash flow from investing activities:Proceeds from maturities of available for sale
investment securities 18,618 10,868 6,686Purchase of available for sale investment securities (21,923) (25,584) (6,167)Loans made net of principal collections received (130,457) (92,445) (86,667)Proceeds from sales of loans - 37,809 4,232Purchase of loans (12,120) (118) (6,315)Cash paid for acquisitions (3) (15) (12,749)Purchase of property (1,314) (3,670) (2,906)Proceeds from sale of property - - 403Proceeds on sale of foreclosed assets 2,642 - 194Purchase of energy tax credits (1,000) - -Purchase of FHLB stock (6,857) (315) -
Net cash used by investing activities (152,414) (73,470) (103,289)
Cash flow from financing activities:Change in deposits 78,014 3,152 37,321Change in federal funds purchased and FHLB
short-term borrowings 52,640 (1,050) 28,410Proceeds from FHLB term advances originated 1,744,500 689,500 489,002FHLB advances paid-off (1,743,500) (639,804) (462,002)Proceeds from stock options exercised 1,445 1,943 3,547Income tax benefit for stock options exercised 59 201 272Dividends paid (4,797) (4,175) (3,381)
Net cash provided by financing activities 128,361 49,767 93,169
Net increase (decrease) in cash and cash equivalents (5,621) (6,702) 935
Cash and cash equivalents, beginning of year 26,076 32,778 31,843
Cash and cash equivalents, end of year 20,455$ 26,076$ 32,778$
Supplemental information:Noncash investing and financing activities:
Transfers of loans to foreclosed assets 6,706$ 423$ 22$Change in unrealized gain (loss) on securities, net of
deferred income taxes (1,596) 223 113Adjustment to acquired NWBF Goodwill - - (353)
Cash paid during the year for:Income taxes 7,822$ 7,349$ 7,325$Interest 16,526$ 25,959$ 21,793$
Years Ended December 31,
See accompanying notes.

-50-
Pacific Continental Corporation and SubsidiariesNotes to Consolidated Financial Statements
1. Summary of Significant Accounting Policies:
Principles of Consolidation – The consolidated financial statements include the accounts of PacificContinental Corporation (the “Company”), a bank holding company, and its wholly-owned subsidiary,Pacific Continental Bank (the “Bank”) and the Bank’s wholly-owned subsidiaries, PCB ServiceCorporation (which owns and operates bank-related real estate but is currently inactive) and PCB LoanServices Corporation (which owns and operates certain repossessed or foreclosed collateral but iscurrently inactive). The Bank provides commercial banking, financing, mortgage lending and otherservices in Western Oregon and Western Washington. All significant intercompany accounts andtransactions have been eliminated in consolidation.
In November 2005, the Company formed a wholly-owned Delaware statutory business trust subsidiary,Pacific Continental Corporation Capital Trust (the “Trust”), which issued $8,248 of guaranteedundivided beneficial interests in the Pacific Continental’s Junior Subordinated Deferrable InterestDebentures (“Trust Preferred Securities”). Pacific Continental has not consolidated the accounts of theTrust in its consolidated financial statements in accordance with FASB FIN 46R, Consolidation ofVariable Interest Entities. As a result, the junior subordinated debentures issued by PacificContinental to the issuer trust, totaling $8,248 are reflected on Pacific Continental’s consolidatedbalance sheet at December 31, 2008, under the caption, “Junior Subordinated Debentures”. PacificContinental also recognized its $248 investment in the Trust, which is recorded among “Other Assets”in its consolidated balance sheet at December 31, 2008.
Use of Estimates – The preparation of financial statements in conformity with generally acceptedaccounting principles requires management to make estimates and assumptions that affect the reportedamounts of assets and liabilities and disclosure of contingent assets and liabilities at the date of thefinancial statements, and the reported amounts of revenues and expenses during the reporting period.Actual results could differ from those estimates. The most significant estimations made bymanagement involve fair value calculations pertaining to financial assets and liabilities, the calculationof the allowance for loan losses, and the impairment calculation for goodwill.
Cash and Cash Equivalents – For purposes of reporting cash flows, cash and cash equivalents includecash on hand, amounts due from or deposited with banks, interest-bearing balances due from banks,and federal funds sold. Generally, federal funds are sold for one-day periods.
The Bank is required to maintain certain reserves as defined by regulation. Such reserves totaling$1,196 and $3,779 were maintained within the Bank’s cash balances at December 31, 2008 and 2007,respectively.
Securities Available-for-Sale – Securities available-for-sale are held for indefinite periods of time andmay be sold in response to movements in market interest rates, changes in the maturity or mix of Bankassets and liabilities or demand for liquidity. Although management determines the appropriateclassification of securities at the time of purchase, the Bank classified all securities as available-for-salethroughout 2008 and 2007. Securities classified as available-for-sale are reported at estimated fairvalue. The difference between estimated fair value and amortized cost is recorded as a separatecomponent of stockholders’ equity (accumulated other comprehensive income or loss). Fair values forthese investment securities are based on available market prices. Gains and losses on the sale ofavailable-for-sale securities are determined using the specific-identification method. Interest incomeon securities available-for-sale is included in income using the level yield method.

-51-
Declines in fair value of individual available-for-sale securities below their cost that are other thantemporary would result in write-downs of the individual securities to their fair value. The related write-downs would be included in earnings as realized losses. Management believes that all unrealizedlosses on investment securities at December 31, 2008 and 2007 are temporary.
Loans Held for Sale and Mortgage Banking Activities – The Bank originates residential mortgageloans for resale in the secondary market. Sales are without recourse and the Bank generally does notretain mortgage servicing rights. Loans held for sale are carried at the lower of cost or market. Marketvalue is determined on an aggregate loan basis.
Loans and Income Recognition – Loans are stated at the amount of unpaid principal plus loanpremiums for purchased loans, reduced by net deferred loan origination fees, discounts associated withretained portions of loans sold, and an allowance for loan losses. Interest on loans is calculated usingthe simple-interest method on daily balances of the principal amount outstanding. Accrual of interest isdiscontinued on contractually delinquent loans when management believes, after considering economicand business conditions and collection efforts that the borrower’s financial condition is such thatcollection of the interest is doubtful. Interest income is subsequently recognized only to the extent cashpayments are received or the principal balance of the loan is brought current. Loan origination fees, netof origination costs and discounts, are amortized over the lives of the loans as adjustments to yield.
Allowance for Loan Losses – The allowance for loan losses is established through a provision for loanlosses charged to expense. Loans are charged against the allowance for loan losses when managementbelieves that the collectibility of principal is unlikely. The allowance is an amount that managementconsiders adequate to absorb possible losses on existing loans that may become uncollectible based onevaluations of the collectibility of loans and prior loss experience. The evaluations take intoconsideration such factors as changes in the nature of the loan portfolio, overall portfolio quality,review of specific loans, estimated value of underlying collateral, and current economic conditions thatmay affect the borrower’s ability to pay. This evaluation is inherently subjective as it requiresestimates that are susceptible to significant subsequent revision as more information becomes available.
A loan is considered impaired when management believes that it is probable that all amounts will notbe collected according to the contractual terms. An impaired loan is valued using the present value ofexpected cash flows discounted at the loan’s effective interest rate, the observable market price of theloan or the estimated fair value of the loan’s collateral or related guaranty. Loans deemed impaired arespecifically allocated for in the allowance for loan losses if the value of the impaired loan is less thanthe recorded investment in the loan.
Federal Home Loan Bank Stock – The investment in Federal Home Loan Bank (“FHLB”) stock iscarried at par value, which approximates its fair value. As a member of the FHLB system, the Bank isrequired to maintain a minimum level of investment in FHLB stock based on specific percentages of itsoutstanding mortgages, total assets or FHLB advances. As of December 31, 2008, the minimumrequired investment was approximately $8,570. The Bank may request redemption at par value of anystock in excess of the amount the Bank is required to hold. Stock redemptions are at the discretion ofthe FHLB.
Foreclosed Assets – Assets acquired through foreclosure, or deeds in lieu of foreclosure, are initiallyrecorded at fair value, less the estimated cost of disposal, at the date of foreclosure. Any excess of theloan’s balance over the fair value of its foreclosed collateral is charged to the allowance for loan losses.
Improvements to foreclosed assets are capitalized. Subsequent to foreclosure, management performsperiodic valuations and the assets’ carrying value may be adjusted to the lower of carrying amount orfair value, less costs to sell. Write downs to net realizable value, if any, or any disposition gains orlosses are included in noninterest income or expense.
Property, Plant and Equipment – Property is stated at cost, net of accumulated depreciation andamortization. Additions, betterments and replacements of major units are capitalized. Expenditures for

-52-
normal maintenance, repairs and replacements of minor units are charged to expense as incurred.Gains or losses realized from sales or retirements are reflected in operations currently.
Depreciation and amortization is computed by the straight-line method over the estimated useful livesof the assets. Estimated useful lives are 30 to 40 years for buildings, 3 to 10 years for furniture andequipment, and up to the lesser of the useful life or lease term for leasehold improvements.
Goodwill and Other Intangible Assets– Goodwill represents the excess of cost over the fair value ofnet assets acquired in business combinations. Under Statement of Financial Accounting Standard(SFAS) No. 142, Goodwill and Other Intangible Assets, the Bank does not amortize the balance ofgoodwill, but completes periodic assessments of goodwill impairment. Goodwill impairment isdeemed to exist if the net book value of a reporting unit giving rise to the recognition of goodwillexceeds estimated fair value. The Bank’s assessments have not identified impairment of goodwill suchthat the net book value of the applicable reporting unit exceeded its estimated fair value as ofDecember 31, 2008 and 2007.
Advertising – Advertising costs are charged to expense during the year in which they are incurred.Advertising expenses were $756, $883 and $845 for the years ended December 31, 2008, 2007 and2006, respectively.
Income Taxes – Income taxes are accounted for using the asset and liability method. Deferred taxassets and liabilities are recognized for the expected future tax consequences attributable to differencesbetween financial statement carrying amounts of existing assets and liabilities and their respective taxbases. Deferred tax assets and liabilities are calculated using tax rates in effect for the year in whichthe differences are expected to reverse. Valuation allowances are established to reduce the net carryingamount of deferred tax assets if it is determined to be more likely than not, that all or some of thepotential deferred tax asset will not be realized.
The Company adopted the provision of FASB Interpretation No. 48, Accounting for Uncertainty inIncome Taxes (“FIN 48) on January 1, 2007. As a result of the implementation of FIN 48, theCompany recognized no liability for unrecognized tax benefits. The Company files tax returns with theInternal Revenue Service and the Oregon Department of Revenue. Tax returns for years subsequent to2004 remain open to examination by these taxing jurisdictions. The Company’s policy with respect tointerest and penalties ensuing from income tax settlements is to recognize them as noninterest expense.
Earnings Per Share – Basic earnings per share are computed by dividing net income by the weightedaverage number of shares outstanding during the period. Diluted earnings per share include the effectof common stock equivalents that would arise from the exercise of stock options discussed in Note 15.Weighted shares outstanding are adjusted retroactively for the effect of stock dividends.
Weighted average shares outstanding at December 31 are as follows:
2008 2007 2006
Basic 11,980,211 11,830,369 11,586,295Common stock equivalents attributable
to stock-based compensation plans 48,102 110,816 180,880
Diluted 12,028,313 11,941,185 11,767,175
Share-Based Payment Plans – The Company adopted Financial Accounting Standards BoardStatement No. 123R, “Share-Based Payment” (“SFAS 123R”) effective January 1, 2006. SFAS 123Rrequires companies to measure and recognize compensation expense for all share-based payments atthe grant date based on the fair value of the award, as defined in SFAS 123R, and include such costs as

-53-
an expense in our income statements over the requisite service (vesting) period. The Company adoptedSFAS 123R using the modified prospective application, whereby the provisions of the statement havebeen applied prospectively only from the date of adoption for new (issued subsequent to December 31,2005) and unvested stock option awards for which the requisite service is rendered after the date ofadoption. Thus, the Company recognizes as expense the fair value of stock options issued prior toJanuary 1, 2006, but vesting after January 1, 2006, over the remaining vesting period. In addition,compensation expense must be recognized for any awards modified, repurchased, or cancelled after thedate of adoption. The Company uses the Black-Scholes option pricing model to measure fair value.
Fair Value Measurements – SFAS No. 157, Fair Value Measurements, defines fair value as the pricethat would be received to sell an asset or paid to transfer a liability in an orderly transaction betweenmarket participants at the measurement date. SFAS No. 157 establishes a three-level hierarchy fordisclosure of assets and liabilities recorded at fair value. The classification of assets and liabilitieswithin the hierarchy is based on whether the inputs to the valuation methodology used for measurementare observable or unobservable. Observable inputs reflect market-derived or market-based informationobtained from independent sources, while unobservable inputs reflect our estimates about market data.In general, fair values determined by Level 1 inputs utilize quoted prices for identical assets orliabilities traded in active markets that the Company has the ability to access. Fair values determined byLevel 2 inputs utilize inputs other than quoted prices included in Level 1 that are observable for theasset or liability, either directly or indirectly. Level 2 inputs include quoted prices for similar assets andliabilities in active markets, and inputs other than quoted prices that are observable for the asset orliability, such as interest rates and yield curves that are observable at commonly quoted intervals. Level3 inputs are unobservable inputs for the asset or liability, and include situations where there is little, ifany, market activity for the asset or liability. In certain cases, the inputs used to measure fair value mayfall into different levels of the fair value hierarchy. In such cases, the level in the fair value hierarchywithin which the fair value measurement in its entirety falls has been determined based on the lowestlevel input that is significant to the fair value measurement in its entirety. The Company’s assessmentof the significance of a particular input to the fair value measurement in its entirety requires judgment,and considers factors specific to the asset or liability.
Recently Issued Accounting Pronouncements – In December 2007, FASB issued SFAS No. 141(revised), Business Combinations. SFAS No. 141R establishes principles and requirements for how anacquirer recognizes and measures in its financial statements the identifiable assets acquired, theliabilities assumed, any noncontrolling interest in the acquired entity and the goodwill acquired.Furthermore, acquisition-related and other costs will now be expensed rather than treated as costcomponents of the acquisition. SFAS No. 141R also establishes disclosure requirements to enable theevaluation of the nature and financial effects of the business combination. This statement appliesprospectively to business combinations for which the acquisition date is on or after January 1, 2009.We do not expect the adoption of SFAS No. 141R will have a material impact on our consolidatedfinancial statements as related to business combinations consummated prior to January 1, 2009. Weexpect the adoption of SFAS No. 141R will increase the costs charged to operations for acquisitionsconsummated on or after January 1, 2009.
In December 2007, the FASB issued SFAS No. 160, Noncontrolling Interest in Consolidated FinancialStatements, an amendment to ARD No 51. SFAS No. 160 establishes accounting and reportingstandards for the noncontrolling interest in a subsidiary and for the deconsolidation of a subsidiary. Thestandard also requires additional disclosures that clearly identify and distinguish between the interest ofthe parent’s owners and the interest of the noncontrolling owners of the subsidiary. This statement iseffective on January 1, 2009 for the Company, to be applied prospectively. We do not expect theadoption of SFAS No. 160 will have a material impact on the Company’s consolidated financialstatements.
In March 2008, FASB issued SFAS No. 161, Disclosures about Derivative Instruments and HedgingActivities—an amendment of FASB Statement No. 133. SFAS No. 161 expands the disclosurerequirements in SFAS No. 133 about an entity’s derivative instruments and hedging activities. Thisincludes enhanced disclosures regarding how and why an entity uses derivative instruments, how

-54-
derivative instruments and related hedged items are accounted for under SFAS 133 and its relatedinterpretations, and how derivative instruments and related hedged items affect an entity’s financialposition, financial performance, and cash flows. Provisions of this statement are to be appliedprospectively, and comparative disclosures for earlier periods are encouraged. We have adopted theprovisions of SFAS 161 for the year ended December 31, 2008, and the impact was not material to ourconsolidated financial statements.
In May 2008, FASB issued SFAS No. 162, The Hierarchy of Generally Accepted AccountingPrinciples. Under SFAS 162, the U.S. GAAP hierarchy will now reside in the accounting literatureestablished by the FASB. SFAS No. 162 identifies the sources of accounting principles and theframework for selecting the principles used in the preparation of financial statements in conformitywith U.S. GAAP for nongovernmental entities. This statement is effective 60 days after the U.S.Securities and Exchange Commission approves the Public Company Accounting Oversight Board’samendments to AU Section 411, The Meaning of Present Fairly in Conformity With GenerallyAccepted Accounting Principles. We do not expect the adoption of SFAS No 162 will have a materialimpact on the Company’s consolidated financial statements.
In June 2008, FASB issued FSP EITF 03-6-1, Determining Whether Instruments Granted in Share-Based Payment Transactions Are Participating Securities. FSP EITF 03-6-1 concludes that nonvestedshare-based payment awards that contain nonforfeitable rights to dividends or dividend equivalents areparticipating securities and shall be included in the computation of EPS pursuant to the two-classmethod. This statement is effective for fiscal years beginning after December 15, 2008, to be appliedretrospectively. Certain of the Company’s nonvested restricted stock awards qualify as participatingsecurities as described under this pronouncement. The adoption of FSP EITF 03-6-1 will reduce bothbasic and diluted earnings per common share by $0.01 for the year ended December 31, 2007.
In October 2008, FASB issued FSP No. 157-3, Determining the Fair Value of a Financial Asset Whenthe Market for That Asset Is Not Active. FSP No. 157-3 clarifies the application of SFAS 157 in amarket that is not active and provides an example to illustrate key considerations in determining the fairvalue of a financial asset when the market for that financial asset is not active. The FSP does notchange existing generally accepted accounting principles. This FSP was effective immediately uponissuance, including prior periods for which financial statements have not been issued. The impact ofadoption did not have a material impact on the Company’s consolidated financial statements.
On January 12, 2009, FASB issued FSP EITF 99-20-1, Amendments to the Impairment Guidance ofEITF Issue No. 99-20. FSP EITF 99-20-1 addresses certain practice issues in EITF No. 99-20,Recognition of Interest Income and Impairment on Purchased Beneficial Interests and BeneficialInterests That Continue to Be Held by a Transferor in Securitized Financial Assets, by making its other-than-temporary impairment assessment guidance consistent with SFAS No. 115, Accounting forCertain Investments in Debt and Equity Securities. FSP EITF 99-20-1 removes the reference to theconsideration of a market participant’s estimates of cash flows in EITF 99-20, and instead requires anassessment of whether it is probable, based on current information and events, that the holder of thesecurity will be unable to collect all amounts due according to the contractual terms. If it is probablethat there has been an adverse change in estimated cash flows, an other-than-temporary impairment isdeemed to exist, and a corresponding loss shall be recognized in earnings equal to the entire differencebetween the investment’s carrying value and its fair value at the balance sheet date of the reportingperiod for which the assessment is made. This FSP is effective for interim and annual reporting periodsending after December 15, 2008, and shall be applied prospectively. The impact of adoption did nothave a material impact on the Company’s consolidated financial statements.
Reclassifications – Certain amounts contained in the 2007 and 2006 consolidated financial statementshave been reclassified where appropriate to conform to the financial statement presentation used in2008. These reclassifications had no effect on previously reported net income.

-55-
2. Securities Available-for-Sale:
The amortized cost and estimated fair values of securities available-for-sale at December 31, 2008 areas follows:
Securities in Securities inContinuous ContinuousUnrealized Unrealized
Loss LossGross Gross Estimated Position for Position For
Amortized Unrealized Unrealized Fair Less Than 12 MonthsCost Gains Losses Value 12 Months or Longer
Unrealized Loss Positions
Obligations of U.S.Government agencies -$ -$ -$ -$ -$ -$
Obligations of states andpolitical subdivisions 3,573 - 27 3,546 3,546 -
Mortgage-backed securities 19,710 - 3,165 16,545 14,400 2,145
23,283$ -$ 3,192$ 20,091$ 17,946$ 2,145$
Unrealized Gain Positions
Obligations of U.S.Government agencies 1,994$ 35$ -$ 2,029$
Obligations of states andpolitical subdivisions 3,856 83 - 3,939
Mortgage-backed securities 28,390 484 - 28,874
34,240 602 - 34,842
57,523$ 602$ 3,192$ 54,933$
At December 31, 2008, there were 32 investment securities in unrealized loss positions. Theunrealized loss associated with the $2,145 in a continuous unrealized loss position for twelve months orlonger was $658 at December 31, 2008. In the opinion of management, these securities are consideredonly temporarily impaired due to changes in market interest rate or the widening of market spreadssubsequent to the initial purchase of the securities, and not due to concerns regarding the underlyingcredit of the issuers or the underlying collateral. The decline in value of these securities has resultedfrom current economic conditions. The projected average life of the securities portfolio isapproximately three years. Although yields on these securities may be below market rates during thatperiod, no loss of principal is expected.
The amortized cost and estimated fair values of securities available-for-sale at December 31, 2008 areas follows:
Gross Gross EstimatedAmortized Unrealized Unrealized Fair
Cost Gains Losses Value
Obligations of U.S. Government agencies 1,994$ 35$ -$ 2,029$Obligations of states and political subdivisions 7,429 83 27 7,485$Mortgage-backed securities 48,100 484 3,165 45,419
60257,523$ 1,204$ 3,192$ 54,933$

-56-
The amortized cost and estimated fair values of securities available-for-sale at December 31, 2007 areas follows:
Gross Gross EstimatedAmortized Unrealized Unrealized Fair
Cost Gains Losses Value
Obligations of U.S Government agencies 10,532$ 31$ 22$ 10,541$Obligation of states and political subdivisions 7,461 72 19 7,514Mortgage-backed securities 36,037 118 216 35,939
54,030$ 221$ 257$ 53,994$
The amortized cost and estimated fair value of securities at December 31, 2008 and 2007 bycontractual maturity are shown below. Expected maturities will differ from contractual maturitiesbecause issuers may have the right to call or prepay obligations.
Estimated EstimatedAmortized Fair Amortized Fair
Cost Value Cost Value
Due in one year or less 3,024$ 3,055$ 7,965$ 7,950$Due after one year through 5 years 1,484 1,498 4,764 4,804Due after 5 years through 10 years 4,916 4,962 5,264 5,301Due after 10 years - - - -Mortgage-backed securities 48,099 45,418 36,037 35,939
57,523$ 54,933$ 54,030$ 53,994$
2008 2007
No securities available for sale were sold in 2008, 2007, or 2006.
At December 31, 2008, securities with amortized costs of $45,348 (estimated market values of$43,834) were pledged to secure certain Treasury and public deposits as required by law, and to secureborrowing lines.
3. Loans:
Major classifications of loans, including loans held for sale, at December 31 are as follows:
2008 2007
Commercial loans 233,513$ 188,940$Real estate loans 717,529 627,140Consumer loans 7,455 8,226
958,497 824,306Deferred loan origination fees (1,730) (1,984)
956,767 822,322Allowance for loan losses (10,980) (8,675)
945,787$ 813,647$

-57-
Allowance for Loan Losses:
A summary of activity in the allowance for loan losses is as follows for the periods indicated:
2008 2007 2006
Balance, beginning of year 8,675$ 8,284$ 7,792$Provision charged to income 3,600 725 600Loans charged against the allowance (1,477) (396) (223)Recoveries credited to allowance 182 62 115
Balance, end of year 10,980$ 8,675$ 8,284$
It is management’s opinion that the allowance for loan losses is adequate to absorb known and inherentrisks in the loan portfolio. However, actual results may differ from estimates.
Loans considered impaired, net of government guarantees, including all nonaccrual loans, totaled$6,132, $3,671, and $496 at December 31, 2008, 2007, and 2006, respectively. The specific valuationallowance for loan losses related to these impaired loans was approximately $887, $160, and $109 atDecember 31, 2008, 2007, and 2006, respectively. The average recorded investment in impaired loanswas approximately $5,136, $1,512, and $637 in 2008, 2007, and 2006, respectively. Interest incomerecognized on impaired loans during 2008, 2007, and 2006 was approximately $301, $226, and $72,respectively. Additional interest income which would have been realized on nonaccrual and impairedloans if they had remained current and still accruing interest would have been approximately $173,$140, and $14 in 2008, 2007 and 2006, respectively. There were no loans 90 days contractually pastdue and continuing to accrue interest as of December 31, 2008, 2007, and 2006, respectively.
At December 31, 2008, outstanding loans to dental professionals totaled approximately $122,205 andrepresented 12.8% of total outstanding loans. In addition, a substantial portion of the loan portfolio iscollateralized by real estate and is, therefore, susceptible to changes in local market conditions.However, management believes that the loan portfolio is diversified by geographic location and amongindustry groups. At December 31, 2008, outstanding residential construction loans totaledapproximately $74,532 and represented 7.8% of total outstanding loans. In addition, at December 31,2008, unfunded loan commitments for residential construction totaled approximately $19,818. Thereare no other industry concentrations in excess of 10% of the total loan portfolio.
4. Loan Participations and Servicing:
In the normal course of business, the Bank has sold portions of loans to other institutions in order toextend the Bank’s lending capacity or to mitigate risk. The unpaid principal balances of these servicedloans at December 31, 2008 and 2007 were $36,230 and $28,315, respectively. These loans are notincluded in the accompanying consolidated balance sheets and the servicing component of thesetransactions are not material to the consolidated financial statements.

-58-
5. Property:
The balance of property and accumulated depreciation and amortization at December 31 consists of thefollowing:
2008 2007
Land 3,834$ 3,834$Buildings and improvements 18,348 17,994Furniture and equipment 8,130 9,315
30,312 31,143Less accumulated depreciation & amortization (9,549) (10,267)
20,763$ 20,876$
The Bank leases certain facilities for office locations under noncancelable operating lease agreementsexpiring through 2039. Rent expense related to these leases totaled $942, $654, and $712 in 2008,2007 and 2006, respectively. The Bank leases approximately 52% of its Springfield Gateway buildingto others under noncancelable operating lease agreements extending through 2012.
Future minimum payments required and anticipated lease revenues under these leases are:
PropertyLease Leased
Commitments to Others
2009 954$ 444$2010 690 3062011 487 2102012 342 1512013 589 -Thereafter 3,785 -
6,847$ 1,111$
Depreciation expense was $1,488, $1,385, and $1,244 for the years ended December 31, 2008, 2007and 2006, respectively.
The Bank capitalized $39, and $37 of interest expense related to property additions during 2007 and2006, respectively. No interest was capitalized for similar property additions in 2008.

-59-
6. Goodwill and Core Deposit Intangibles:
The following table summarizes the changes in the Company’s goodwill and core deposit intangibleasset for the year ended December 31, 2008.
Core
Deposit TotalGoodwill Intangible Intangibles
Balance, December 31, 2006 22,306$ 1,319$ 23,625$
Sale of Consumer Finance Division loans and offices (275) - (275)
Amortization - (223) (223)
Balance, December 31, 2007 22,031$ 1,096$ 23,127$
Amortization - (223) (223)
Balance, December 31, 2008 22,031$ 873$ 22,904$
The goodwill and core deposit intangible assets relate primarily to the NWB Financial Corporationacquisition in November 2005. During 2007, the Bank sold the loan portfolio and office locations ofits Consumer Finance Division, thus eliminating goodwill recognized on the 2003 purchase of the CoosBay Consumer Finance office. In accordance with SFAS No. 142, Goodwill and Other IntangibleAssets, the Company does not recognize amortization expense related to its goodwill but completesperiodic assessments of goodwill impairment. Impairment, if deemed to exist, would be charged tononinterest expense in the period identified. Management completed its annual assessment of goodwillimpairment as of December 31, 2008 and determined no impairment currently exists.
Forecasted amortization expense is approximately $223 per year from 2009 through 2012 for the coredeposit intangible assets acquired during 2005.
7. Other Assets:
Other assets are comprised of the following for the periods indicated:
2008 2007
Deferred taxes 4,849$ 2,208$
Prepaid expenses and other assets 2,673 1,473
7,522$ 3,681$

-60-
8. Deposits:
Scheduled maturities or repricing of time deposits at December 31 are as follows:
2008 2007
Less than three months 89,498$ 37,616$Three months to one year 33,674 24,689One to three years 21,482 3,526Thereafter 5,891 938
150,545$ 66,769$
9. Federal Funds Purchased:
The Bank has unsecured federal funds borrowing lines with correspondent banks totaling $118,000 atDecember 31, 2008 of which $24,000 was outstanding as of December 31, 2008. The outstandingbalance of these overnight funds was due January 2, 2009 and carried an interest rate of 0.45%. AtDecember 31, 2007, there was $5,360 borrowed against these lines.
The Bank also has a secured federal funds borrowing line available from the Federal Reserve Banktotaling $49,935 at December 31, 2008. The Federal Reserve Bank borrowing line is secured throughthe pledging of approximately $66,579 of commercial loans under the Bank’s Borrower-In-Custodyprogram. At December 31, 2008, the outstanding balance was $20,000, consisting of two, equal,advances. The first is due January 15, 2009 and carries an interest rate of 0.28% and the second is dueFebruary 26, 2009 and carries an interest rate of 0.42%. No balance was outstanding against this lineas of December 31, 2007.
10. Federal Home Loan Bank Borrowings:
The Bank has a borrowing limit with the FHLB equal to 30% of total assets, subject to discountedcollateral and stock holdings. At December 31, 2008, the borrowing line was approximately $327,253.At December 31, 2008, there was $194,500 borrowed on this line, including an overnight $60,000Cash Management Advance and $134,500 in term advances. FHLB stock, funds on deposit withFHLB, and loans are pledged as collateral for borrowings from FHLB. At December 31, 2008, theBank had pledged approximately $441,782 in real estate loans and securities to the FHLB ($273,978 indiscounted pledged collateral).

-61-
Federal Home Loan Bank borrowings by year of maturity and applicable interest rate are summarizedas follows as of December 31:
Rate 2008 2007
Cash Management Advance 0.63% 60,000$ 46,000$2008 2.99 - 4.65% - 110,5002009 0.50 - 5.33% 99,500 8,0002010 3.03 - 5.28% 11,500 8,0002011 2.39 - 5.28% 10,000 2,5002012 3.66 - 5.28% 4,500 2,5002013 2.93 - 4.27% 7,0002016 5.05 - 5.05% 2,000 2,000
194,500$ 179,500$
11. Junior Subordinated Debentures:
In connection with the November 2005 acquisition of NWB Financial Corporation, the Companyformed a wholly-owned Delaware statutory business trust subsidiary, Pacific Continental CorporationCapital Trust (the “Trust”), which issued $8,248 of guaranteed undivided beneficial interests in thePacific Continental’s Junior Subordinated Deferrable Interest Debentures (“Trust PreferredSecurities”). These debentures qualify as Tier 1 capital under Federal Reserve Board guidelines. Allof the common securities of the Trust are owned by Pacific Continental. The proceeds from theissuance of the common securities and the Trust Preferred Securities were used by the Trust topurchase $8,248 of junior subordinated debentures of the Company. The debentures which representthe sole asset of the Trust accrue and pay distributions quarterly at a fixed rate of 6.265% per annum ofthe stated liquidation value of $1 per capital security.
Pacific Continental has entered into contractual arrangements which, taken collectively, fully andunconditionally guarantee payment of: (1) accrued and unpaid distributions required to be paid on theTrust Preferred Securities, (2) the redemption price with respect to any Trust Preferred Securities calledfor redemption by the Trust, and (3) payments due upon a voluntary or involuntary dissolution, windingup, or liquidation of the Trust. The Trust Preferred Securities are mandatorily redeemable uponmaturity of the debentures on January 7, 2036, or upon earlier redemption as provided in the indenture.Pacific Continental has the right to redeem the debentures purchased by the Trust in whole or in part,on or after, January, 7, 2011. As specified in the indenture, if the debentures are redeemed prior tomaturity, the redemption price will be the principal amount and any accrued interest. For the yearsended December 31, 2008, 2007 and 2006, the Company recognized net interest expense of $498, $508and $510, respectively, related to the Trust Preferred Securities.

-62-
12. Income Taxes:
The provision for income taxes for the years ended December 31 consists of the following:
2008 2007 2006
Currently payable:Federal 8,571$ 7,608$ 7,626$State 501 556 835
9,072 8,164 8,461
Deferred:Federal (1,416) (288) (905)State (217) (46) (144)
(1,633) (334) (1,049)
Total provision for income taxes 7,439$ 7,830$ 7,412$
The provision for income taxes results in effective tax rates which are different than the federal incometax statutory rate. The nature of the differences for the years ended December 31 was as follows:
2006
Expected federal incometax provision 7,132$ 35.00% 7,268$ 35.00% 7,023$ 35.00%
State income tax, net offederal income tax effect 660 3.24% 733 3.53% 726 3.62%
Municipal securities tax benefit (113) -0.55% (47) -0.23% (42) -0.21%Equity-based compensation 120 0.59% 199 0.96% 184 0.92%Benefit of purchased tax credits (315) -1.55% (395) -1.90% (231) -1.15%Deferred tax rate adjustments
and other (45) -0.22% 72 0.35% (248) -1.24%
Provision for income taxes 7,439$ 36.51% 7,830$ 37.71% 7,412$ 36.94%
2008 2007
The tax benefit associated with stock option plans reduced taxes payable by $59, $301 and $803 atDecember 31, 2008, 2007 and 2006, respectively. Such benefit is credited to common stock.

-63-
The components of deferred tax assets and liabilities at December 31 are as follows:
2008 2007 2006
Assets:Allowance for loan losses 4,280$ 3,052$ 2,811$Basis adjustments on loans 365 141 200Reserve for self-funded insurance 66 104 70Oregon purchased tax credits 1,491 1,248 887Nonqualified stock options 128 59 37Net unrealized losses on securities 973 14 153Nonaccrual loan interest 86 - -
Total deferred tax assets 7,389 4,618 4,158
Liabilities:Federal Home Loan Bank stock dividends 582 582 597Excess tax over book depreciation 610 394 330Prepaid expenses 238 179 179NWBF acquisition adjustments 336 439 572Other, principally loan orig. costs and deferred fees 580 816 828
Total deferred tax liabilities 2,346 2,410 2,506
Net deferred tax assets/(liabilities) 5,043$ 2,208$ 1,652$
Purchased tax credits of $1,491 will be utilized to offset future state income taxes. These credits arerecognized over a five year period beginning in the year of purchase and have an eight year carryforward period. If unused, the credits will expire in the following years: $614 in 2017, $450 in 2018,$285 in 2019 and $142 in 2020. It is anticipated that all credits will be fully utilized and, accordingly,Management has not reduced these deferred tax assets by a valuation allowance. Management alsobelieves that all net deferred tax assets will be recognized in the normal course of operations and,accordingly, deferred tax assets as of December 31, 2008 have not been reduced by a valuationallowance.
The Company adopted the provision of FASB Interpretation No. 48, Accounting for Uncertainty inIncome Taxes (“FIN 48) on January 1, 2007. As a result of the implementation of FIN 48, theCompany recognized no liability for unrecognized tax benefits. The Company files tax returns with theInternal Revenue Service and the Oregon Department of Revenue. Tax returns for years subsequent to2004 remain open to examination by these taxing jurisdictions. The Company’s policy with respect tointerest and penalties ensuing from income tax settlements is to recognize them as noninterest expense.
13. Retirement Plan:
The Bank has a 401(k) profit sharing plan covering substantially all employees. The plan provides foremployee and employer contributions. The total plan expenses, including employer contributions, were$713, $784 and $748 in 2008, 2007 and 2006, respectively.
14. Stock Option Plans:
Pursuant to the approval of the 2006 Stock Option and Equity Compensation Plan (the “2006 SOECPlan”) at the annual stockholders’ meeting in April 2006, incentive stock options, nonqualified stockoptions, restricted stock, restricted stock units, or stock appreciation rights may be awarded to attractand retain the best available personnel for positions of responsibility with the corporation and itssubsidiaries. Upon adoption of the 2006 SOEC Plan, the Company’s 1999 Employees’ Stock OptionPlan (“1999 ESOP Plan”) and the Directors’ Stock Option Plan (“1999 DSOP Plan”) were cancelledand no longer available for future grants. The exercise price for shares of common stock subject to an

-64-
option under the SOEC Plan shall not be less than 100% of the fair market value of a share of commonstock as of the date of grant of the option; provided, however, that in the case of an incentive stockoption granted to an employee who immediately before the grant of such incentive stock option is astockholder-employee, the incentive stock option exercise price shall be at least 110% of the fair valueof the common stock as of the date of grant of the incentive stock option. The CompensationCommittee of the Board of Directors may impose any terms or conditions on the vesting of an awardthat it determines to be appropriate. For the year ended December 31, 2008, the Company issued 94incentive stock options, of which 92, 312 have a fair value of $2.59 per unit and 2,000 have a fair valueof $2.40 per unit, to selected employees.
Pursuant to the Company’s 2006 SOEC Plan, stock appreciation rights (SARs) may be granted toemployees. The stock appreciation rights may be settled in cash or cash and common stock asdetermined at the date of issuance. The Compensation Committee or the Board of Directors determinesvesting provisions when awards are granted, and the awards granted generally vest over three or fouryears and have a maximum life of ten years. SARs settled in stock are recognized as equity-basedawards while SARs settled in cash are recognized on the balance sheet as liability-based awards, bothof which are granted at the fair market value of our common stock at the grant date. The grant-date fairvalue of the liability based awards vesting in the current period, along with the change in fair value ofthe awards during the period, are recognized as compensation expense and as an adjustment to therecorded liability. For the year ended December 31, 2008, the Company issued 221 SARs, of which121,475 have a fair value of $2.17 per unit and 7,400 have a fair value of $1.87 per unit and are to besettled in stock and 92,374 have a fair value of $2.59 per unit and 1,440 have a fair value of $1.63 perunit and are to be settled in cash.
Also, pursuant to the Company’s 2006 SOEC Plan, non-qualified options awards and restricted stockawards may be granted to directors. Stock options may be granted at exercise prices of not less than100% of the fair market value of our common stock at the grant date. Restricted stock awards may begranted at the fair market value on the date of the grant. The maximum life of options granted underthis plan is ten years from the grant date. The Company issued 21,120 nonqualified stock options, witha fair value of $2.65 per option, during the third quarter 2006. For the year ended December 31, 2007,the Company issued 17,292 nonqualified stock options, with a fair value of $3.09 per option. For theyear ended December 31, 2008, the company issued 4 restricted stock awards to its Directors, with afair value of $14.44 per share, the closing share price on the date of the grant.
The following tables identify the compensation expenses and tax benefits received by the Companyaccording to the compensation plans and awards described above for the years 2008 and 2007:
2008 2007
Comp.
Exp. Tax Benefit
Comp.
Exp. Tax Benefit1999 ESOP Plan 159$ -$ 282$ -$
1999 DSOP Plan - - 7 32006 SOEC - ISOs 158 - 108 -
2006 SOEC - SARS stock 185 68 128 492006 SOEC - SARS cash 37 14 26 10
2006 SOEC - DSOs 27 10 26 102006 SOEC - DRSA 60 22 - -
Total 626$ 114$ 577$ 72$
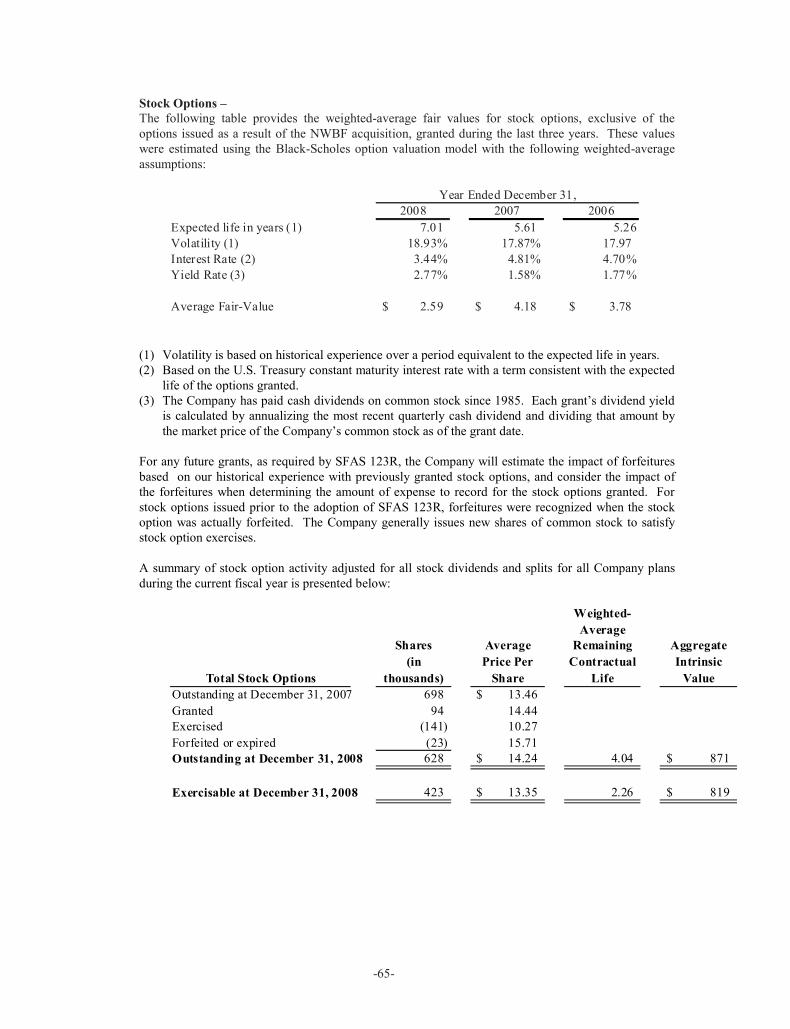
-65-
Stock Options –The following table provides the weighted-average fair values for stock options, exclusive of theoptions issued as a result of the NWBF acquisition, granted during the last three years. These valueswere estimated using the Black-Scholes option valuation model with the following weighted-averageassumptions:
2008 2007 2006
Expected life in years (1) 7.01 5.61 5.26
Volatility (1) 18.93% 17.87% 17.97
Interest Rate (2) 3.44% 4.81% 4.70%
Yield Rate (3) 2.77% 1.58% 1.77%
Average Fair-Value 2.59$ 4.18$ 3.78$
Year Ended December 31,
(1) Volatility is based on historical experience over a period equivalent to the expected life in years.(2) Based on the U.S. Treasury constant maturity interest rate with a term consistent with the expected
life of the options granted.(3) The Company has paid cash dividends on common stock since 1985. Each grant’s dividend yield
is calculated by annualizing the most recent quarterly cash dividend and dividing that amount bythe market price of the Company’s common stock as of the grant date.
For any future grants, as required by SFAS 123R, the Company will estimate the impact of forfeituresbased on our historical experience with previously granted stock options, and consider the impact ofthe forfeitures when determining the amount of expense to record for the stock options granted. Forstock options issued prior to the adoption of SFAS 123R, forfeitures were recognized when the stockoption was actually forfeited. The Company generally issues new shares of common stock to satisfystock option exercises.
A summary of stock option activity adjusted for all stock dividends and splits for all Company plansduring the current fiscal year is presented below:
Shares
(in
thousands)
Average
Price Per
Share
Weighted-
AverageRemaining
Contractual
Life
Aggregate
Intrinsic
Value
Outstanding at December 31, 2007 698 13.46$
Granted 94 14.44Exercised (141) 10.27
Forfeited or expired (23) 15.71
Outstanding at December 31, 2008 628 14.24$ 4.04 871$
Exercisable at December 31, 2008 423 13.35$ 2.26 819$
Total Stock Options

-66-
Shares
(in
thousands)
Weighted-
Average
Grant Date
Fair Value
Outstanding at December 31, 2007 233 3.48$Granted 94 2.59
Vested (111) 4.31Forfeited or expired (11) 2.80Outstanding at December 31, 2008 205 2.66$
Nonvested Options
A summary of value received by employees and directors exercising stock options over the last threeyears is presented below:
2008 2007 2006
Total intrinsic value of
stock options exercised 488$ 1,206$ 2,883$
Year Ended December 31
Stock Appreciation Rights -The following table provides the weighted-average fair values for stock appreciation rights (SARs) tobe settled in stock. These are considered to be equity-based awards. No activity was recognized forthe year ended 2005. The values were estimated using the Black-Scholes option valuation model withthe following weighted-average assumptions:
2008 2007 2006
Expected life in years (1) 6.01 6.00 6.00Volatility (1) 16.99% 18.68% 19.51%
Interest Rate (2) 3.21% 4.81% 4.72%Yield Rate (3) 2.78% 1.58% 1.78%
Average Fair-Value 2.15$ 4.45$ 4.27$
Year Ended December 31,
(1) Volatility is based on historical experience over a period equivalent to the expected life in years.(2) Based on the U.S. Treasury constant maturity interest rate with a term consistent with the expected
life of the options granted.(3) The Company has paid cash dividends on common stock since 1985. Each grant’s dividend yield
is calculated by annualizing the most recent quarterly cash dividend and dividing that amount bythe market price of the Company’s common stock as of the grant date.

-67-
A summary of SAR – stock awards activity adjusted for all stock dividends during the current fiscalyear is presented below:
Awards
(in
thousands)
Average
Price Per
Award
Weighted-
AverageRemaining
Contractual
Life
Outstanding at December 31, 2007 155 17.44$
Granted 128 14.40Exercised - -
Forfeited or expired (17) 16.58
Outstanding at December 31, 2008 266 16.03$ 8.50
Exercisable at December 31, 2008 52 17.09$ 7.87
Total SAR - Stock Awards
Awards
(in
thousands)
Weighted-
Average
Grant Date
Fair Value
Outstanding at December 31, 2007 137 4.22$Granted 128 2.15
Vested (36) 4.21Forfeited or expired (14) 3.63Outstanding at December 31, 2008 215 3.03$
Nonvested SAR - Stock Awards
A summary of SAR – cash awards activity during the current fiscal year is presented below:
Awards
(in
thousands)
Average
Price Per
Award
Weighted-
AverageRemaining
Contractual
Life
Outstanding at December 31, 2007 116 17.41$
Granted 93 14.43Exercised - -
Forfeited or expired (17) 16.33
Outstanding at December 31, 2008 192 16.06$ 8.48
Exercisable at December 31, 2008 39 17.06$ 7.86
Total SAR - Cash Awards
Awards
(in
thousands)
Weighted-
Average
Grant Date
Fair Value
Outstanding at December 31, 2007 102 4.22$Granted 93 1.85
Vested (27) 4.15Forfeited or expired (15) 3.30Outstanding at December 31, 2008 153 2.88$
Nonvested SAR - Cash Awards

-68-
For any future grants, as required by SFAS 123R, the Company will estimate the impact of forfeituresbased on our historical experience with previously granted stock options, and consider the impact of theforfeitures when determining the amount of expense to record for both stock and cash settled SARs.
At December 31, 2008, the Company has estimated unrecognized compensation expense ofapproximately $432, $427, and $132 for unvested stock options, SAR – stock awards and SAR – cashawards, respectively. These amounts are based on a forfeiture rate assumption of 20% for all awardsgranted to employees. The weighted-average period of time the unrecognized compensation expensewill be recognized for the unvested stock options, SAR – stock awards and SAR – cash awards isapproximately 2.3, 2.4 and 2.8 years, respectively.
15. Transactions with Related Parties:
The Bank has granted loans to officers and directors and to companies with which they are associated.Such loans are made on substantially the same terms, including interest rates and collateral, as thoseprevailing at the time for comparable transactions with unrelated parties. Activity with respect to theseloans during the year ended December 31 was as follows:
2008 2007
Balance, beginning of year 1,462$ 2,242$
Additions or renewals 549 249Amounts collected (248) (1,029)
Balance, end of year 1,763$ 1,462$
In addition, there were $478 in commitments to extend credit to directors and officers at December 31,2008, which are included among loan commitments, disclosed Note 17.
16. Financial Instruments with Off-Balance-Sheet Credit Risk:
In order to meet the financing needs of its clients, the Bank commits to extensions of credit and issuesletters of credit. The Bank uses the same credit policies in making commitments and conditionalobligations as it does for other products. In the event of nonperformance by the client, the Bank’sexposure to credit loss is represented by the contractual amount of the instruments. The Bank’scollateral policies related to financial instruments with off-balance-sheet risk conform to its generalunderwriting guidelines.
Commitments to extend credit are agreements to lend to a client as long as there is no violation of anycondition established in the contract. Commitments generally have expiration dates or othertermination clauses and may require payment of a fee. Since some of the commitments may expirewithout being drawn upon, the total commitment amounts do not necessarily represent future cashrequirements.
Letters of credit written are conditional commitments issued by the Bank to guarantee the performanceof a client to a third party. The credit risk involved in issuing letters of credit is essentially the same asthat involved in extending loan facilities to clients.

-69-
Off-balance-sheet instruments at December 31 consist of the following:
2008 2007
Commitments to extend credit (principallyvariable rate) 182,609$ 279,655$
Letters of credit and financial guarantees written 2,298 2,449
17. Fair Value Disclosures of Financial Instruments:
The following disclosures are made in accordance with provisions of SFAS No. 107, DisclosuresAbout Fair Value of Financial Instruments. The use of different assumptions and estimation methodscould have a significant effect on fair value amounts. Accordingly, the estimates of fair value hereinare not necessarily indicative of the amounts that might be realized in a current market exchange.
The estimated fair values of the financial instruments at December 31 are as follows:
Carrying CarryingAmount Fair Value Amount Fair Value
Financial assets:Cash and cash equivalents 20,455$ 20,455$ 26,077$ 26,077$Securities available for sale 54,933 54,933 53,993 53,993Loans held for sale 410 410 - -Loans, net of allowance
for loan losses 945,377 947,091 813,647 809,910Interest receivable 4,021 4,021 3,652 3,652Federal Home Loan
Bank stock 10,652 10,652 3,795 3,795
Financial liabilities:Deposits 722,437 723,188 644,424 644,293Federal funds purchased 44,000 44,000 5,360 5,360Federal Home Loan Bank
borrowings 194,500 196,001 179,500 179,819Junior subordinated debentures 8,248 7,903 8,248 7,758Accrued interest payable 395 395 324 324
20072008
Cash and Cash Equivalents – The carrying amount approximates fair value.
Securities available for sale and Federal Home Loan Bank stock – Fair value is based on quotedmarket prices. If a quoted market price is not available, fair value is estimated using quoted marketprices for similar securities. FHLB stock is valued based on the most recent redemption price.
Loans Held for Sale – Fair value represents the anticipated proceeds from the sale of related loans.
Loans – For variable-rate loans that reprice frequently and have no significant change in credit risk, fairvalues are based on carrying values. Fair value of fixed-rate loans is estimated by discounting thefuture cash flows using current rates at which similar loans would be made to borrowers with similarcredit ratings and for the same remaining maturities. Fair values for impaired loans are estimated usingdiscounted cash flow analyses or underlying collateral values, where applicable.

-70-
Interest receivable and payable – The carrying amounts of accrued interest receivable and payableapproximate their fair value.
Deposits – Fair value of demand, interest-bearing demand and savings deposits is the amount payableon demand at the reporting date. Fair value of time deposits is estimated using the interest ratescurrently offered for deposits of similar remaining maturities.
Federal Funds Purchased – The carrying amount is a reasonable estimate of fair value because of theshort-term nature of these borrowings.
Federal Home Loan Bank Borrowings – Fair value of Federal Home Loan Bank borrowings isestimated by discounting future cash flows at rates currently available for debt with similar terms andremaining maturities.
Junior Subordinated Debentures – Fair value of Junior Subordinated Debentures is estimated bydiscounting future cash flows at rates currently available for debt with similar terms and remainingmaturities.
Off-Balance-Sheet Financial Instruments – The carrying amount and fair value are based on feescharged for similar commitments and are not material.
Effective January 1, 2008, the Company adopted SFAS No. 157, “Fair Value Measures”. Thisstatement defines fair value, establishes a framework for measuring fair value in generally acceptedaccounting principles and expands disclosures about fair value measurements. The statement requiresfair value measurement disclosure of all assets and liabilities that are carried at fair value on either arecurring or non-recurring basis. The Company determines fair value based upon quoted prices whenavailable or through the use of alternative approaches, such as matrix or model pricing, when marketquotes are not readily accessible or available. The valuation techniques used are based on observableand unobservable inputs. Observable inputs reflect market data obtained from independent sources,while unobservable inputs reflect the Company’s market assumptions. These two types of inputs createthe following fair value hierarchy:
Level 1 – Quoted prices for identical instruments in active markets.
Level 2 – Quoted prices for similar instruments in active markets, quoted prices for identicalor similar instruments in markets that are not active and model-derived valuations whoseinputs are observable or whose significant value drivers are observable.
Level 3 – Unobservable inputs are used to measure fair value to the extent that observableinputs are not available. The Company’s own data used to develop unobservable inputs shallbe adjusted for market consideration when reasonably available.
Financial instruments are broken down in the table below by recurring or nonrecurring measurementstatus. Recurring assets are initially measured at fair value and are required to be remeasured at fairvalue in the financial statements at each reporting date. Assets measured on a nonrecurring basis areassets that, due to an event or circumstance, were required to be remeasured at fair value after initialrecognition in the financial statements at some time during the reporting period.

-71-
The table below shows assets measured at fair value as of December 31, 2008:
Carrying
Value
QuotedPrices in
Active
Markets for
Identical
Assets
(Level 1)
Significant
Other
Observable
Inputs
(Level 2)
Significant
Unobservable
Inputs
(Level 3)
Year Ended
December
31,
2008
Total Loss
Recurring Items
Available-for-sale securities 54,933$ -$ 54,933$ -$ -$
Non-Recurring Items
Goodwill 22,031$ 22,031 -
Loans measured for impairment
(net of guarantees) 1,927 - - 1,927 887
Other real estate owned 3,806 - - 3,806 49
Total 82,697$ -$ 54,933$ 27,764$ 936$
Fair Value
18. Commitments and Legal Contingencies:
The Company has entered into employment agreements with two key executive officers. Theemployment agreements provide for minimum aggregate annual base salaries of $550,000, plusperformance adjustments, life insurance coverage, and other perquisites commonly found in suchagreements. The two employment agreements expire in 2011 unless extended or terminated earlier.
Various legal claims arise from time to time in the normal course of business. Based upon analysis ofmanagement, in consultation with the Company’s legal counsel, there are no current legal matterswhich are expected to have a material effect on the Company’s consolidated financial statements.
19. Regulatory Matters:
The Company and the Bank are subject to the regulations of certain federal and state agencies andreceive periodic examinations by those regulatory authorities. In addition, they are subject to variousregulatory capital requirements administered by federal banking agencies. Failure to meet minimumcapital requirements can initiate certain mandatory – and possibly additional discretionary – actions byregulators that, if undertaken, could have a direct material effect on the consolidated financialstatements. Under capital adequacy guidelines and the regulatory framework for prompt correctiveaction, the Bank must meet specific capital guidelines that involve quantitative measures of the Bank’sassets, liabilities, and certain off-balance-sheet items as calculated under regulatory accountingpractices. The Company and the Bank’s capital amounts and classification are also subject toqualitative judgments by the regulators about components, risk weightings and other factors.
Quantitative measures established by regulation to ensure capital adequacy require the Company andthe Bank to maintain minimum amounts and ratios of Total and Tier I capital to risk-weighted assetsand of Tier I capital to leverage assets. Management believes, as of December 31, 2008, that theCompany and the Bank meet all capital adequacy requirements to which they are subject.
As of December 31, 2008 and according to FDIC guidelines, the Bank is considered to be wellcapitalized. To be categorized as well capitalized, the Bank must maintain minimum Total risk-based,

-72-
Tier I risk-based, and Tier I leverage ratios as set forth in the following table. There are no conditionsor events since that notification that management believes have changed the institution’s category.
The Bank’s actual capital amounts and ratios are presented in the table (the Company’s capital ratiosdo not differ significantly from those of the Bank).
Amount Ratio Amount Ratio Amount Ratio
As of December 31, 2008:Total capital (to risk
weighted assets) 113,600$ 11.11% 81,773$ 8% 102,216$ 10%Tier I capital (to risk
weighted assets) 102,424 10.02% 40,887 4% 61,330 6%Tier I capital (to leverage
assets) 102,424 9.68% 42,306 4% 52,882 5%
As of December 31, 2007:Total capital (to risk
weighted assets) 101,065$ 10.97% 73,720$ 8% 92,150$ 10%Tier I capital (to risk
weighted assets) 92,194 10.00% 36,860 4% 55,290 6%Tier I capital (to leverage
assets) 92,194 10.11% 36,491 4% 45,614 5%
Capitalized UnderTo Be Well
For CapitalActual Adequacy Purposes Action Provisions
Prompt Corrective
20. Parent Company Financial Information:
Financial information for Pacific Continental Corporation (Parent Company only) is presented below:
BALANCE SHEETSDecember 31
2008 2007
Assets:Cash deposited with the Bank 621$ 337$Prepaid expenses 6 4Deferred income taxes - -Equity in Trust 248 248Investment in the Bank, at cost plus equity
in earnings 123,670 115,300
124,545$ 115,889$
Liabilities and stockholders' equity:Liabilities 132$ 132$Junior subordinated debentures 8,248 8,248Stockholders' equity 116,165 107,509
124,545$ 115,889$

-73-
STATEMENTS OF INCOMEFor the Periods Ended December 31
2008 2007 2006
Income:Cash dividends from the Bank 4,100$ 2,610$ -$
4,100 2,610 -
Expenses:Interest expense 498 509 510Investor relations 46 52 85Legal, registration expense, and other 94 74 80Personnel costs paid to Bank 110 109 95
748 744 770
Income (loss) before income tax (expense) benefitand equity in undistributedearnings of the Bank 3,352 1,866 (770)
Income tax (expense) benefit (1,274) (709) 293Equity in undistributed earnings of the Bank 10,861 11,778 13,132
Net income 12,939$ 12,935$ 12,655$

-74-
STATEMENTS OF CASH FLOWSFor the Periods Ended December 31
2008 2007 2006
Cash flows from operating activities:Net income 12,939$ 12,935$ 12,655$Adjustments to reconcile net income
to net cash provided by operatingactivities:
Equity in undistributed earnings of (10,861) (11,778) (13,132)the Bank
Other, net (2,542) (1,609) 66
Net cash used in operating activities (464) (452) (411)
Cash flows from investing activities:Dividend received from bank subsidiary 4,100 2,610 -
Net cash provided by investing activities 4,100 2,610 -
Cash flows from financing activities:Proceeds from stock options exercised 1,445 1,939 3,547Dividends paid (4,797) (4,175) (3,381)
Net cash provided by (used in) financing activities (3,352) (2,236) 166
Net increase (decrease) in cash 284 (78) (245)
Cash, beginning of period 337 415 660
Cash, end of period 621$ 337$ 415$
21. Subsequent Events:
On January 7, 2009, the Company completed a private placement stock offering for 750,000 shares ofcommon stock at a price of $13.50 per share. The net proceeds from the offering, after placement feesand estimated transaction expenses, are approximately $9.6 million. Proceeds of the offering will beavailable to support ongoing operating growth and to fund possible future acquisitions.
Effective January 1, 2009, the FDIC has increased federal deposit insurance premiums by 7 basispoints. The increase of these premiums will add to our cost of operations and could have a significantimpact on the Company. New rules governing deposit insurance premiums are expected to go intoeffect on April 1, 2009. These new rules are intended to make assessments more balanced by requiringriskier institutions to pay a larger share.
In addition, during the first quarter of 2009, the FDIC adopted an interim rule imposing an emergencyspecial assessment of 10 basis points on insured institutions, and granting the FDIC the authority toimpose an additional emergency special assessment after June 30, 2009 of up to 10 basis points ifnecessary. The assessment will be calculated on June 30, 2009 deposit balances and collected onSeptember 30, 2009. Based on the Company’s December 31, 2008 deposits subject to FDIC insuranceassessments, the special assessment will be approximately $750 thousand.

-75-
ITEM 9 Changes In and Disagreements with Accountants on Accounting and Financial Disclosure
None
ITEM 9A Controls and Procedures
Evaluation of Disclosure Controls and Procedures
An evaluation was carried out under the supervision and with the participation of the Company’smanagement, including the Chief Executive Officer (“CEO”) and Chief Financial Officer (“CFO”), of theeffectiveness of our disclosure controls and procedures, as required by Rule 13a-15(b) of the SecuritiesExchange Act of 1934. Based on that evaluation, the CEO and CFO have concluded that as of the end ofthe period covered by this report, our disclosure controls and procedures are effective to providereasonable assurance that information required to be disclosed by us in reports that we file or submit underthe Securities Exchange Act of 1934 is recorded, processed, summarized, and timely reported as providedin the SEC rules and forms. As a result of this evaluation, there were no significant changes in our internalcontrol over financial reporting during the three months ended December 31, 2008 that have materiallyaffected, or are reasonably likely to materially affect, our internal control over financial reporting.
Management’s Report on Internal Control Over Financial Reporting
The management of the Company is responsible for establishing and maintaining adequate internal controlover financial reporting. This internal control system has been designed to provide reasonable assuranceto the Company’s management and board of directors regarding the preparation and fair presentation ofthe Company’s published financial statements.
All internal control systems, no matter how well designed, have inherent limitations. Therefore, eventhose systems determined to be effective can provide only reasonable assurance with respect to financialstatement preparation and presentation.
The management of Pacific Continental Corporation has assessed the effectiveness of its internal controlover financial reporting at December 31, 2008. To make this assessment, the Company used the criteriafor effective internal control over financial reporting described in Internal Control – IntegratedFramework, issued by the Committee of Sponsoring Organizations of the Treadway Commission. Basedon this assessment, the Company believes that as of December 31, 2008, the internal control system overfinancial reporting met those criteria.
The Company’s independent auditors, Moss Adams, L.L.P., have issued an attestation report on theCompany’s internal control over financial reporting. The attestation report can be found on pages 35and 36 of this document.
ITEM 9b. Other Information
None
PART III
ITEM 10 Directors, Executive Officers, and Corporate Governance
The information regarding “Directors and Executive Officers of the Registrant” of the Company isincorporated by reference from the sections entitled “ELECTION OF DIRECTORS—Nominees forDirector,” “MANAGEMENT” and “COMPLIANCE WITH SECTION 16(a) FILINGREQUIREMENTS” of the Company’s 2009 Annual Meeting Proxy Statement (the “ProxyStatement”).

-76-
In September of 2003, consistent with the requirements of The Sarbanes-Oxley Act of 2002, theCompany adopted a Code of Ethics applicable to senior financial officers including the principalexecutive officer. The Code of Ethics was amended in 2007 to reflect non-material changes and is filedas Exhibit 14 to the Company’s Annual Report on Form 10-K for the year-end December 31, 2008.The Code of Ethics can also be accessed electronically by visiting the Company’s website.
Information regarding the Company’s Audit Committee financial expert appears under the sectionentitled “INFORMATION REGARDING THE BOARD OF DIRECTORS AND ITS COMMITTEES– Certain Committees of the Board of Directors” in the Company’s Proxy Statement and isincorporated by reference.
ITEM 11 Executive Compensation
The information regarding “Executive Compensation” is incorporated by reference from the sectionsentitled “COMPENSATION DISCUSSION AND ANALYSIS,” “EXECUTIVE COMPENSATION”and “DIRECTOR COMPENSATION” of the Proxy Statement.
ITEM 12 Security Ownership of Certain Beneficial Owners and Management and RelatedShareholder Matters
The information regarding “Security Ownership of Certain Beneficial Owners and Management” isincorporated by reference from the section entitled “SECURITY OWNERSHIP OF CERTAINBENEFICIAL OWNERS AND MANAGEMENT” of the Proxy Statement.
ITEM 13 Certain Relationships and Related Transactions and Director Independence
The information regarding “Certain Relationships and Related Transactions” is incorporated byreference from the section entitled “TRANSACTIONS WITH MANAGEMENT” of the ProxyStatement.
ITEM 14 Principal Accounting Fees and Services
For information concerning principal accountant fees and services as well as related pre-approvalpolicies, see “AUDITORS – Fees Paid to Independent Accountants” in the Company’s ProxyStatement, which is incorporated by reference.

-77-
ITEM 15 Exhibits and Financial Statement Schedules
(a)(1) See Index to Consolidated Financial Statements filed under item 8 of this report.
All other schedules to the financial statements required by Regulation S-X are omitted because they arenot applicable, not material, or because the information is included in the financial statements or relatednotes.
(a)(2) Exhibit Index
Exhibit3.1 Amended Articles of Incorporation (1)3.2 Amended and Restated Bylaws (2)10.1 1999 Employee Stock Option Plan (3)10.2 1999 Director’s Stock Option Plan (3)10.3 2006 Stock Option and Equity Compensation Plan (4)10.4 Form of Restricted Stock Award Agreement (4)10.5 Form of Stock Option Award Agreement (4)10.6 Form of Restricted Stock Unit Agreement (4)10.7 Form of Stock Appreciation Rights Agreement (4)10.8 Change of Control/Salary Continuation Agreement for Michael Reynolds (5)10.9 Change of Control/Salary Continuation Agreement for Daniel Hempy (5)10.10 Change of Control/Salary Continuation Agreement for Basant Singh (6)10.11 Executive Employment Agreement for Roger Busse (7)10.12 Executive Employment Agreement for Hal Brown (7)10.13 NWB Financial Corporation Employee Stock Option Plan (8)10.14 NWB Financial Corporation Director Stock Option Plan (8)10.15 Director Fee Schedule, Effective January 1, 200910.16 Director Stock Trading Plan (7)10.17 Form of Common Stock Purchase Agreement between the Company and each of the
Purchasers, dated as of January 6, 2009 (9)10.18 Form of Registration Rights Agreement between the Company and each of the
Purchasers, dated as of January 6, 2009 (9)14 Code of Ethics for Senior Financial Officers and Principal Executive Officer (7)23.1 Accountants Consent of Moss Adams L.L.P.31.1 302 Certification, Hal Brown, President and Chief Executive Officer31.2 302 Certification, Michael A. Reynolds, Executive Vice President and Chief Financial
Officer32 Certifications Pursuant to 18 U.S.C. Section 1350(1) Incorporated by reference to Exhibit 3 of the Company’s Quarterly Report on 10-Q for the
Quarter ended June 30, 2007.(2) Incorporated by reference to Exhibit 3.1 of the Company’s Quarterly Report on Form 10-Q for
the Quarter ended September 30, 2008.(3) Incorporated by reference to Exhibits 99.1 - 99.4 of the Company’s S-8 Registration Statement
(File No. 333-109501).(4) Incorporated by reference to Exhibits 99.1 - 99.5 of the Company’s S-8 Registration Statement
(File No. 333-134702).(5) Incorporated by reference to Exhibits 10.1 and 10.2 of the Company’s Quarterly Report on 10-
Q for the Quarter ended March 31, 2005.(6) Incorporated by reference to Exhibit 10.10 of the Registration Statement on Form S-4 (File No.
333-128968).(7) Incorporated by reference to Exhibits 10.11, 10.12, 10.16 and 14 of the Company’s Annual
Report on Form 10-K for the fiscal year ended December 31, 2007.(8) Incorporated by reference to Exhibits 99.1 and 99.2 of the Company’s S-8 Registration
Statement (File No. 333-130886).(9) Incorporated by reference to Exhibits 10.1 and 10.2 of the Company’s Current Report on Form
8-K filed January 8, 2009.(a)(3) Financial Statement Schedules

-78-
SIGNATURES
Pursuant to the requirements of Section 13 or 15(d) of the Securities Exchange Act of 1934, the Company hasduly caused this report to be signed on its behalf by the undersigned on March 13, 2009.
PACIFIC CONTINENTAL CORPORATION(Company)
By:Hal BrownChief Executive Officer
Pursuant to the requirements of the Securities Exchange Act of 1934, this report has been signed below by thefollowing persons on behalf of the Company and in the capacities indicated on the 13th day of March 2009.
Principal Executive Officer
By Chief Executive OfficerHal M. Brown and Director
Principal Financial and Accounting Officer
By Executive Vice President andMichael A. Reynolds Chief Financial Officer
Remaining Directors
By Chairman of the BoardRobert A. Ballin
By Vice Chairman By DirectorDonald G. Montgomery Michael D. Holzgang
By Director By DirectorLarry G. Campbell Donald L. Krahmer, Jr.
By Director By DirectorCathi Hatch John H. Rickman
By Director By ___________________________ DirectorMichael S. Holcomb R. Jay Tejera
By DirectorMichael E. Heijer

-78-
SIGNATURES
Pursuant to the requirements of Section 13 or 15(d) of the Securities Exchange Act of 1934, the registrant hasduly caused this report to be signed on its behalf by the undersigned on March 13, 2009.
PACIFIC CONTINENTAL CORPORATION(Company)
By: /s/ Hal M. BrownHal BrownChief Executive Officer
Pursuant to the requirements of the Securities Exchange Act of 1934, this report has been signed below by thefollowing persons on behalf of the Company and in the capacities indicated on the 13th day of March, 2009.
Principal Executive Officer
By /s/ Hal M. Brown Chief Executive OfficerHal Brown and Director
Principal Financial and Accounting Officer
By /s/ Michael A. Reynolds Executive Vice President andMichael A. Reynolds Chief Financial Officer
Remaining Directors
By /s/ Robert A. Ballin Chairman of the BoardRobert A. Ballin
By /s/ Donald G. Montgomery Vice Chairman By /s/ Michael D. Holzgang DirectorDonald G. Montgomery Michael D. Holzgang
By /s/ Larry G. Campbell Director By /s/ Donald L. Krahmer, Jr. DirectorLarry G. Campbell Donald L. Krahmer, Jr.
By /s/ Cathi Hatch Director By /s/ John H. Rickman DirectorCathi Hatch John H. Rickman
By /s/ Michael S. Holcomb Director By /s/ R. Jay Tejera DirectorMichael S. Holcomb R. Jay Tejera
By /s/ Michael E. Heijer DirectorMichael E. Heijer

-79-
CERTIFICATION
I, Hal Brown, certify that:1. I have reviewed this Form 10-K of Pacific Continental Corporation;
2. Based on my knowledge, this report does not contain any untrue statement of a material fact oromit to state a material fact necessary to make the statements made, in light of the circumstancesunder which such statements were made, not misleading with respect to the period covered bythis report;
3. Based on my knowledge, the financial statements, and other financial information included in thisreport, fairly present in all material respects the financial condition, results of operations and cashflows of the registrant as of, and for, the periods presented in this report;
4. The registrant's other certifying officer(s) and I are responsible for establishing and maintainingdisclosure controls and procedures (as defined in Exchange Act Rules 13a-15(e) and 15d-15(e))and internal control over financial reporting (as defined in Exchange Act Rules 13a-15(f) and15d-15(f)) for the registrant and have:
(a) Designed such disclosure controls and procedures, or caused such disclosure controls andprocedures to be designed under our supervision, to ensure that material informationrelating to the registrant, including its consolidated subsidiaries, is made known to us byothers within those entities, particularly during the period in which this report is beingprepared;
(b) Designed such internal control over financial reporting, or caused such internal controlover financial reporting to be designed under our supervision, to provide reasonableassurance regarding the reliability of financial reporting and the preparation of financialstatements for external purposes in accordance with generally accepted accountingprinciples;
(c) Evaluated the effectiveness of the registrant's disclosure controls and procedures andpresented in this report our conclusions about the effectiveness of the disclosure controlsand procedures, as of the end of the period covered by this report based on suchevaluation; and
(d) Disclosed in this report any change in the registrant’s internal control over financialreporting that occurred during the registrant’s most recent fiscal quarter (the registrant’sfourth fiscal quarter in the case of an annual report) that has materially affected, or isreasonably likely to materially affect, the registrant’s internal control over financialreporting; and
5. The registrant's other certifying officer(s) and I have disclosed, based on our most recentevaluation of internal control over financial reporting, to the registrant's auditors and the auditcommittee of the registrant's board of directors (or persons performing the equivalent functions):(a) All significant deficiencies and material weaknesses in the design or operation of internal
control over financial reporting which are reasonably likely to adversely affect theregistrant’s ability to record, process, summarize and report financial information; and
(b) Any fraud, whether or not material, that involves management or other employees whohave a significant role in the registrant's internal control over financial reporting.
Date: March 13, 2009 /s/ Hal BrownHal Brown, Chief Executive Officer

-80-
CERTIFICATION
I, Michael A. Reynolds, certify that:1. I have reviewed this Form 10-K of Pacific Continental Corporation;
2. Based on my knowledge, this report does not contain any untrue statement of a material fact oromit to state a material fact necessary to make the statements made, in light of the circumstancesunder which such statements were made, not misleading with respect to the period covered bythis report;
3. Based on my knowledge, the financial statements, and other financial information included in thisreport, fairly present in all material respects the financial condition, results of operations and cashflows of the registrant as of, and for, the periods presented in this report;
4. The registrant's other certifying officer(s) and I are responsible for establishing and maintainingdisclosure controls and procedures (as defined in Exchange Act Rules 13a-15(e) and 15d-15(e))and internal control over financial reporting (as defined in Exchange Act Rules 13a-15(f) and15d-15(f)) for the registrant and have:
(a) Designed such disclosure controls and procedures, or caused such disclosure controls andprocedures to be designed under our supervision, to ensure that material informationrelating to the registrant, including its consolidated subsidiaries, is made known to us byothers within those entities, particularly during the period in which this report is beingprepared;
(b) Designed such internal control over financial reporting, or caused such internal controlover financial reporting to be designed under our supervision, to provide reasonableassurance regarding the reliability of financial reporting and the preparation of financialstatements for external purposes in accordance with generally accepted accountingprinciples;
(c) Evaluated the effectiveness of the registrant's disclosure controls and procedures andpresented in this report our conclusions about the effectiveness of the disclosure controlsand procedures, as of the end of the period covered by this report based on suchevaluation; and
(d) Disclosed in this report any change in the registrant’s internal control over financialreporting that occurred during the registrant’s most recent fiscal quarter (the registrant’sfourth fiscal quarter in the case of an annual report) that has materially affected, or isreasonably likely to materially affect, the registrant’s internal control over financialreporting; and
5. The registrant's other certifying officer(s) and I have disclosed, based on our most recentevaluation of internal control over financial reporting, to the registrant's auditors and the auditcommittee of the registrant's board of directors (or persons performing the equivalent functions):(a) All significant deficiencies and material weaknesses in the design or operation of internal
control over financial reporting which are reasonably likely to adversely affect theregistrant’s ability to record, process, summarize and report financial information; and
(b) Any fraud, whether or not material, that involves management or other employees whohave a significant role in the registrant's internal control over financial reporting.
Date: March 13, 2009 /s/ Michael A. ReynoldsMichael A. Reynolds, Executive Vice President & CFO

-81-
CERTIFICATION PURSUANT TO18 U.S.C. SECTION 1350,
AS ADOPTED PURSUANT TOSECTION 906 OF THE SARBANES-OXLEY ACT OF 2002
In connection with the Annual Report of Pacific Continental Corporation (the “Company”) on Form 10-Kfor the period ending December 31, 2008 as filed with the Securities and Exchange Commission on the datehereof (the “Report”), we, Hal M. Brown, Chief Executive Officer, and Michael A. Reynolds, ChiefFinancial Officer, certify, pursuant to 18 U.S.C. Section 1350, as adopted pursuant to Section 906 of theSarbanes-Oxley Act of 2002, that:
(1) The Report fully complies with the requirements of Section 13(a) or 15(d) of theSecurities Exchange Act of 1934; and
(2) The information contained in the Report fairly presents, in all material respects, thefinancial condition and results of operations of the Company.
/s/ Hal M. Brown /s/ Michael A. ReynoldsHal M. Brown Michael A. ReynoldsChief Executive Officer Chief Financial Officer
Dated: March 13, 2009

This page intentionally left blank

This page intentionally left blank