pacific-basin finance journal - nagoya universitykato/contents/works/paper/images...pacific-basin...
TRANSCRIPT

Pacific-Basin Finance Journal 17 (2009) 41–57
Contents lists available at ScienceDirect
Pacific-Basin Finance Journal
j ourna l homepage: www.e lsev ie r.com/ locate /pacf in
Can margin traders predict future stock returns in Japan?☆
Takehide Hirose a, Hideaki Kiyoshi Kato b, Marc Bremer c,⁎a Sumitomo Trust and Banking Co. Ltd., Japanb Nagoya University, Japanc Nanzan University, Japan
a r t i c l e i n f o
☆ The authors thank an anonymous referee, S. GhAuckland meeting of the Asian Finance Association fofrom the participants at the Nippon Finance Associatiin Osaka. This research was partially supported by Jindividual authors and do not necessarily reflect the⁎ Corresponding author. School of Business Admi
Japan. Tel.: +81 52 832 3111x3849; fax: +81 52 832 2E-mail address: [email protected] (M. Brem
0927-538X/$ – see front matter © 2008 Elsevier B.Vdoi:10.1016/j.pacfin.2008.01.001
a b s t r a c t
Article history:Received 9 November 2006Accepted 28 January 2008Available online 4 March 2008
A growing body of literature suggests that investor sentiment affectsstock prices both at the firm level and at the market level. This studyexamines the relationship between investor behavior and stockreturns focusing on Japanese margin transactions using weekly datafrom 1994 to 2003. Margin trading is dominated by individualinvestors in Japan. In analysis at the firm level, we find a significantcross-sectional relationship between margin buying and stockreturns. Both market-level and firm-level analyses show that marginbuying traders follow herding behavior. They seem to follow positivefeedback trading behavior for small-firm stocks and negative feedbacktrading behavior for large firm stocks. Our results show thatinformation about margin buying helps predict future stock returns,especially for small-firm stocks at short horizons. The predictivepower does not diminish even after controlling for firm size andliquidity.
© 2008 Elsevier B.V. All rights reserved.
JEL classification:G12G14
Keywords:Behavioral financeInvestor sentimentMargin tradingJapan
Why do the mechanisms of borrowing securities and selling them short appear so underdeveloped?Why are some crucial securities that arbitrageurs need missing altogether? (From Ch.7, OpenProblems)Andrei Shleifer, Inefficient Markets (2000).
on Rhee, Malcolm Baker, Takato Hiraki, Terry Odean, and participants in ther their helpful comments. We also received useful comments on an earlier drafton meeting in 2004 and at the Second Behavioral Economics Workshop (2004)SPS KAKENHI (19530404). The views expressed in this paper are those of theposition of Sumitomo Trust and Banking.nistration, Nanzan University, 18 Yamazato-cho, Showa-ku, Nagoya 466-8673,104.er).
. All rights reserved.

42 T. Hirose et al. / Pacific-Basin Finance Journal 17 (2009) 41–57
1. Introduction
A growing section of the finance literature suggests that investor sentiment affects stock prices both atthe firm level and at the market level. This paper extends this literature by linking investor sentiment tomargin trades and examines how these quantities predict future stock returns in Japan. De Long et al.(1990) demonstrate that if risk-averse arbitrageurs know that prices may diverge further away from theirfundamental values before they converge, theywill take smaller positions when betting against mispricing.Therefore, if the sentiments of noise traders are systematically correlated and there are constraints onarbitrage, their investment behavior may predict future market prices. Yet, the direction of causality is notentirely clear because the behavior of noise traders may be influenced by the market.
Fisher and Statman (2000) examine the usefulness of a variety of sentiment variables in predictingshort-horizon market returns. Baker and Wurgler (2006) examine how investor sentiment affects thecross-section of stock returns. When sentiment is pessimistic, subsequent returns are relatively high forsmaller stocks, high-volatility stocks, unprofitable stocks, non-dividend-paying stocks, extreme-growthstocks, and distressed stocks. When sentiment is optimistic, these patterns attenuate or, in several cases,fully reverse. Brown and Cliff (2004) document that returns cause sentiment rather than vice versa.
In his analysis of volatility, Brown (1999) finds deviations from the mean level of investor sentiment arepositively related to volatility during the same period.Wang et al. (2006) examine the relationship betweensentiment, returns, and volatility and find that investor sentiment is caused by returns and volatility ratherthan vice versa. In addition, lagged returns cause volatility.
Odean's (1998) model shows that investor overconfidence will increase trading volume. Gervais andOdean (2001) argue that high past market returns may cause overconfidence in individual investors if theyhappened to invest in stocks in the same period. Using monthly market data, Statman et al. (2004) showthat investor overconfidence is positively related to trading volume. Baker and Stein (2004) propose amodel that explains why increases in liquidity are associated with lower subsequent returns at both thefirm level and the aggregate level. When short sales are constrained, unusually high liquidity is a symptomof market domination by irrational investors who underreact to the information contained in order flow.
Individual investors have long been considered to be noise traders. They are less informed or trade fornon-informational reasons. Nevertheless, if their trades are correlated and arbitrage is limited in someway,their investments will change asset prices. Lee et al. (1991) argue that the discount on closed-end funds canbe explained by the irrational behavior of individual investors. Because of leverage, margin transactions aresometimes considered speculative and major players in these transactions tend to be individual investors.Therefore, we argue that margin transactions tend to reflect individual investor sentiment.
This study examines the relationship between investor behavior and stock returns by focusing onmargintransactions in Japan. Margin trades are widely thought to be dominated by individual investors in Japan.First, we confirm that margin transactions are indeed dominated by individual investors. Second, weexamine how margin transactions are related to stock returns. We look for specific patterns that areconsistent with apparently irrational behavior. Our market-level analysis shows that margin buying isdominated by individual investors, but that margin selling is not. In analysis at the firm level, we find asignificant cross-sectional relationship betweenmargin buying and stock returns.We do not find significantpatterns for margin selling. Both the market-level and firm-level analyses show that margin buying tradersfollow herding behavior. They seem to follow positive feedback trading behavior for small-firm stocks andnegative feedback trading behavior for large firm stocks. As predicted, margin traders heavily impact thestock prices of small firms over a certain period of time. The deviation from previous value exists longer andis more pronounced for small-firm stocks that are mainly owned by individual investors.
Our results show that information about margin buying shares outstanding helps predict future stockreturns, especially for small-firm stocks. The predictive power does not diminish even after controlling forliquidity. This is consistent with De Long et al. (1990), who show that stock prices deviate from theirfundamental values for a certain period of time due to excess demand by noise traders.
This is the first comprehensive study of Japanesemargin trading using weekly data over a long period oftime. Theseweekly data covermost stocks eligible formargin trades. Standardizedmargin trades have beenpracticed in Japan for more than fifty years. In contrast to the United States, the Japanese margin tradingsystem is advanced and highly centralized. The Japanese system allows stockbrokers to borrow securitiesand funds from specialized securities finance companies when there is a shortage of securities and funds.

43T. Hirose et al. / Pacific-Basin Finance Journal 17 (2009) 41–57
Because of this highly evolved system, margin traders almost always use the standardized margin tradingsystem when they can satisfy its requirements. Japanese margin data are complete and market-widecompared to U.S. data, which include margin transactions for only the largest brokerage firms.Furthermore, individual firm data are not available in the U.S.
The structure of the paper is as follows. The next section describes and compares margin transactions inJapan and the U.S. The third section discusses Japanese margin data. The fourth section discusses results forthe aggregate market. The fifth section examines margin transactions and stock returns at the firm level. Abrief conclusion follows.
2. Margin transactions in Japan
There are two types of margin transactions that are currently practiced in Japan; the first is negotiationbased margin trading and the second is standardized margin trading. Negotiation margin transactions areusually between large financial institutions. The terms and fees are freely negotiated. On the other hand,standardizedmargin trades must follow specific rules determined by the stock exchange. The stock exchangedetermines which stocks are eligible for margin trading on the basis of liquidity. Standardizedmargin tradingin Japan is similar to margin trading in the U.S., but certain features are importantly different.
Japan started its standardizedmargin transactions system in 1951. Loans and borrowed stock certificatesfor these margin transactions are provided by specialized securities finance companies, the largest of thesebeing the Japan Securities Finance Company. The goal of the system was to stabilize and expand Japan'ssecurities market amid the confusion of the early postwar period. The system allows stockbrokers to easilyborrow securities and funds from securities finance companies. This process is called a security loantransaction (taishaku torihiki). The system's intent is to attract more individual investors. Standardizedmargin transactions proceed in the following way: brokers accepting orders from investors forstandardized margin transactions will check their inventory of stocks, and match the order with otherorders for the same stock by other investors. When the margin order by an investor cannot be met with theinventory that is on hand or that is available through the matching process, brokers will then go tosecurities finance companies to fill the gap. It is likely that standardized margin transactions are mainlyused by individual investors because they are less creditworthy. The transactions are quite convenient forindividuals because various conditions, especially interest rates, are fixed by the systemwith little regard totheir creditworthiness, unlike other transaction modes.1
Accelerated financial deregulation, due to the Japanese version of the financial Big Bang, triggered the full-scale start of ordinary security loan transactions in December 1998. In this system, ordinary loan transactionswere liberalized so that the borrowing rate and repayment period can be freely negotiated by investors andbrokers. This was the start of negotiation based margin trading. Although this type of margin transaction isavailable for almost all Tokyo Stock Exchange (TSE) stocks and is more flexible, the major investors in ordinaryloan transactions are institutions, not individuals. Individual investors are usually less creditworthy thaninstitutional investors, hence this type of transaction is usually not available to them. Since this margin system isrelatively new, its volume is still much smaller than that of standardized margin transactions.
It is highly likely that the buying entities and the selling entities in margin transactions are differentinvestors. The buying entities, who effectively borrowmoney from their brokers, are likely to be individualinvestors. Institutional investors do not have to borrow money from their brokers to invest. On the otherhand, margin selling entities are not necessarily individual investors. Institutional investors will sell shortjust like individual investors. In summary, we argue that margin buying is mainly the activity of individual
1 Standardized margin transaction positions are required to be closed out within 6 months. Before the Japanese Big Bang,brokerage commissions, margin interest, shinagashi-ryo (premium charges), administration fees, and haito-chosei-gaku (ex-dividendadjustment) were determined by the stock exchange. After the Big Bang, only shinagashi-ryo and haito-chosei-gaku have beenregulated. When stock loans outstanding exceed outstanding loans between the brokers and the securities finance companies, thecost of providing securities is charged to all the investors who sell the particular stock on margin; this is shinagashi-ryo. Thoughstockbrokers can now set their own conditions on margin transactions, they generally set the same conditions as security loanstransactions. Both for standardized margin trades and for negotiation based margin trades, investors deposit 300,000 yen plus anadditional 30% or more of the contract's value with their broker. These deposit levels are determined by cabinet office regulationsand stock exchange rules. Investors are obligated to contribute additional funds to their margin account when a paper loss isincurred.

44 T. Hirose et al. / Pacific-Basin Finance Journal 17 (2009) 41–57
investors, but margin selling will be conducted by both institutions and individuals. Therefore, the analysisof margin buying is particularly interesting because these transactions are likely to be a result of individualinvestor sentiment.
3. Data
Our sample consists of all stocks eligible for margin transactions listed on the 1st and 2nd sections of theTSE during the period from December 17, 1994 through May 17, 2003.2 The number of margin sharesoutstanding is collected fromweekly TSE reports.3 The final sample has 431 observations and 494,460 firm-weeks from a possible 440 observations and 834,491 firm-weeks.
This study examines the relationship between short-term stock returns and margin trading using bothaggregate market-level data and firm-level transaction data. In the market-level analysis, we aggregate thenumber of shares outstanding of all margin transactions for all eligible stocks. Fig. 1 shows aggregatemargin transaction shares outstanding (on the left-hand axis) and a TSE index (on the right-hand axis).4
While it is premature to draw conclusions, the figure shows a high degree of co-movement betweenmargin buying and stock prices. The co-movement is especially striking from the late 1990s. The number ofshares outstanding for margin buying rose substantially from 1999, whereas the number of selling sharesoutstanding stayed relatively lower until late 2001. On average, the number of shares outstanding formargin buying was almost double that of selling for much of the sample period. Table 1 shows basicsummary statistics for our margin transactions data. We also show summarized trading volume for allstocks in this table. Average margin buying outstanding is much higher than that of margin selling. Thisindicates that the market for margin buying is much larger and more liquid. The average change in marginbuying outstanding is almost equal to the average change in margin selling outstanding. The standarddeviation of the shares outstanding for buying is somewhat larger than that of selling.We also compute theserial correlation of all of the variables. The change in margin buying is serially correlated at lag one. Thismeans that an increase in MBO this week is followed by an increase in MBO in the subsequent week. Asexpected, the levels of both margin buying and margin selling are highly serially correlated.
In the market-level analysis, we examine the relationship between the weekly change in margintransactions outstanding and both market returns and market volatility. We are concerned with howmargin traders' investment behavior is related to market returns and volatility. De Long et al. (1990)demonstrate that if risk averse, well-informed investors know prices may diverge further away fromfundamental values before eventually converging, they may take smaller positions when they attempt toarbitragemispricing. Hence, the sentiment of herding noise traders may predict future prices and volatility.We argue that MBO is a plausible proxy of the sentiment of Japanese noise traders. In addition, weinvestigate the relationship between margin transactions outstanding and trading volume because Bakerand Stein (2004) predict that high liquidity is a symptomof market domination by irrational investors.5 Theimportant question to be asked is who the major margin traders are. In order to identify major margintraders, we use investor data from the Tokyo Stock Exchange to focus on four types of investors: individuals,financial institutions, securities firms, and foreign investors. Financial institutions include insurancecompanies, long-term credit banks, regional banks, and trust banks.
We use the Tokyo Stock Exchange Price Index (TOPIX) to calculate market returns. The TOPIX is a value-weighted market index of all firms listed on the 1st section of the TSE. Fig. 2 shows the return periodconstruction; t is the weekend measurement point. The returns in the portfolio formation period, from
2 In some of the subsequent analysis we divide this sample into two sub-periods: December 17, 1994 to March 6, 1999 and March13, 1999 to May 17, 2003. We explore these sub-periods because of a substantial increase in margin buying that started in late 1998/early 1999. This increase could indicate a change in the trading behavior of investors and may correspond to a telecommunications/internet bubble and/or financial deregulation in the late 1990s.
3 The TSE publishes the previous Friday's closing number of margin shares outstanding on Tuesday. We use outstanding marginshares measured in terms of trading units that adjust for stock splits. We exclude data for weeks in the very few cases where the TSEdid not make a margin announcement.
4 This TSE index is the TOPIX that is described below. The Nikkei 225, another well-known index, also suggests that stock pricesand margin purchases move together.
5 Trading volume is defined as the total number of shares traded during a given week on the TSE in terms of trading units afteradjustment for stock splits.

Fig. 1. Aggregate outstanding margin transactions. This figure shows aggregate shares outstanding of margin transactions for alleligible stocks listed on the Tokyo Stock Exchange (TSE) 1st and 2nd sections. The TOPIX is a value-weighted index of 1st section of theTSE stock prices. The sample period is from December 17, 1994 to May 17, 2003 on a weekly basis. Shares outstanding of margintransactions are made public by the TSE. The shares are adjusted for stock splits and scaled by trading units. There are 431observations.
45T. Hirose et al. / Pacific-Basin Finance Journal 17 (2009) 41–57
weekend t−1 to weekend t, are described as K=0. The returns in the next n weeks measured as holdingperiods are described as K=n, and in the pre-formation periods, from weekend t−n to weekend t−1, aredescribed as K=−n. Average weekly rates of return in these periods are calculated and used in the analysis.The same return definitions are used in the firm-level analysis.
In the firm-level analysis, we examine the behavior of individual stock returns when margin traderschange their aggregate position. We rank individual stocks and create five portfolios on the basis of thechange in their buying position from the previous week. Five portfolios are also created on the basis of the
Table 1Summary statistics for aggregate margin transactions
Level Change
MBO MSO Net Trading volume MBO MSO Net Trading volume
Mean 3,121,125 1,318,303 1,802,822 1,318,303 5151 5,515 −364 3461Median 2,988,254 1,171,622 1,541,737 1,171,622 2807 1,040 −5,561 8365Max 5,554,973 3,248,912 4,492,425 3,423,105 262,299 445,466 390,196 1,223,126Min 1,738,647 473,832 −243,315 291,574 −298,561 −416,613 −550,634 −915,943Standard deviation 905,610 601,211 932,311 601,211 82,063 87,504 116,685 252,935Skewness 0.632 0.707 0.911 0.707 −0.143 0.245 −0.245 0.147Kurtosis 2.558 2.600 3.395 2.600 4.416 7.522 5.216 5.237Ac(1) 0.994 0.984 0.992 0.810 0.427 −0.015 0.200 −0.249Ac(2) 0.984 0.969 0.980 0.710 0.227 −0.031 0.104 −0.176Ac(3) 0.973 0.955 0.967 0.678 0.191 −0.016 0.055 −0.096
This table shows summary statistics of the aggregate shares outstanding of margin transactions. MBO and MSO refer to sharesoutstanding of margin buying and margin selling, respectively. The “Net” column shows statistics for margin buying less marginselling. Shares outstanding of margin transactions and trading volume are in trading units. Trading volume is defined as average dailytrading volume for the week. The sample period is from December 17, 1994 to May 17, 2003. Ac(x) in the leftmost column is the xthorder's serial correlation.
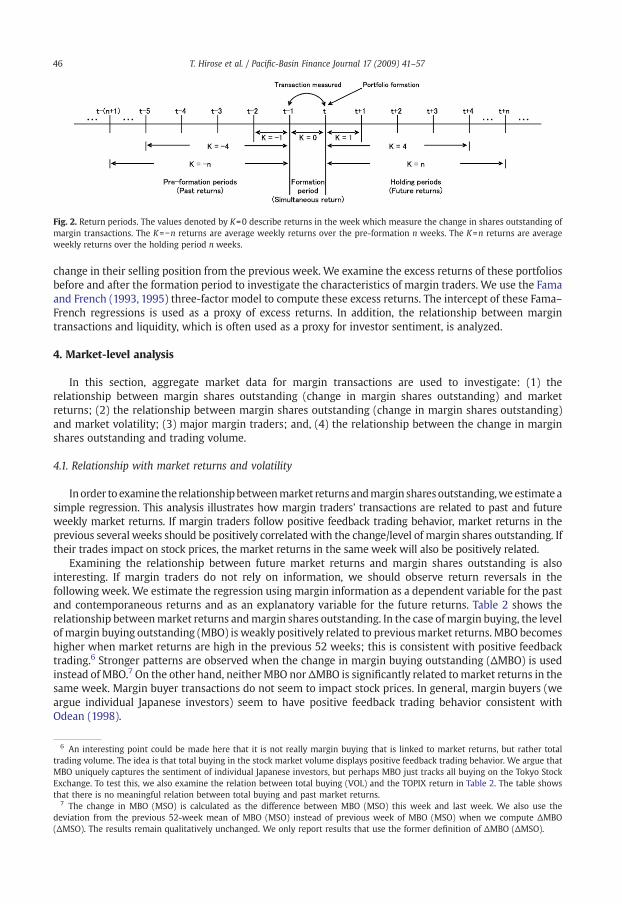
Fig. 2. Return periods. The values denoted by K=0 describe returns in the week which measure the change in shares outstanding ofmargin transactions. The K=−n returns are average weekly returns over the pre-formation n weeks. The K=n returns are averageweekly returns over the holding period n weeks.
46 T. Hirose et al. / Pacific-Basin Finance Journal 17 (2009) 41–57
change in their selling position from the previous week. We examine the excess returns of these portfoliosbefore and after the formation period to investigate the characteristics of margin traders. We use the Famaand French (1993, 1995) three-factor model to compute these excess returns. The intercept of these Fama–French regressions is used as a proxy of excess returns. In addition, the relationship between margintransactions and liquidity, which is often used as a proxy for investor sentiment, is analyzed.
4. Market-level analysis
In this section, aggregate market data for margin transactions are used to investigate: (1) therelationship between margin shares outstanding (change in margin shares outstanding) and marketreturns; (2) the relationship between margin shares outstanding (change in margin shares outstanding)and market volatility; (3) major margin traders; and, (4) the relationship between the change in marginshares outstanding and trading volume.
4.1. Relationship with market returns and volatility
Inorder to examine the relationshipbetweenmarket returnsandmargin sharesoutstanding,weestimate asimple regression. This analysis illustrates how margin traders' transactions are related to past and futureweekly market returns. If margin traders follow positive feedback trading behavior, market returns in theprevious several weeks should be positively correlated with the change/level of margin shares outstanding. Iftheir trades impact on stock prices, the market returns in the same week will also be positively related.
Examining the relationship between future market returns and margin shares outstanding is alsointeresting. If margin traders do not rely on information, we should observe return reversals in thefollowing week. We estimate the regression using margin information as a dependent variable for the pastand contemporaneous returns and as an explanatory variable for the future returns. Table 2 shows therelationship betweenmarket returns andmargin shares outstanding. In the case of margin buying, the levelof margin buying outstanding (MBO) is weakly positively related to previousmarket returns. MBO becomeshigher when market returns are high in the previous 52 weeks; this is consistent with positive feedbacktrading.6 Stronger patterns are observed when the change in margin buying outstanding (ΔMBO) is usedinstead of MBO.7 On the other hand, neitherMBO norΔMBO is significantly related tomarket returns in thesame week. Margin buyer transactions do not seem to impact stock prices. In general, margin buyers (weargue individual Japanese investors) seem to have positive feedback trading behavior consistent withOdean (1998).
6 An interesting point could be made here that it is not really margin buying that is linked to market returns, but rather totaltrading volume. The idea is that total buying in the stock market volume displays positive feedback trading behavior. We argue thatMBO uniquely captures the sentiment of individual Japanese investors, but perhaps MBO just tracks all buying on the Tokyo StockExchange. To test this, we also examine the relation between total buying (VOL) and the TOPIX return in Table 2. The table showsthat there is no meaningful relation between total buying and past market returns.
7 The change in MBO (MSO) is calculated as the difference between MBO (MSO) this week and last week. We also use thedeviation from the previous 52-week mean of MBO (MSO) instead of previous week of MBO (MSO) when we compute ΔMBO(ΔMSO). The results remain qualitatively unchanged. We only report results that use the former definition of ΔMBO (ΔMSO).
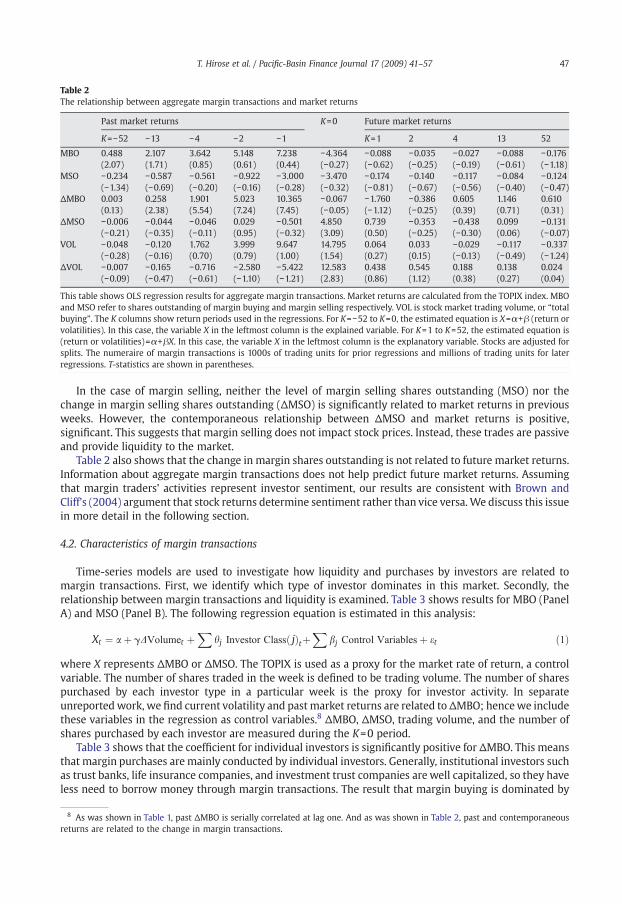
Table 2The relationship between aggregate margin transactions and market returns
Past market returns K=0 Future market returns
K=−52 −13 −4 −2 −1 K=1 2 4 13 52
MBO 0.488 2.107 3.642 5.148 7.238 −4.364 −0.088 −0.035 −0.027 −0.088 −0.176(2.07) (1.71) (0.85) (0.61) (0.44) (−0.27) (−0.62) (−0.25) (−0.19) (−0.61) (−1.18)
MSO −0.234 −0.587 −0.561 −0.922 −3.000 −3.470 −0.174 −0.140 −0.117 −0.084 −0.124(−1.34) (−0.69) (−0.20) (−0.16) (−0.28) (−0.32) (−0.81) (−0.67) (−0.56) (−0.40) (−0.47)
ΔMBO 0.003 0.258 1.901 5.023 10.365 −0.067 −1.760 −0.386 0.605 1.146 0.610(0.13) (2.38) (5.54) (7.24) (7.45) (−0.05) (−1.12) (−0.25) (0.39) (0.71) (0.31)
ΔMSO −0.006 −0.044 −0.046 0.029 −0.501 4.850 0.739 −0.353 −0.438 0.099 −0.131(−0.21) (−0.35) (−0.11) (0.95) (−0.32) (3.09) (0.50) (−0.25) (−0.30) (0.06) (−0.07)
VOL −0.048 −0.120 1.762 3.999 9.647 14.795 0.064 0.033 −0.029 −0.117 −0.337(−0.28) (−0.16) (0.70) (0.79) (1.00) (1.54) (0.27) (0.15) (−0.13) (−0.49) (−1.24)
ΔVOL −0.007 −0.165 −0.716 −2.580 −5.422 12.583 0.438 0.545 0.188 0.138 0.024(−0.09) (−0.47) (−0.61) (−1.10) (−1.21) (2.83) (0.86) (1.12) (0.38) (0.27) (0.04)
This table shows OLS regression results for aggregate margin transactions. Market returns are calculated from the TOPIX index. MBOand MSO refer to shares outstanding of margin buying and margin selling respectively. VOL is stock market trading volume, or “totalbuying”. The K columns show return periods used in the regressions. For K=−52 to K=0, the estimated equation is X=α+β (return orvolatilities). In this case, the variable X in the leftmost column is the explained variable. For K=1 to K=52, the estimated equation is(return or volatilities)=α+βX. In this case, the variable X in the leftmost column is the explanatory variable. Stocks are adjusted forsplits. The numeraire of margin transactions is 1000s of trading units for prior regressions and millions of trading units for laterregressions. T-statistics are shown in parentheses.
47T. Hirose et al. / Pacific-Basin Finance Journal 17 (2009) 41–57
In the case of margin selling, neither the level of margin selling shares outstanding (MSO) nor thechange in margin selling shares outstanding (ΔMSO) is significantly related to market returns in previousweeks. However, the contemporaneous relationship between ΔMSO and market returns is positive,significant. This suggests that margin selling does not impact stock prices. Instead, these trades are passiveand provide liquidity to the market.
Table 2 also shows that the change in margin shares outstanding is not related to future market returns.Information about aggregate margin transactions does not help predict future market returns. Assumingthat margin traders' activities represent investor sentiment, our results are consistent with Brown andCliff's (2004) argument that stock returns determine sentiment rather than vice versa. We discuss this issuein more detail in the following section.
4.2. Characteristics of margin transactions
Time-series models are used to investigate how liquidity and purchases by investors are related tomargin transactions. First, we identify which type of investor dominates in this market. Secondly, therelationship between margin transactions and liquidity is examined. Table 3 shows results for MBO (PanelA) and MSO (Panel B). The following regression equation is estimated in this analysis:
8 As wreturns
Xt ¼ aþ gDVolumet þX
hj Investor Class jð ÞtþX
bj Control Variablesþ et ð1Þ
X represents ΔMBO or ΔMSO. The TOPIX is used as a proxy for the market rate of return, a control
wherevariable. The number of shares traded in the week is defined to be trading volume. The number of sharespurchased by each investor type in a particular week is the proxy for investor activity. In separateunreported work, we find current volatility and past market returns are related toΔMBO; hencewe includethese variables in the regression as control variables.8 ΔMBO, ΔMSO, trading volume, and the number ofshares purchased by each investor are measured during the K=0 period.Table 3 shows that the coefficient for individual investors is significantly positive for ΔMBO. This meansthat margin purchases are mainly conducted by individual investors. Generally, institutional investors suchas trust banks, life insurance companies, and investment trust companies are well capitalized, so they haveless need to borrow money through margin transactions. The result that margin buying is dominated by
as shown in Table 1, past ΔMBO is serially correlated at lag one. And as was shown in Table 2, past and contemporaneousare related to the change in margin transactions.

Table 3Time-series regression analysis of changes in aggregate margin transactions
ΔVol Investor classification Adjusted R2
Indi. Foreign Fin. Broker
Panel A: ΔMBO0.004 0.25(1.39)
0.599 0.108 −0.043 −0.059 0.42(5.66) (1.64) (−0.62) (−0.89)
0.005 0.606 0.092 −0.041 −0.074 0.43(2.35) (5.77) (1.41) (−0.60) (−1.12)
Panel B: ΔMSO0.018 0.12(5.43)
−0.125 −0.004 −0.030 −0.066 0.01(−0.83) (−0.05) (−0.30) (−0.61)
0.019 −0.075 −0.049 −0.019 −0.112 0.12(5.60) (−0.53) (−0.58) (−0.20) (−1.10)
Xt ¼ aþ gD Volumet þX
hj Investor Class jð ÞtþX
bj Control Variablesþ et
X represents ΔMBO or ΔMSO. ΔXt is defined as Xt−Xt−1. This table shows time-series regression results for margin transactions.Market returns (Rt and Rt−1) and lagged X (Xt−1) are used as control variables. Margin buying (ΔMBO) or selling (ΔMSO) are defined asthe change in shares outstanding of margin buys or sales for the week. ΔVolumet is defined as Volumet−Volumet −1. Volume is sharevolume in trading units. Returns are rates of return in percent form. The market returns are from the TOPIX. Investor classificationmeans net purchase amounts (in millions of yen) for each investor class. Indi., Foreign, Fin. and Brok stand for individuals, foreigners,financial institutions, and stockbrokers, respectively. T-statistics are shown in parentheses. These regressions are adjusted forheteroskedasticity.
48 T. Hirose et al. / Pacific-Basin Finance Journal 17 (2009) 41–57
individual investors is consistent with conventional wisdom. Therefore, it is likely that margin buyinginformation reflects individual investor sentiment. On the other hand, margin selling is not significantlyrelated to any particular investor type.
Our results are consistent with Gervais and Odean's (2001) overconfidence hypothesis; they argued thatpast high market returns make investors overconfident. In their model, investors learn about their owninvestment abilities through their investment experience. In particular, investors tend to overestimate theirown abilities in the early stages of their trading careers. The fact that the main participants in Japanesestandardized margin buying are unsophisticated individual investors, whose access to information isinferior to that of institutional investors, together with the fact that margin transactions are relativelyspeculative investments, may have made positive feedback trading in margin buying appear moreconspicuous. However, the apparent link between overconfidence and positive feedback trading cannot beformally tested with the available data. Our data do not allow us to identify individual agents' trades, so wecannot determinewhether the individual investors who traded successfully at K=−1 are the same investorswho traded at K=1 with excessive confidence. Still, our results for margin buying do suggest that investorsentiment is affected by past market returns.
Both margin buying and selling significantly increase as market volume increases. The increase inmargin buying is consistent with Baker and Stein's (2004) argument that high liquidity is a symptom ofmarket domination by irrational, individual investors. Margin traders provide liquidity to the market andtheir activities are not negligible. Our results imply that the change in margin buying reflects individualinvestor sentiment.
5. Firm-level analysis
The previous section showed that: (1) Japanese margin buying is mainly by individual investors; (2) ithas a positive feedback bias; and, (3) margin transactions do not have a large impact on stock prices at themarket level. These results suggest that the change in margin buying reflects individual investorsentiment.
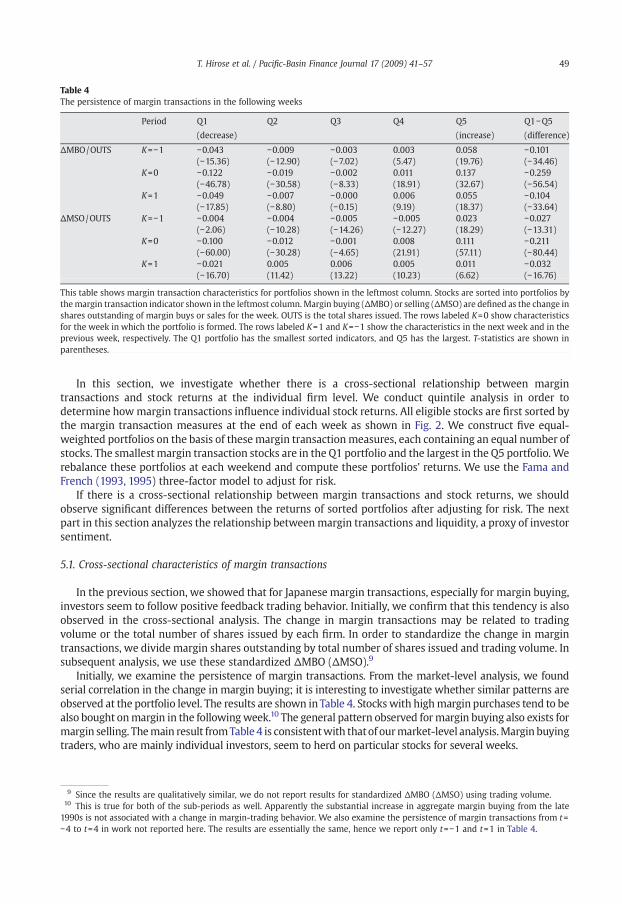
Table 4The persistence of margin transactions in the following weeks
Period Q1 Q2 Q3 Q4 Q5 Q1−Q5
(decrease) (increase) (difference)
ΔMBO/OUTS K=−1 −0.043 −0.009 −0.003 0.003 0.058 −0.101(−15.36) (−12.90) (−7.02) (5.47) (19.76) (−34.46)
K=0 −0.122 −0.019 −0.002 0.011 0.137 −0.259(−46.78) (−30.58) (−8.33) (18.91) (32.67) (−56.54)
K=1 −0.049 −0.007 −0.000 0.006 0.055 −0.104(−17.85) (−8.80) (−0.15) (9.19) (18.37) (−33.64)
ΔMSO/OUTS K=−1 −0.004 −0.004 −0.005 −0.005 0.023 −0.027(−2.06) (−10.28) (−14.26) (−12.27) (18.29) (−13.31)
K=0 −0.100 −0.012 −0.001 0.008 0.111 −0.211(−60.00) (−30.28) (−4.65) (21.91) (57.11) (−80.44)
K=1 −0.021 0.005 0.006 0.005 0.011 −0.032(−16.70) (11.42) (13.22) (10.23) (6.62) (−16.76)
This table shows margin transaction characteristics for portfolios shown in the leftmost column. Stocks are sorted into portfolios bythemargin transaction indicator shown in the leftmost column.Margin buying (ΔMBO) or selling (ΔMSO) are defined as the change inshares outstanding of margin buys or sales for the week. OUTS is the total shares issued. The rows labeled K=0 show characteristicsfor the week in which the portfolio is formed. The rows labeled K=1 and K=−1 show the characteristics in the next week and in theprevious week, respectively. The Q1 portfolio has the smallest sorted indicators, and Q5 has the largest. T-statistics are shown inparentheses.
49T. Hirose et al. / Pacific-Basin Finance Journal 17 (2009) 41–57
In this section, we investigate whether there is a cross-sectional relationship between margintransactions and stock returns at the individual firm level. We conduct quintile analysis in order todetermine howmargin transactions influence individual stock returns. All eligible stocks are first sorted bythe margin transaction measures at the end of each week as shown in Fig. 2. We construct five equal-weighted portfolios on the basis of these margin transactionmeasures, each containing an equal number ofstocks. The smallest margin transaction stocks are in the Q1 portfolio and the largest in the Q5 portfolio. Werebalance these portfolios at each weekend and compute these portfolios' returns. We use the Fama andFrench (1993, 1995) three-factor model to adjust for risk.
If there is a cross-sectional relationship between margin transactions and stock returns, we shouldobserve significant differences between the returns of sorted portfolios after adjusting for risk. The nextpart in this section analyzes the relationship betweenmargin transactions and liquidity, a proxy of investorsentiment.
5.1. Cross-sectional characteristics of margin transactions
In the previous section, we showed that for Japanese margin transactions, especially for margin buying,investors seem to follow positive feedback trading behavior. Initially, we confirm that this tendency is alsoobserved in the cross-sectional analysis. The change in margin transactions may be related to tradingvolume or the total number of shares issued by each firm. In order to standardize the change in margintransactions, we divide margin shares outstanding by total number of shares issued and trading volume. Insubsequent analysis, we use these standardized ΔMBO (ΔMSO).9
Initially, we examine the persistence of margin transactions. From the market-level analysis, we foundserial correlation in the change in margin buying; it is interesting to investigate whether similar patterns areobserved at the portfolio level. The results are shown in Table 4. Stocks with highmargin purchases tend to bealso bought onmargin in the followingweek.10 The general pattern observed formargin buying also exists formargin selling. Themain result fromTable 4 is consistentwith thatof ourmarket-level analysis.Margin buyingtraders, who are mainly individual investors, seem to herd on particular stocks for several weeks.
9 Since the results are qualitatively similar, we do not report results for standardized ΔMBO (ΔMSO) using trading volume.10 This is true for both of the sub-periods as well. Apparently the substantial increase in aggregate margin buying from the late1990s is not associated with a change in margin-trading behavior. We also examine the persistence of margin transactions from t=−4 to t=4 in work not reported here. The results are essentially the same, hence we report only t=−1 and t=1 in Table 4.

Table 5Fama–French three-factor model alphas for portfolios sorted by margin buying
Excess returns
Q1 Q2 Q3 Q4 Q5 Q1−Q5
(decrease) (increase) (difference)
K= −20 −0.03 −0.03 0.02 −0.00 0.04 −0.06(−1.74) (−2.32) (2.01) (−0.19) (2.63) (−5.92)
−4 0.12 0.06 0.02 −0.12 −0.00 0.13(3.54) (2.28) (1.09) (−5.13) (−0.14) (4.91)
−1 0.37 0.27 −0.00 −0.31 −0.18 0.55(5.02) (5.11) (−0.02) (−6.33) (−2.57) (10.19)
0 0.92 0.53 0.01 −0.76 −0.59 1.50(12.14) (9.84) (0.10) (−14.76) (−6.47) (18.54)
1 −0.16 −0.19 −0.09 0.08 0.32 −0.48(−2.25) (−3.54) (−1.85) (1.60) (4.63) (−8.55)
4 −0.07 −0.08 −0.05 0.02 0.09 −0.16(−2.07) (−3.08) (−2.16) (0.61) (3.11) (−7.16)
20 −0.03 −0.01 −0.01 0.00 0.00 −0.03(−1.95) (−0.90) (−1.10) (0.33) (0.17) (−3.57)
At the end of each week, 5 groups of stocks are formed. The stocks are sorted by margin buying indicators in ascending order. Theseportfolios are equal-weighted. Q1 is the portfolio that has the smallest margin buying values (ΔMBO/OUTS), Q5 has largest values.ΔMBO is the change in margin buying shares outstanding. OUTS is total shares issued. This variable is defined as net margin buying(New contracts−Settled contracts). The numbers in the K=0 rows are Fama–French three-factor model alphas when margintransactions are measured. Those in the K=n /−n rows show average alphas over n post-/pre-formation weeks. T-statistics are shownin parentheses. The null hypothesis is that the alpha=0.
50 T. Hirose et al. / Pacific-Basin Finance Journal 17 (2009) 41–57
In the market-level analysis, we observed positive feedback trading behavior for margin buying. Weinvestigate if similar patterns are present for individual stocks. We examine how the cross-sectionaldifference in margin transactions affects the cross-sectional difference in returns. If there are significantimpacts on stock prices caused by these transactions, information on margin trades will help makesubsequent stock returns predictable.
Table 5 shows excess returns using the three-factor model for margin buying sorted portfolios. Theleftmost column shows the period of the excess return; each value in the body of the table shows theweekly average excess return during each measurement period. Since the Q5 portfolio returns before andduring the formation period are significantly negative, margin buyers seem to follow negative feedbacktrading behavior. The rightmost column (Q1–Q5) shows the difference in quintile portfolio excess returns.The returns for the rows labeled K=−4, and −1 show that portfolio Q1 realizes higher returns than Q5 a fewweeks before the formation period. Investors who reduce their buying position may have realized a higherreturn in the past. On the other hand, portfolio Q5 has high excess return in the following week. The excessreturns decrease as the change in MBO gets smaller in the following few weeks (K=1, K=4). These resultsimply that information about margin trading may help predict future stock returns. High levels of marginbuying tend to precede positive excess returns.11 This result is consistent with the model developed byChordia and Subrahmanyam (2004) that describes the relationship between microstructure and returns.They argue that positively autocorrelated order imbalances12 (plausibly related to our MBO variable)predict future returns because of the way risk-averse market-makers resolve inventory and adverseselection issues. Their empirical analysis of NYSE order imbalances support their model. Our result is alsosimilar to Barber et al. (2006) and Hvidkjaer (2006) who study the trading behavior of individual Americaninvestors. They find that stock heavily purchased by individuals (assuming that small trades are by
11 In sub-period analysis not reported here, the association between margin buying and future excess returns is somewhat strongerin the 1999 to 2003 period.12 Order imbalance is a measure of buying/selling pressure. Chordia and Subrahamyan calculate order imbalance using analgorithm developed by Lee and Ready (1991) that classifies a trade as buyer (seller) originated if the price is closer to the ask (bid)price of the prevailing quote. We do not have bid/ask data, so we are unable to make an exact comparison of Japanese margin buyingto Chordia and Subrahamyan's order imbalance result for the NYSE.

Table 6Fama–French three-factor model alphas for portfolios sorted by margin selling
Excess returns
Q1 Q2 Q3 Q4 Q5 Q1−Q5
(decrease) (increase) (difference)
K= −20 0.16 −0.02 −0.08 −0.08 0.03 0.13(11.50) (−1.18) (−6.29) (−6.39) (2.11) (14.63)
−4 0.29 −0.03 −0.19 −0.15 0.16 0.12(9.15) (−1.30) (−7.47) (−6.21) (5.15) (5.34)
−1 0.21 −0.12 −0.29 −0.13 0.45 −0.25(3.33) (−2.41) (−5.79) (−2.59) (6.55) (−5.21)
0 −1.34 −0.85 −0.33 0.42 2.07 −3.42(−21.90) (−15.81) (−6.61) (8.05) (24.45) (−45.08)
1 −0.12 0.07 0.09 −0.07 0.02 −0.14(−2.05) (1.25) (1.71) (−1.35) (0.35) (−3.33)
4 −0.11 0.03 0.04 −0.01 −0.03 −0.08(−3.94) (1.25) (1.39) (−0.29) (−1.26) (−4.39)
20 −0.07 0.01 0.03 0.02 −0.04 −0.03(−4.96) (0.79) (2.23) (1.32) (−3.11) (−3.80)
At the end of each week, 5 groups of stocks are formed. The stocks are sorted by margin selling indicators in ascending order. Theseportfolios are equal-weighted. Q1 is the portfolio that has the smallest margin selling values (ΔMSO/OUTS), Q5 has the largest values.ΔMSO is the change in margin selling shares outstanding. OUTS is total shares issued. This variable is defined as net margin selling(New contracts−Settled contracts). The numbers in the K=0 rows are Fama–French three-factor model alphas when margintransactions are measured. Those in the K=n /−n rows show the average alphas over n post-/pre-formation weeks. T-statistics areshown in parentheses. The null hypothesis is that the alpha=0.
51T. Hirose et al. / Pacific-Basin Finance Journal 17 (2009) 41–57
individuals) in one week earn high returns in the subsequent week. Stocks heavily sold in one week earnpoor returns in the following week.
Here our focus moves to the change in margin selling outstanding. This analysis is shown in Table 6. Thetable shows that the Q1 and Q5 portfolios have significantly positive excess returns in the weeks beforeportfolio formation. At K=0, the excess returns have opposite signs. The Q1 excess return is significantlynegative and the Q5 excess return is significantly positive. The patterns of Q1 and Q5 portfolios indicatethat margin sellers sell (buy back) shares when stock prices rise (fall). Margin sellers' transactions seem topush stock prices back to their fundamental values quickly since we observe insignificant excess returnsafter the K=0 formation period. These results are consistent with the view that margin sellers areinformation-based traders. This is consistent with the findings in the previous section.
Using cross-sectional return data, we do not find positive feedback trading behavior for margin buyingtraders, though their position changes imply herding on particular stocks. Margin buying traders seem tofollow negative feedback trading behavior instead. Margin buying traders increase or decrease theirpositions in a timely fashion. When their position increases (decreases), the following period's stockreturns become significantly positive (negative). We argue that margin buying trades, which we view asherding by individual Japanese investors, perhaps in conjunction with the trades of risk-averse market-makers and constrained arbitragers, impact on stock prices in the following period. When investorsentiment is optimistic, the following period's excess returns are significantly positive. Our results showthat information about margin buying shares outstanding helps predict future stock returns in Japan.
In order to understand the relationship between investor behavior and stock returns around theformationweek, we plot in Fig. 3 excess returns,ΔMBO, andΔMSO for both the Q1 and Q5 portfolios duringthe period from 10 weeks before to 10 weeks after the formation week.13 Margin traders' activities areconcentrated in the few weeks before and after the formation week. Japanese margin traders' sentimentsseem to be short-term. The behavioral finance literature generally assumes investor sentiments are longerlasting, on the order of months and years. However, we argue that Japanese margin traders will tend tohave much shorter-lived sentiments. There are good reasons to believe this is true. By regulation,
13 We examined periods up to 20 weeks before and after the formation period, but no significant patterns are observed beyond10 weeks.

Fig. 3. A. Excess returns and margin transaction characteristics for the ΔMBO/OUTS Q1 portfolio (smallest margin transaction stocks).B. Excess returns and margin transaction characteristics for the ΔMBO/OUTS Q5 portfolio (largest margin transaction stocks).
52 T. Hirose et al. / Pacific-Basin Finance Journal 17 (2009) 41–57
standardized margin positions must be closed out within 6 months. While it is possible to circumvent thisregulation, doing so can be inconvenient and costly.14
Fig. 3 shows that the margin trading patterns of the Q1 and Q5 portfolios are symmetric. Margin buyingtraders gradually increase (decrease) their positions in the ten weeks before and after the K=0 formationweek though stock prices do not change very much until the K=−1 previous week. Margin traderssignificantly increase (decrease) their positions as stock prices fall (rise) over the three weeks before theK=0 formation week. Trades by margin buyers seem to impact stock prices in the following week. Marginsellers seem to change their positions at the same time asmargin buyers. It is at least possible that the smallexcess returns after the formation week are partially due to margin sellers' trades.
Though we find evidence of significant excess returns for the Q5 portfolio in the following week, thisdoes not necessarily prove the existence of economically meaningful profits. Because information about
14 One further reason for short-term sentiment is that the managements of Japanese firms are obligated to make publicannouncements when they anticipate that earnings in the current accounting period will be substantially different from what wereoriginally forecast. Accounting periods were general six months in the period for our data, though Japanese firms now generallyreport quarterly results. These earnings revision announcements, or lack of announcements, provide important short-terminformation that traders might rationally use in their decision to roll over or close out their margin positions.

53T. Hirose et al. / Pacific-Basin Finance Journal 17 (2009) 41–57
margin trading is released on Tuesday in the following week, it may not be possible to construct a Q5portfolio to capture the following week's excess returns. In the following two sections, we examine howthese margin buying results are related to firm size and liquidity.
5.2. Firm size
Firm size may be an important factor in the analysis of investor sentiment since small-firm stocks areless liquid and more volatile. Small firm, less liquid stocks also potentially cause significant inventory,adverse selection and portfolio problems for market-makers and arbitragers. We expect to observestronger, clearer results for the stocks of small firms. In order to examine this issue, we construct double-sorted portfolios. Stocks are first sorted into three portfolios on the basis of firm size; these portfolios arethen each sorted into five sub-portfolios using the change in margin buying outstanding indicator. Theresults are presented in Table 7. Both large- and small-firm excess returns are significantly positive in theK=1 period (Panel C) for the Q5 portfolio. Surprisingly, our findings in the previous section are mainlyobserved for large firm stocks. Individual investors buy more (a significant 0.065) on margin at period K=0of large firm stocks that were down (a significant −0.65) at period K=−1. However, individual investors buymore (a significant 0.204) on margin at period K=0 of small firms that were up (a significant 0.29) at periodK=−1. Margin traders seem to follow negative feedback trading behavior for large firm stocks and positivefeedback trading for small-firm stocks. The excess returns of the Q1 portfolio for both large and small firmsduring the three-week period are consistent with this conjecture. The change in margin buying for the Q5portfolio is positive, significant for all three periods regardless of firm size. We find evidence of pricecontinuation for small-firm stocks. Small-firm stocks that were bought heavily at K=0 (a significant 0.204)had significant positive returns (0.46) at K=1. Market-maker inventory concerns as suggested by Chordiaand Subrahmanyam (2004) and the difficulty in arbitraging small-firm stock mispricings seem plausibleexplanations for this result.
Table 7Fama–French three-factor model alphas for firm-size sorted portfolios
Q1 Q5 Q1−Q5
Return ΔMBO/OUTS Return ΔMBO/OUTS Return ΔMBO/OUTS
Panel A: K=−1Small −0.05 −0.065 0.29 0.087 −0.34 −0.152
(−0.58) (−12.61) (2.86) (16.23) (−4.31) (−26.73)Large 0.87 −0.016 −0.65 0.023 1.53 −0.040
(15.16) (−15.83) (−11.84) (17.01) (23.01) (−29.53)Small−Large −0.92 −0.048 0.94 0.064
(−11.32) (−9.75) (9.71) (11.91)
Panel B: K=0Small −0.02 −0.179 0.42 0.204 −0.44 −0.384
(−0.19) (−37.38) (3.32) (27.60) (−3.78) (−47.41)Large 2.36 −0.061 −1.92 0.065 4.28 −0.126
(32.48) (−35.84) (−27.20) (29.86) (39.80) (−39.11)Small−Large −2.38 −0.119 2.34 0.139
(−24.44) (−23.20) (19.84) (18.87)
Panel C: K=1Small −0.10 −0.075 0.46 0.086 −0.56 −0.161
(−1.08) (−15.01) (5.01) (15.99) (−6.98) (−27.43)Large −0.25 −0.019 0.21 0.021 −0.46 −0.039
(−4.92) (−17.72) (3.84) (14.86) (−7.68) (−28.57)Small−Large 0.15 −0.056 0.25 0.066
(1.79) (−11.44) (2.89) (12.23)
Stocks are classified into three groups by market capitalization. For each size, sorted portfolios are formed on ΔMBO/OUTS. ΔMBO isthe change in margin buying shares outstanding. OUTS is total shares issued. The left-hand values in each cell are portfolio returns.The right-hand values are the average of ΔMBO/OUTS. Five equal-weighted portfolios are formed at K=0. Panels A, B and C showmean returns and ΔMBO/OUTS at K=−1, 0 and 1, respectively. The rightmost column shows the Q1 portfolio minus the Q5 portfoliocharacteristic. Fama–French three-factor model alphas are reported. T-statistics are in parentheses.

54 T. Hirose et al. / Pacific-Basin Finance Journal 17 (2009) 41–57
It is highly unlikely that individual investors use the three-factor model to examine past stockperformance when they trade stocks. We therefore conduct the same analysis again using raw returns. Theresults remain essentially unchanged. These results indicate that the predictive power of margin buying issignificant regardless of the firm size. Our results are not consistent with the view that margin buyingtraders are noise traders. Instead, they seem to time the market very well when they trade, or perhapsmicrostructure issues limit the ability of the market to quickly correct mispricings.
In order to fully understand the relationship between investor behavior and stock returns around theformationweek,we plot in Fig. 4 excess returns,ΔMBO, andΔMSO for the smallest and largestfirmgroups ofthe Q1 andQ5 portfolios over the period from tenweeks before to tenweeks after the formationweek.15 Thepatterns for small-firm stocks are interesting. Contrary to our previous findings, we observe significantpositive excess returns a few weeks before and after the formation period for the Q5 portfolio. This isconsistentwith ourfinding in themarket-level analysis thatmargin buyers followpositive feedback trading.Since margin buyers' sentiments are optimistic for some reason, their trades perhaps in conjunction withrisk-averse market-makers push up these stock prices after the formation period for a fewweeks. However,we do not observe an opposite pattern for the Q1 portfolio. Since we observe positive excess returns for theQ5 portfolio a few weeks after the formation week, a trading strategy on the basis of margin tradinginformation may be profitable. The results are consistent with De Long et al. (1990).
In the case of large firm stocks, margin traders seem to follow negative feedback trading behavior. Weobserve positive excess returns for the Q5 portfolio and negative excess returns for the Q1 portfolio in thefollowing week. The patterns of excess returns and the change in MBO are symmetric between the Q1 andQ5 portfolios surrounding the formation period. The significantly positive (negative) excess returns overthe following week indicate that margin traders' transactions impact large firm stock prices though theeffect is not as striking as that for small-firm stocks. In addition, significant excess returns are not observedafter the second week. The market quickly absorbs the excess demand/supply of margin traders for largefirm stocks that aremainly traded by institutional investors. Since information about margin transactions isreleased on Tuesday in the following week, it is very unlikely that a margin information-based tradingstrategy can earn economic profits.
5.3. Liquidity
The results so far suggest that the predictive power of margin buying information is different from firm-size anomalies. Our market-level analysis shows that margin transactions are significantly positivelyrelated to liquidity. A growing body of empirical literature suggests that liquidity predicts stock returns.Brennan and Subrahmanyam (1996) and Brennan et al. (1998) find that measures of increased liquidity areassociated with lower future returns. Both Odean (1998) and Baker and Stein (2004) argue thatoverconfident investors generate high liquidity, which may result from optimistic investor sentiment. Ifinvestor sentiment dominates the market, stocks with high trading volume may experience subsequentpoor performance. Since Japanese margin buying is mainly the activity of individual investors, the marginbuying effect documented in this paper should be a good proxy for short-term investor sentiment. Ourquestion here is how the margin buying effect is related to liquidity.
To examine this issue, we again apply a double-sorted portfolio approach similar to that employed in theprevious section. The analysis asks whether the margin buying effect disappears after controlling forliquidity or if the difference in returns caused by liquidity disappears after controlling for themargin buyingeffect.16 25 portfolios are created by sorting all stocks on the basis of theweekly turnover ratio (ΔTOR) beforebeing sorted into quintile portfolios on the basis of changes in margin transactions outstanding.17 The firstround of sorting adjusts for the effects of liquidity and the second round of sorting for the effect of marginbuying.18 The results are presented in Table 8, which shows portfolio excess returns in the following week(K=1) for 25 portfolios.
15 We also expand our estimation period up to 20 weeks before and after the formation period; however, no significant patterns areobserved beyond 10 weeks.16 We also conduct the same analysis for margin selling. We do not find any meaningful patterns for margin selling.17 TOR is defined as average shares traded each day/number of shares outstanding. We proxy liquidity with volume in the form of TOR.18 TWe also examine the difference in portfolio returns (K=1) between the first and fifth portfolios sorted on the change in margintransactions outstanding after being sorted by the change in the weekly turnover. The results remain qualitatively unchanged.

Fig. 4. A. Excess returns and margin transaction characteristics for the ΔMBO/OUTS, small firms Q1 portfolio (smallest margin transaction stocks). B. Excess returns and margin transactioncharacteristics for the ΔMBO/OUTS, small firms Q5 portfolio (largest margin transaction stocks). C. Excess returns andmargin transaction characteristics for the ΔMBO/OUTS, large firms Q1 portfolio(smallest margin transaction stocks). D. Excess returns and margin transaction characteristics for the ΔMBO/OUTS, large firms Q5 portfolio (largest margin transaction stocks). 55
T.Hirose
etal./
Pacific-BasinFinance
Journal17
(2009)41
–57
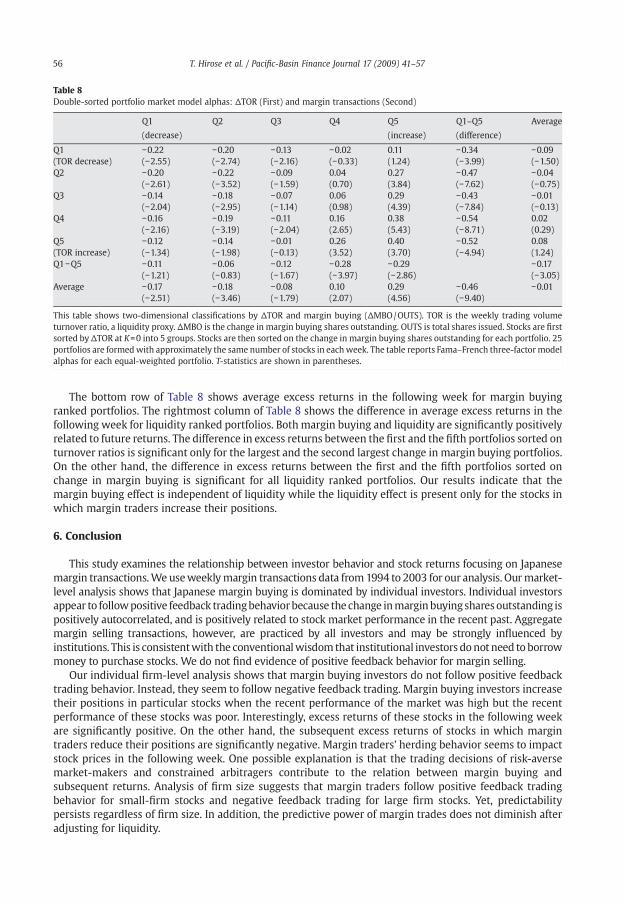
Table 8Double-sorted portfolio market model alphas: ΔTOR (First) and margin transactions (Second)
Q1 Q2 Q3 Q4 Q5 Q1–Q5 Average
(decrease) (increase) (difference)
Q1 −0.22 −0.20 −0.13 −0.02 0.11 −0.34 −0.09(TOR decrease) (−2.55) (−2.74) (−2.16) (−0.33) (1.24) (−3.99) (−1.50)Q2 −0.20 −0.22 −0.09 0.04 0.27 −0.47 −0.04
(−2.61) (−3.52) (−1.59) (0.70) (3.84) (−7.62) (−0.75)Q3 −0.14 −0.18 −0.07 0.06 0.29 −0.43 −0.01
(−2.04) (−2.95) (−1.14) (0.98) (4.39) (−7.84) (−0.13)Q4 −0.16 −0.19 −0.11 0.16 0.38 −0.54 0.02
(−2.16) (−3.19) (−2.04) (2.65) (5.43) (−8.71) (0.29)Q5 −0.12 −0.14 −0.01 0.26 0.40 −0.52 0.08(TOR increase) (−1.34) (−1.98) (−0.13) (3.52) (3.70) (−4.94) (1.24)Q1−Q5 −0.11 −0.06 −0.12 −0.28 −0.29 −0.17
(−1.21) (−0.83) (−1.67) (−3.97) (−2.86) (−3.05)Average −0.17 −0.18 −0.08 0.10 0.29 −0.46 −0.01
(−2.51) (−3.46) (−1.79) (2.07) (4.56) (−9.40)
This table shows two-dimensional classifications by ΔTOR and margin buying (ΔMBO/OUTS). TOR is the weekly trading volumeturnover ratio, a liquidity proxy. ΔMBO is the change in margin buying shares outstanding. OUTS is total shares issued. Stocks are firstsorted by ΔTOR at K=0 into 5 groups. Stocks are then sorted on the change in margin buying shares outstanding for each portfolio. 25portfolios are formedwith approximately the same number of stocks in eachweek. The table reports Fama–French three-factor modelalphas for each equal-weighted portfolio. T-statistics are shown in parentheses.
56 T. Hirose et al. / Pacific-Basin Finance Journal 17 (2009) 41–57
The bottom row of Table 8 shows average excess returns in the following week for margin buyingranked portfolios. The rightmost column of Table 8 shows the difference in average excess returns in thefollowing week for liquidity ranked portfolios. Both margin buying and liquidity are significantly positivelyrelated to future returns. The difference in excess returns between the first and the fifth portfolios sorted onturnover ratios is significant only for the largest and the second largest change in margin buying portfolios.On the other hand, the difference in excess returns between the first and the fifth portfolios sorted onchange in margin buying is significant for all liquidity ranked portfolios. Our results indicate that themargin buying effect is independent of liquidity while the liquidity effect is present only for the stocks inwhich margin traders increase their positions.
6. Conclusion
This study examines the relationship between investor behavior and stock returns focusing on Japanesemargin transactions.We useweeklymargin transactions data from 1994 to 2003 for our analysis. Ourmarket-level analysis shows that Japanese margin buying is dominated by individual investors. Individual investorsappear to followpositive feedback tradingbehaviorbecause the change inmarginbuyingsharesoutstanding ispositively autocorrelated, and is positively related to stock market performance in the recent past. Aggregatemargin selling transactions, however, are practiced by all investors and may be strongly influenced byinstitutions. This is consistentwith the conventionalwisdom that institutional investors donot need to borrowmoney to purchase stocks. We do not find evidence of positive feedback behavior for margin selling.
Our individual firm-level analysis shows that margin buying investors do not follow positive feedbacktrading behavior. Instead, they seem to follow negative feedback trading. Margin buying investors increasetheir positions in particular stocks when the recent performance of the market was high but the recentperformance of these stocks was poor. Interestingly, excess returns of these stocks in the following weekare significantly positive. On the other hand, the subsequent excess returns of stocks in which margintraders reduce their positions are significantly negative. Margin traders' herding behavior seems to impactstock prices in the following week. One possible explanation is that the trading decisions of risk-aversemarket-makers and constrained arbitragers contribute to the relation between margin buying andsubsequent returns. Analysis of firm size suggests that margin traders follow positive feedback tradingbehavior for small-firm stocks and negative feedback trading for large firm stocks. Yet, predictabilitypersists regardless of firm size. In addition, the predictive power of margin trades does not diminish afteradjusting for liquidity.

57T. Hirose et al. / Pacific-Basin Finance Journal 17 (2009) 41–57
It is extremely puzzling that individual Japanese margin traders follow positive feedback tradingbehavior for small-firm stocks while also following negative feedback trading behavior for large firm stocks.How individual Japanese margin traders can so effectively time the market and the related microstructureissues for market-makers is an intriguing topic for future research.
References
Baker, Malcolm, Stein, Jeremy C., 2004. Market liquidity as a sentiment indicator. Journal of Financial Markets 7, 271–299.Baker, Malcolm, Wurgler, Jeffrey, 2006. Investor sentiment and the cross-section of stock returns. Journal of Finance 61, 1645–1680.Barber, Brad, Odean, Terrance and Zhu, Ning (2006) “Do noise traders move markets? Working Paper: University of California, Davis,
Graduate School of Management.Brennan, Michael, Subrahmanyam, Avanidhar, 1996. Market microstructure and asset pricing: on the compensation for illiquidity in
stock returns. Journal of Financial Economics 41, 441–464.Brennan, Michael, Chordia, Tarun, Subrahmanyam, Avanidhar, 1998. Alternative factor specifications, security characteristics, and the
cross-section of expected stock returns. Journal of Financial Economics 49, 345–373.Brown, Gregory W., 1999. “Volatility, sentiment and noise traders”. Financial Analysts Journal 55, 82–90.Brown, GregoryW., Cliff, Michael T., 2004. “Investor sentiment and the near-term stockmarket”. Journal of Empirical Finance 11,1–27.Chordia, Tarun, Subrahmanyam, Avanidhar, 2004. Order imbalance and individual stock returns: theory and evidence. Journal of
Financial Economics 72, 485–518.De Long, Bradford J., Shliefer, Andrei, Summers, Lawrence H., Waldmann, Robert, 1990. Noise trader risk in financial markets. Journal
of Political Economy 98, 703–738.Fama, Engene F., French, Kenneth R., 1993. “Common risk factors in the returns on stocks and bonds”. Journal of Financial Economics
33, 3–56.Fama, Eugene F., French, Kenneth R., 1995. “Size and book-to-market factors in earnings and returns”. Journal of Finance 50, 131–155.Fisher, Kenneth L., Statman, Meir, 2000. Investor sentiment and stock returns. Financial Analysts Journal 56, 16–23 March/April.Gervais, Simon, Odean, Terrance, 2001. Learning to be overconfident. The Review of Financial Studies 14, 1–27.Hvidkjaer, Soeren (2006) “Small trades and the cross-section of stock returns” Working Paper: University of Maryland.Lee, Charles M.C., Ready, Mark J., 1991. “Inferring trade direction from intraday data”. Journal of Finance 46, 733–746.Lee, CharlesM.C., Shleifer, Andrei, Thaler, Richard H., 1991. “Investor sentiment and the closed-end fund puzzle”. Journal of Finance 46,
75–109.Odean, Terrance, 1998. Volume, volatility, price and profit when all traders are above average. Journal of Finance 53, 1887–1934.Shleifer, Andrei, 2000. Inefficient Markets: An Introduction to Behavioral Finance. Oxford University Press, London.Statman, Meir, Thorley, Steve and Vorkink, Keith (2004) “Investor overconfidence and trading volume” The Review of Financial
Studies, (forthcoming).Wang, Yaw-Huei, Keswani, Aneel, Taylor, Stephen J., 2006. “The relationships between sentiment, returns and volatility”. International
Journal of Forecasting 22, 109–123.