pace student engagement report - salisbury.edu
TRANSCRIPT

Civic and Political Engagement of Salisbury University Students
Harry Basehart, Ph.D., Professor Emeritus of Political Science George Whitehead, Ph.D., Professor of Psychology Institute for Public Affairs and Civic Engagement (PACE) Salisbury University Salisbury, MD 21801 March 2011

2
INTRODUCTION ..............................................................................................................3
PART I: CIVIC ENGAGEMENT: VOLUNTEERING AND COMMUNITY
SERVICE ............................................................................................................................5
Volunteering and Community Service: Not a Course Requirement ............................................... 5
Volunteering and Community Service: As a Course Requirement ................................................. 8
Community Service: Time and Opportunities ................................................................................. 11
PART II: POLITICAL ENGAGEMENT .....................................................................12
Overview .............................................................................................................................................. 12
A Closer Look at Social Networking Sites........................................................................................ 13
Sources of News................................................................................................................................... 16
Voting ................................................................................................................................................... 17
PART III: ADDITIONAL ANALYSIS AND FOCUS GROUP RESULTS ..............22
The Effects of Academic School and Class Year on Volunteering/Community Service and
Political Engagement .......................................................................................................................... 22
Summary of Focus Group Discussions ............................................................................................. 24
CONCLUSIONS AND RECOMMENDATIONS.........................................................27
Appendix A - Survey Methodology and Demographics of Sample .............................32
Appendix B - Focus Group Procedures .........................................................................37
Appendix C – Survey Topline Results ...........................................................................38

3
INTRODUCTION
For at least the past ten years, the civic and political engagement of college students has been a concern at many American colleges and universities. The President’s Declaration on the Civic Responsibility of Higher Education1 signed by a number of college presidents in 1999, called upon institutions of higher education to encourage students to “embrace the duties of active citizenship and civic participation.” Salisbury University’s mission statement reflects this declaration by stating that one of the University’s purposes is to empower students with the “skills and core values that contribute to active citizenship…” To fulfill this commitment, the university has created a number of organizations and programs, including the Institute for Service Learning, the Institute for Public Affairs and Civic Engagement (PACE), and the Volunteer Center recently opened in the Office of Career Services.
Salisbury University has received well deserved recognition from local media such as The Daily Times and area television stations, and campus publications such as The Flyer; all highlight many of the volunteer activities in which our students are engaged. For example, SGA sponsors the “Big Event” created, in part, to show that students care about the City of Salisbury and its residents. Students also routinely raise a large amount of money for “Relay For Life,” which benefits the American Cancer Society. The Town-Gown Council meets on a regular basis to ensure communication between the University and the city. PACE has a record of accomplishment in stimulating the political interest of SU students with its Presidential Citizen Scholars program, the John Hargreaves Distinguished Legislative Fellow program, voter registration drives, candidate debates, the Paul Sarbanes Lecture Series and other top speakers on public policy issues. Nevertheless, there has been no recent attempt to capture in a systematic and comprehensive way the extent of student volunteerism and community service or their engagement in political issues. Basic questions need to be answered such as: In what types of civic and political engagement are SU students involved? What is the frequency of their involvement? Are new strategies needed to encourage student involvement?
To find answers to these questions and others, we designed a project with two major components: a campus-wide survey and focus group discussions. In spring semester 2010, all undergraduate students were asked to participate in the survey through an email message that contained a link to the questionnaire. Survey methodology and a discussion of the demographic characteristics of the sample are detailed in Appendix A. Students who completed the survey also were asked if they would like to participate with other students in a 60-minute focus group discussion. Focus group procedures are explained in Appendix B. Topline results, a presentation of the frequencies for all survey questions, can be found in Appendix C.
Part I of this report centers on civic engagement; we assess the extent to which students engaged
in volunteerism/service activities, the specific activities performed, whether or not students had enough time for these activities and whether or not they are engaged in them as much as they would like to be. Further, these questions were in two separate categories so we could assess community service and volunteerism as part of a course requirement and not as part of a course requirement. One reason for wanting to know whether these activities were or were not curriculum based was to ascertain the extent to which volunteerism and community service reflects service-learning (curriculum based) or volunteerism (not curriculum based). “Service learning is a teaching and learning approach that integrates community service with academic studies to enrich learning, teach civic responsibility and
1Available at http://www.compact.org/resources-for-presidents/presidents-declaration-on-the-civic-responsibility-of-higher-education/.

4
strengthen communities.”2 Volunteerism is the contribution of time and assistance to an agency in the accomplishment of its mission without pay.
Part II presents data on political engagement, beginning with an overview of various political activities followed by an examination of Social Networking Sites as a means of engaging in politics. Where students go for news and their voting participation round-out the topics on political engagement.
Part III examines, in a series of crosstabs, the effects of academic school and class year on students’ civic and political engagement, followed by an analysis of focus group discussions. Recommendations are in a separate concluding section.
Presentation and interpretation of the data were the responsibility of Dr. Harry Basehart, Professor Emeritus and co-founder of PACE and Dr. George Whitehead, Professor of Psychology and project director of Shore Corps/PALS. Focus group discussion reports were written by the moderator, Dr. Darrell Mullins, Professor of Communication Arts, and summarized by Drs. Basehart and Whitehead. Survey and focus group questions and procedures were approved by SU’s Committee on Human Research.
The authors wish to thank PACE student research assistants for their invaluable contributions: Natalie Pappas for her work in questionnaire development and analysis of open-ended questions and Amy Hafez and Robert Sheehan for their work on data presentation. Also, Dr. Adam Hoffman, Director of PACE, offered important suggestions in the project’s early stages and Ginie Lynch, Managing Director, provided her usual excellent administrative direction.
This project, sponsored by PACE, was funded by the PACE/Service Learning Hargreaves Initiative. The views expressed in this report are those of the authors and not necessarily those of PACE or Salisbury University.
2Florence F. Pritchard and George I. Whitehead, III, Serve and Learn: Implementing and Evaluating Service-learning in Middle and High Schools (Mahwah, N.J.: Lawrence Erlbaum Associates, 2004).

5
PART I: CIVIC ENGAGEMENT: VOLUNTEERING AND COMMUNITY SERVICE Volunteering and Community Service: Not a Course Requirement
This section examines six questions relating to the volunteer and community service activities of
Salisbury University students. The first question asked students whether or not they participated in volunteer work or community service that was not part of a course requirement. Possible responses were: “No, I have not participated;” “Yes, I have participated, but not in the past 12 months;” and “Yes, I have participated, and within the past 12 months.” The vast majority of the respondents (90.2%) had volunteered, with 58% of those students having volunteered within the last 12 months. (See Figure 1.) Figure 1. Participation in Volunteering and Community Service (not a course requirement) (Q-19; N=775)
Students then indicated how often they participated in their chosen volunteer activity, with possible responses of: “Weekly;” “A few times a month;” “About once a month;” and “Less than once a month.” Eighty-two percent of respondents indicated that they volunteered a few times a month or less, with only 18% volunteering weekly. (See Figure 2.) These data indicate that SU students volunteer but not on a consistent basis. Figure 2. Frequency of Volunteering and Community Service (not a course requirement) (Q-20; N=773)

6
In order to understand what types of volunteer activities students engaged in, they were asked to check all that apply from the following list: “Tutor or teach;” “Mentor;” “Fund raise or sell items to raise money;” “Collect, prepare, distribute, or serve food;” “Engage in general labor or supply transportation for people;” and “Other activities, please specify.” The survey showed students’ volunteerism not as a part of a class assignment as primarily focused on general labor/transportation (31.8%) and fund raising (21.1%). Smaller percentages of students indicated that they engaged in activities related to food (14%) tutored/taught (12.3%), mentored (10.2%). Among those who selected “Other” (10.6%), the most frequently mentioned activities were working with animals (1.7%) and cleaning up the environment (1.7%) (See Figure 3.)
Figure 3. Types of Volunteer and Community Service Activities (not a course requirement) (Q-21A-F; N=1,842-total number of responses)
These findings may be best understood in comparison to results on the same topic from Civic Life in America, 2010.3 The results of the national survey indicate that the four most popular volunteer activities are: fund raising (26.6%), engaging in activities related to food (23.5%), engaging in general labor/provide transportation (20.5%), tutor or teach (19.0%). Clearly SU students, when compared to the national population, engage more in the category of general labor/provide transportation and less in the other categories.
Students also were asked whether they participated in the activity longer than was expected or
required of them. They responded with either “Yes” or “No.” Most students (63.5%) indicated that they volunteered longer than required. (See Figure 4.) Another question asked whether a group, club, or organization sponsored the volunteer activity. Again, students responded with either “Yes” or “No.” The vast majority of students (71%) indicated that a group, club or organization sponsored the activity. (See Figure 5.)
3 Corporation for National and Community Service and the National Conference on Citizenship. Civic Life in America: Key Findings on the Civic Health of the Nation, Washington, D.C., 2010, September, p. 4. Available at http://civic.serve.gov/issuebrief.cfm.

7
Figure 4. Volunteer Longer Than Expected (not a course requirement)? (Q-22; N=772)
Figure 5. Organization Sponsored Activity (not a course requirement) (Q-23; N=772)
The last item asked students to identify the group, club, or organization that had sponsored the volunteer activity. A complete list of sponsoring organizations is in the table below. The top five sponsors were: Church or Religious Organizations (15%);

8
Table 1. Sponsor Organization of Volunteer Activities (Q-24; N=544) Sponsor Frequency Percentage Church/Religious ......................................................82............................................15 Salisbury University Sponsored Events.....................70............................................12.8 Community Organizations .........................................57............................................10.4 Greek Organizations at Salisbury University ............51............................................9.3 Misc. Global/National/Community............................34............................................6.2 School Sponsored Events (K-12)...............................32............................................5.8 Cancer Organizations.................................................27............................................4.9 Boy/Girl Scouts..........................................................22............................................4.0 University Clubs/Associations (SU) ..........................21............................................3.8 Environmental Groups ...............................................20............................................3.6 Sports .........................................................................18............................................3.3 Girls on Top ...............................................................14............................................2.6 Leash on Life .............................................................13............................................2.4 Habitat for Humanity .................................................10............................................1.8 Do not remember .......................................................10............................................1.8 Items with a frequency of 2-9 ....................................41............................................7.5 Items with a frequency of 1 .......................................22............................................4.0 Salisbury University (e.g., the Big Event) (12.8%); Community Organizations (10.4%); Greek Organizations at Salisbury University (9.3%); and Misc. Global/National/Community Organizations (6.2%).
These findings may also be best understood in comparison to results on the same topic from
Civic Life in America, 2010. The results of the national survey indicate that the type of volunteer organization in terms of popularity is: religious (35.6%), educational or youth service (26.6%), social or community service (13.8%), hospital or other health-related service (8.3%), civic, political, professional or international (5.4%), sport, hobby, cultural or arts (3.5%) and other (6.9%). In terms of the top two volunteer organizations, SU students volunteer for similar organizations. Volunteering and Community Service: As a Course Requirement
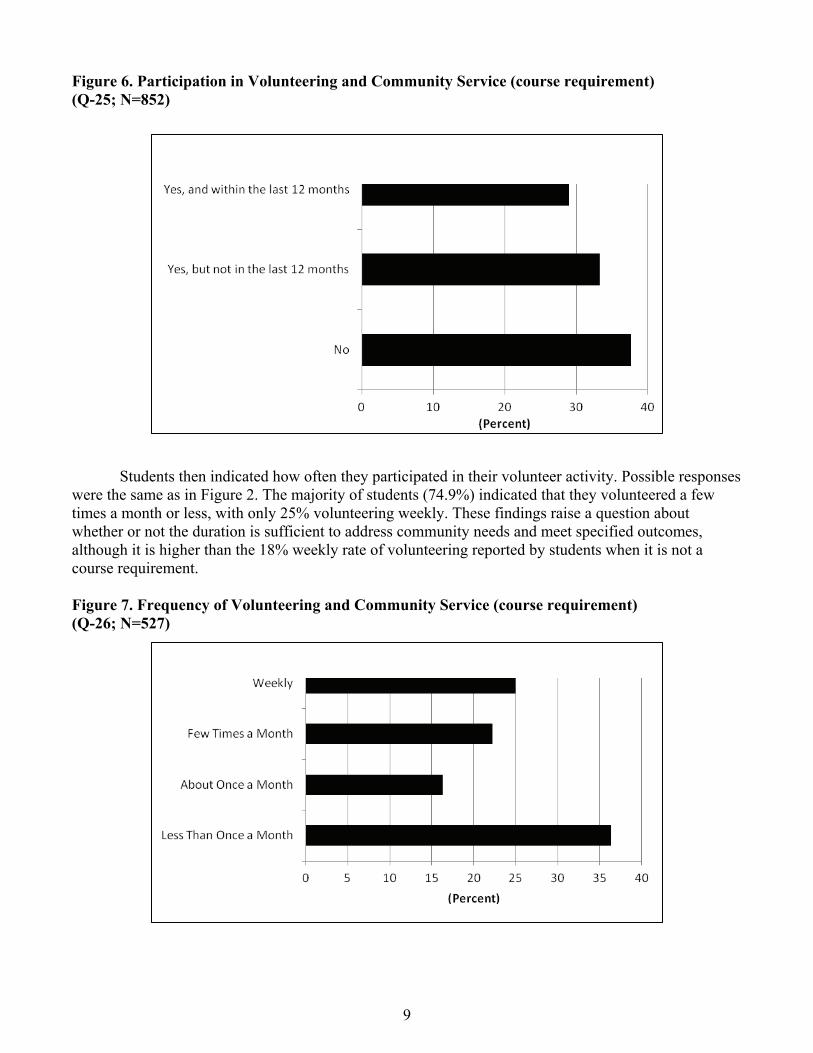
This section examines similar questions relating to the volunteer and community service activities of SU students. The first question asked students whether they participated in volunteer work or community service as part of a class or course requirement. Possible responses were the same as those used in Figure 1. Students’ responses indicated that a majority (62.3%) had volunteered as part of a course requirement, but fewer than half (29%) of those students had volunteered in the last twelve months. (See Figure 6.)
9
Figure 6. Participation in Volunteering and Community Service (course requirement) (Q-25; N=852)
Students then indicated how often they participated in their volunteer activity. Possible responses
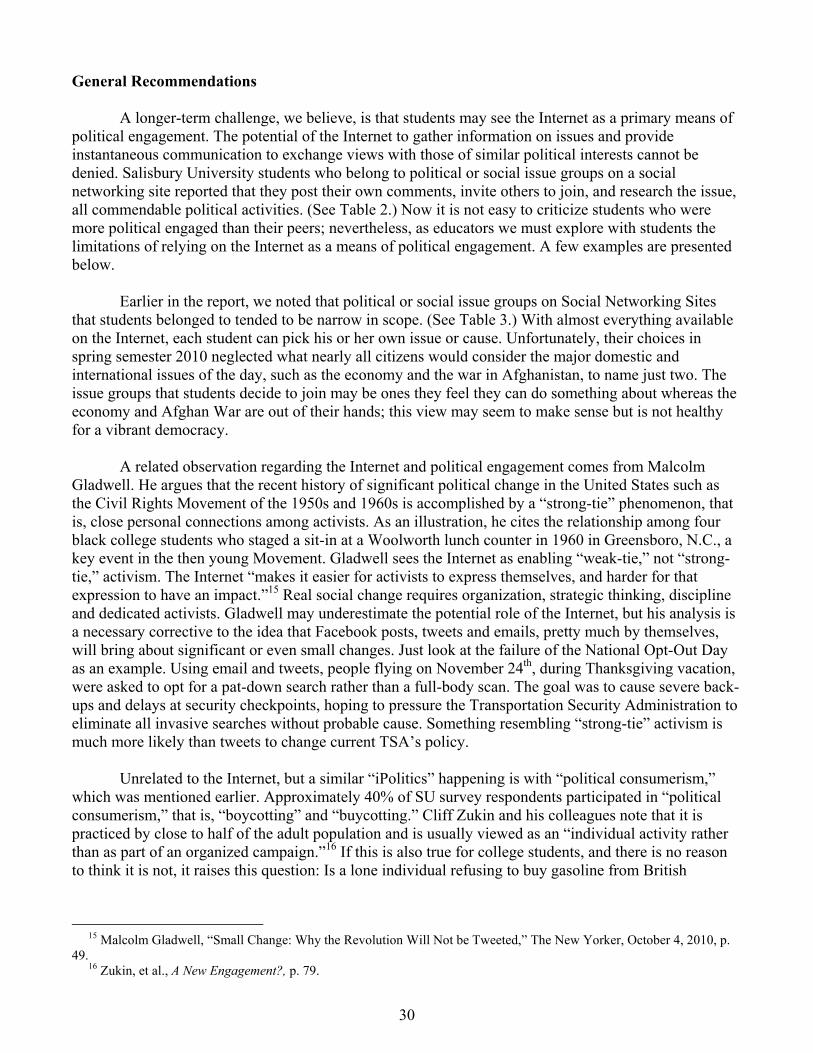
were the same as in Figure 2. The majority of students (74.9%) indicated that they volunteered a few times a month or less, with only 25% volunteering weekly. These findings raise a question about whether or not the duration is sufficient to address community needs and meet specified outcomes, although it is higher than the 18% weekly rate of volunteering reported by students when it is not a course requirement. Figure 7. Frequency of Volunteering and Community Service (course requirement) (Q-26; N=527)

10
In order to understand the types of volunteer activities students engaged in, the students were asked to check all that apply from the same list used in Figure 3. Students’ volunteerism as part of a course requirement was focused on fundraising (21.9%), which was closely followed by providing general labor/transportation (20.9%). Smaller percentages of students tutored/taught (17.8%), engaged in activities related to food (14.7%), mentored (13.1%) or engaged in other activities related to the environment (2.1%) and clerical work (1.7%). (See Figure 8.) When compared to the percentages for volunteerism not as a class requirement presented previously, it is clear that when community service is a requirement SU students are less involved in general labor/transportation (31.8% vs. 20.9%) and more involved in tutoring/teaching (12.3% vs. 17.8%) and mentoring (10.2% vs. 13.1%).
Figure 8. Types of Volunteer and Community Service Activities (class requirement) (Q-27; N=771-total number of responses)
Finally, students were asked whether they participated in their chosen volunteer activity longer than was expected or required of them. Most students (65.8%) indicated that they did not volunteer longer than was required. (See Figure 9.) Figure 9. Volunteer Longer Than Expected (course requirement)? (Q=28; N=527)

11
Community Service: Time and Opportunities
This section examines two questions: one relating to students’ perceptions of whether they have enough time to engage in community service or not, and one relating to their perceptions of whether they engage in community service as much as they would like or not. The students responded either “yes” or “no” to each question. Respondents generally indicated that they did not have enough time to volunteer (55.6%) and a substantial number (77.4%) responded that they were not involved in volunteering/community service as much as they would like to be. (See Figures 10 and 11.) Evidently students want to be more involved in volunteerism and service but may not have the time to engage in these activities. Figure 10. Enough Time to Volunteer (Q-29; N=838)
Figure 11. Involved in Volunteerism and Service as Much as You Would Like to be (Q-30; N=839)

12
(percent)
PART II: POLITICAL ENGAGEMENT Overview
Fourteen survey questions asked students about their engagement in a range of activities, from simply talking with their friends about politics to volunteering in political campaigns, with several questions focusing on different ways individuals can express their views. Each question had three possible responses: “No, have not done;” “Yes, have done it, but not in the last 12 months;” and “Yes, have done it, and within the last 12 months.” The percentages in Figure 12 reflect the third response only, in other words, the highest level of involvement. Over 85% of respondents reported having political conversations with their peers. No other activity covered by this survey came close to this level of participation. The remaining 13 activities fell into three fairly distinct groups by students’ level of participation.
In looking at Figure 12 it is easy to see that the first group contains four activities with participation ranging from one-third to almost one-half of the respondents. Two of these activities related to the reasons students decide whether or not to buy products and services. Forty-seven percent of the respondents said that they had not purchased a product or service because of the conditions under which the product was made, or because they disliked the conduct of the company. On the other hand, 38% had purchased a certain product or service because they liked the social or political values of the company producing it. Other studies have found “boycotting” and “buycotting,” as it is usually called, a frequent activity among Americans generally, not just the young.4 The next two activities had very similar percentages: attending a campus speaker who discussed domestic or international issues (35%) and posting messages on a blog to express opinions on political or social issues (38%). (Please note that one of the activities, being a member of a Social Networking Site, SNS, that takes a stand on political or social issues, will be discussed in the next section.) Figure 12. Political Engagement Activities
4Cliff Zukin, et al., A New Engagement? Political Participation, Civic Life, and the Changing American Citizen, (New York: Oxford University Press, 2006) p. 62.

13
Participation in the next group of activities ranged from 13% to 27%. Signing an email or written petition about political or social issues was engaged in by 27.8% and 23.7% of respondents, respectively; but contacting a public official to ask for assistance or to express an opinion as a way of engaging in politics is at only 13.1%.
Activities in the last group had very low participation, from 5.6% to 9.9 %, that is, fewer than one in ten students was involved in the following: attending a city council or neighborhood association meeting; expressing opinions on political or social issues by taking part in a protest, march, or demonstration; calling a radio or television talk show; contacting a newspaper or magazine; and volunteering in political campaigns in an election.5 A Closer Look at Social Networking Sites
Recent research on generations and their participation in politics has advanced the idea that a new citizenship is emerging among the Millennial generation.6 If this is true, it will almost certainly utilize modern technology, especially Social Networking Sites. With this in mind, we decided to ask a few question to see if SU students use SNS as a means of political engagement. A large majority of respondents (87.2%) created a personal profile for a Social Networking Site such as Facebook or Myspace; only 12.8 % declined. (See Figure 13.) Figure 13: Created a Profile on a Social Networking Site (Q-14; N=859)
A follow-up question asked students who created a personal profile whether or not they were a
member of or belonged to an SNS group that takes a stand on political or social issues. Students were almost equally divided, with 42 % saying “yes” and 43 % saying “no.” 5The question of how SU students compare on political engagement to students on other campuses is an intriguing one, but not one that we considered because the few studies available are based on, for the most part, survey questions that are different from ours. An exception is the section on voting where comparisons to national and campus surveys are discussed. 6 Zukin, et al., A New Engagement, pp. 188-200; Russell J. Dalton The Good Citizen: How a Younger Generation is Reshaping American Politics, Revised Edition, (Washington, D.C.: CQ Press, 2008). Harry Basehart and Peter Nagler, A New Generation, A New Engagement? Available at http://www.salisbury.edu/pace/publications/welcome.html.

14
Figure 14: Belong to an SNS Group that Takes a Stand on Political or Social Issues (Q-16; N=749)
If we divide these responses by the size of the total sample for this survey (861), the resulting
percentages will be comparable to those in Figure 12, giving us a way to see where the participation level of this activity ranks.7 Calculated this way, 36.7% of respondents are members of a group that takes a stand on political or social issues, 37.5% are not, and 12.8% do not know whether they are or not. The “yes” percentage ranks this activity fifth in terms of participation, between attending campus speaker on issues (37.8%) and posting messages on a blog (35%), a moderate but respectable level. It is thus important to remember as we continue to discuss Social Networking Sites that we are describing involvement by approximately one in three students. (We will raise some questions later in this report about SNS as way to participate in politics.)
The different activities in which SU students participated on these sites are listed in Table 2. “Reading posts” placed by other members of the group and “researching the issue” were selected most frequently. Close to 18% engaged in “posting their own comments” and “inviting others to join.” Table 2. Participation in SNS Political or Social Issue Groups (More than one response allowed.) (Q-18; N=823-total number of responses) Ways of Participating Frequency Percentage Blogging.........................................................81........................................................9.8 Donating money.............................................59........................................................7.2 Reading others’ posts.....................................223......................................................27.1 Posting own comments ..................................147......................................................17.9 Inviting others to join.....................................150......................................................18.2 Researching the issue.....................................163......................................................19.8
In an open-ended question, respondents were asked to name the political or social issue group they belong to, with space for up to four groups. We have categorized their first choice in Table 3. Groups for the major political parties, a few minor parties and candidates for political office were cited most frequently. This indicates a stronger interest in political campaigns and elections than we expected
7 Structured responses to these two questions are slightly different. See Q-13, as an example, and Q-16.

15
and perhaps even the potential for greater student involvement in grassroots election campaigns. The remainder of the categories is fascinating because of the variety of issues included, and what is excluded. Table 3: Categories of Political or Social Issue-Groups Students Belong to on Social Networking Sites (Q-17; N=227a) Category Frequency Percentage Political parties, candidates, ideology........................43............................................18.9 Gay rights/same-sex marriage....................................17............................................7.4 President Obama ........................................................15............................................6.6 Environment...............................................................13............................................5.7 Animal rights .............................................................12............................................5.3 International issues.....................................................12............................................5.3 Abortion .....................................................................11............................................4.9 Cancer ........................................................................11............................................4.9 Health care reform .....................................................11............................................4.9 U.S. Armed Forces.....................................................11............................................4.9 Thirteen different categories (mentioned 2-9 times) ....57............................................25.1 Fourteen misc. categories (each mentioned once) .....14............................................6.1__________ aIf all respondents who belong to an SNS issue group had answered this question the total N would have been 316; the N is 227 because 79 respondents did not answer and 10 responses could not be interpreted.
Not receiving even a mention were some of the major public policy issues during spring semester 2010 such as the war in Afghanistan, high unemployment, a slow if not stagnant economy, and regulation of financial institutions. Abortion, a long-standing social issue, was present along with the newer, and more frequently mentioned, issue of gay rights/same-sex marriage. Third in the rankings are groups that support or criticize President Obama. Several issues ranging from animal rights to U.S. Armed Forces received 10 or more mentions and made the list as separate categories.
As further evidence of the variety of issues mentioned, fully 25% of student respondents cited
issue groups with a frequency of between 2-9 times. Examples include the 28th Amendment, religious organizations (Christians, Campus Crusade for Christ) and student organizations (Campus Against Violence, Elect Glanz for SGA President). Six percent of respondents mentioned a group or issue that no one else mentioned (i.e., only once in the survey): American Center for Law and Justice, Campaign for Liberty, and Reinstate Pluto as a Planet.

16
Sources of News
The survey asked students how frequently they use various sources of news, with four available responses: “Every day,” “Several times a week,” “Several times a month,” and “Never.” The percentages in Figure 15 show a combined total for respondents who chose “Every day” and “Several times a week.” As might be expected, reading the news online was chosen most often (35.3%) followed by watching the news on TV (28.0%). Identified less frequently were listening to the news on radio (17.5%) and reading the newspaper (12.4%). While reading the news online was the most popular source of news, only 6.8% of respondents read blogs that deal with political and social issues. (Percentages are based on the total number of responses.) Figure 15. Sources of News used “Every day” or “Several times a week” (More than one response allowed.) (Q-31-Q-36; N=1,469-total number of responses)
An open-ended question asked over 700 students who said they read the news online, regardless
of how frequently, to identify up to four of their favorite websites for news. Their first choices are in Table 4. Perhaps most striking is the diversity of sites: 14 websites were selected by 12 or more respondents, accounting for just over 80% of the total. The remaining respondents, almost 20%, selected another 60 different websites. Perhaps the best illustration of this are the 17.5% of respondents who mentioned a website that no one else or only a few others cited. Websites mentioned with a frequency of between 2-9 times were the Drudge Report (9), ESPN (9), NPR (6), USAToday (3), and Perez Hilton (2). Among the 40 different sites, each mentioned by only one person, were The Associated Press, Current.com, MS.com, SBYnews.com, The New Yorker and Xanga.com. As is often noted today, the time when a majority of Americans obtained information from a couple of national sources has passed, replaced with almost unlimited options on a website of an individual’s choosing.
Still, there were clear leaders for news, and the top two were Yahoo.com and CNN.com, together
chosen by just over 34% of the respondents. A cursory examination of these two sites and others reveals an important difference in how the news is presented. For example, two of the favorite websites (Yahoo and AOL) are weak in their presentation of traditional “hard” news. Yahoo.com and AOL.com are in the business of providing various Internet services such as email and their home pages tend to focus on “lite news” from the entertainment world or “news you can use.” A recent headline from AOL.com proclaimed, “Switching Insurance Really Saves Money?” Hard news can be found at AOL.com, but one must look closely to find it. On the other hand, CNN.com and Foxnews.com focus on domestic and

17
international news stories, including breaking news, all easily identified by the user. Slightly more than half of respondents obtain their news from what we consider to be good sources of hard news, and less than half are viewing mostly “lite” news.
Table 4: Preferred websites for reading news online (Q-34; N=667a) Website Frequency Percentage Yahoo.com.................................................................133..........................................19.9 CNN.com ...................................................................117..........................................17.4 AOL.com ...................................................................51............................................7.7 Washingtonpost.com..................................................35............................................5.3 MSN.com...................................................................30............................................4.5 Foxnews.com .............................................................30............................................4.5 nytimes.com...............................................................26............................................3.9 Comcast.net................................................................24............................................3.6 wboc.com...................................................................24............................................3.6 msnbc.com .................................................................23............................................3.5 news.bbc.co.uk...........................................................19............................................2.9 news.google.com........................................................13............................................1.9 wsj.com ......................................................................13............................................1.9 delmarvanow.com......................................................12............................................1.8 Twenty different sites (mentioned 2-9 times)............77............................................11.5 Forty different sites (each mentioned once)...............40............................................6.0__________ aReading the news online was cited by 737 respondents; only 667 answered Q-34. Voting
This section examines a number of questions relating to participation in elections by SU students. The focus was on voter registration, with only two questionnaire items about the act of voting. For college students and young people generally, the registration process contains potential questions that even the highly motivated may not be able to answer: “Where do I get a registration form? Should I choose a party? Where should I register if I’ll be living somewhere other than my current home on Election Day?”
Casual observers of election practices in the U.S. may believe that the opportunity to register while obtaining a driver’s license at the state motor vehicle administration office takes care of any registration problems 18-year-olds face. But a moment’s reflection shows that this cannot be true because most young people obtain their driver’s licenses well before their 18th birthdays, when they are not yet old enough to register.8 Only 27.7% of respondents registered to vote when they received their driver’s license. (See Figure 16.)
8 In 2010, Maryland passed a law which allows 16-year olds to register to vote if they meet all other voter registration requirements. It also allows voting in a primary election in which candidates are nominated for a general or special election that will occur when the newly registered voter is at least 18. Maryland is now the fifth state to allow pre-registration of 16-year-olds. This law should make it easier for young people to register to vote.

18
Figure 16. Registered to Vote at MVA (Q-42; N=629)
Over 75% of our respondents reported that they are registered to vote. This compares favorably to young adults (18-to-29-year olds) generally, but is lower by approximately 15 percentage points than that reported by the few available studies of college students.9 (See Figure 17.) Figure 17. Registered to vote (Q-38; N=836)
9According to the Bureau of the Census, 61% of all 18-to-29-year-old citizens were registered to vote in the 2008 presidential election year. See CIRCLE Fact Sheet: Voter Registration Among Young People in 2008, by Surbhi Godsay. Available at http://www.civicyouth.org/featured-voter-registration-among-young-people-in-2008/. A 2004 national survey of college students reported a voter registration rate of 88%. See CIRCLE Fact Sheet: College Students in 2004 Election, by Richard Niemi and Michael Hanmer. Available at http://www.civicyouth.org/fact-sheet-college-students-in-the-2004-election/. A 2006 national study of college students reported 91.0% voter registration. See Kent E. Portney and Lisa O’Leary, “Civic and Political Engagement of America’s Youth: A Report from the Tisch College National Survey of Civic and Political Engagement of Young People,” p. 19. Available at activecitizen.tufts.edu/downloads/FinalReport1.pdf

19
Where students register, that is, what state and county, has been of interest to PACE, Salisbury University and the surrounding community for a number of years. A large majority of respondents, 87.9%, are registered to vote in the county they lived in before attending Salisbury University. (See Figure 18.) The notion that students from other Maryland counties or other states come to Salisbury University and change their voter registration to Wicomico County is simply not true. Only 12.1% of respondents indicated that they changed their registration to their school address or were first-time registrants and used their school address.
Figure 18: Where are you registered to vote? (Q-41; N=627)
Looking back to Figure 17, we know that close to 25% of the respondents were not registered to vote; this is not a large percentage but it does represent one of every four students. To discover why, we simply asked them in a direct way to tell us their reason for not registering. The question offered three structured responses to choose from and an “other” or open-ended option. (See Figure 19.)
Figure 19. Why are you not registered to vote? (Q=39A, Q-39B; N=195)

20
Only 6.2% of the respondents were not citizens, and just over 10% believed that their votes would not make a difference. Close to one-third gave a practical answer by saying that registration assistance and forms were not available. Over 50% of these respondents selected “Other,” and their explanations include the following: “I just turned 18” (40.2%); “Not enough time to get around to it” (23.5%); “Don’t know enough about politics to vote” (12.7%); “Hate politics” (4.9%); and “I am not totally sure how to register and I am an out-of-state student” (4.9%).
Respondents not registered to vote were asked to choose which of three options would provide
the best opportunity to register, if they were interested. (See Figure 20.)
Figure 20. Which would provide the best opportunity to register to vote? (Q= 40A, 40B; N=190)
Since the 2000 presidential election, PACE has provided all three registration opportunities. The students’ clear favorite is registering at tables located across campus with trained student volunteers. PACE supported table registration, but placed greater emphasis on trained student volunteers visiting classes, with advanced permission of the instructors, where it is possible to have a dialogue concerning the importance of voting between students in the class and the volunteers. PACE preferred this format, believing that in addition to the simple act of registration, a discussion of why voting is important can help provide motivation to follow through and actually vote.
PACE also offered students assistance in applying for absentee ballots. The importance of this effort is documented in Figure 21. In the 2008 presidential election, almost as many students reported voting by absentee ballot (36.0%) as voting at a polling place (37.3%). Absentee ballots are particularly important to students who are registered to vote in other Maryland counties or other states.

21
Figure 21. How did you vote in the last presidential election, November 4, 2008? (Q=43: N=630)

22
PART III: ADDITIONAL ANALYSIS AND FOCUS GROUP RESULTS The Effects of Academic School and Class Year on Volunteering/Community Service and Political Engagement
In creating bivariate tables, our interest was on obtaining a clearer picture of participation by the academic school of students and what happens to student participation during their four (or more) years at Salisbury University. We did this first as a function of school and then as a function of class year. Table 5. Participating in Volunteering/Community Service that is not Part of a Course Requirement by School of Students’ Major (percentages) Response Fulton Henson Perdue Seidel Total No.......................................................10.2.................10.2.................13.8.................6.7...................10.2 Yes, but not in last 12 months............31.8.................29.1.................35.6.................29.4.................31.4 Yes, and within last 12 months ..........58.0.................60.7.................50.6.................63.8.................58.4 Total ...................................................100.0...............100.0...............100.0...............100.0...............100.0 (N) ......................................................(305)...............(196)...............(160)...............(163)...............(824) Table 6. Participating in Volunteering/Community Service that is Part of a Course Requirement by School of Students’ Major (percentages) Response Fulton Henson Perdue Seidel Total No.......................................................38.6.................40.3.................45.6.................24.5.................37.6 Yes, but not in last 12 months............34.3.................33.2.................35.0.................30.1.................33.3 Yes, and within last 12 months ..........27.1.................26.5.................19.4.................45.4.................29.1 Total ...................................................100.0...............100.0...............100.0...............100.0...............100.0 (N) ......................................................(306)...............(196)...............(160)...............(163)...............(825)
A comparison of Tables 5 and 6 indicates that more students answered that they participated in volunteering/community service that was not part of a course requirement than was part of a course requirement. In both cases, more students in the Seidel School of Education and Professional Studies have participated in both categories of activities, as opposed to fewer students in the Perdue School of Business having participated in both categories of activities.
Table 7. Participating in Volunteering/Community Service that is Not Part of a Course Requirement by Students’ Class Year (percentages) Response 1st Year 2nd Year 3rd Year 4th year Total No.......................................................7.5...................11.4.................12.6.................8.9...................10.1 Yes, but not in last 12 months............28.0.................34.3.................32.9.................31.0.................31.5 Yes, and within last 12 months ..........64.5.................54.2.................54.5.................60.1.................58.4 Total ...................................................100.0...............100.0...............100.0...............100.0...............100.0 (N) ......................................................(186)...............(166)...............(231)...............(258)...............(831)

23
Table 8. Participating in Volunteering/Community Service that is Part of a Course Requirement by Students’ Class Year (percentages) Response 1st Year 2nd Year 3rd Year 4th year Total No.......................................................33.9.................34.9.................42.2.................37.9.................37.6 Yes, but not in last 12 months............32.3.................41.0.................31.9.................30.6.................33.4 Yes, and within last 12 months ..........33.9.................24.1.................25.9.................31.5.................29.0 Total ...................................................100.0...............100.0...............100.0...............100.0...............100.0 (N) ......................................................(186)...............(166)...............(232)...............(248)...............(832)
A comparison of the two tables indicates that fewer juniors (3rd Year) participated in either type of volunteering/community service than any other class; this is especially true in the “No” response category in Table 8.
In looking at political engagement, the focus was on questions that revealed at least moderate differences in opinions and thus some variation that perhaps might be explained by school and year in college. Questions selected for analysis were those where no single response was given by 70 percent or more of the respondents. Table 9. Political Engagement Questions by School of Students’ Major (percentages) Question Fulton Henson Perdue Seidel Total Signed email petition* ...........35.4.................24.1.................18.9.................25.9.................27.6 Boycotting*............................46.2.................28.7.................38.1.................35.0.................38.3 Boycotting*............................53.6.................41.8.................38.8.................43.8.................46.0 Attended on-campus speaker* ...40.5.................33.7.................36.3.................38.7.................37.7 SNS/issues**..........................50.6.................40.1.................30.1.................41....................42.2 Reading the news on-line***.....35.0.................26.5.................35.0.................22.7.................30.5 Vote intention****.................42.1.................37.5.................36.5.................45.0.................40.6 *Percentages are for those choosing “Yes, and within the last 12 months.” **Percentages represent a simple “Yes.” ***Percentages represent “Everyday.” ****Percentages represent “Definitely.” Generally, and as might be expected given the different academic disciplines, perhaps even cultures, of the four schools, students in the Fulton School of Liberal Arts have a higher level of political engagement than students in the other three schools, exceptions are the Perdue School, which ties with the Fulton School on “Reading the news on-line” and the Seidel School which is higher on “Vote intention.” Again, generally, and the differences are not always large, students in the Perdue and Henson schools rank lower than students in the Seidel and Fulton schools. The highest ranking of Perdue and Henson students is in “Boycotting.”

24
Table 10. Political Engagement Questions by Students Class Year (percentages) Question 1st Year 2nd Year 3rd Year 4th Year Total Signed email petition* ...........23.9.................18.7.................27.6.................36.8.................27.7 Buycotting*............................37.6.................29.5.................38.4.................45.1.................38.4 Boycotting*............................45.7.................39.2.................47.2.................49.2.................45.8 Attended on-campus speaker* ...49.5.................27.7.................29.7.................42.7.................37.6 SNS/issues**..........................43.4.................42.3.................39.9.................42.7.................42.0 Reading the news on-line***.....31.2.................21.7.................31.0.................35.9.................30.6 2010 Vote intention****........41.3.................24.6.................40.0.................50.2.................40.5 *Percentages are for those choosing “Yes, and within the last 12 months.” **Percentages represent a simple “Yes.” ***Percentages represent “Everyday.” ****Percentages represent “Definitely.” Students in their 4th year tend to have higher levels of political engagement with 2nd year students having the lowest. A particularly noticeable drop occurs on attending on-campus speakers for 2nd and 3rd year students. Summary of Focus Group Discussions
As part of this project to take a closer look at the civic and political engagement of Salisbury University students, three focus group discussions were conducted. We decided to include focus groups because they generally complement surveys by providing different kinds of information. Surveys are valuable because they gather quantitative data on a large number of people. Respondents can report on their behavior and even their attitudes toward the topic of interest. Focus groups are better at answering “why” questions and obtaining more in-depth answers. Focus group procedures are described in Appendix B.
This section analyzes the primary themes that emerged from the three focus groups. The following three themes emerged:
• Student Awareness of Opportunities for Volunteering and Political Engagement • Student Motivation for Volunteering and Political Engagement • Salisbury University Influence on Student Volunteering and Political Engagement
Theme One: Student Awareness The general consensus of focus group participants was that students are relatively unaware of
opportunities to volunteer or to become politically engaged. While they acknowledged that opportunities are publicized via email, they reported feeling overwhelmed by the amount of information sent to them via email. That perceived overload often influences them whether or not even to open email messages. In addition, they reported that most students have a personal email account before arriving at the University. Despite awareness of the fact that they can have SU email forwarded to that account, many students choose not to do so. Therefore, they may not review all SU emails in a timely manner and thus miss an opportunities to become involved.
Several focus group participants pointed out that membership in a Registered Student
Organization did provide a connection to opportunities for involvement because many organizations are required to participate in community service activities. At the same time, they claimed that many

25
students who were not involved in those organizations would not be aware of opportunities for involvement. The inference was that most students were not involved in a student organization and were therefore less aware of opportunities. Additionally, being involved in a student organization apparently does not guarantee easy access to service activities. Participants reported that some student organizations have trouble finding service activities to meet the service requirement; they often have had to search for opportunities.
Classes and majors were other ways that focus group participants became aware of opportunities.
Some participants reported that some professors consistently announced information about how to get involved. Others reported that their majors, particularly Nursing and Education, integrated civic involvement as a requirement in some classes. A few participants acknowledged the efforts and programs of PACE, specifically the Presidential Scholars Program, as important sources of information about opportunities for civic engagement.
Other comments, although emerging less frequently, centered on students’ lack of awareness of
social and political issues in general. While SU students are required to take a social science class for a General Education requirement, participants suggested that this did not necessarily increase their awareness of issues, particularly political issues. Participants reported that, at best, they have a superficial understanding of such issues.
The theme of awareness, then, relates not only to opportunities to become involved but also to
students’ understanding of issues.
Theme Two: Motivation The first question here was whether or not students felt they had time to devote to involvement.
One of the focus groups was nearly unanimous in the opinion that students could make time for volunteering. The majority opinion in the other two groups, however, was that students did not have time, even if they did not work--studies alone took the majority of their time. The time problem aside, the general opinion was that students were not motivated to become involved. In discussing motivation more specifically, several sub-themes emerged that explain the lack of motivation to become involved.
One sub-theme is self-benefit. While some participants acknowledged that volunteering and civic
engagement seemed like a good idea in general, others indicated that they did not see personal benefit in volunteering or civic engagement. The perceived lack of connection between participants’ lives and involvement was bolstered by some of the participants’ observation that students at Salisbury University exist in a “bubble.” The bubble is education, their only reason for being here. Many participants suggested that there is no clear connection between them as students and the local community. In fact, some participants suggested that there is not much motivation to serve the Salisbury community because they believe that the community does not appreciate them.
Another sub-theme is that of relevance. Apart from feeling estranged from the Salisbury
community, participants spoke of not seeing a connection between volunteering and their own lives. A lack of understanding of why it is important to be involved in the community and how becoming involved related to their education and training for the future seemed to work against any motivation to participate.
Participants also suggested that many SU students suffer from apathy. In their opinion, for many
of the reasons already identified, students simply have no interest in volunteering and student engagement: they have a singular focus on getting a degree, they are not aware of the issues that impact

26
the local community, they do not feel connected to the community, and they do not see the connection between community involvement and their personal situations.
An important caveat seems in order here. The challenge here seems more about awareness, on
many levels, than about individuals who lack compassion and caring. The question is how to create awareness and, therefore, motivation. This is addressed in the final theme.
Theme Three: Salisbury University Influence
It was clear in the discussions that students see the University as a logical place to learn about
volunteering and civic engagement, even if they are not particularly knowledgeable or motivated. Participants were asked how to create more interest in community volunteering and learning about political issues among students.
The University might consider more aggressive efforts to address the student awareness and the
student-community relationship to increase volunteering and civic engagement. To be both clear and fair, the existence of PACE, the Center for Conflict Resolution and an active “Town-Gown” committee are indicators of the University’s commitment. Yet, it seems uncertain, based on students’ comments, whether or not these efforts are reaching as many students as they could or should.
Specific answers to the question of how to create more interest resulted in a number of
suggestions: more faculty involvement, integrating civic and political engagement more fully into the student culture, integrating civic and political engagement in the curriculum, and more resources from University administration.
These student focus groups had much to say about both positive and negative elements of
volunteering and civic engagement. While themes such as apathy, concern for personal benefit and seeing the Salisbury community as unsupportive are potential causes for concern, such perceptions are more about education than attitude. It appears as though students lack information on the importance of as well as the social/personal benefit of community involvement. Many might argue, and appropriately so, that educators cannot do everything in the classroom. However, many of the same individuals would most likely be the first to agree that a university education must be about more than career training. Addressing the issues articulated herein might be an important step in encouraging greater student civic and political engagement. The next section of this report will consider ways this could be accomplished.

27
CONCLUSIONS AND RECOMMENDATIONS
The general picture of civic and political engagement that emerges of Salisbury University students is a fairly positive one, but one where modest changes in current efforts could have a sizable and positive effect on levels of participation. More importantly, improved coordination, additional University resources and greater faculty participation will be required to empower students, in the words of the University’s mission statement, with the “skills and core values that contribute to active citizenship…” A brief summary of our findings and both specific and general recommendations are presented below.
Civic Engagement
Salisbury University students volunteer and engage in community service. They engage in these activities not as a class requirement more than as a class requirement. They also want to engage in more volunteerism and community service but believe they don’t have the time to do so. When service was performed not as a class requirement, students reported that they were more likely to engage in general labor/transportation and less mentoring and tutoring than when service was performed as a class requirement. The greater mentoring and tutoring when service was a class requirement is consistent with the idea that this type of service needs to be a part of the student’s curriculum. The fairly consistent finding of the prevalence of fund raising across the two types of service, raises a question about how this activity was integrated into the curriculum when it was performed as a class requirement.
Service that was not done as a class requirement was generally performed for organizations such as a church or Salisbury University groups. A national survey showed similar results. Students who engaged in service not as a class requirement indicated that they served longer than expected, whereas students who engaged in service as class requirement indicated that they did not serve longer than expected. These findings make sense given that the latter is related to the parameters of a course.
The data also reveal a difference across schools and student’s class year. For example, students in the Seidel School were more likely to engage in both types of service, whereas students in the Perdue School were less likely to engage in both types of service. Juniors were less likely to engage in volunteerism and community service as part of a course requirement. Specific Recommendations
1. As Salisbury University moves forward with volunteerism and community service, we
believe it is important to do so in the context of the focus group responses. Although our students do volunteer, there is an indication that there is a general lack of awareness of opportunities to volunteer and engage in community service. There is also an indication that students lack motivation because of feeling estranged from the community and not understanding the benefits of volunteerism and service. Understanding how it fits into their course work might transcend several of these issues. If more volunteerism and community service were part of the curriculum, in other words, service learning, students might develop a different opinion about the value of service.
2. This survey showed percentage of students engaged in community service both in and out
of the classroom. In the future, the University should broaden the survey to include internships and practical. It also is important to assess the number of hours per term the typical SU student engages in community service.

28
General Recommendations To provide validation and/or enhancement to what SU students and faculty are presently doing
with respect to community service both in and out of the classroom, the administration may want to examine The Carnegie Foundation’s criteria and consider applying for their elective Community Engagement Classification. Generally, elective classifications within the Carnegie classifications of institutions of higher education are available so “important aspects of institutional mission and action…”10 can be recognized. The Community Engagement Classification values “the collaboration between institutions of higher education and their larger communities (local, regional/state, national, global) for the mutually beneficial exchange of knowledge and resources in a context of partnership and reciprocity.11 This classification was available in 2006, 2008 and 2010, and will not be available again until 2015.
In 2010, institutions had to demonstrate substantial commitments in both of the categories below:
Curricular Engagement includes institutions where teaching, learning and scholarship engage faculty, students, and community in mutually beneficial and respectful collaboration. Their interactions address community-identified needs, deepen students’ civic and academic learning, enhance community well-being, and enrich the scholarship of the institution. Outreach & Partnerships includes institutions that provided compelling evidence of one or both of two approaches to community engagement. Outreach focuses on the application and provision of institutional resources for community use with benefits to both campus and community. Partnerships focus on collaborative interactions with community and related scholarship for the mutually beneficial exchange, exploration, and application of knowledge, information, and resources (research, capacity building, economic development, etc.).12
Moving forward on this initiative would require a major commitment of University resources.
Political Engagement
In looking at the political engagement of survey respondents, the good news is that a large
majority (from 61% to 85%) reported that they talk with their friends about politics or social issues, were registered to vote and read the news online everyday or several times a week. Certainly, it would be desirable to have a majority of students involved in more activities; nevertheless, a minimal level of involvement was demonstrated.
Approximately four of every ten respondents (from 35% to 47%) were involved in additional
political activities. At the top of this list was “boycotting” or “buycotting,” that is, not purchasing a product because you dislike/like the conduct or the political/social values of the company producing the product. The simple, though important, act of attending a campus speaker on domestic or international issues is included here. And the final two ways of engaging in politics take advantage of the Internet: belonging to a Social Networking Site group that takes a stand on political or social issues and posting messages on a blog concerning political or social issues.
10 http://classifications.carnegiefoundation.org/descriptions/community_engagement.php. 11 Ibid. 12 Ibid.

29
The lowest level of participation (from 6% to 27%) was found in a number of activities such as volunteering in a political campaign, taking part in a march or demonstration, contacting a public official, or signing a petition. It is possible that these traditional activities do not interest today’s students, who are frequent users of modern communications technology; they simply may find use of the Internet as a more comfortable and easier way to participate. Specific Recommendations
With this summary picture, what changes would improve political engagement?
1. As with volunteering and community service, political engagement tends to drop among 2nd and 3rd year students. We are not sure why this is the case, perhaps the University spends more time trying to involve 1st year students, and perhaps seniors are more self-motivated, realizing that they will graduate soon and they must rush to be prepared for the real world. (Skeptics might say 4th year students are in a burst of activity to build their resume.) Whatever the reason, it is important to keep in mind that improving the civic and political engagement of students in their middle college years would improve the overall level of engagement of SU students.
2. As noted in Section VII, the voter registration rate of survey respondents at 75% is
approximately 15 percentage points below the levels reported by two national surveys of college students. Expanded efforts to register students to vote (and apply for absentee ballots when needed) in election years should be undertaken. One possible way to accomplish this is to add faculty coordinators from the four schools to PACE’s current effort of handling University-wide registration by itself. We recommend that PACE continue using classroom visitations by trained student registration volunteers as an integral part of voter registration.
3. The number of lectures on domestic and international issues and politics and faculty
involvement in their planning should be increased. This can be in the form lectures aimed at large audience (200 to 300 attendees) and smaller settings, including the classroom. PACE would be the logical office to coordinate an expanded speaker series. It also is important to involve other faculty in ideas for speakers and topics; more faculty “stakeholders” in an event will increase student interest and attendance. To ensure that students really learn from a speaker, faculty should require a brief, reflective in-class essay or an in-class discussion for 15 to 20 minutes concerning the content of the speaker’s presentation.
4. New venues for educating and involving students in politics must be created. Fifty-
minute “Citizenship 101” seminars, with free pizza for lunch, could be offered on a regular basis to discuss what it means to be an engaged citizen or even current issues.13 Seminars on engaged citizenship could be of particular interest to the Office of Student Activities, Organizations, and Leadership. Another possible venue might be found in the process of “deliberative polling” of SU students on a major national issue.14 (A deliberative poll would require considerable time, but a process utilizing various deliberative poll procedures is possible.)
13 Other ideas for engaging students are found in Anne Colby, et al., Educating for Democracy: Preparing Undergraduates for Responsible Political Engagement (San Francisco, Calif.: Jossey-Bass, 2007). 14 See Center for Deliberative Democracy; http://cdd.stanford.edu/.
30
General Recommendations
A longer-term challenge, we believe, is that students may see the Internet as a primary means of political engagement. The potential of the Internet to gather information on issues and provide instantaneous communication to exchange views with those of similar political interests cannot be denied. Salisbury University students who belong to political or social issue groups on a social networking site reported that they post their own comments, invite others to join, and research the issue, all commendable political activities. (See Table 2.) Now it is not easy to criticize students who were more political engaged than their peers; nevertheless, as educators we must explore with students the limitations of relying on the Internet as a means of political engagement. A few examples are presented below.
Earlier in the report, we noted that political or social issue groups on Social Networking Sites
that students belonged to tended to be narrow in scope. (See Table 3.) With almost everything available on the Internet, each student can pick his or her own issue or cause. Unfortunately, their choices in spring semester 2010 neglected what nearly all citizens would consider the major domestic and international issues of the day, such as the economy and the war in Afghanistan, to name just two. The issue groups that students decide to join may be ones they feel they can do something about whereas the economy and Afghan War are out of their hands; this view may seem to make sense but is not healthy for a vibrant democracy.
A related observation regarding the Internet and political engagement comes from Malcolm
Gladwell. He argues that the recent history of significant political change in the United States such as the Civil Rights Movement of the 1950s and 1960s is accomplished by a “strong-tie” phenomenon, that is, close personal connections among activists. As an illustration, he cites the relationship among four black college students who staged a sit-in at a Woolworth lunch counter in 1960 in Greensboro, N.C., a key event in the then young Movement. Gladwell sees the Internet as enabling “weak-tie,” not “strong-tie,” activism. The Internet “makes it easier for activists to express themselves, and harder for that expression to have an impact.”15 Real social change requires organization, strategic thinking, discipline and dedicated activists. Gladwell may underestimate the potential role of the Internet, but his analysis is a necessary corrective to the idea that Facebook posts, tweets and emails, pretty much by themselves, will bring about significant or even small changes. Just look at the failure of the National Opt-Out Day as an example. Using email and tweets, people flying on November 24th, during Thanksgiving vacation, were asked to opt for a pat-down search rather than a full-body scan. The goal was to cause severe back-ups and delays at security checkpoints, hoping to pressure the Transportation Security Administration to eliminate all invasive searches without probable cause. Something resembling “strong-tie” activism is much more likely than tweets to change current TSA’s policy.
Unrelated to the Internet, but a similar “iPolitics” happening is with “political consumerism,”
which was mentioned earlier. Approximately 40% of SU survey respondents participated in “political consumerism,” that is, “boycotting” and “buycotting.” Cliff Zukin and his colleagues note that it is practiced by close to half of the adult population and is usually viewed as an “individual activity rather than as part of an organized campaign.”16 If this is also true for college students, and there is no reason to think it is not, it raises this question: Is a lone individual refusing to buy gasoline from British
15 Malcolm Gladwell, “Small Change: Why the Revolution Will Not be Tweeted,” The New Yorker, October 4, 2010, p. 49. 16 Zukin, et al., A New Engagement?, p. 79.

31
Petroleum because of its responsibility for the oil spill in the Gulf of Mexico really a political act?17 To be a political act, it would require at least a letter or email to BP explaining why an individual is no longer buying gas from BP. Organizing other people to boycott BP and communicating reasons for your actions to the media and political leaders is even more political in nature. Another aspect of true political action would be for the boycotters to recognize related public policy issues such as whether or not oil drilling should be permitted in deep ocean waters offshore and if permitted whether or not extra precautions should be required. In other words, an individual on his or her own deciding not to buy from BP and doing nothing more is not really a political act.18
Final Comment
As we mentioned in the introduction, this research project was funded by the PACE/Service Learning Hargreaves Initiative. As such it was designed to give us a comprehensive picture of volunteering, community service and political engagement of Salisbury University students. We anticipate that this report will be a basis for a renewed discussion of the future direction of civic and political engagement on campus. We have enjoyed working on this project and are available to discuss the report’s findings and future options for the University.
17This reference is to the death of 11 men and a three-month long oil spill caused when the Deepwater Horizon, an offshore oil drilling rig, exploded on April 20. 2010. 18 For a perspective on politics that emphasizes the achievement of the public good, see Francis Kane, Neither Beasts nor Gods: Civic Life and the Public Good (Dallas, Texas: Southern Methodist University Press, 1998), especially Chapters 5 and 6.

32
Appendix A - Survey Methodology and Demographics of Sample
At the beginning of this project, we planned to use a probability sample of approximately 1,200 students who would be contacted initially through an email invitation that contained a link to the online questionnaire. We planned then to follow-up with telephone interviewers contacting all non-respondents in an effort to conduct the interview by phone. SU’s Office of Student Affairs, because of privacy concerns, denied our request for access to records containing phone numbers (cell and/or landline), so we had to drop our plans for a probability sample. A non-probability sample design was used as a substitute for our preferred approach. The drawback of a non-probability sample is that there is no scientific basis to generalize from the sample to the larger population (all SU undergraduates). Still, a non-probability sample is better than none, but readers must use caution in generalizing findings of the sample to the larger population.
After developing the questionnaire and contracting with SurveyMethods.com for the online presentation of the questionnaire and data collection, all SU undergraduates were sent an email explaining the importance of the survey, an invitation to participate and a link directly to the questionnaire. Monetary incentives were offered to encourage participation: ten students who completed the questionnaire were randomly selected to receive $50 Visa gift cards. The online questionnaire consisting of 55 items was housed at SurveyMethods.com, a company that provides technology for online surveys. The survey was launched with the first email to students on April 6, 2010. Follow-up emails were sent on April 14 and April 20. The survey was closed on April 26, 2010. A total of 941 students completed or partially completed questionnaires; after deleting respondents who answered fewer than half of the questions, we had a sample size (N) of 861, almost 12% of all SU undergraduates enrolled in spring semester 2010.
Aside from knowing sample size, it is important to compare demographic features of the sample to those of all undergraduates to determine if the sample appears reasonably representative. With these comparisons we can have some assurance that the survey’s findings reflect the broader student body, even if we cannot calculate an exact margin of error and confidence interval.
As seen in Appendix Figure 1, the percentage of students in the sample who chose either in-state or out-of-state residence almost exactly matched that of all undergraduates. Appendix Figure 1. State of residence before attending Salisbury University (Q-45; N=832)
0.0%
10.0% 20.0%
30.0% 40.0% 50.0% 60.0% 70.0% 80.0%
90.0% 100.0%
Sample
MarylandOther States
0.0%
10.0%
20.0%
30.0%
40.0%
50.0%
60.0%
70.0%
80.0%
90.0%
100.0%
All Undergraduates
MarylandOther States

33
Class year in college was also pretty much on target, with +/- three percentage point differences among the classes, caused primarily by the absence of an “other” category in the survey. The “other” category refers to students who are seeking second bachelor degrees or are unclassified. (See Appendix Figure 2.)
Appendix Figure 2. Class year in college (Q-46; N=832)
0.0%
10.0%
20.0%
30.0%
40.0%
50.0%
60.0%
70.0%
80.0%
90.0%
100.0%
Sample
FreshmanSophmoreJuniorSeniorOther
0.0%
10.0%
20.0%
30.0%
40.0%
50.0%
60.0%
70.0%
80.0%
90.0%
100.0%
All Undergraduates
FreshmanSophmoreJuniorSeniorOther
The sample slightly over-represented full-time students and under-represented part-time students, by five percentage points. (See Appendix Figure 3.) Appendix Figure 3. Full-time and part-time enrollment (Q-47; N=832)
0.0%
10.0%
20.0%
30.0%
40.0%
50.0%
60.0%
70.0%
80.0%
90.0%
100.0%
Sample
Full-timePart-time
0.0%
10.0%
20.0%
30.0%
40.0%
50.0%
60.0%
70.0%
80.0%
90.0%
100.0%
All Undergraduates
Full-timePart-time
A larger discrepancy was found in students’ place of residence while attending Salisbury University. (See Appendix Figure 4.) The sample over-represented by 10 percentage points students who lived on-campus and under-represented those who lived off-campus.

34
Appendix Figure 4. Place of residence while attending Salisbury University (Q-48; N=831)
0.0%
10.0%
20.0%
30.0%
40.0%
50.0%
60.0%
70.0%
80.0%
90.0%
100.0%
Sample
On-Campus
Off-Campus
0.0%
10.0%
20.0%
30.0%
40.0%
50.0%
60.0%
70.0%
80.0%
90.0%
100.0%
All Undergraduates
On-CampusOff-Campus
An expanded discussion of the question regarding race will be presented here because the University and the project’s researchers used somewhat different approaches. The survey followed the U.S. Census Bureau and did not include “Hispanic” as a racial category in the race question (Q-50; N=825); rather a separate question asked respondents whether they considered themselves to be “Hispanic or Latino” (Q-49; N=826). The University includes “Hispanic” as a race, along with “nonresident alien,” which was not a possible response in the survey. In spite of these different approaches, the sample fairly reflected all undergraduates: Whites - 82% of the sample (81% of all undergraduates); African Americans or Blacks - 9.6% of the sample (11.6% of undergraduates); Hispanics - 3.1% of sample (2.8% of undergraduates); Asian or Pacific Islander - 2.7% of sample (2.5% of undergraduates); and Native American or Alaskan Native - .8% of sample (.7%) of undergraduates. (See Appendix Figure 5.) Appendix Figure 5. Race (Q-50A; N=825)
The sample closely matched Salisbury University undergraduates on age. No age group was seriously under-represented. (See Appendix Figure 6.)

35
Appendix Figure 6. Age (Q-41; N=820)
0.0%
10.0%
20.0%
30.0%
40.0%
50.0%
60.0%
70.0%
80.0%
90.0%
100.0%
Sample
20 & Younger21-2425 & Over
0.0%
10.0%
20.0%
30.0%
40.0%
50.0%
60.0%
70.0%
80.0%
90.0%
100.0%
All Undergraduates
20 & Younger21-2425 & Over
The gender question revealed the largest discrepancy: The sample over-represented female students and under-represented male students, by approximately 20 percentage points. (See Appendix Figure 7.) Appendix Figure 7: Gender (Q-53; N=823)
0.0%
10.0%
20.0%
30.0%
40.0%
50.0%
60.0%
70.0%
80.0%
90.0%
100.0%
Sample
FemaleMale
0.0%
10.0%
20.0%
30.0%
40.0%
50.0%
60.0%
70.0%
80.0%
90.0%
100.0%
All Undergraduates
FemaleMale
The final characteristic to compare is the academic school of students. This was compiled by looking at the first major identified by students in the questionnaire. Sample percentages for students in Henson and Perdue schools were close to the same proportions as they were in the target population of all undergraduates. Fulton School students were slightly over-represented in the sample, by four percentage points, and students in the Seidel school were slightly under-represented, by three percentage points. (See Appendix Figure 8.)

36
Appendix Figure 8. School of major (Q-52;N=825)
0.0%
10.0%
20.0%
30.0%
40.0%
50.0%
60.0%
70.0%
80.0%
90.0%
100.0%
Sample
FultonHensonPerdueSeidel
0.0%
10.0%
20.0%
30.0%
40.0%
50.0%
60.0%
70.0%
80.0%
90.0%
100.0%
All Undergraduates
FultonHensonPerdueSeidel
In conclusion, the sample was a reasonably accurate reflection of all Salisbury University undergraduates on the following demographic characteristics: state of permanent residence, class year, full-time/part-time enrollment, race, age and school of major. On the other hand, the sample over-represented female students and students who lived on-campus. This over-representation should be remembered when interpreting the survey’s findings.

37
Appendix B - Focus Group Procedures
The last question of the online survey asked students if they would be interested in participating with other students in a 60-minute discussion of civic and political engagement at Salisbury University. As an incentive, a $30 Visa gift card was offered to all participants. In addition, a number of factors, including gender, major, class rank and whether housing was on-campus or off-campus, were used in selecting participants. All participants signed a consent form.
Focus group discussions were held in the PACE House conference room on April 29, May 3, and May 4. The first focus group had five participants, the second had seven participants and the third had nine. The moderator was Dr. Darrell Mullins, Professor of Communication Arts, Salisbury University.
Audio of discussions was recorded. Name tents were used to identify participants by first name only. Names of participants are confidential and were not identified in the report. Summary and analysis of discussions was written by Dr. Mullins. Recorded audio of discussions and Dr. Mullins’ summary are available from Dr. Basehart and Dr. Whitehead.
Discussion centered on these questions, with appropriate follow-up questions by the moderator: • With work and studies, do you feel students at Salisbury University have enough time for
community volunteering? • Do you think students know about opportunities for community volunteering? • Do you think students are encouraged to volunteer in the community? If yes, by whom? • What’s your opinion on this question: Are SU students learning about current political
issues and how they can be politically active and engaged? • Do you think students are encouraged to learn about political issues and to be politically
active? If yes, by whom? • How can more interest in community volunteering and learning about political issues be
created among students?

38
Appendix C – Survey Topline Results April - May 2010 Total N = 861 Section A. Expressing Your Views Q-1. Contacted or visited a public official—at any level of government—to ask for assistance or to express your opinion? (N=858)
1. No, I have not done it.............................................................................................73.4% 2. Yes, have done it, but not in the last 12 months ....................................................13.5% 3. Yes, have done it, and within last 12 months .......................................................13.1%
Q-2. Contacted a newspaper or magazine to express your opinion on a political or social issue? (N=858)
1. No, I have not done it.............................................................................................84.6% 2. Yes, have done it, but not in the last 12 months ....................................................9.8% 3. Yes, have done it, and within last 12 months ........................................................5.6%
Q-3. Called in to a radio or television talk show to express your opinion on a political issue, even if you did not get on the air? (N=860)
1. No, I have not done it.............................................................................................84.0% 2. Yes, have done it, but not in the last 12 months ....................................................8.6% 3. Yes, have done it, and within last 12 months ........................................................7.4%
Q-4. Posted a message or comment on a blog to express your opinion on a political or social issue? (N=858)
1. No, I have not done it.............................................................................................51.0% 2. Yes, have done it, but not in the last 12 months ....................................................14.0% 3. Yes, have done it, and within last 12 months ........................................................35.0%
Q-5. Taken part in a protest, march, or demonstration? (N=857)
1. No, I have not done it.............................................................................................70.8% 2. Yes, have done it, but not in the last 12 months ....................................................19.8% 3. Yes, have done it, and within last 12 months ........................................................9.3%
Q-6. Signed an e-mail petition about a political or social issue? (N=857)
1. No, I have not done it.............................................................................................49.9% 2. Yes, have done it, but not in the last 12 months ....................................................22.2% 3. Yes, have done it, and within last 12 months ........................................................27.9%
Q-7. And have you ever signed a written petition about a political or social issue? (N=858)
1. No, I have not done it.............................................................................................41.3% 2. Yes, have done it, but not in the last 12 months ....................................................35.1% 3. Yes, have done it, and within last 12 months ........................................................23.7%

39
Q-8. Purchased a certain product or service because you like the social or political values of the company that produces or provides it? (N=859)
1. No, I have not done it.............................................................................................46.1% 2. Yes, have done it, but not in the last 12 months ....................................................15.7% 3. Yes, have done it, and within last 12 months ........................................................38.2%
Q-9. NOT purchased a good or service because of the conditions under which the product is made, or because you dislike the conduct of the company? (N=860)
1. No, I have not done it.............................................................................................37.0% 2. Yes, have done it, but not in the last 12 months ....................................................17.4% 3. Yes, have done it, and within last 12 months ........................................................45.6%
Q-10. Worked or volunteered in a political campaign to help elect a candidate? (N=861)
1. No, I have not done it.............................................................................................82.5% 2. Yes, have done it, but not in the last 12 months ....................................................11.4% 3. Yes, have done it, and within last 12 months ........................................................6.2%
Q-11. Attended a meeting of city council or neighborhood association? (N=857)
1. No, I have not done it.............................................................................................69.8% 2. Yes, have done it, but not in the last 12 months ....................................................20.3% 3. Yes, have done it, and within last 12 months ........................................................9.9%
Q-12. Attended an on-campus speaker at SU who discussed domestic or international issues? (N=860)
1. No, I have not done it.............................................................................................48.3% 2. Yes, have done it, but not in the last 12 months ....................................................14.0% 3. Yes, have done it, and within last 12 months ........................................................37.8%
Q-13. Talked about politics or social issues with your friends? (N=860)
1. No, I have not done it.............................................................................................7.2% 2. Yes, have done it, but not in the last 12 months ....................................................7.3% 3. Yes, have done it, and within last 12 months ........................................................85.5%
Q-14. Have you ever created a profile for a social networking site such as Facebook, or Myspace? (N=859)
1. Yes .........................................................................................................................87.2% 2. No...........................................................................................................................12.8%
Q-15. How often do you visit social networking websites? (N=746)
1. Several times a day ................................................................................................64.6% 2. Once a day..............................................................................................................20.5% 3. 3 to 5 times a week.................................................................................................7.0% 4. 1 to 2 times a week.................................................................................................3.6% 5. Every few weeks ....................................................................................................1.6% 6. Less often ...............................................................................................................2.7%
Q-16. Are you a member and/or belong to a group on your networking site that takes a stand on a particular political or social issue or cause? (N=749) 1. Yes .....................................................................................................................................42.2% 2. No.......................................................................................................................................43.1% 3. Don’t know ........................................................................................................................14.7%

40
Q-17. (Open-ended) What type of political or social issue groups do you belong to? Please enter the names of up to four of your favorite groups.
Contact Dr. Basehart or Dr. Whitehead for complete set of responses. Q-18. In what way(s) do you actively participate in these groups? (Please check all that apply.)
1. Blogging.................................................................................................................9.8% 2. Donating money.....................................................................................................7.2% 3. Reading others’ posts.............................................................................................27.1% 4. Posting own comments ..........................................................................................17.9% 5. Inviting others to join.............................................................................................18.2% 6. Researching the issue.............................................................................................19.8%
Section B. Volunteering and Community Service Q-19. Have you participated in volunteer or community service that was not part of a class or course requirement? (N=859)
1. No...........................................................................................................................9.8% 2. Yes, I have participated, but not in past 12 months ...............................................31.4% 3. Yes, I have participated, and within past 12 months .............................................58.8%
Q. 20. How often did you volunteer? (N=773)
1. Weekly ...................................................................................................................18.0% 2. A few times a month ..............................................................................................22.5% 3. About once a month ...............................................................................................20.6% 4. Less than once a month..........................................................................................38.9%
Q-21. What type of volunteer activity was this? (Check all that apply?)
1. General labor/transportation ..................................................................................31.8% 2. Fundraising ............................................................................................................21.1% 3. Food related ...........................................................................................................14.0% 4. Tutor/teach .............................................................................................................12.3% 5. Mentor....................................................................................................................10.2% 6. Other ......................................................................................................................10.6%
Q-22. Did you stay involved in this volunteer activity longer than you expected to or were required to? (N=772)
1. Yes .........................................................................................................................63.5% 2. No...........................................................................................................................36.5%
Q.23. Was there a group, club or organization that sponsored this activity? (N=772)
1. Yes .........................................................................................................................71.0% 2. No...........................................................................................................................29.0%
Q-24. (Open-ended) What was the name of group, club, or organization that sponsored this activity?
Contact Dr. Basehart or Dr. Whitehead for complete set of responses.

41
Q.-25. Have you participated in volunteer work or community service that was part of a class or course requirement? (N=852)
1. No, I have not participated.....................................................................................37.7% 2. Yes, I have participated, but not in the past 12 months .........................................33.3% 3. Yes, I have participated, and within the past 12 months .......................................29.0%
Q-26. How often did you participate in this activity? (N=527)
1. Weekly ...................................................................................................................25.0% 2. A few times a month ..............................................................................................22.2% 3. About once a month ...............................................................................................16.3% 4. Less than once a month..........................................................................................36.4%
Q-27. What type of volunteer activity was this? (Check all that apply.) 1. General labor/transportation ..................................................................................20.9% 2. Fundraising ............................................................................................................21.9% 3. Food related ...........................................................................................................14.7% 4. Tutor/teach .............................................................................................................17.8% 5. Mentor....................................................................................................................13.1% 6. Other ......................................................................................................................10.6%
Q-28. Did you stay involved in this volunteer activity longer than you expected to or were required to? (N=527)
1. Yes .........................................................................................................................34.2% 2. No...........................................................................................................................65.8%
Q-29. Generally, do you feel like you have enough time to be involved in volunteer work or community service? (N= 838)
1. Yes, have enough time...........................................................................................44.4% 2. No, do not have enough time .................................................................................55.6%
Q-30. Generally, do you feel you are involved in volunteer work or community service as much as you would like to be? (N=839)
1. Yes, I’m involved as much as I want.....................................................................22.6% 2. No, I’d like to be involved more............................................................................77.4%
Section C. News about Current Issues and Politics How often do you… Q-31. Read the newspaper (N=840)
1. Everyday ...............................................................................................................5.2% 2. Several times a week..............................................................................................16.4% 3. Several times a month............................................................................................44.3% 4. Never......................................................................................................................34.0%
Q-32. Watch the news on TV (N=840)
1. Everyday ...............................................................................................................17.3% 2. Several times a week..............................................................................................31.7% 3. Several times a month............................................................................................37.6% 4. Never......................................................................................................................13.5%

42
Q-33. Read the news on-line (N=841) 1. Everyday ...............................................................................................................30.6% 2. Several times a week..............................................................................................31.2% 3. Several times a month............................................................................................25.9% 4. Never......................................................................................................................12.4%
Q-34. Please enter the names of your favorite websites to read the news online. Please enter the names of up to four of your favorite groups.
Contact Dr. Basehart or Dr. Whitehead for complete set of responses. Q-35. Listen to the news on the radio (N=835)
1. Everyday ...............................................................................................................12.2% 2. Several times a week..............................................................................................18.6% 3. Several times a month............................................................................................32.1% 4. Never......................................................................................................................37.1%
Q-36. Personally read “blogs” on the Internet that deal with political and social issues (N=833)
1. Everyday ...............................................................................................................3.7% 2. Several times a week..............................................................................................8.3% 3. Several times a month............................................................................................27.1% 4. Never......................................................................................................................60.9%
Q-37. (Open-ended) Please tell is your favorite source for news.
Contact Dr. Basehart or Dr. Whitehead for complete set of responses. Section D. Voting Q-38. For a number of reasons many college students are not registered to vote. How about you? Are you registered to vote? (N=836)
1. Yes .........................................................................................................................75.5% 2. No...........................................................................................................................23.4% 3. Don’t know ............................................................................................................1.1%
Q-39. Which of these statements best describes your reason for not registering to vote? (N=195)
1. I’m not registered because I’m not a U.S. citizen..................................................6.2% 2. I’m not registered because I don’t believe my vote will make any difference ......11.8% 3. I would register to vote if forms and assistance were more readily available .......29.2% 4. Other, please specify..............................................................................................52.8%
Q-40. Assuming you might be interested in registering to vote, which one of the following would provide you with the best opportunity to register? (N=190)
1. Brief discussion about voting and assistance in registration by trained student volunteers at the start of one of you classes...............................................................27.4% 2. Tables at various locations on campus such as the Commons with trained student volunteers ..................................................................................................................50.0% 3. Dorm floor meeting with trained student volunteers .............................................19.5% 4. Other, please specify..............................................................................................3.2%

43
Q-41. As a registered voter, which of the following statements best describes you? (N=627) 1. I am registered to vote at the address I lived at before attending SU and have not changed ................................................................................................................87.9% 2. I was registered to vote at the address I lived at before attending SU, but now am registered at my school address .................................................................................7.8% 3. I am registered at my school address and was never registered at the address I lived at before attending SU ....................................................................................4.3%
Q-42. Did you register to vote at the Motor Vehicle Administration at the same time you Obtained your driver’s license? (N=629)
1. Yes .........................................................................................................................27.7% 2. No...........................................................................................................................72.3%
Q-43. Which of the following statements best describes your voting in the last Presidential election held on November 4, 2008? (N=630)
1. I voted at a polling place........................................................................................37.3% 2. I voted by absentee ballot ......................................................................................36.0% 3. I planned on voting but wasn’t able to...................................................................6.8% 4. I did not vote in this election..................................................................................18.6% 5. I went to the polling place but wasn’t able to ........................................................1.3%
Q-44. How likely is it that you will vote in the November 2010 elections for Congress And state offices such as governor and state legislator? (N=630)
1. Definitely will be voting ........................................................................................40.5% 2. Probably will be voting..........................................................................................22.1% 3. 50/50 ......................................................................................................................21.9% 4. Probably won’t be voting.......................................................................................13.3% 5. Definitely won’t be voting .....................................................................................2.2%
Section H. Demographics Q-45. What state did you live in before attending SU? (N=832)
1. Maryland................................................................................................................85.0% 2. Delaware ................................................................................................................3.1% 3. New Jersey .............................................................................................................4.8% 4. New York...............................................................................................................1.9% 5. Pennsylvania ..........................................................................................................2.4% 6. Virginia ..................................................................................................................0.8% 7. Other state. Please specify .....................................................................................1.9%
Q-46. In which year of college are you? (N=832)
1. First year student/Freshman...................................................................................22.4% 2. Second year student/Sophomore............................................................................20.0% 3. Third year student/Junior .......................................................................................27.9% 4. Fourth year student/Senior.....................................................................................23.9% 5. Fifth year student or higher....................................................................................5.9%

44
Q-47. Are you a full-time or part-time student? (N=832) 1. Full-time student ....................................................................................................97.0% 2. Part-time student ....................................................................................................3.0%
Q-48. Do you live in an on-campus residence hall or do you have off-campus housing? (N=831)
1. On-campus residence hall ......................................................................................33.3% 2. Off-campus ............................................................................................................66.7%
Q-49. Do you consider yourself to be Hispanic or Latino? (N=826)
1. Yes .........................................................................................................................3.1% 2. No...........................................................................................................................96.9%
Q-50. Race (N=825)
1. White......................................................................................................................81.8% 2. Black or African America......................................................................................9.6% 3. Asian or Pacific Islander........................................................................................2.7% 4. Mixed racial background .......................................................................................2.9% 5.Native American or Alaskan Native .......................................................................0.8% 6. Other race. Please specify ......................................................................................2.2%
Q-51. Age (N=820)
1. 17............................................................................................................................0.1% 2. 18............................................................................................................................12.8% 3. 19............................................................................................................................20.0% 4. 20............................................................................................................................20.0% 5. 21............................................................................................................................22.0% 6. 22............................................................................................................................10.5% 7. 23............................................................................................................................3.5% 8. 24............................................................................................................................1.3% 9. 25 and over.............................................................................................................9.8%
Q-52. What is your major? Please check no more than three majors. (N=825)
Contact Dr. Basehart or Dr. Whitehead for complete set of responses. Percentages below are for recode of first major by school. 1. Fulton .....................................................................................................................37.1% 2. Henson ...................................................................................................................23.8% 3. Perdue ....................................................................................................................19.4% 4. Seidel......................................................................................................................19.8%
Q-53. Gender (N=823)
1. Female....................................................................................................................74.6% 2. Male .......................................................................................................................25.4% 3. Transgender............................................................................................................0.0%