pace analytical validating lab data while navigating
TRANSCRIPT

Va l i d a t i n g L a b D a t a W h i l e N a v i g a t i n g Q u a l i f i e r s
P A C E A N A L Y T I C A L
J u d i t h M o r g a n , M SV P, C h i e f C o m p l i a n c e a n d T r a i n i n g O f f i c e r

Va l i d a t i n g L a b D a t a W h i l e N a v i g a t i n g Q u a l i f i e r sGOAL1. Trace a sample journey and re la te to lab resu l ts ,
assoc ia ted QC, and necessary documenta t ion requ i red to assess usab i l i ty o f da ta in accordance wi th the methods, programs, and TNI /NELAP Standard .
2 . To unders tand the leve ls o f scru t iny app l ied to ensure tha t the data suppor ts the in tended programs and dec is ions . D i f fe rence between Ver i f ica t ion and Va l ida t ion .
3 . D iscuss how qua l i f ie rs f i t in to the process and they impact the data . TCEQ MAY 2019

Field Collection
Submitted to & Rec’d at the Lab
LOG IN Process –
NCF, Notif, etc.
Transport samples to Lab(s)
Sample Prep
where req’d
Samples are
Analyzed
Data is review & Approved
Final Report
Client Review of
Report
Results Submitted
for Compliance
A Sample’sJourney

Lega l De fens ib i l i t y
1 . P e r f e c t ?2 . D a t a o f K n o w n a n d d o c u m e n t e d
Q u a l i t y ?
TCEQ MAY 2019
”The purpose of analytical data is to provide verifiable support information for use in
scientific decisions “
TCEQ MAY 2019
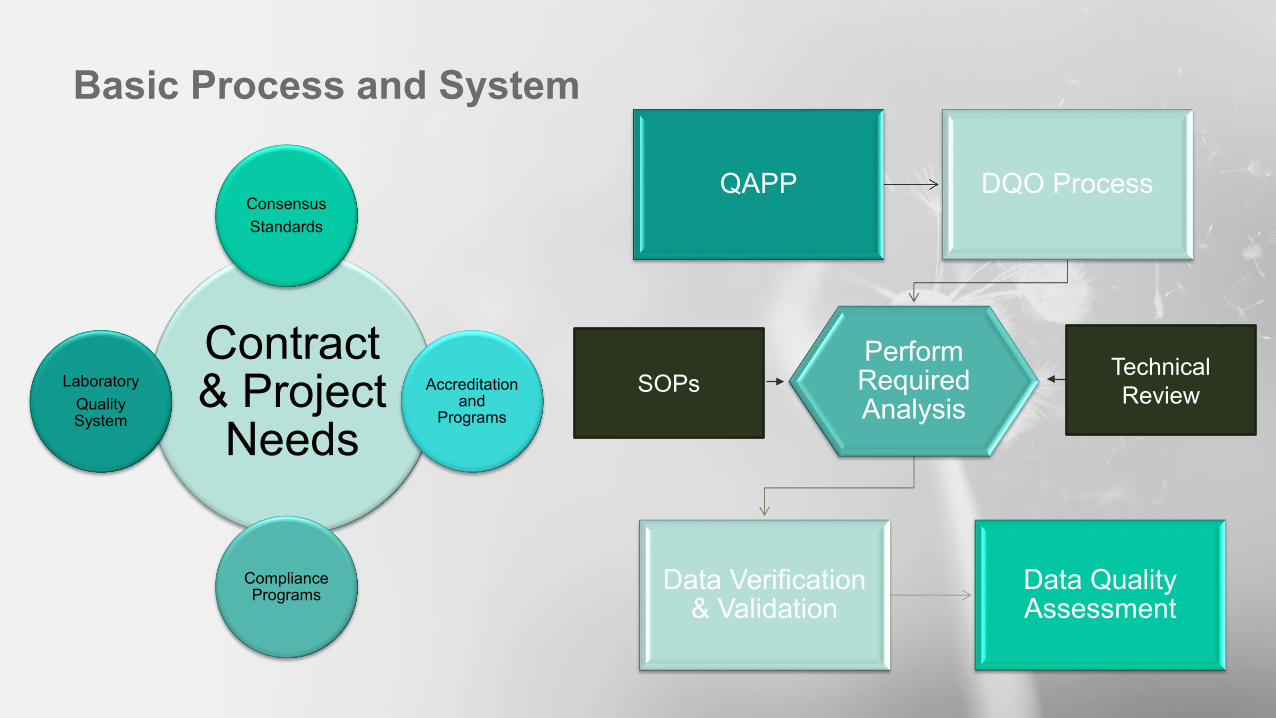
Contract & Project
Needs
ConsensusStandards
Accreditation and
Programs
Compliance Programs
LaboratoryQuality System
Basic Process and System
QAPP DQO Process
Perform Required Analysis
Data Verification & Validation
Data Quality Assessment
Technical ReviewSOPs
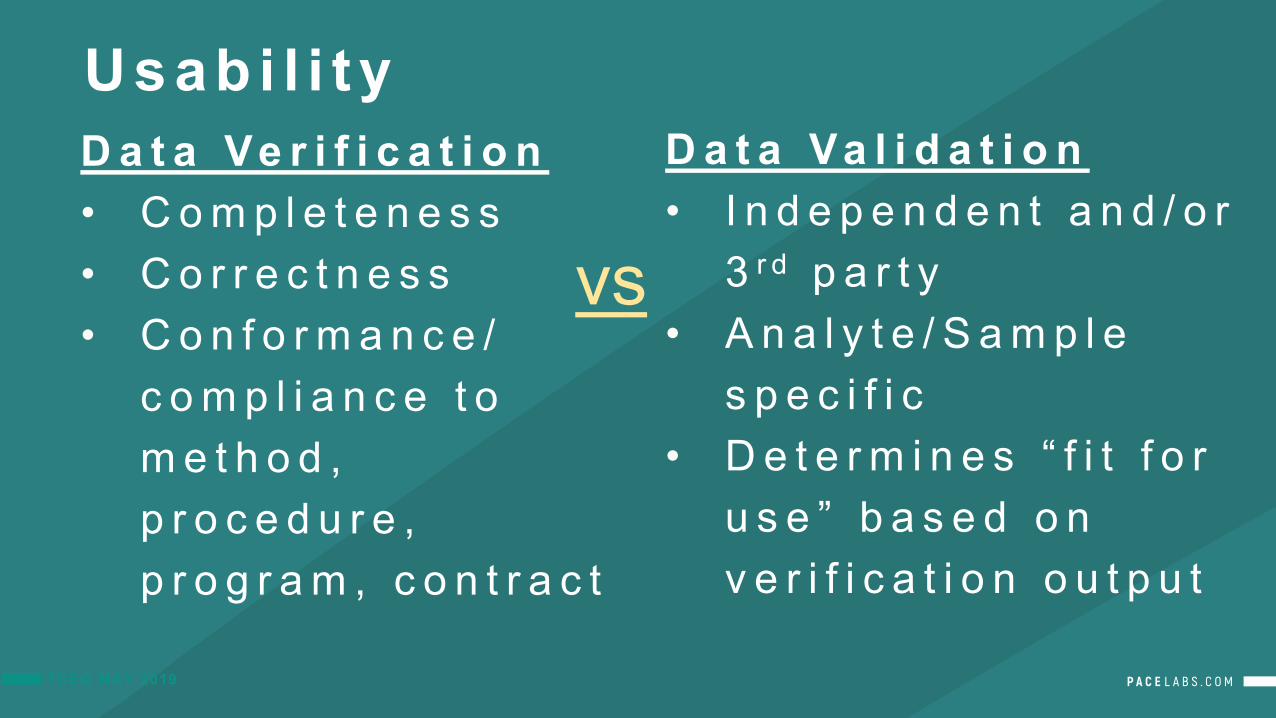
Usab i l i t yD a t a Ve r i f i c a t i o n• C o m p l e t e n e s s• C o r r e c t n e s s• C o n f o r m a n c e /
c o m p l i a n c e t o m e t h o d , p r o c e d u r e , p r o g r a m , c o n t r a c t
TCEQ MAY 2019
D a t a Va l i d a t i o n• I n d e p e n d e n t a n d / o r
3 r d p a r t y • A n a l y t e / S a m p l e
s p e c i f i c• D e t e r m i n e s “ f i t f o r
u s e ” b a s e d o n v e r i f i c a t i o n o u t p u t
vs
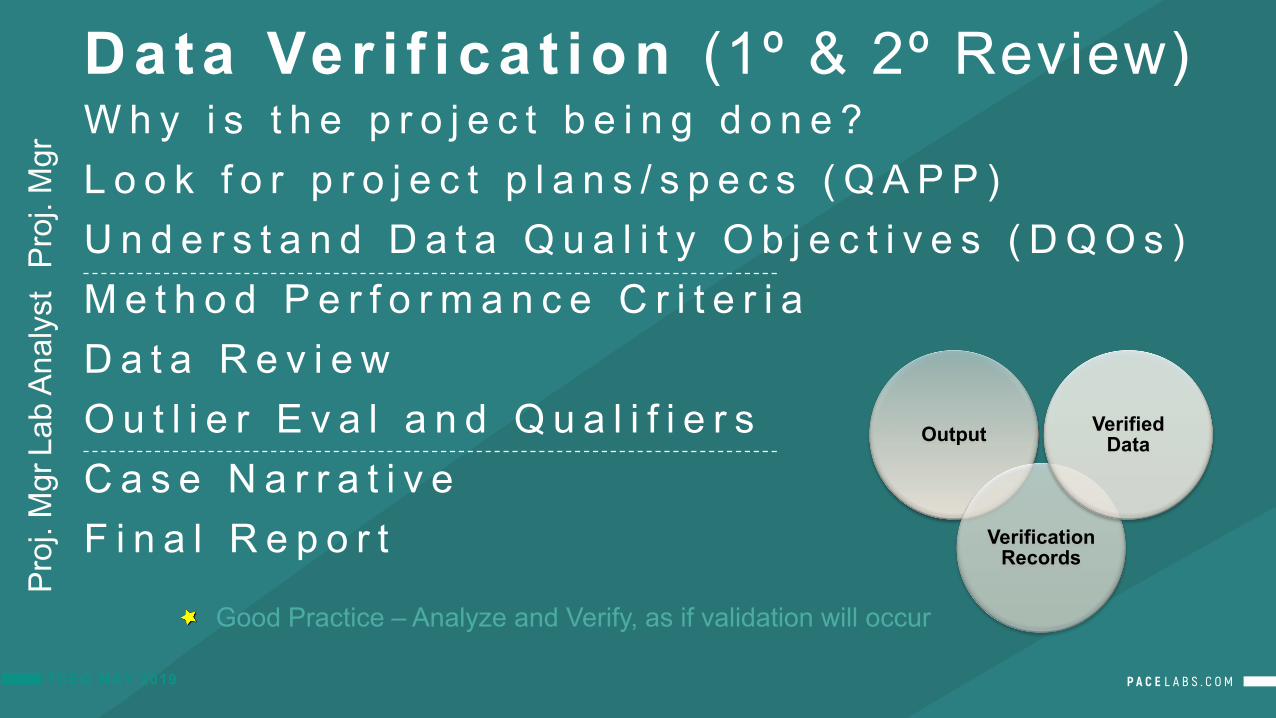
Data Ver i f i ca t ion (1º & 2º Review)W h y i s t h e p r o j e c t b e i n g d o n e ?L o o k f o r p r o j e c t p l a n s / s p e c s ( Q A P P )U n d e r s t a n d D a t a Q u a l i t y O b j e c t i v e s ( D Q O s )M e t h o d P e r f o r m a n c e C r i t e r i aD a t a R e v i e wO u t l i e r E v a l a n d Q u a l i f i e r sC a s e N a r r a t i v eF i n a l R e p o r t
TCEQ MAY 2019
Proj
. Mgr
Proj
. Mgr
Lab
Anal
yst
Output
Verification Records
Verified Data
Good Practice – Analyze and Verify, as if validation will occur

Data Va l ida t ionWhy is the pro ject be ing done? What are data user needs?Look for speci f ics in pro ject p lans /specs (QAPP)Understand Data Qual i ty Object ives (DQOs)F i e l d D a t a• E v a l u a t e t h e f i e l d r e c o r d s f o r c o n s i s t e n c y• R e v i e w Q C i n f o r m a t i o n• S u m m a r i z e d e v i a t i o n s & d e t e r m i n e i m p a c t o n s a m p l e a n a l y s i s & d a t a q u a l i t y
L a b D a t aR e v i e w Ve r i f i c a t i o n D a t a :• C o n f i r m m e t h o d , p r o c e d u r e , a n d c o n t r a c t r e q u i r e d Q C c o m p l i a n c e / n o n -
c o m p l i a n c e• C o m p a r e s a m p l e r e s u l t s f o r t h e e n t i r e d a t a s e t , i n c l u d i n g l a b q u a l i f i e r s• S u m m a r i z e d a t a , Q C i s s u e s & e v a l u a t e t h e i m p a c t o n o v e r a l l d a t a q u a l i t y• A s s i g n / r e m o v e a d d i t i o n a l d a t a q u a l i f i c a t i o n c o d e s a s n e c e s s a r y• P r e p a r e a n a l y t i c a l d a t a v a l i d a t i o n r e p o r t

TCEQ MAY 2019
Most Used Qualifiers
TCEQ MAY 2019
B Analyte found in sample and associated blank U The analyte was analyzed for, but was not detected above the reported sample quantitation limit.J The analyte was positively identified; the associated numerical value is the approximate concentration of the analyte in the sample.N The analysis indicates the present of an analyte for which there is presumptive evidence to make a “tentative identification.”NJ The analysis indicates the presence of an analyte that has been “tentatively identified” and the associated numerical value represents its approximate concentration.UJ The analyte was not detected above the reported sample quantitation limit. However, the reported quantitation limit is approximate and may or may not represent the actual limit of quantitation necessary to accurately and precisely measure the analyte in the sample.R The sample results are rejected due to serious deficiencies in the ability to analyze the sample and meet quality control criteria. The presence or absence of the analyte cannot be verified.”
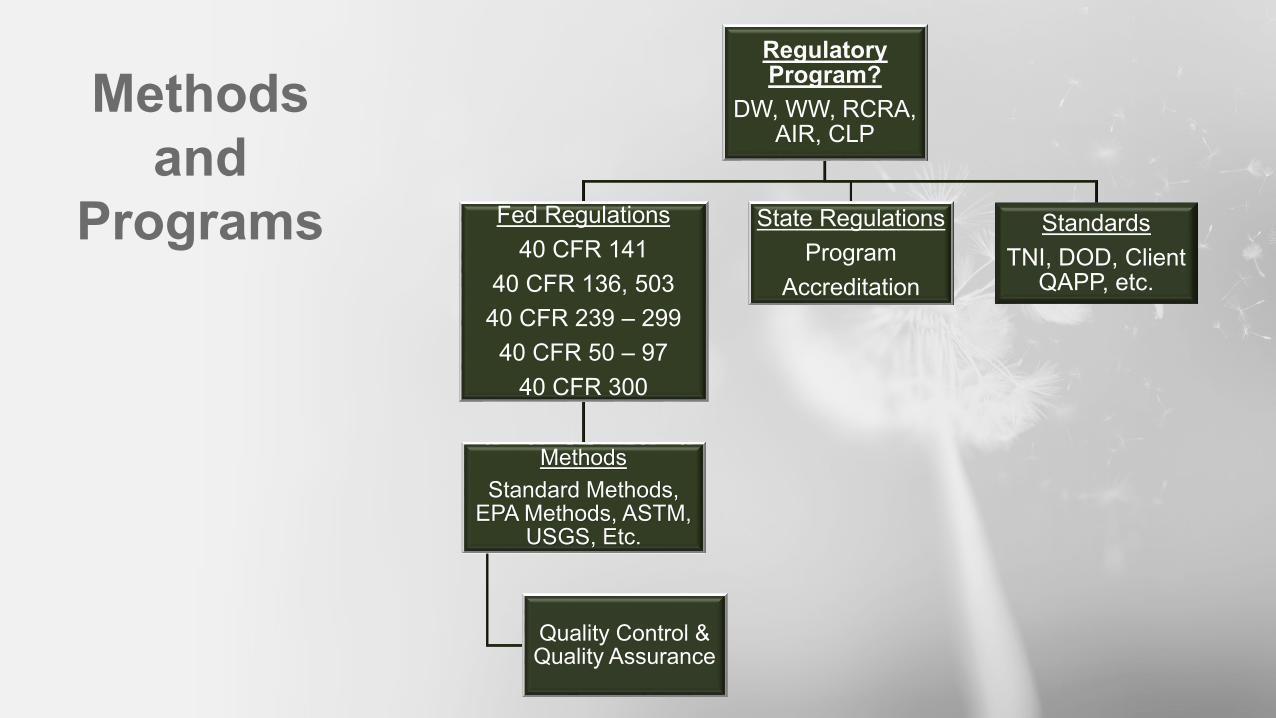
Methods and
Programs
Regulatory Program?
DW, WW, RCRA, AIR, CLP
Fed Regulations40 CFR 141
40 CFR 136, 50340 CFR 239 – 299 40 CFR 50 – 97
40 CFR 300
MethodsStandard Methods,
EPA Methods, ASTM, USGS, Etc.
Quality Control & Quality Assurance
State RegulationsProgram
Accreditation
StandardsTNI, DOD, Client
QAPP, etc.
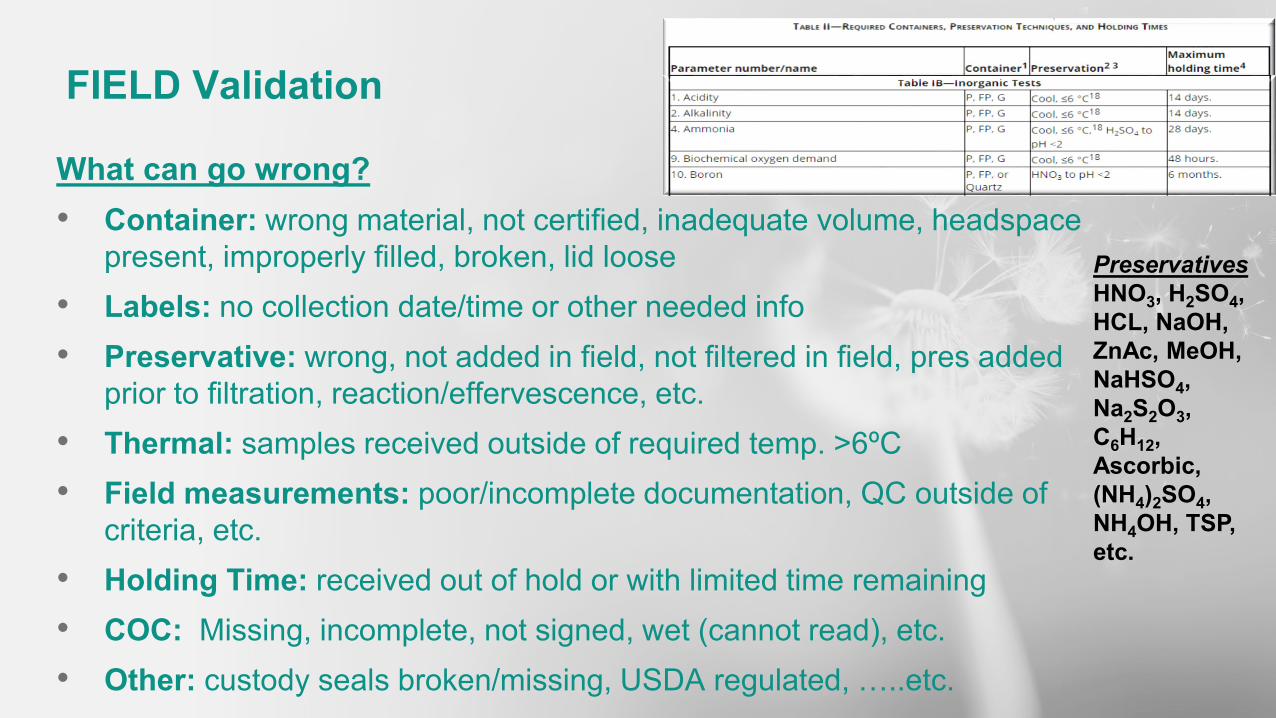
What can go wrong?• Container: wrong material, not certified, inadequate volume, headspace
present, improperly filled, broken, lid loose• Labels: no collection date/time or other needed info• Preservative: wrong, not added in field, not filtered in field, pres added
prior to filtration, reaction/effervescence, etc.• Thermal: samples received outside of required temp. >6ºC• Field measurements: poor/incomplete documentation, QC outside of
criteria, etc. • Holding Time: received out of hold or with limited time remaining• COC: Missing, incomplete, not signed, wet (cannot read), etc.• Other: custody seals broken/missing, USDA regulated, …..etc.
FIELD Validation
PreservativesHNO3, H2SO4, HCL, NaOH, ZnAc, MeOH, NaHSO4, Na2S2O3, C6H12, Ascorbic, (NH4)2SO4, NH4OH, TSP, etc.

Metals/PCB Project• Samples are received for PCB (IL Amber G) & Metals (250mL HDPE)
Metals bottle is empty due to a broken lid
Samples are out of temp
Example 1: When Bad Things Happen to Good Samples
Now What?• Document the temp
exceedance - NCF• Document the breakage
- NCF• Finish checking in the
remaining samples• Contact the customer
Possibilities?• PCB samples? Out of
temp – customer decision• Preservation – can
preserve and hold• Glass? – Yes, except B• Separate sample for Hg?• Total? Dissolved? Filter?
Qualifier?• Wrong Container? • Wrong Preservative?• Temperature?
NoNoYes for PCBs
Documentation• NCF – Broken container, metals in glass, out of temp, note that B is not a target• Date/time – Sample preserved in lab with HNO3 (hold for 24 hr), Filter for Dissolved Metals before pres., ….• Client instruction - Analyze PCB out of temp, use extra PCB container for metals, ….other info as needed.

Chain of Custody

• Text
• Text
• Text
N o n -C o n f o r m a n c e F o r m
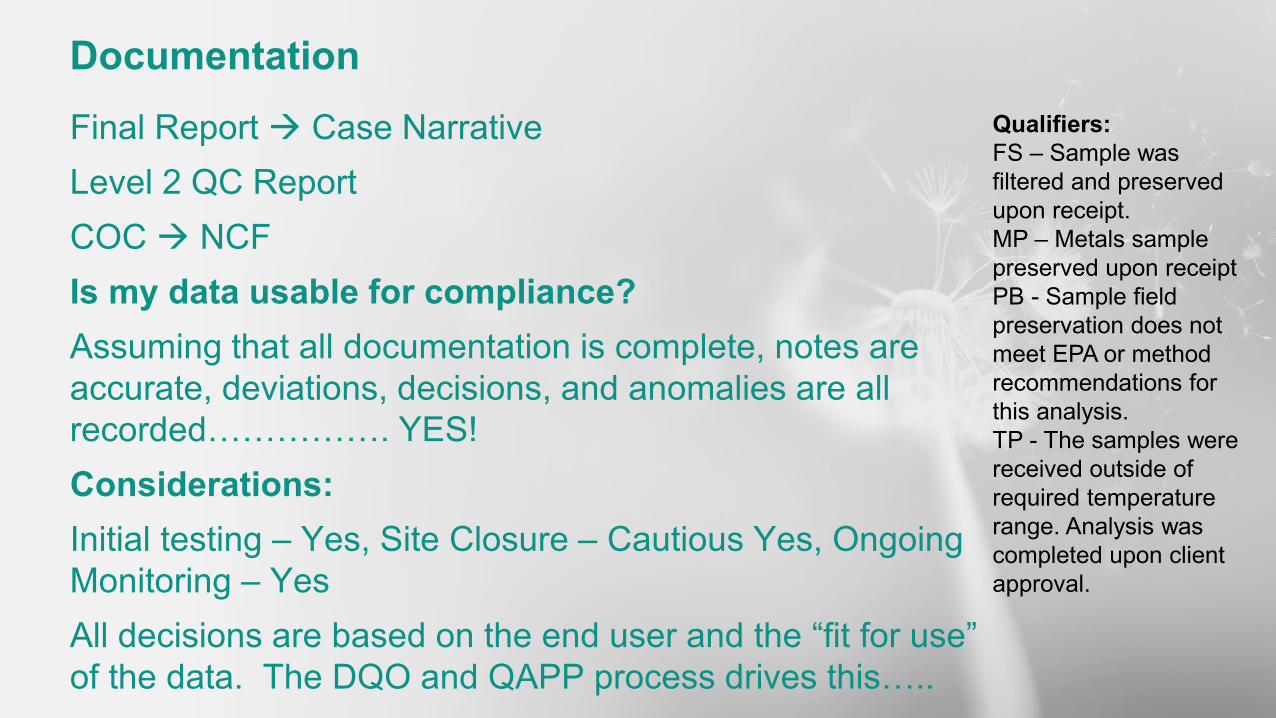
Final Report Case NarrativeLevel 2 QC ReportCOC NCFIs my data usable for compliance?Assuming that all documentation is complete, notes are accurate, deviations, decisions, and anomalies are all recorded……………. YES!Considerations:Initial testing – Yes, Site Closure – Cautious Yes, Ongoing Monitoring – YesAll decisions are based on the end user and the “fit for use” of the data. The DQO and QAPP process drives this…..
DocumentationQualifiers:FS – Sample was filtered and preserved upon receipt.MP – Metals sample preserved upon receiptPB - Sample field preservation does not meet EPA or method recommendations for this analysis.TP - The samples were received outside of required temperature range. Analysis was completed upon client approval.

Metals, VOA, SVOA, GRO, DRO, ORO, Cr+6, CN• Samples are received with no apparent issues.
Example 2: When Bad Samples Happen to Good Collection
Samples – Nasty Soil Lab Qualifiers (24 Total)1M - The associated compound was outside of 20% for the associated continuing calibration but within 40% of the true value.2d - The internal standard response was below the laboratory acceptance limits and not confirmed by reanalysis. The results reported are from the most QC compliant analysis and may be biased high.B - Analyte was detected in the associated method blank.C0 - Result confirmed by second analysis.D3 - Sample was diluted due to the presence of high levels of non-target analytes or other matrix interference.D4 - Sample was diluted due to the presence of high levels of target analytesE - Analyte concentration exceeded the calibration range. The reported result is estimated.G+ - Late peaks present outside the GRO window.H2 - Extraction or preparation was conducted outside of the recognized method holding time.
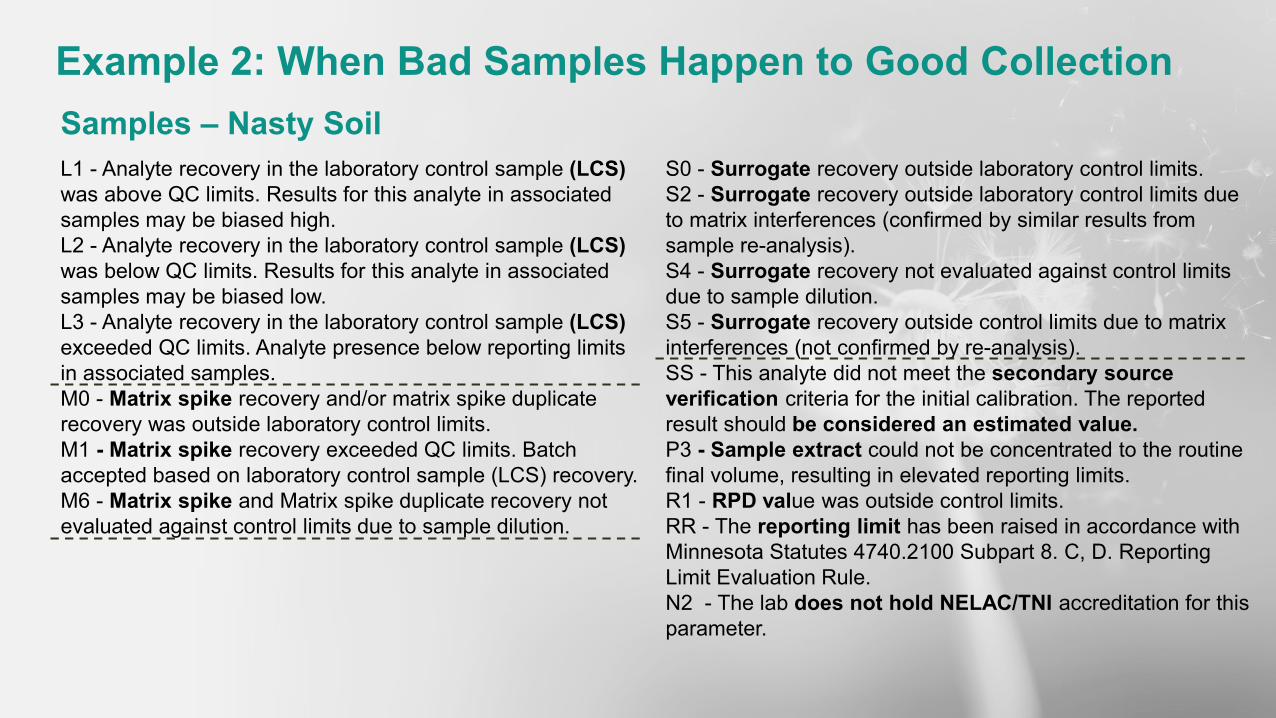
Example 2: When Bad Samples Happen to Good CollectionSamples – Nasty Soil L1 - Analyte recovery in the laboratory control sample (LCS) was above QC limits. Results for this analyte in associatedsamples may be biased high.L2 - Analyte recovery in the laboratory control sample (LCS) was below QC limits. Results for this analyte in associatedsamples may be biased low.L3 - Analyte recovery in the laboratory control sample (LCS) exceeded QC limits. Analyte presence below reporting limits in associated samples.M0 - Matrix spike recovery and/or matrix spike duplicate recovery was outside laboratory control limits.M1 - Matrix spike recovery exceeded QC limits. Batch accepted based on laboratory control sample (LCS) recovery.M6 - Matrix spike and Matrix spike duplicate recovery not evaluated against control limits due to sample dilution.
S0 - Surrogate recovery outside laboratory control limits.S2 - Surrogate recovery outside laboratory control limits due to matrix interferences (confirmed by similar results from sample re-analysis).S4 - Surrogate recovery not evaluated against control limits due to sample dilution.S5 - Surrogate recovery outside control limits due to matrix interferences (not confirmed by re-analysis).SS - This analyte did not meet the secondary source verification criteria for the initial calibration. The reported result should be considered an estimated value.P3 - Sample extract could not be concentrated to the routine final volume, resulting in elevated reporting limits.R1 - RPD value was outside control limits.RR - The reporting limit has been raised in accordance with Minnesota Statutes 4740.2100 Subpart 8. C, D. Reporting Limit Evaluation Rule.N2 - The lab does not hold NELAC/TNI accreditation for this parameter.

Where to start…….

• Final Report 1. Case/Project Narrative
2. COC & NCF (where applicable)
3. Sample Summary
4. Summary of Detection
5. Quality Control Summary
6. Raw Data – Where requested
Validation

Qua l i t y Per fo rmance Ind ica tors
TCEQ MAY 2019
Al lows fo r p rocess o f e l im ina t ion……
Control Type Indicator Possibilities
Blanks (Lab, Equipment, Trip, and Field)
Contamination (Process or collection)
Instrument or Sampling Bias
Matrix Spike Sample Interference Failures? High/Low bias? Non-homogenous?
Laboratory Control Sample Method and Instrument High/low bias? Contamination? Other?
Surrogate Sample Issue and Method Process
High/low bias? Contamination? Interferences? Technique? Other?
Internal Standard Sample Issue and Instrument Performance
High/low bias? Contamination? Interferences? Other?

TCEQ MAY 2019
Quality Control: Accuracy & Precision
TCEQ MAY 2019
Accuracy refers to how close measured values are to the actual known value.
Precision refers to how close a measured set of values are to one another.
TCEQ MAY 2019
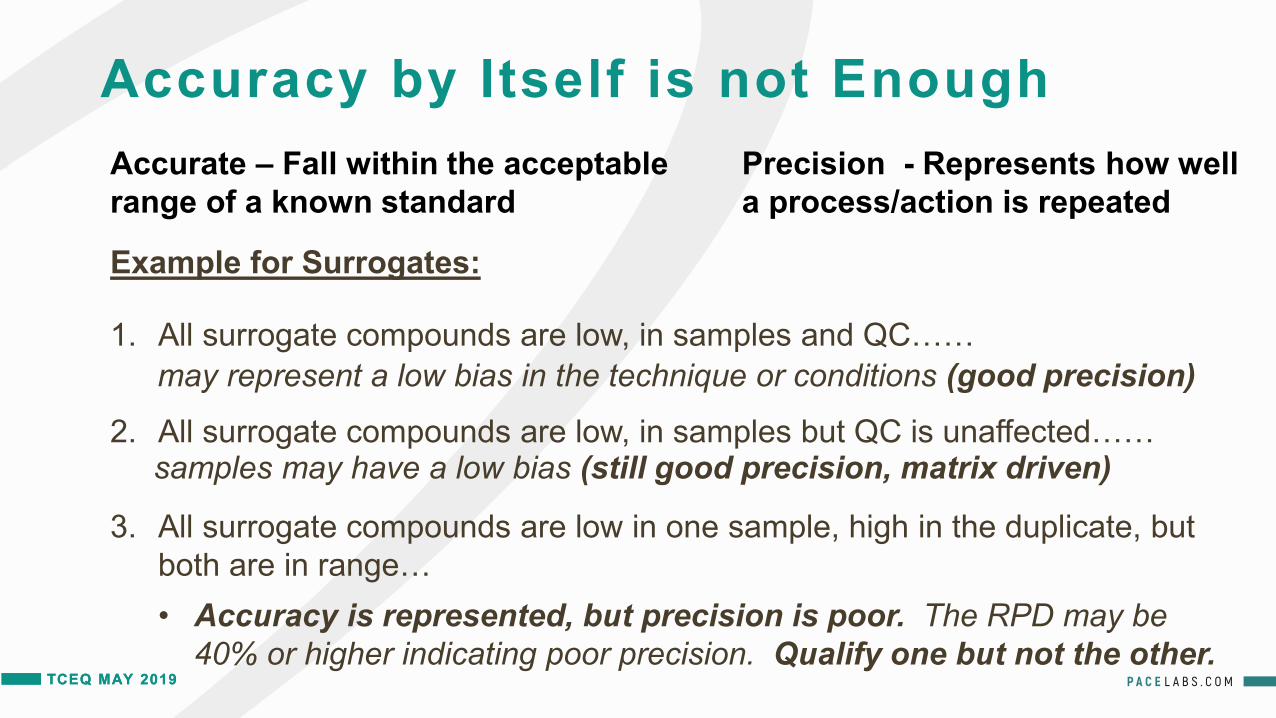
Accuracy by Itself is not Enough
TCEQ MAY 2019
Accurate – Fall within the acceptable range of a known standard
Precision - Represents how well a process/action is repeated
1. All surrogate compounds are low, in samples and QC……
2. All surrogate compounds are low, in samples but QC is unaffected……
may represent a low bias in the technique or conditions (good precision)
Example for Surrogates:
3. All surrogate compounds are low in one sample, high in the duplicate, but both are in range…
samples may have a low bias (still good precision, matrix driven)
• Accuracy is represented, but precision is poor. The RPD may be 40% or higher indicating poor precision. Qualify one but not the other.

TCEQ MAY 2019
A Look at the Results- Controls
TCEQ MAY 2019
LCS – Clean matrix and true indicator of method performance and technique.
Qualifiers:LABORATORY CONTROL (LCS) – Reagent/blank water to which known quantities of target analytes are added in the laboratory followed by processing exactly like a sample to determine that the method is in control.L1 - Analyte recovery in the laboratory control sample (LCS) was above QC limits. Results for this analyte in associated samples may be biased high.L2 - Analyte recovery in the laboratory control sample (LCS) was below QC limits. Results for this analyte in associated samples may be biased low.L3 - Analyte recovery in the laboratory control sample (LCS) was above QC limits.Analyte presence below reporting limits in associated samples.MATRIX SPIKE/DUP (MS/MSD) - An aliquot of client sample spiked with a known concentration of target analyte(s). The spiking occurs prior to sample preparation and analysis and the result represents the bias of a method in a given sample matrix.M0 - Matrix spike recovery and/or matrix spike duplicate recovery was outside laboratory control limits.M1 - Matrix spike recovery exceeded QC limits. Batch accepted based on laboratory control sample (LCS) recovery.M6 - Matrix spike and Matrix spike duplicate recovery not evaluated against control limits due to sample dilution.
MS/MSD – Specific to “like” project samples. Qualifier should be limited to directly associated samples.

TCEQ MAY 2019
A Look at the Results-Reporting Limits
TCEQ MAY 2019
Reporting Limits – Does the method support the requirements needed?
Dilutions – Does the level of contamination require dilution?
Examples:High Targets • Does the level of some targets obscure others? • Are high levels of non-targets obscuring targets? • Can dilution be performed and still allow for program compliance?MDLs• Where dilutions are necessary, are MDLs low enough to offer MDL/RL eval to
meet program limits?

TCEQ MAY 2019
A Look at the Results- Logic Check
TCEQ MAY 2019
Related Analyses: • Total vs Hexavalent Chromium• TKN vs Ammonia• TSS, TDS• Total vs Dissolved Metals• GRO vs BTEX Totals• Others?
Dilutions:• >10X – Do the results make
sense? • Are the surrogate or spike
recoveries high?
Historical:• Sample concentrations reflect historical numbers

Technical Validity
It is possible to have data that meets all the stated data quality objectives, but is not technically valid. • Non-EPA regulated projects can have minimal data quality requirements
that do not insure technical validityExamples include: Selection of a procedure which cannot “see” the compound(s) of
interest (gives a false negative result), is subject to too much positive interference (gives a false positive result).
Selection of a procedure that is not capable of the desired precision and accuracy, or can be easily misinterpreted by operating personnel of limited experience.
A laboratory can say that data are defensible and supply an excessive amount of supporting documentation as proof; when actually, both the documentation and technical validity of the data are inadequate.

TCEQ MAY 2019
Recap
TCEQ MAY 2019
Sample journey and relation to:• Lab results• Associated QC• Necessary documentation required to
assess usability of data in accordance with the methods, programs, and TNI/NELAP Standard.
Reviewed the levels of scrutiny needed to ensure that the data supports the intended programs and decisions.
Defined the difference between Verification and Validation.
Demonstrated how qualifiers fit into the process and they impact the data.

Quest ions?
Thank You!