pa office of developmental programs quality management …
TRANSCRIPT
PA Office of Developmental ProgramsQUALITY MANAGEMENT (QM) CERTIFICATION
Module 103: QM Planning In Action
The QM Planning In Actionmodule is the third and final, in a series of three within ODP’s QM Certification program. Working through this program, ODP staff and stakeholders will continue to expand their understanding of QM, recognize their important role as a member of the ODP team, and learn how to apply their QM skills to support and enhance the lives of individuals ODP serves.
1
6/15/2021Module 103: QM Planning In Action

This module is designed to acquaint the learner to:
Using ODP QM priorities in QM plans
Developing performance measures, goals and objectives
Putting QM plans into action
Monitoring QM plans
Reporting progress in achieving objectives
Objectives of Module 103
2
Module 103 objectives are to acquaint/reacquaint the learner to the following:
• Using QM priorities in QM plans
• Developing performance measures, goals and objectives
• Putting QM plans into action
• Monitoring QM plans
• Reporting progress in achieving objectives
2
6/15/2021Module 103: QM Planning In Action
USING ODP QM PRIORITIES IN QM PLANS
Efforts directly improve the lives of individuals being
served
Be prepared to show and discuss the person‐centered performance dataused to develop your QM Plan with ODP or AE reviewers
3
As mentioned in the previous module, you will need to prioritize your efforts to ensure that performance improvement activities are manageable and effective in enhancing services, supports, and outcomes for individuals, and to ensure that available resources are used wisely.
ODP expects entities will engage in efforts, or strategies, that are person‐centered and seek to directly improve the lives of individuals being served. Person‐centeredmeans focused on the person, what they can do, what their needs are, and what they want. Remember ‐ we want to see improvement projects that focus on positive results for the people we serve instead of projects that focus on whether or not a box was checked. Examples of person‐centered performance data/information that could be used to improve person‐centered "people" outcomes include, but are not limited to:
• ISAC recommendations ‐ related data and performance measures• Health and safety related data, including incident management• NCI/ IM4Q related data
*Note: Be prepared to show and discuss the person‐centered performance data used to develop your QM Plan with ODP or AE reviewers.
3
6/15/2021Module 103: QM Planning In Action
QM PLAN ‐ Part #1
Broad terms
Describes how entity operationalizes its mission/ vision
Identifies improvement priorities
Long‐term/Does not change for cycle/ fiscal year
ACTION PLAN ‐ Part #2
Detailed terms
Extension of QM plan/ Blueprint for how QM plan will be put into action
Does change throughout cycle/Working document
Serves as a status report
QM Plan vs. Action Plan
4
A QM Plan is not considered complete without both parts!
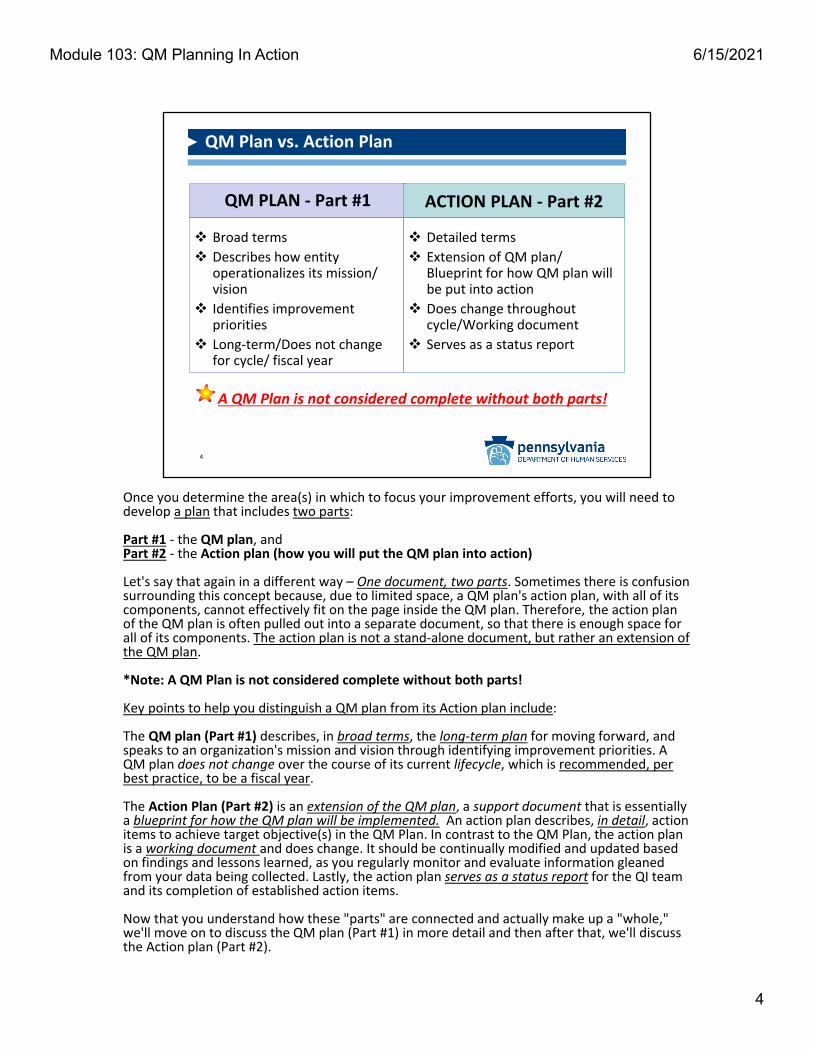
Once you determine the area(s) in which to focus your improvement efforts, you will need to develop a plan that includes two parts:
Part #1 ‐ the QM plan, andPart #2 ‐ the Action plan (how you will put the QM plan into action)
Let's say that again in a different way – One document, two parts. Sometimes there is confusion surrounding this concept because, due to limited space, a QM plan's action plan, with all of its components, cannot effectively fit on the page inside the QM plan. Therefore, the action plan of the QM plan is often pulled out into a separate document, so that there is enough space for all of its components. The action plan is not a stand‐alone document, but rather an extension of the QM plan.
*Note: A QM Plan is not considered complete without both parts!
Key points to help you distinguish a QM plan from its Action plan include:
The QM plan (Part #1) describes, in broad terms, the long‐term plan for moving forward, and speaks to an organization's mission and vision through identifying improvement priorities. A QM plan does not change over the course of its current lifecycle, which is recommended, per best practice, to be a fiscal year.
The Action Plan (Part #2) is an extension of the QM plan, a support document that is essentially a blueprint for how the QM plan will be implemented. An action plan describes, in detail, action items to achieve target objective(s) in the QM Plan. In contrast to the QM Plan, the action plan is a working document and does change. It should be continually modified and updated based on findings and lessons learned, as you regularly monitor and evaluate information gleaned from your data being collected. Lastly, the action plan serves as a status report for the QI teamand its completion of established action items.
Now that you understand how these "parts" are connected and actually make up a "whole," we'll move on to discuss the QM plan (Part #1) in more detail and then after that, we'll discuss the Action plan (Part #2).
4
6/15/2021Module 103: QM Planning In Action
Part #1: QM Plan ‐ Components
QM plan template includes these components:
Focus Area
Goal
Outcome
Target Objective
Performance Measures
Data Source
Frequency
Responsible Person
Step #1 in the P‐D‐C‐A cycle – “Planning”
5
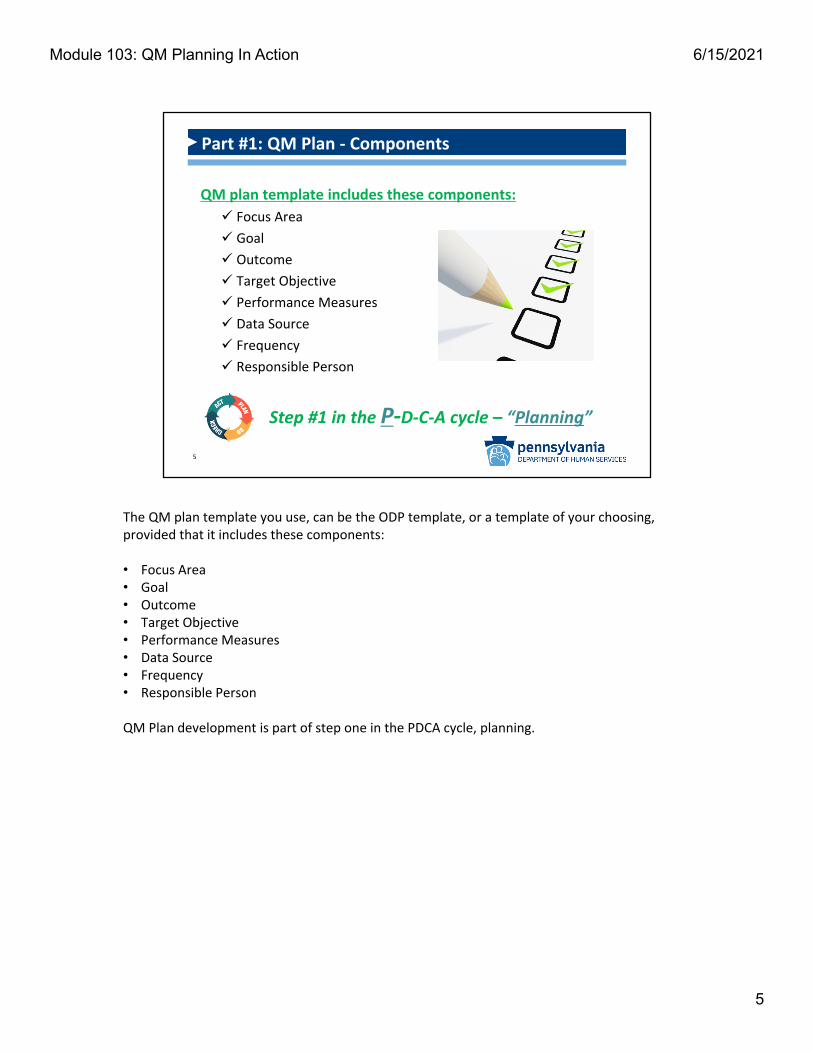
The QM plan template you use, can be the ODP template, or a template of your choosing, provided that it includes these components:
• Focus Area• Goal• Outcome• Target Objective• Performance Measures• Data Source• Frequency• Responsible Person
QM Plan development is part of step one in the PDCA cycle, planning.
5
6/15/2021Module 103: QM Planning In Action
Part #1: QM Plan – ODP Template
6
Quality Management Plan
Entity Name: Year:
Focus Area:
Goal Outcome Target Objective
Performance Measures/Data Source(s)/
Frequency/Responsible Person
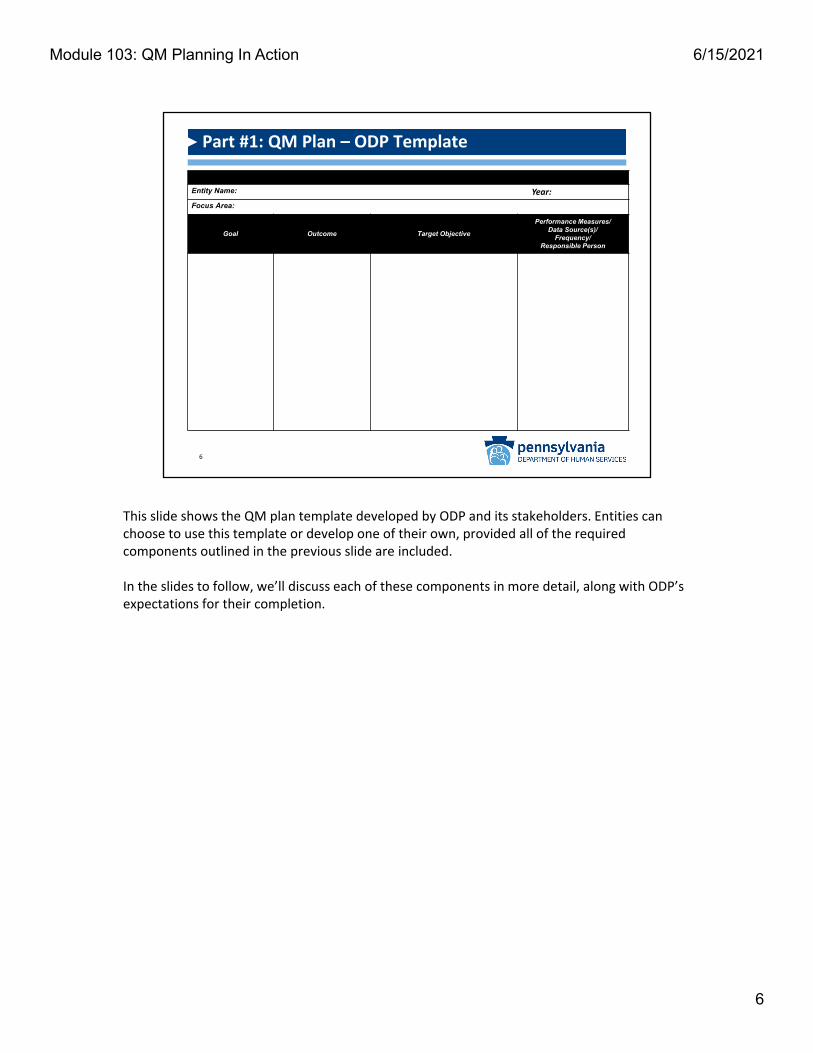
This slide shows the QM plan template developed by ODP and its stakeholders. Entities can choose to use this template or develop one of their own, provided all of the required components outlined in the previous slide are included.
In the slides to follow, we’ll discuss each of these components in more detail, along with ODP’s expectations for their completion.
6
6/15/2021Module 103: QM Planning In Action
Part #1: QM Plan – Focus Areas (Part 1 of 3)
Program Design:
Sets stage for desired outcomes achievement
Addresses fundamental requirements of programs including: Service standards Provider Qualifications Assessment Service Planning Monitoring health and
safety of participants Critical safeguards (e.g.,
incident reporting and management systems)
7
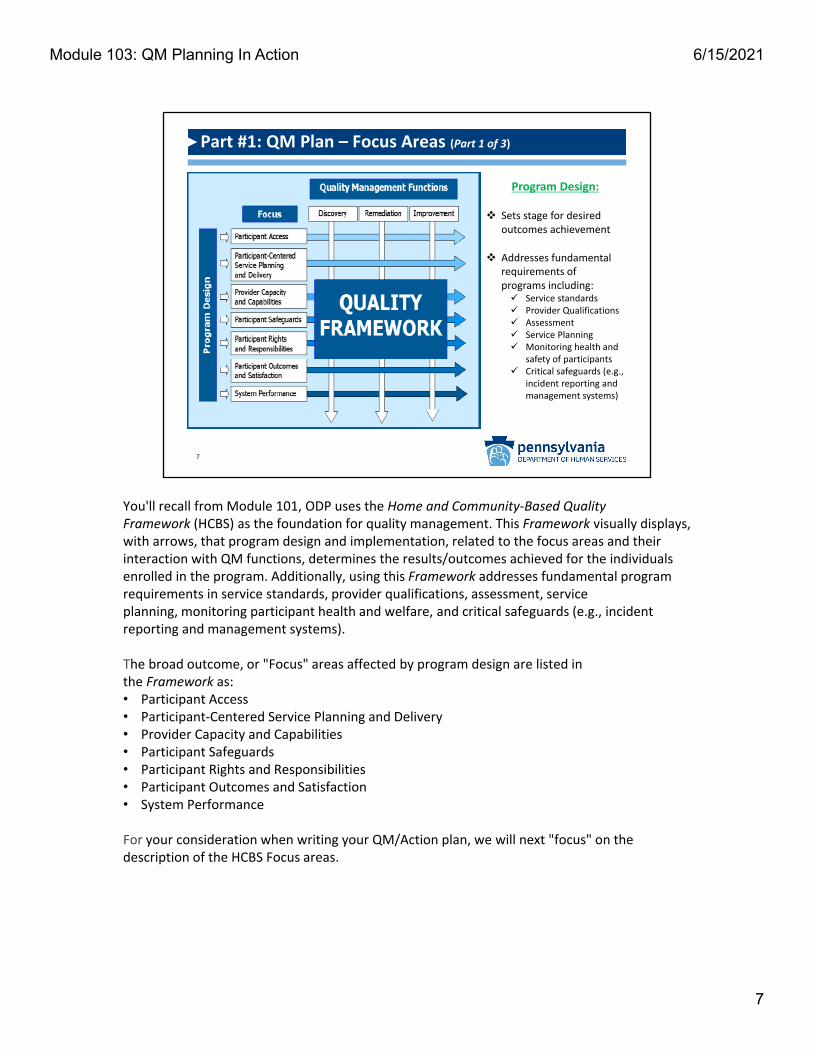
You'll recall from Module 101, ODP uses the Home and Community‐Based Quality Framework (HCBS) as the foundation for quality management. This Framework visually displays,with arrows, that program design and implementation, related to the focus areas and their interaction with QM functions, determines the results/outcomes achieved for the individuals enrolled in the program. Additionally, using this Framework addresses fundamental program requirements in service standards, provider qualifications, assessment, service planning, monitoring participant health and welfare, and critical safeguards (e.g., incident reporting and management systems).
The broad outcome, or "Focus" areas affected by program design are listed in the Framework as: • Participant Access • Participant‐Centered Service Planning and Delivery • Provider Capacity and Capabilities • Participant Safeguards • Participant Rights and Responsibilities • Participant Outcomes and Satisfaction • System Performance
For your consideration when writing your QM/Action plan, we will next "focus" on the description of the HCBS Focus areas.
7
6/15/2021Module 103: QM Planning In Action

Focus Area Description
Part #1: QM Plan – Focus Areas (Part 2 of 3)
8
This slide describes 4 of the 7 Focus (outcome) Areas in the HCBS Quality Framework:Participant Access, Participant‐Centered Service Planning and Delivery, Provider Capacity and Capabilities, and Participant Safeguards.
8
6/15/2021Module 103: QM Planning In Action
Part #1: QM Plan – Focus Areas (Part 3 of 3)
Focus Area Description
*Improvement activities may fall into more than one Focus area
9
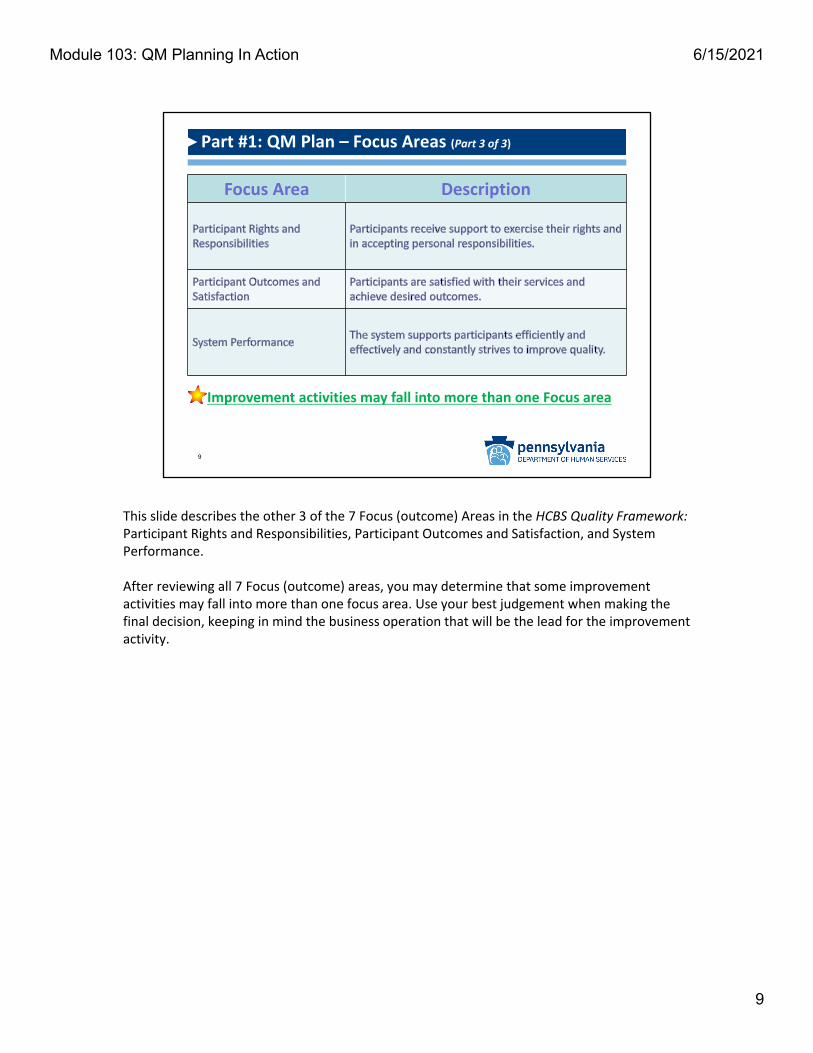
This slide describes the other 3 of the 7 Focus (outcome) Areas in the HCBS Quality Framework: Participant Rights and Responsibilities, Participant Outcomes and Satisfaction, and System Performance.
After reviewing all 7 Focus (outcome) areas, you may determine that some improvement activities may fall into more than one focus area. Use your best judgement when making the final decision, keeping in mind the business operation that will be the lead for the improvement activity.
9
6/15/2021Module 103: QM Planning In Action

Part #1: QM Plan – Goal & Desired Outcome
GOAL statement:
Driven by mission, vision, values & quality framework
Sets direction for all activities to follow
Written in broad/general/present tense terms
Describes “ideal” to be achieved
OUTCOME statement:
A desired result
Represents a change in status for individuals
Drives the target objective
Both statements should be person‐centered and simply stated
10
After you've chosen your Focus Area, you'll move on to develop your goal and outcome statements.
On a QM plan:
A goal statement is driven by an organization’s mission, vision, values and quality framework and it sets the direction for all activities to follow. It is a written statement, using broad/general terms in the present tense, but describes a desired ideal, future accomplishment, not tasks or activities.
For example – People are engaged and participating in their community.
An outcome statement describes a desired result that represents a change in status for individuals within the ideal future accomplishment described in the goal, and it drives the target objective(s).
For example ‐ People work in Competitive Integrated Employment (CIE).
Both of these statements should be person‐centered and simply stated.
6/15/2021Module 103: QM Planning In Action

Part #1: QM Plan – Target Objective(s)
Target: Precise, quantifiable desired result +
Objective: describes generally where you want to go =
Target Objective (TO):
Describes level of performance desired
Precise and quantifiable
Established using baselines and/or benchmarks
Should be S‐M‐A‐R‐T
11
What you want to happen + By how much + By when = TO
After you've developed your goal and outcome statements on your QM plan, you'll move on to develop the Target Objective(s) – where we begin to see more specificity.
First, let's break down the term "Target Objective" (TO) into its two parts and define them, as this might help clarify for anyone with experiences in service planning, treatment planning, strategic planning, care planning, etc. A target is a precise, quantifiable desired result. An objective describes where you want to go, but not necessarily how far, and is generally vaguer than a target. Depending on your experiences, you likely have heard these words used interchangeably, together, or separately to refer to similar parts in whatever plan you were working with.
In an ODP QM plan, the terms are used together, to represent one statement that describes where you want to go (what you want to happen), in precise, quantifiable terms (by how much and by when), using S‐M‐A‐R‐T guidelines, baselines and benchmarks. How the outcome and goal, at least in part, will be achieved, through specific and measurable action. It "targets" the level of performance you want to achieve, in a simple format: What you want to happen + By how much + By when = TO
For example: Increase # of people working in CIE by 20% to 103 by June 30, 2019.In this example, baseline data for FY 17/18 was used with 86 people working in CIE. Achieving the TO increase of 20% would result in 103 people working in CIE by the end of FY 18/19.
11
6/15/2021Module 103: QM Planning In Action

Part #1: QM Plan – S‐M‐A‐R‐T Target Objective(s)
A S‐M‐A‐R‐T TO is:
S – SpecificM – MeasurableA – Attainable (Achievable)R – RealisticT – Time‐bound
12
A TO should be S‐M‐A‐R‐T, as indicated in the previous slide, and can be established using baseline data and benchmarks, which will be described next. In cases where baseline data does not exist, the TO for the QM Plan could be to establish a baseline or look externally for a benchmark.
You previously may have been exposed to the guideline called S‐M‐A‐R‐T. It's a great tool for remembering the criteria to guide you in writing your target objectives.
S‐M‐A‐R‐T stands for:S – SpecificM – MeasurableA – Attainable (Achievable)R – RealisticT – Time‐bound
12
6/15/2021Module 103: QM Planning In Action

Part #1: QM Plan – Baselines and Benchmarks
Baseline:
• Starting point used for comparison / developed by tracking performance over time
• Objective assessment of current performance
Benchmark:
• Reference point for improving performance / what to strive for
• Sustained, superior performance
• Can be internal or external
Where are we NOW?
Where do we want to
go?
13
As previously mentioned, a TO can be established using baseline data and benchmarks.
A baseline is a starting point used for comparison established by tracking an organization’s performance over time, generally at least one year, and provides an objective assessment of the current level of performance. It answers the question, “where are we now?”
A benchmark is a reference point for improving performance through quality improvement activities established using sustained, superior performance (and ideally a demonstrated best practice). Benchmarks can be established internally by starting with the organization's baseline and determining a realistic level of improvement to strive for, or externally by a regulatory body, or by sustained and superior performance of a similar organization/system. It answers the question, “where do we want to go?” The practice of using benchmarks, or"benchmarking," to compare your results against a reference point (benchmark) can be done with organizations or individual practitioners.
13
6/15/2021Module 103: QM Planning In Action

Part #1: QM Plan – Performance Measures (PMs)
PMs:
Foundational in performance evaluation
Quantifiable measurements
Agreed to beforehand
May be a simple number/count/percentage
Reflect critical success factors/"How did we do?"
14
If you don’t measure results of your efforts, you can’t tell
SUCCESS from FAILURE
Performance measurement is foundational in performance evaluation. If you don’t measure the results of your improvement efforts, you can’t definitively tell if you've succeeded or failed. Therefore, you must simply and clearly state the performance measure you plan to use to evaluate your efforts, specifically related to your target objective, in your QM plan.
Performance measures are quantifiable measurements, agreed to beforehand, that reflect critical success factors of an organization. They may be a simple number, or count, or percentage and are informed through collection and analysis of data from all identified sources. By studying the results over time, an organization can determine, “How did we do?”
Here are some examples: *Total # of people with CIE, *Total # of new people with CIE
These example performance measures are obviously simple counts and easily defined by those responsible for collecting the data. However, some performance measures may be more complex, making them open to interpretation. If this is the case in your organization, you may want to consider use of a data dictionary, which will be covered briefly in the next slide.
14
6/15/2021Module 103: QM Planning In Action

Part #1: QM Plan – Data Dictionary
Performance
Measure
(PM)
Measure
Description
or
Rationale
for Data
Use
PM
Numerator
"Top part
of the
fraction"
Parts of the
whole that
meet
identified
criteria
being
measured.
PM
Denominator
"Bottom part
of the
fraction”
The whole
being
measured. In
clude
exclusions, if
applicable.
Operational
Definition:
How to measure a
certain variable or
how to define a
certain term to
assure
consistency in
data collection
and data analysis.
Additional
Notes
Regarding
Data
Collection/
Analysis
Data
Source
Target
Objective
Person ‐
Data
Collection
and
Maintenance
Person ‐
Reports
PM
Findings
and
Analysis
to
Identified
Audience
PM #1
PM #2
15
Data collected and interpreted differently within an organization...is data that cannot be used to make meaningful decisions!
QM 'PM Road Map' for consistent and accurate use of data
If you “Google” the term, you will see a number of different definitions and examples of a data dictionary, many of which are used by those in the information technology field. In ODP, we think of a data dictionary as a QM “PM road map” that keeps users on track to consistently and accurately collect, interpret, and analyze data.
Content of a data dictionary can be limited or expansive, depending on an organization’s complexity and/or identified needs. What you see in the table are ten (10) minimal elements that ODP recommends for inclusion in a data dictionary.
The goal is to make sure your data‐related processes are performed in a consistent, accurate manner, so you'll want to ensure that staff in your organization, especially those who play a role in data collection, interpretation/analysis, and reporting processes, are familiar with data dictionary contents.
Remember: Data collected and interpreted differently within an organization, is data that cannot be used to make meaningful decisions.
15
6/15/2021Module 103: QM Planning In Action

Part #1: QM Plan – Data Sources
Location where data originates and/or is stored = Data Source
Consider:
Formal databases (e.g., HCSIS, EIM, PROMISe)
Entity‐developed databases
Spreadsheets
Checklists
Individuals' records
Logs
16
Once you determine what it is you are going to measure, consider the type of data that would best inform the measure and identify the data source in your QM plan.
A data source is the location where data originates and/or is stored, according to specific requirements that aim to ensure reliability and validity of the data. To determine the best data source for your improvement efforts you should ask:
1) Do the data currently exist? 2) If yes: *Are they accessible, accurate, valid and reliable? *Who “owns” the data? and *How can the data be best collected/documented?
If the answer to question number 1 is "no," then it likely means a data source needs to be developed. An entity may not have the resources to develop a complex database however, many times a simple Excel spreadsheet will suffice. Development of any type of new data source would become one of the first activities in the QM plan's action plan which we will talk more about later in this module.
Here are some data sources to consider:• Formal ODP databases (e.g., HCSIS, EIM, PROMISe)• Entity‐developed databases• Spreadsheets• Checklists• Individuals’ records• Logs
16
6/15/2021Module 103: QM Planning In Action

Part #1: QM Plan – Frequency
Data reporting ‐ quarterly to summarize/report/share progress towards achieving goals/outcomes with oversight group
Monthly
Quarterly
17
Best Practices!
Data collection ‐monthly to ensure consistency and comparability
Frequency specifies how often data are collected and then reported and these elements should also be included on your QM plan.
The availability of the data and its accessibility will influence when you collect it, but monthly is recommended as a best practice. In some cases, the data may be available in real time, in other cases, you may decide to retrieve the data on a specific date of the month, or the same day every month – like the third Thursday, etc. Data retrieval needs to be standardized for reporting purposes to assure consistency and comparability.
While data are collected on a more frequent basis, frequency of reporting is also critical for summarizing and sharing progress toward achieving goals and desired outcomes to an oversight group. A reporting calendar is often developed and shared to establish the frequency of reporting for leaders, managers, responsible parties, and staff, which is recommended to be on a quarterly basis as a best practice.
17
6/15/2021Module 103: QM Planning In Action

Part #1: QM Plan – Responsible Person
Title of the person who:
Manages/coordinates activities towards achievement of goal/desired outcome
Has the expertise and authority to implement changes
Is held accountable by management for identified QM activities
18
Not typically
the Quality
Manager!
Lastly, a responsible person should be included on your QM plan. A responsible person refers to the title of the person in your organization who is ultimately responsible for managing or coordinating the activities that will lead to the achievement of the goal and desired outcome, including periodic monitoring, analysis and reporting of performance.
The most appropriate responsible person for an improvement project, is usually the person who has the expertise and authority to implement identified/needed changes and is thus heldaccountable by management for completion of identified activities.
For example: "AE Employment Lead" might be a good responsible person to use for the CIE examples that we have been using throughout the QM plan development discussion up to this point.
*NOTE: In most cases, the responsible person will not be a Quality Manager. Instead, a Quality Manager is expected to collaborate with QI team members through use of targeted quality management tools, supports and guidance.
18
6/15/2021Module 103: QM Planning In Action

Part #1: QM Plan – Example
Quality Management Plan
Entity Name: ABC AE Year: FY 18‐19
Focus Area: Participant‐Centered Service Planning and Delivery
Goal Outcome Target ObjectivePerformance Measures/
Data Source(s)/Frequency/Responsible Person
People are engaged and participating in their community
People work in Community Integrated Employment (CIE)
Increase # of people working in CIE by 20% to 103 by June 30, 2019.
Baseline: FY 17/18 = 86
Performance measures:
Total # of people with CIETotal # of new people with CIE
Data Source(s): SCO Report
Frequency: Data collected monthly, reported quarterly.
Responsible person: AE Employment Lead
19
In this slide, each of the examples of the QM plan components we provided in previous slides were entered into our QM plan template. Note the simplicity of the document, which allows the reader to clearly understand the goal and the other components' relationship to it. Also note that the goal, outcome statement, target objective and performance measures are person‐centered, with planned outcomes having a direct, positive impact on individuals.
It is possible for a QM plan to include more than one goal or to have more than one target objective associated with one goal or outcome. If including multiple goals/target objectives in your QM plan, please remember the importance of prioritization. Do not attempt to tackle more than you can reasonably/successfully accomplish.
Let’s now segue into talking about how this QM Plan – specifically the target objective—is going to be achieved through development of an action plan.
19
6/15/2021Module 103: QM Planning In Action

Part #2: Action Plan
An Action Plan: Is an extension of the QM plan, specifically the target
objective(s) Is integral for QM plan success Identifies sequence of action items/steps/activities and
timeframes for completion to achieve target objective(s)Functions as an assignment guide for staffRecords how/when success was achieved
Step #2 in the P‐D‐C‐A cycle – “Doing.”
20
Putting the QM plan into action, keeping it on track,and monitoring progress!
An Action Plan is an extension of the QM plan, specifically the target objective(s) and is an integral part in the process, if the improvement activity is going to succeed. It includes a sequence of action items/steps/activities that must be performed for the purpose of achieving the target objective(s) in the QM plan, with timeframes for completion. Additionally, an action plan functions as an assignment guide for staff tasked with outcome achievement and performance improvement and records how/when success was achieved. In summary, action plans put the QM plan into action, help to keep it on track, and support monitoring of progress.
Action Plan development is part of Step #2 in the PDCA cycle ‐ Doing.
20
6/15/2021Module 103: QM Planning In Action
Action PlanEntity Name: ABC AE Year: FY18‐19Focus Area: Participant‐Centered Service Planning and DeliveryDesired Outcome: People work in CIETarget Objective: Increase # of people working in CIE by 20% to 103 by June 30, 2019Performance Measure(s): Total # of people with CIE; Total # of new people with CIEData Source(s) SCO ReportResponsible Person: AE Employment Lead
“Name” Team members:
Action ItemResponsible
PersonTargetDate
StatusCompletion
Date
1.Community outreach/education meeting for local businesses about CIE—determine job availability
AE Employment Lead 5/1/18
2.Provide training to SCs about expectations for Pa’s Employment 1st Initiative
SCO Director 5/1/18
3.Ensure that individuals who want to work in CIE have that goal listed in their ISP
SCO SupervisorStarting 6/1/18 and
ongoing
4.Determine total # of people with CIE and total # of new people with CIE
SCO Data ManagerStarting 7/1/18 and
monthly
5.Collect data for action items 3 and 4 and submit to AE Data Manager
SCO Data ManagerStarting 7/30/18 and
monthly
6.Aggregate and prepare for review all data received from SCO Data Manager
AE Data ManagerStarting 8/1/18 and
monthly
7. Review and analyze data QI TeamStarting 8/30/18 and
quarterly
8.Report data analysis/findings and recommendations to AE Board of Directors
AE Employment LeadStarting 9/30/18 and
quarterly
Part #2: Action Plan ‐ Example
21
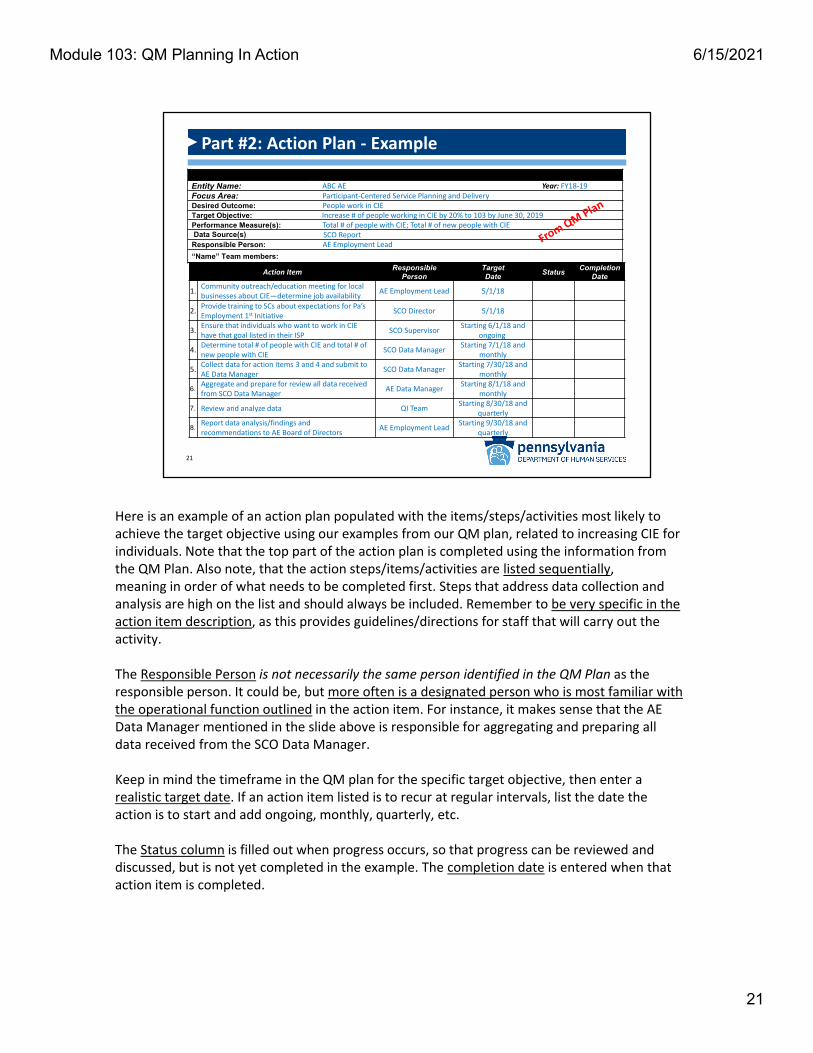
Here is an example of an action plan populated with the items/steps/activities most likely to achieve the target objective using our examples from our QM plan, related to increasing CIE for individuals. Note that the top part of the action plan is completed using the information from the QM Plan. Also note, that the action steps/items/activities are listed sequentially, meaning in order of what needs to be completed first. Steps that address data collection and analysis are high on the list and should always be included. Remember to be very specific in the action item description, as this provides guidelines/directions for staff that will carry out the activity.
The Responsible Person is not necessarily the same person identified in the QM Plan as the responsible person. It could be, but more often is a designated person who is most familiar with the operational function outlined in the action item. For instance, it makes sense that the AE Data Manager mentioned in the slide above is responsible for aggregating and preparing all data received from the SCO Data Manager.
Keep in mind the timeframe in the QM plan for the specific target objective, then enter a realistic target date. If an action item listed is to recur at regular intervals, list the date the action is to start and add ongoing, monthly, quarterly, etc.
The Status column is filled out when progress occurs, so that progress can be reviewed and discussed, but is not yet completed in the example. The completion date is entered when that action item is completed.
21
6/15/2021Module 103: QM Planning In Action

Part #2: Action Plan ‐Monitoring
QI Team should:
Review action plan items in meetings
React quickly if:
Action items are not implemented correctly
Revision of action plan is necessary
Repeat/Continue successful activities and
Revise/Discontinue unsuccessful ones
22
So that you don't lose momentum of a quality improvement activity and jeopardize success, the QI Team should:• Use the action plan at team meetings to review completion of action
steps/items/activities• React quickly if:
• Action items/steps/activities are not being implemented according to the action plan• It becomes clear that identified action items will not generate the desired outcome
and revision of the action plan is needed
To summarize, the QI Team should repeat/continue with successful activities and revise or discontinue unsuccessful ones.
22
6/15/2021Module 103: QM Planning In Action
REPORTING YOUR PROGRESS
Step #3 in the P‐D‐C‐A Cycle – “Checking.”
23
So far in the 4‐step, Plan‐Do‐Check‐Act (PDCA) cycle, we have reviewed how to complete Step #1 – Planning, by writing a QM Plan and a supporting Action Plan and Step #2 – Doing has been accomplished with the implementation of the Action Plan.
Next, we move on to Step #3 ‐ Checking, which involves checking the effect of improvement items/steps/activities through data collection and analysis, summarizing lessons learned, and reporting your progress.
In other words, you will determine the current status of your efforts, whether you are succeeding or failing, and report the status.
23
6/15/2021Module 103: QM Planning In Action

Make sure to… Collect data routinely Be aware of first 6‐8 weeks “window of opportunity” Address data collection problems before they
become embedded in routine
Collecting the Data
24
In Module 102, we touched generally on data collection, analysis, and visualization and about how important each is to any improvement project. Now, we are going to delve deeper into these topics and apply what we learned towards development of a quarterly progress report.
Determining the current status of your efforts requires that you start with collecting your data. As your QI team collects and monitors data, it's important to keep in mind that the first 6‐8 weeks can be a crucial "window of opportunity" to address any problems, before they become embedded in routines, and thus much harder to fix.
24
6/15/2021Module 103: QM Planning In Action
Preliminary Data Analysis
Initial high‐level look asking...
Do the data indicate preliminary achievement of the target objective?
Are there enough data points (at least 10) to identify:
• Trends
• Shifts
• Patterns
• Cycles
• Decisions to ACT
25
Usually 3‐6 months into a 12‐month plan cycle
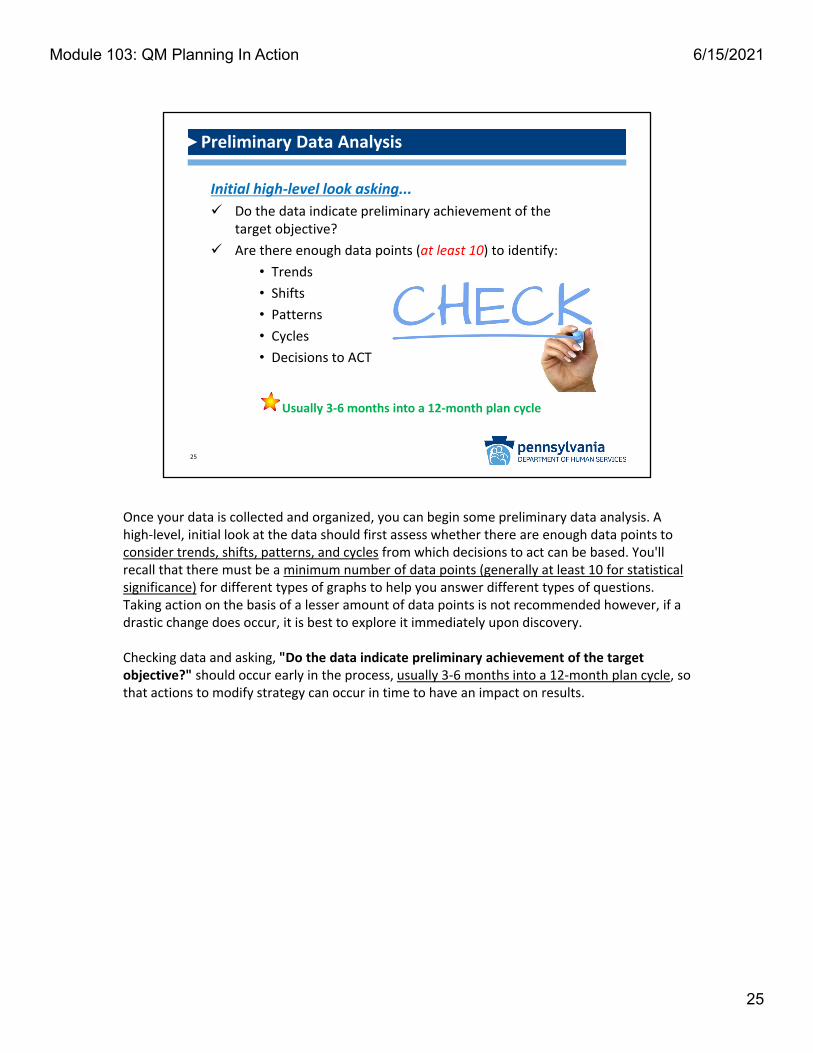
Once your data is collected and organized, you can begin some preliminary data analysis. A high‐level, initial look at the data should first assess whether there are enough data points to consider trends, shifts, patterns, and cycles from which decisions to act can be based. You'll recall that there must be a minimum number of data points (generally at least 10 for statistical significance) for different types of graphs to help you answer different types of questions. Taking action on the basis of a lesser amount of data points is not recommended however, if a drastic change does occur, it is best to explore it immediately upon discovery.
Checking data and asking, "Do the data indicate preliminary achievement of the target objective?" should occur early in the process, usually 3‐6 months into a 12‐month plan cycle, so that actions to modify strategy can occur in time to have an impact on results.
25
6/15/2021Module 103: QM Planning In Action
Data Analysis: Findings
It’s not just about collecting numbers; it’s about using them.
Findings are: Data results without analysis
or interpretation
Simple statements aboutcount and timeframe
A snapshot in time
26
It cannot be emphasized enough that data analysis is not just about collecting numbers; it’s about using them. Organizing and thinking about the data is key to understanding whether your improvement activities are, in fact, helping your organization achieve desired outcomes.
The first step in analysis is to determine the findings, or in other words, the data results without any analysis or interpretation. Findings are just simple statements about the count, the timeframe and when these counts were noted. Any data retrieved is generally a snapshot at the time it is retrieved, and this should be noted.
Analysis and interpretation help to apply meaning to the numbers and occur when we start to put the findings into context and relate them to the target objective or desired outcome.
26
6/15/2021Module 103: QM Planning In Action

Data Analysis: Critical Thinking
Who?
What?
When?
Where?
Why?Why?Why?...
How?
How much?
Critical thinking = Analysis of facts to make informed decisions
Inquiring minds want to know…
27
Be... Inquisitive... Objective... Open‐Minded...Be a Self‐Regulated, Problem‐Solver!
Simply put, critical thinking is the process of actively analyzing to draw conclusions. It involves being inquisitive, objective, and open‐minded, as well as being skilled at self‐regulation and problem‐solving.
These critical thinking questions should be applied when reviewing and analyzing data findings:• Who?• What?• When?• Where?• Why? Why? Why?...• How?• How much?
When reviewing findings, QI Team members need to have inquiring minds and be creative and innovative in their approach. They should look for possible connections (connect the dots) and ask "Why?" more than once.
Critical thinking = Analysis of facts to make informed decisions.
27
6/15/2021Module 103: QM Planning In Action

Data Analysis: Interpretation
ASK...
What conclusions can be drawn about the:
Corrective actions or improvement activities implemented?
Appropriateness of performance measures?
Accuracy, reliability & validity of the data?
Desired outcome?
Process?
System overall?
28
WHAT HAVE WE LEARNED?
When analyzing the data and interpreting the findings within the context of the problem, ask questions surrounding any conclusions that can be drawn. Some of these questions include:
What conclusions can be drawn about the:• Corrective actions or improvement activities implemented?• Appropriateness of performance measures?• Accuracy, reliability & validity of the data?• Desired outcome?• Process?• System overall?
This list of questions is not exhaustive and should be specific to the issue at hand. Additional questions may arise as the QI team conducts its analysis.
When drawing conclusions, be alert to the possibility of misinterpreting the data. If there are any data shortcomings, such as a small sample, or not enough data points to draw conclusions, or confounding variables that may need to be explored, these should be pointed out. They could possibly lead to modifications in the action plan or provide additional avenues of discovery.
The information you collect through critical thinking exercises during your analysis and interpretation should then be used for writing the findings and analysis section of your report. To the extent possible, each of the basic critical thinking questions should be answered within the narrative of your quarterly report. Once the analysis is complete, you're ready to write and present your report.
28
6/15/2021Module 103: QM Planning In Action

QM Quarterly Report: Template
Entity Quality Management Quarterly ReportReview and analysis of progress made to date to achieve QM Plan objectives.
Entity Name: Date: Submitted by:
Focus Area and Desired Outcome:Objective:
Performance Measures Findings and AnalysisDisplay data and provide data analysis where available. Include barriers to achievement of objectives where obstacles exist.
Plan-Do-Check-Act (PDCA) Cycle Follow-up
Describe follow-up activities including how barriers, if present, will be addressed.
Describe how key stakeholders are involved in the achievement of QM Plan objectives.
Describe how, and on what schedule, progress in implementing the Entity QM Plan is reported to the County/Joinder MH/ID Board or Entity Board of Directors.
29
This slide displays the template developed by ODP for use when developing a QM quarterly report. Entities can use this template or develop one of their own, provided all of the displayed components are included.
When writing the report, keep in mind that more is not necessarily better. A lengthy report doesn’t always convey a better understanding. Reports should be short enough so that people will actually read them yet comprehensive enough to convey current status and next steps. Justbe sure to answer the who, what, when, where, why and how questions that were previously discussed.
29
6/15/2021Module 103: QM Planning In Action
QM Quarterly Report: Components
Key components include: Performance Measures including:
– Identified numerators/denominators, as applicable
Findings and Analysis including:– Data Visualization
– Current and historical data
– Barriers
Follow‐up (PDCA) including:– Plan to address barriers
Descriptions of how/when:– Stakeholders are involved in the process
– Progress will be reported to the oversight body
30
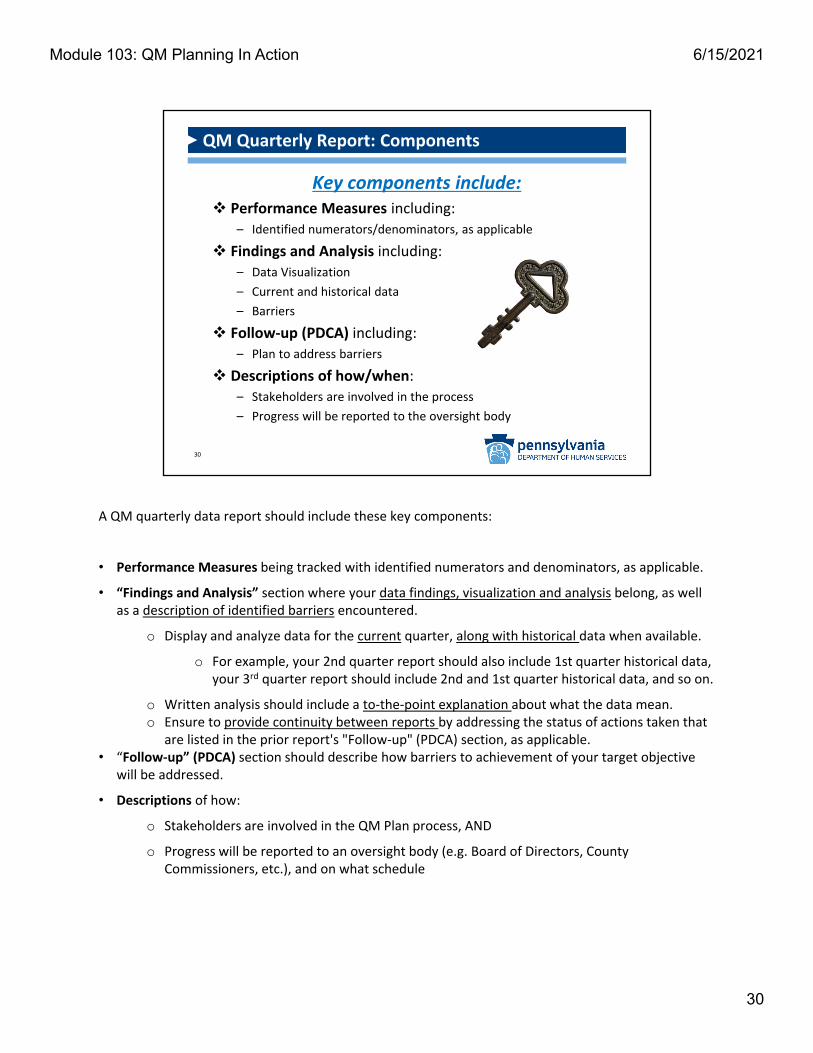
A QM quarterly data report should include these key components:
• Performance Measures being tracked with identified numerators and denominators, as applicable.
• “Findings and Analysis” section where your data findings, visualization and analysis belong, as well as a description of identified barriers encountered.
o Display and analyze data for the current quarter, along with historical data when available.
o For example, your 2nd quarter report should also include 1st quarter historical data, your 3rd quarter report should include 2nd and 1st quarter historical data, and so on.
o Written analysis should include a to‐the‐point explanation about what the data mean.o Ensure to provide continuity between reports by addressing the status of actions taken that
are listed in the prior report's "Follow‐up" (PDCA) section, as applicable.• “Follow‐up” (PDCA) section should describe how barriers to achievement of your target objective
will be addressed.
• Descriptions of how:
o Stakeholders are involved in the QM Plan process, AND
o Progress will be reported to an oversight body (e.g. Board of Directors, County Commissioners, etc.), and on what schedule
30
6/15/2021Module 103: QM Planning In Action
Clear/Accurate conveyance of data
Show patterns & trends
Minimize misrepresentation
Promote visual learning
QM Quarterly Report: Data Visualization
31
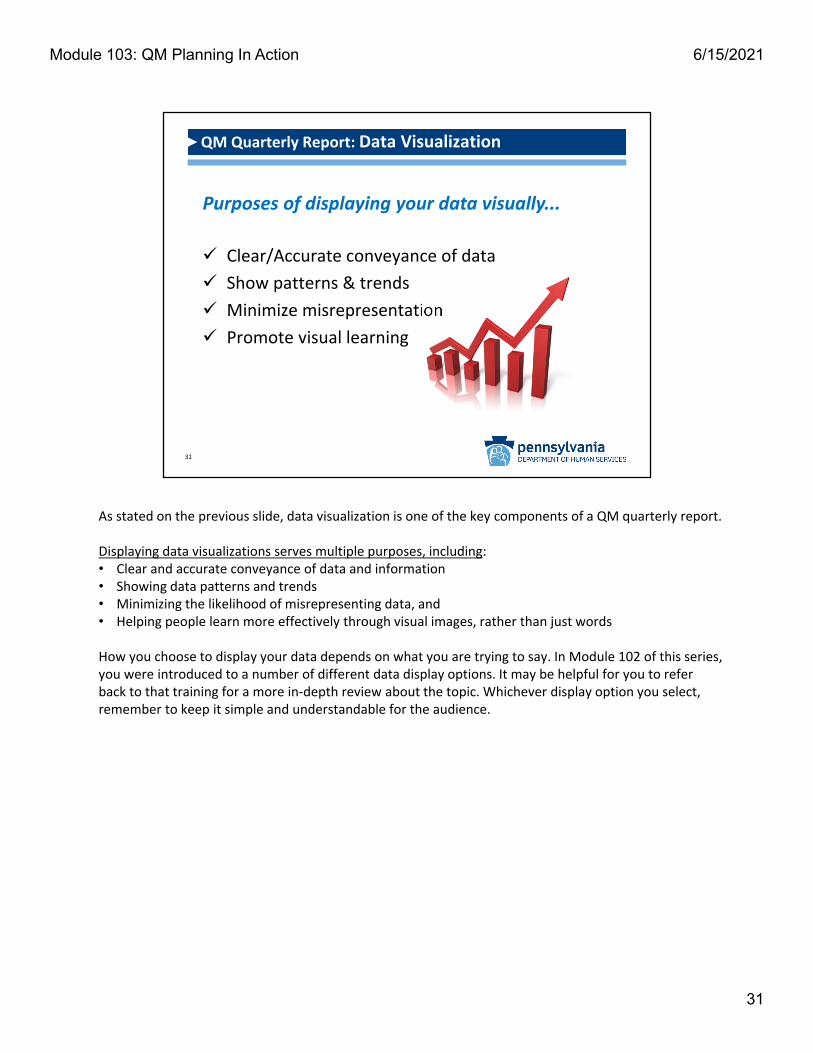
Purposes of displaying your data visually...
As stated on the previous slide, data visualization is one of the key components of a QM quarterly report.
Displaying data visualizations serves multiple purposes, including:• Clear and accurate conveyance of data and information• Showing data patterns and trends• Minimizing the likelihood of misrepresenting data, and• Helping people learn more effectively through visual images, rather than just words
How you choose to display your data depends on what you are trying to say. In Module 102 of this series, you were introduced to a number of different data display options. It may be helpful for you to refer back to that training for a more in‐depth review about the topic. Whichever display option you select, remember to keep it simple and understandable for the audience.
31
6/15/2021Module 103: QM Planning In Action

Features of a “good” report:
Accurate
Complete
Relevant
Visually interesting
Timely
QM Quarterly Report: Usability
Be prepared to share data reports with ODP or AE leads during QA&I reviews.
32
A “good,” usable report is one that includes the data you need and one that facilitates making vital decisions based upon that data. It is accurate, complete, relevant, visually interesting and timely.
Remember:• Best practice calls for reporting on a quarterly basis, AND• Be prepared to share your reports with ODP or AE leads during QA&I reviews, as it is through the
reporting process that you measure and document progress towards achieving identified person‐centered goals and objectives, on your QM plan.
32
6/15/2021Module 103: QM Planning In Action

QM Quarterly/Annual ReportReview and analysis of progress made to date to achieve QM Plan objectives.
Entity Name: ABC AE
Date: 12/31/18
Submitted by: AE Employment Lead
Focus Area and Desired Outcome: Participant‐Centered Service Planning and Delivery; People work in CIE
Objective: Increase # of people working in CIE by 20% to 103 by June 30, 2019
Performance Measures
# of people with CIE
# of new people w/ CIE
Findings and Analysis
Total # of people with CIE, FY 18‐19 – Quarter 2 = 94
Data reflects an increase of 8 people working in CIE by mid‐FY.
Total # of new people with CIE, FY 18‐19 – Quarter 2 = 12Data reflects 12 new people working in CIE by mid‐FY.
Data Source: SCO Report
Plan‐Do‐Check‐Act (PDCA) Cycle
Follow‐up
The QI Employment Team will
request data from SCO John
Smith on the number of
anticipated retirements for the
next 6 months.
6/15/2021
0 2 43 0 3
0
5
Jul‐18 Aug‐18 Sep‐18 Oct‐18 Nov‐18 Dec‐18
# of new people working in CIE
86 87 89 92 9294
8090100
Jul‐18 Aug‐18 Sep‐18 Oct‐18 Nov‐18 Dec‐18
# of people working in CIE
33
QM Quarterly Report: Example (Part 1 of 2)
Here is a completed example of a QM Quarterly Report related to continuing our improvement project example to increase the number of people with CIE. It includes all key components.
The Findings and Analysis section continues on the next slide.
33
6/15/2021Module 103: QM Planning In Action
6/15/202134
QM Quarterly Report: Example (Part 2 of 2)
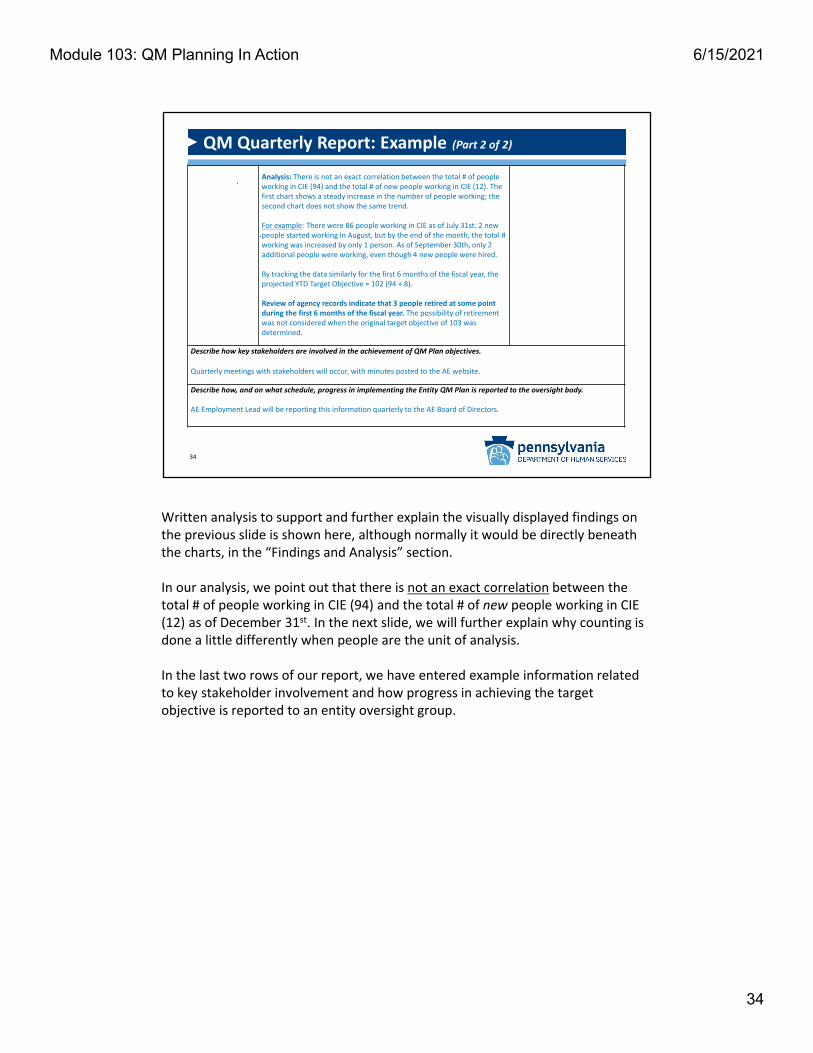
Analysis: There is not an exact correlation between the total # of people working in CIE (94) and the total # of new people working in CIE (12). The first chart shows a steady increase in the number of people working; the second chart does not show the same trend.
For example: There were 86 people working in CIE as of July 31st. 2 new people started working in August, but by the end of the month, the total # working was increased by only 1 person. As of September 30th, only 2 additional people were working, even though 4 new people were hired.
By tracking the data similarly for the first 6 months of the fiscal year, the projected YTD Target Objective = 102 (94 + 8).
Review of agency records indicate that 3 people retired at some point during the first 6 months of the fiscal year. The possibility of retirement was not considered when the original target objective of 103 was determined.
Describe how key stakeholders are involved in the achievement of QM Plan objectives.
Quarterly meetings with stakeholders will occur, with minutes posted to the AE website.
Describe how, and on what schedule, progress in implementing the Entity QM Plan is reported to the oversight body.
AE Employment Lead will be reporting this information quarterly to the AE Board of Directors.
Written analysis to support and further explain the visually displayed findings on the previous slide is shown here, although normally it would be directly beneath the charts, in the “Findings and Analysis” section.
In our analysis, we point out that there is not an exact correlation between the total # of people working in CIE (94) and the total # of new people working in CIE (12) as of December 31st. In the next slide, we will further explain why counting is done a little differently when people are the unit of analysis.
In the last two rows of our report, we have entered example information related to key stakeholder involvement and how progress in achieving the target objective is reported to an entity oversight group.
34
6/15/2021Module 103: QM Planning In Action

Unit of Analysis: People
Before completing your analysis, consider...
If it's "who," then be mindful of operational definitions(such as those used in our example):
Unique, unduplicated – count each person one time only
"New" – we defined as ‐ not previously employed or re‐employed 60 consecutive days after separation from prior employment
Never assume the same people are working, etc., from one month to the next!
Unit of analysis ‐ "who" or "what" you are analyzing
35
In our example on the previous slide, the unit of analysis—or the “who” we are analyzing—is people. More specifically, we are counting the number of unique, unduplicated people working in CIE, as of a certain date. This count is determined differently than other counting, like number of medication errors, restraints, etc., where the unit of analysis is the "what" we are analyzing.
In our analysis, we see that 94 represents the total number of people with CIE, taking into consideration the turnover of people who entered and left the workforce during the first 6 months of the fiscal year. The total number of people who entered CIE at some point during the same time period was 12. Only 8 of the 12 newly employed people were still employed as of December 31st. Explaining in more detail, 86 people were working in CIE as of July 31st and 2 new people started working in August, but by the end of the month, the total # working was increased by only 1 person. As of September 30th, only 2 additional people were working, even though 4 new people were hired and so on.
Before completing this analysis on people, we needed to take specific information into consideration such as:• Operational definitions:
o Unique, unduplicated – means count each person one time onlyo "New" ‐ a newly hired employee is someone who either hasn’t previously
been employed in CIE by an employer, or was formerly hired by an employer, but has been separated from that prior employment for at least 60 consecutive days
• Never assume the same people are working from one month to the next ‐ some of them are the same but, some new people may have started and some may have ended their CIE employment during the time period. For this reason, it is important to track the number of new people in CIE separately. This is also a great example for why you should monitor your data monthly—it's much easier to see what happened—although you might only report it quarterly.
35
6/15/2021Module 103: QM Planning In Action
Projecting Year‐to‐Date (YTD): People
Jul18
Aug18
Sep18
Oct18
Nov18
Dec18
Jan19
Feb19
Mar19
Apr19
May19
Jun19
Projected YTD
86+1 = 87
+2 =89
+3 = 92
+0 =92
+2 =94
94 + 8 =102
People in CIE:
Where you started: 86
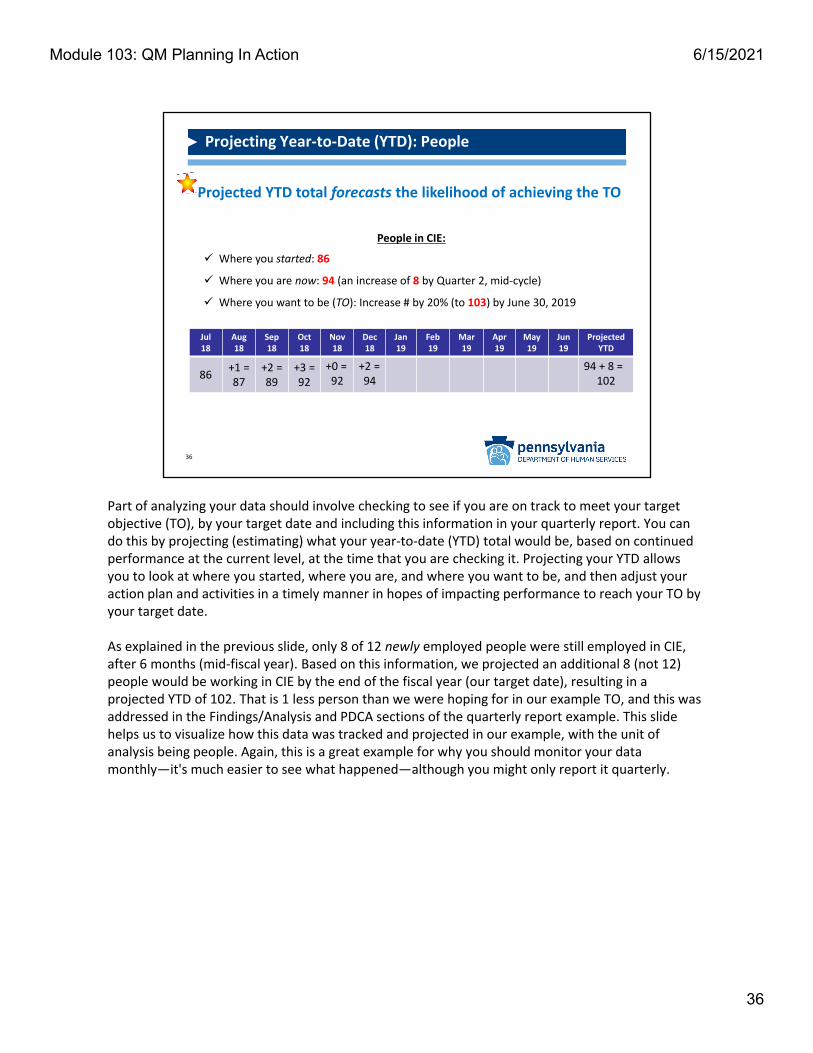
Where you are now: 94 (an increase of 8 by Quarter 2, mid‐cycle)
Where you want to be (TO): Increase # by 20% (to 103) by June 30, 2019
Projected YTD total forecasts the likelihood of achieving the TO
36
Part of analyzing your data should involve checking to see if you are on track to meet your target objective (TO), by your target date and including this information in your quarterly report. You can do this by projecting (estimating) what your year‐to‐date (YTD) total would be, based on continued performance at the current level, at the time that you are checking it. Projecting your YTD allows you to look at where you started, where you are, and where you want to be, and then adjust your action plan and activities in a timely manner in hopes of impacting performance to reach your TO by your target date.
As explained in the previous slide, only 8 of 12 newly employed people were still employed in CIE, after 6 months (mid‐fiscal year). Based on this information, we projected an additional 8 (not 12) people would be working in CIE by the end of the fiscal year (our target date), resulting in a projected YTD of 102. That is 1 less person than we were hoping for in our example TO, and this was addressed in the Findings/Analysis and PDCA sections of the quarterly report example. This slide helps us to visualize how this data was tracked and projected in our example, with the unit of analysis being people. Again, this is a great example for why you should monitor your data monthly—it's much easier to see what happened—although you might only report it quarterly.
36
6/15/2021Module 103: QM Planning In Action
Projecting Year‐to‐Date (YTD): Things
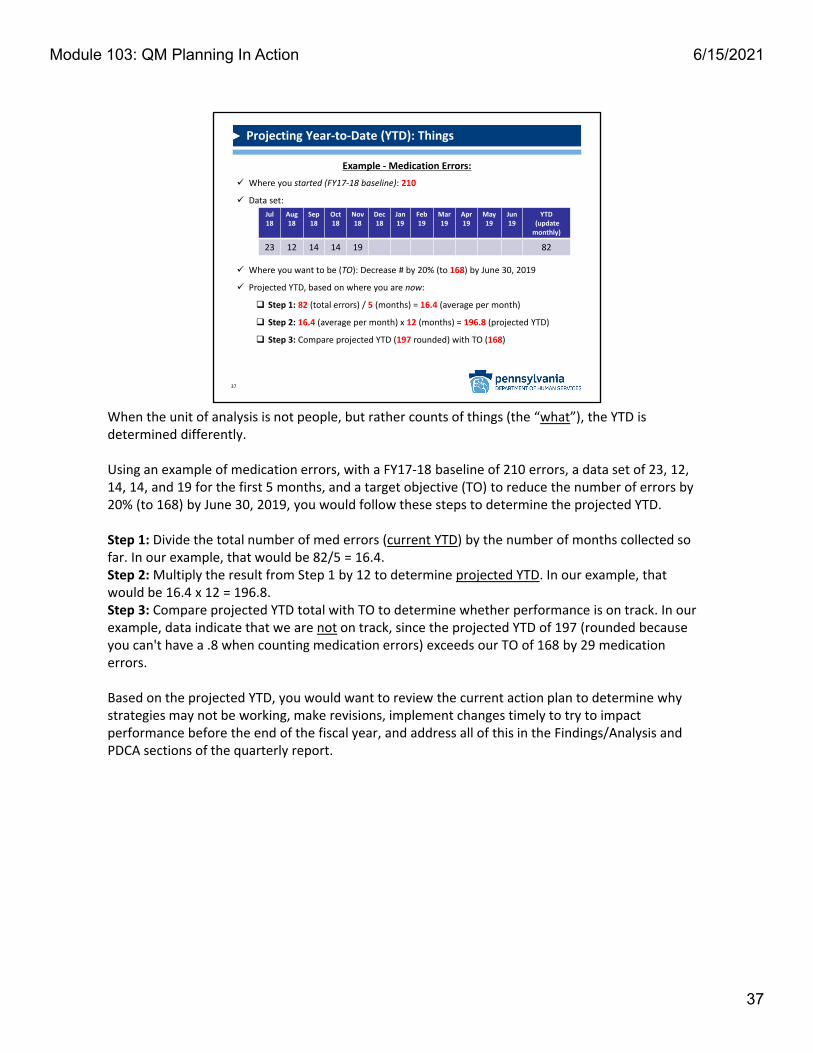
Example ‐Medication Errors:
Where you started (FY17‐18 baseline): 210
Data set:
Where you want to be (TO): Decrease # by 20% (to 168) by June 30, 2019
Projected YTD, based on where you are now:
Step 1: 82 (total errors) / 5 (months) = 16.4 (average per month)
Step 2: 16.4 (average per month) x 12 (months) = 196.8 (projected YTD)
Step 3: Compare projected YTD (197 rounded) with TO (168)
37
Jul18
Aug18
Sep18
Oct18
Nov18
Dec18
Jan19
Feb19
Mar19
Apr19
May19
Jun19
YTD(update monthly)
23 12 14 14 19 82
When the unit of analysis is not people, but rather counts of things (the “what”), the YTD is determined differently.
Using an example of medication errors, with a FY17‐18 baseline of 210 errors, a data set of 23, 12, 14, 14, and 19 for the first 5 months, and a target objective (TO) to reduce the number of errors by 20% (to 168) by June 30, 2019, you would follow these steps to determine the projected YTD.
Step 1: Divide the total number of med errors (current YTD) by the number of months collected so far. In our example, that would be 82/5 = 16.4.Step 2: Multiply the result from Step 1 by 12 to determine projected YTD. In our example, that would be 16.4 x 12 = 196.8.Step 3: Compare projected YTD total with TO to determine whether performance is on track. In our example, data indicate that we are not on track, since the projected YTD of 197 (rounded because you can't have a .8 when counting medication errors) exceeds our TO of 168 by 29 medication errors.
Based on the projected YTD, you would want to review the current action plan to determine why strategies may not be working, make revisions, implement changes timely to try to impact performance before the end of the fiscal year, and address all of this in the Findings/Analysis and PDCA sections of the quarterly report.
37
6/15/2021Module 103: QM Planning In Action
Based on what you've learned about implemented improvement activities and barriers...
Continue successful improvement practices
Revise/Discontinue unsuccessful activities
Make recommendations for solutions to overcome identified barriers
Taking Action
Step #4 in the P‐D‐C‐A Cycle – “Acting.”
38
We've now talked about data collection, analysis, visualization, and reporting and discussed that one important part of reporting is the inclusion of follow‐up, or taking action based on what you've learned so far.
This is Step #4 in the PDCA cycle ‐ Acting. At this point, you know how implemented improvement activities are working, and what, or if, any barriers exist.
Based on this information, you can now take action by incorporating plans to:• Continue successful improvement practices,• Revise or discontinue the unsuccessful activities, and/or• Make recommendations for solutions to overcome identified barriers
38
6/15/2021Module 103: QM Planning In Action
You have learned how to develop:
QM Plans
Action Plans
Quarterly Reports
Accomplishments
39
What's next?
So far, in Module 103, we've discussed a tremendous amount of information. Let’s review your accomplishments.
You have learned how to develop:
• Part # 1 – A QM Plan that includes a goal, desired outcome, target objective, performance measure(s) with the data source, responsible person and frequency of data reporting.
• Part #2 – An Action Plan with specific action items designed to help achieve the identified goal, desired outcome and target objective in the QM Plan.
• A QM Quarterly Report to organize data and analyze whether improvement activities put into place are helping to achieve desired outcomes.
So, what's next?
39
6/15/2021Module 103: QM Planning In Action
Continue the PDCA Cycle
40
Continue to monitor progress in achieving
your target objectives through
ongoing implementation of the PDCA cycle.
Well, simply stated, you would continue to monitor progress in achieving your QM Plan target objectives through ongoing implementation of the PDCA cycle.
That means that you should continue to collect and analyze data, at established intervals, monitor action plan activities as appropriate, and complete reports as scheduled.
40
6/15/2021Module 103: QM Planning In Action

During ongoing implementation of the PDCA cycle:Assess whether target objectives...
Are being achieved
Should be continued, revised or discontinued
And
If new target objectives should be developed
Updating QM/Action Plans (Part 1 of 3)
41
As you continue to implement the PDCA cycle ongoingly, you should be considering your baseline data and target objectives to determine whether target objectives are being achieved, should be continued, revised or discontinued in the next QM Plan cycle, and if new target objectives should be developed.
It's important to remember while we are discussing updating QM and Action plans that:• A QM plan does not change over the course of it's current lifecycle, which is recommended, per best
practice, to be a fiscal year.• While a QM Plan's Action Plan should be continually modified and updated based on findings and
lessons learned, as you regularly monitor and evaluate information gleaned from your data being collected.
41
6/15/2021Module 103: QM Planning In Action

Updating QM/Action Plans (Part 2 of 3)
If you plan to discontinue a TO:
1. Review/Discuss related performance data
2. Provide written rationale that:
Includes performance data
Describes how you will monitor to ensure level of performance is sustained *(CQI)
* Continuous Quality Improvement (CQI)
42
The decision to discontinue a target objective (TO) should only be made after review and discussion of available performance data. If you plan to discontinue any target objective(s), you should provide written rationale that includes the performance data and describes how you will monitor to ensure level of performance is sustained long‐term, otherwise known as continuous quality improvement (CQI).
42
6/15/2021Module 103: QM Planning In Action
Consider: Positive and negative lessons Successful and unsuccessful actions,
including consequences and surprises
Integration into future QM planning
Updating QM/Action Plans (Part 3 of 3)
43
…sum of knowledge gained by experiences
Other things to think about as you move into the next QM planning cycle are lessons learned, which are the sum of knowledge gained by your experiences.
You should consider:
• Positive and negative lessons• Successful and unsuccessful actions, including consequences and surprises• Integration into future QM panning
43
6/15/2021Module 103: QM Planning In Action

Continue the QM Planning Cycle
44
Based on your assessment of your current QM/Action Plan—reflecting on lessons learned and determining key target objectives for moving forward, you are now ready to embark on another QM planning cycle.
Remember, this QM/Action plan process, which embeds the PDCA cycle, is the method you will use for measuring and influencing quality in your organization and throughout the ODP system, for the purpose of better outcomes for those served, and ultimately everyday lives for them.
44
6/15/2021Module 103: QM Planning In Action
A QI Team, unlike an Advisory Board, Executive Leadership or a Committee, does not go on indefinitely. Usually, there is a beginning point and an end point. But how do you know where that end point is? And who decides?
Generally, a QI Team disbands when:
• The purpose in the original guiding document has been fulfilled• All associated work of the QI Team has been completed• Recommendations have been made by the team and adopted, or not, by leadership• Policy has been developed to embed successful strategies into business operations
After these 4 tasks have been accomplished, then the QI Team should make the recommendation to disband to leadership, as they ultimately make the decision.
When is it Time to Disband the QI Team?
Recommendations Made!Successful Strategies Embedded in Policy!
45
45
6/15/2021Module 103: QM Planning In Action
Or… Continue?
You Might Not Be Done!
46
It should be noted that there are some circumstances when, for a variety of reasons, leadership may want to continue the team.
For example, QI teams are generally focused on achieving a process improvement, or a specific desired result, but oftentimes, the process being focused on is just one part of a system being developed or improved upon. A QI Team that has hit its stride, understands QM methodology, and has demonstrated success, is now an asset to the organization. Leadership may want to take advantage of that and instead of disbanding the team, they might choose to utilize them to address another process within the same system or use their experience to design a new system with quality built in from the start.
46
6/15/2021Module 103: QM Planning In Action

Celebrate!
DON’T FORGET TO CELEBRATE!
47
Regardless of whether leadership decides to disband the QI Team or continue its work with another focus, it’s time to celebrate!
The work of quality improvement has been done using QM concepts, methods and tools to make evidence‐based decisions through consensus, and embed "Lessons Learned,” in policy and daily tasks to assure improvement is sustained.
In other words, QUALITY is now built‐in and is a way of doing business – by everyone in the organization!
47
6/15/2021Module 103: QM Planning In Action

Roles & Responsibilities: QM Leadership
BE A CQI CHAMPION!!!
Show off your expertise through use of QM concepts and tools
Create and maintain a culture of CQI
Stay updated on ODP priorities and requirements
Make recommendations to leadership
Work with staff to implement new initiatives using data, PMs and TOs
48
Once you’re back in the office, you should be ready to take on the roles and responsibilities of a QM leader. BE A CQI CHAMPION!
• Show off your expertise by:o Collecting and organizing understandable data to inform decision‐makingo Strategizing actions to achieve improvement for person‐centered outcomeso Reporting progress in achieving goals and objectiveso Communicating the results of your work throughout your entity
• Create and maintain a culture of CQI by being a role model for positive change and fostering communication, collaboration and teamwork
• Stay updated on ODP priorities and requirements for business partners and communicate recent updates to leadership and staff
• Make recommendations to leadership, including convening, facilitating and participating in QI teams to achieve improvements
• Work with staff to implement new initiatives that make use of data, performance measures, and target objectives
48
6/15/2021Module 103: QM Planning In Action

49
Congratulations! This concludes Module 103, the final pre‐requisite module for QM certification. The Quality Management Division thanks you for taking the time to enhance your QM knowledge and skills for the purpose of improving the outcomes for those we serve! Now you are ready to attend the class and officially become ODP QM certified! We look forward to seeing you there!
49
6/15/2021Module 103: QM Planning In Action