p1 8 rayetal ams07 new final - confex · (above, near and below normal). these categories represent...
TRANSCRIPT
P1.8 INTEGRATING ASSESSMENTS OF USER NEEDS WITH WEATHER RESEARCH:
DEVELOPING USER-CENTRIC TOOLS FOR RESERVOIR MANAGEMENT
Andrea J. Ray1, Joseph J. Barsugli1,2, and Thomas Hamill1
1 NOAA Earth Systems Research Laboratory, Physical Sciences Division, Boulder, CO; 2NOAA-CIRES Climate Diagnostics Center, University of Colorado, Boulder, CO
1. INTRODUCTION Development of user-centric products requires
the linking of identified user needs with research on forecast tools. In this project we are integrating two lines of research that began in parallel: assessments of the needs of reservoir managers at the U.S. Bureau of Reclamation (USBR), and research to improve medium-range weather forecasting (also known as intraseasonal forecasts) at the National Oceanic and Atmospheric Administration’s Earth Systems Research Laboratory (NOAA/ESRL). Our assessment of user needs has identified opportunities for using medium-range weather forecasts to improve the efficiency of management of the USBR storage in the Lower Colorado, based on better estimates of demands and inflows. Recently, forecast techniques have been developed that dramatically improve the skill of probabilistic weather forecasts during week 1 (Hamill et al. 2006a) as well as improvements in week 2. These products are based on a 25-year reforecast database developed at NOAA/ESRL and demonstrate how a current numerical intra-seasonal forecast could be statistically calibrated using the reforecasts (Hamill et al. 2004). The calibration greatly improves the statistical reliability of these probabilistic forecasts. The objective of this project is to work with the USBR to improve the usability of these forecast products for their Lower Colorado operations, by reducing complexity and improving the accessibility of the forecasts.
2. US BUREAU OF RECLAMATION: FORECAST NEEDS ASSESSMENT
We are working with the USBR Lower Colorado Office (LCO) as pilot project for developing these products to support their operational decision-making for reservoirs in the Lower Colorado basin. The USBR/LCO reservoir management challenges and goals are similar in
Corresponding author address: Andrea J. Ray, NOAA ESRL/PSD1, 325 Broadway, Boulder, CO 80305-3328; Email: [email protected]
many ways to other large-scale reservoir management across the Western United States, so their operations are a good case study for improving the usability of these products to a broader community of water managers in the U.S. West.
The USBR system on the lower Colorado serves water users in California and Arizona delivers water to Mexico, and generates hydropower (Fig. 1). About 70 miles downstream of Lake Mead and Hoover Dam is Davis Dam that holds back Lake Mohave, a 67-mile long reservoir with a capacity of 1.8 million acre-feet (maf, 2,243 million cubic meters, mcm) of water. The primary purpose of Davis Dam is to re-regulate Hoover Dam releases to meet downstream needs including the annual delivery of 1.5 maf of water to Mexico in accordance with the 1944 water treaty. Lake Mohave also provides recreation and habitat for fish and wildlife. Parker Dam's primary purpose is to provide reservoir storage from which water can be pumped into the Colorado River Aqueduct that supplies California and the Central Arizona Project Aqueduct. Lake Havasu, the reservoir behind Parker Dam, is about 45 miles long and can store 648,000 acre-feet (797 mcm) or nearly 211 billion gallons of water. Both reservoirs also capture and delay the discharge of runoff and flash floods from side washes below Hoover Dam.
Based on user studies involving interviews, decision process analysis, and participant-observation with the USBR/LCO we identified substantial needs for information on intraseasonal weather forecasts as well as seasonal climate. These needs relate to management objectives in the lower Colorado River basin including: maximizing storage in lower Colorado River Reservoirs; balancing flood control and storage criteria; improving planning for releases for irrigation given the influence of temperature anomalies on demand; and carrying out other USBR goals such as flows for environmental management purposes.

Another key objective is to meet the treaty obligation to Mexico, but to minimize releases in excess of this obligation. The user assessment found that intra-seasonal forecast information may be useful throughout the water year, as reservoir planning and management adjusts to both observed and forecasted conditions of winter snow accumulation, spring runoff, warm-season irrigation, and municipal and industrial uses all year. At each stage in planning, anomalous intra-seasonal temperature or precipitation conditions may significantly influence storage and releases planned, often affecting planning for many months in the future. One need for information is advance warning of days to weeks of rainy periods in order to manage flows from the Bill Williams river and other lower tributaries. A second need is advance warning of days to weeks for temperature anomalies in the irrigation district areas (see Fig. 1) in order to better predict irrigation demand and better plan releases from Parker and Davis.
In this pilot project we are working with the USBR to determine how to improve the usability of NOAA intraseasonal products for use in water management decisionmaking. The partnership involves participating in their operations conference calls, making site visits, and providing and iterating with them on products in revised
formats. We also are developing a training workshop and a user guide to the forecasts. This user guide will include case studies of several events that created significant challenges for the management of the system, for example the heavy rains in the winter of 2005.
3. INTRASEASONAL FORECAST PRODUCTS Recently, several experimental intraseasonal
forecast products (http://www.cdc.noaa.gov/ people/jeffrey.s.whitaker/refcst/week2/) have been developed at ESRL that use the 25-year “reforecast” database to calibrate and remove biases from an ensemble of numerical medium-range forecasts (Hamill et al 2004). The ESRL suite of experimental products exists within a larger context of NOAA operational intraseasonal forecasts issued by the NOAA National Weather Service (NWS). The NWS Climate Prediction Center (CPC) issues official 6-10 day and 8-14 day outlooks (http://www.cpc.noaa.gov/products/ predictions/610day/) which are a subjective blend of many different sources, including the ESRL forecasts. These products provide tercile forecasts at a fairly large spatial scale for precipitation (Above, Near and Below Median) and temperature (Above, Near and Below Normal). These categories represent represent terciles of the
Hoover Dam
Davis Dam
Parker Dam
Irrigation Di tricts
Figure 1. Map of the Lower Colorado River Basin showing Hoover, Davis and Parker Dams and their reservoirs, Lakes Mead, Mohave, and Havasu, and the U.S.-Mexico border.

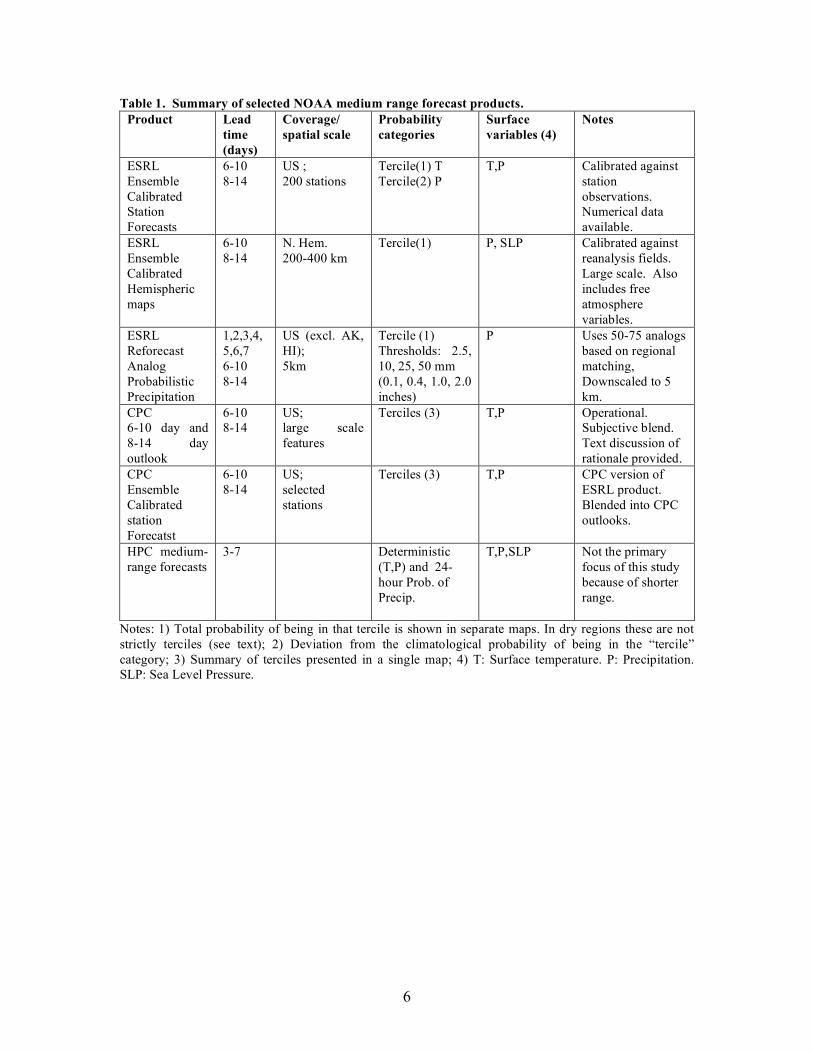
climatological temperature and precipitation distributions, although the user is referred to other NWS offices for this information. As discussed below, the tercile representation of precipitation may be difficult to interpret in a dry region. The NOAA Hydrometeorological Prediction Center (HPC) also provides probability of precipitation and deterministic forecasts of temperature at 3-7 day lead times, though we do not focus on these products in this study (http://www.hpc.noaa.gov/ medr/medr.shtml). The calibrated tercile probabilities for temperature and precipitation from the ESRL technique have recently been synthesized into the CPC product. The NOAA products vary in their spatial scale and coverage, as well as in the manner in which the probabilistic information is presented. Table 1 is a summary of relevant NOAA intraseasonal products.
The ESRL products include forecasts of temperature, precipitation, and other variables presented as maps of tercile probability. Two methods are used to convert the raw ensemble of medium-range numerical model forecasts into calibrated probabilities: the calibrated ensemble method and the reforecast analog method. Analog-based probability forecasts of precipitation
downscaled to 5-km resolution are produced for both terciles and for the probability of exceeding various precipitation threshold values (Fig. 2, http://www.cdc.noaa.gov/reforecast/narr/). This latter product has proven to be of particular interest to the USBR/LCO.
The overall skill of the two methods is comparable in that both methods produce probabilistic forecasts that are considerably more statistically reliable than raw ensemble probabilities. Reliability in this context means that, for example, an event that is forecast with 60% probability actually happens close to 60 % of the time. However, the methods do present certain relative advantages to one another, The analog method estimates the whole probability distribution at once by choosing 50 to 75 historical “reforecast analogs” that are close to the current forecast in the region of interest. The use of analogs is relatively intuitive and easy to understand. The calibrated ensemble method uses a logistic regression that must be re-calibrated (i.e. the logistic regression coefficients recomputed) for each quantity, probability threshold, and lead-time desired. However, the calibrated ensemble method uses the entire reforecast database to calibrate the forecasts,
Figure 2. Example of the reforecast analog probability forecast product from ESRL. This map shows the 6-10 day forecast initialized at 00Z on 27 December 2005. The graphic shows the percent chance of greater than 10 mm (0.4 in) falling during the period 00Z 1 January 2006 to 00Z 6 January 2006.

as opposed to the smaller sample from the analog method. The calibrated ensemble technique works best for forecasts at a given observation location with a long history of observations. Both methods could be tailored to forecast joint probabilities for other variables. For example, the USBR/LCO is interested in forecasts of extreme heat and wind events that occur together as these conditions may have a significant impact on water demand.
4. EVENT CASE STUDIES AS TOOLS FOR TWO-WAY LEARNING
We are creating case studies of several events that presented significant challenges to the USBR in management of the system, and thus are memorable for them. These case studies are intended to help potential users understand the forecasts, their evolution over time, and how uncertainty and skill are represented. By presenting the time-history of the forecasts in tandem with the actual outcomes for user-identified variables the user can see how the forecasts developed for those cases, and how they might have been used. A second purpose for these case studies is to help us have a conversation with these managers how the forecasts might have been used in management of these memorable events, and whether they would have helped manage this situation differently. Thus, this process will help us better understand the potential value of the forecasts.
Cases being developed include large precipitation events and temperature anomalies, and include cases in which events forecasted many days out did not ultimately occur. Cases are being selected based both on LCO recommendations and on meteorological factors that influence supply and demand in the Lower Colorado system. Two types of events requested by the LCO include tropical storms from the Gulf of California region, which often influence the Lower Colorado, because LCO is interested in the extent to which the probabilistic forecasts provide useful information about tropical storms or their associated moisture fields. A specific event of interest were the heavy rains in the winter of 2005. In that year, drought conditions for the previous several years resulted in low storage in Lake Mead lead to a concern with maintaining storage in the lower basin reservoirs, but the USBR was working with the U.S. Fish and Wildlife Service to provide high spring flows to support habitat maintenance under the Multi-Species Conservation Plan. The USBR and the Army Corps of Engineers (which has flood control responsibilities in the Lower Colorado), were
concerned about the potential for environmental releases and heavy rains to create flood-level flows that could not be managed by the reservoirs.
5. DISCUSSION
Probabilistic forecasts have a number of advantages compared to deterministic forecasts. The single value for temperature or precipitation given in a deterministic forecast may convey a false sense of certainty about that predicted outcome. The “percent chance” of a probabilistic forecasts, on the other hand, is one way of conveying the degree of certainty or uncertainty inherent in a forecast. Sources of uncertainty in weather forecasts include: uncertainties in the present observations used to initialize the weather forecast models; errors and limitations in the forecast model formulation; and chaos in the fluid dynamics of the atmosphere (the “butterfly effect”).
However, probabilistic forecasts also present certain challenges for communication. The ESRL analog precipitation forecast presents probabilities of exceeding the climatological terciles (for example, probability of above normal precipitation) and for exceeding specific thresholds of precipitation amount (e.g. probability of getting more than 1-inch of precipitation). While these two methods are two different ways of presenting the same underlying probability information produced by the analog forecast, the interpretation in dry regions can be quite different.
While terciles are a common way of presenting information, one of the challenges we have identified in the communication of these forecasts is that in a dry region, “normal” or “average” rainfall rarely occurs, and the median rainfall may be zero. The method used at ESRL to deal with this is to divide precipitation in dry regions into three categories that are no longer equal terciles of the probability distribution. The lowest category contains all “no rain” dates, which may occur more than 1/3 of the time. In the extreme case that it is dry more that 2/3 of the time, only two categories are used – “no rain” and “rain”. The probability of being in the “upper” category is then simply a probability of precipitation. Over most of the country this redefinition is not necessary, but in the dry climates of the Western United States this is a commonplace occurrence. When what is called a “tercile” is no longer meaningful, this may lead to confusion. Thus, ancillary data (e.g., what the categories

represent) is required to interpret ”tercile forecasts” in dry areas. This deficiency can be somewhat ameliorated by presenting precipitation forecasts as deviations from the climatological probabilities instead of as absolute probabilities as in the ESRL product, but not the CPC official product.
The probability of exceeding a quantitative threshold of precipitation is in many ways a more appropriate quantity for dry areas. Ancillary information can be useful in order to put the information in context. The ESRL product website provides climatological probabilities of precipitation events on the same page as the forecast probabilities, in order to determine whether the forecast probabilities are unusually large of small for such an event.
The skill and reliability of these forecasts depends on the geographical location and on the time of year. Maps of the (cross-validated hindcast) Brier skill score are available on the product website for the reforecast analog precipitation forecasts. These are presented in the same graphical format as the forecasts, although at the coarser 32 km resolution of the NARR (North American Regional Reanalysis) verification dataset. For this product, the skill in the region of interest can be determined. For the CPC 6-10 and 8-14 day outlooks, and for the other products at ESRL, online information about the skill of the forecast, is only available for continental-scale averages.
Through interactions with the USBR/LCO has identified some other specific issues concerning the current presentation of these forecasts on the ESRL website. The forecast maps are presented exclusively in metric units, whereas USBR water managers and many of their stakeholders in irrigation districts and municipal water agencies typically use English units. Providing English units as an option would greatly reduce the complexity of these products. The forecasts are presented using maps that cover a large area (typically at least the conterminous United States). This factor, along with the lack of identifying features (e.g. river basins or topography), make it difficult to read and interpret these maps on the spatial scales of interest to the USBR/LCO. Furthermore, both the CPC and ESRL products could be made more understandable by simplifying the labeling and providing explanatory text that is written for water managers who are usually not trained in atmospheric science. We have also identified
needs for products not in the current product suite at ESRL or CPC, such as longer range outlooks of joint probabilities wind and high temperatures.
6. CONCLUSIONS
Forecasts of conditions in week 2 have high potential for application in management of reservoirs on the Lower Colorado River. However, these forecasts are not yet in formats appropriate to many potential users, in particular, to understand how to reduce the complexity and improve usability of the forecasts. We are working with the USBR Lower Colorado Office (LCO) as pilot case to learn how to improve the usability of these products by reducing complexity and improving the accessibility of the forecasts.
Because USBR/LCO reservoir management challenges and goals are similar in many ways to other large-scale reservoir management across the West, the results on usability of the products are likely to be transferable to other areas. The USBR also works closely with a large number of its own stakeholders in reservoir management, so developing products that support these interactions will provide insight into the needs of a broader community of water managers. Acknowledgements: Funding for this project was provided by the United States Bureau of Reclamation, Lower Colorado Office, and by the NOAA Earth Systems Research Lab. The authors acknowledge the participation of Douglas Blatchford and Bruce Williams of USBR, and the assistance of Gary Bates, ESRL.
7. References T. M. Hamill, J.S. Whitaker, 2006: Probabilistic quantitative precipitation forecasts based on reforecast analogs: Theory and application, Mon. Wea. Rev., in press. T. M. Hamill, J. S. Whitaker, and S. Mullen, 2006: Reforecasts: An important dataset for improving weather predictions. Bull. Amer. Met. Soc., DOI: 10.1175/BAMS-87-1-33 T. M. Hamill, J. S. Whitaker, X. Wei, 2004: Ensemble reforecasting: Improving medium-range forecast skill using retrospective forecasts. Mon. Wea. Rev., 132, 1432-1447.
6
Table 1. Summary of selected NOAA medium range forecast products. Product Lead
time (days)
Coverage/ spatial scale
Probability categories
Surface variables (4)
Notes
ESRL Ensemble Calibrated Station Forecasts
6-10 8-14
US ; 200 stations
Tercile(1) T Tercile(2) P
T,P Calibrated against station observations. Numerical data available.
ESRL Ensemble Calibrated Hemispheric maps
6-10 8-14
N. Hem. 200-400 km
Tercile(1) P, SLP Calibrated against reanalysis fields. Large scale. Also includes free atmosphere variables.
ESRL Reforecast Analog Probabilistic Precipitation
1,2,3,4, 5,6,7 6-10 8-14
US (excl. AK, HI); 5km
Tercile (1) Thresholds: 2.5, 10, 25, 50 mm (0.1, 0.4, 1.0, 2.0 inches)
P Uses 50-75 analogs based on regional matching, Downscaled to 5 km.
CPC 6-10 day and 8-14 day outlook
6-10 8-14
US; large scale features
Terciles (3) T,P Operational. Subjective blend. Text discussion of rationale provided.
CPC Ensemble Calibrated station Forecatst
6-10 8-14
US; selected stations
Terciles (3) T,P CPC version of ESRL product. Blended into CPC outlooks.
HPC medium-range forecasts
3-7 Deterministic (T,P) and 24- hour Prob. of Precip.
T,P,SLP Not the primary focus of this study because of shorter range.
Notes: 1) Total probability of being in that tercile is shown in separate maps. In dry regions these are not strictly terciles (see text); 2) Deviation from the climatological probability of being in the “tercile” category; 3) Summary of terciles presented in a single map; 4) T: Surface temperature. P: Precipitation. SLP: Sea Level Pressure.