p s-2 /1 - world bank research working paper 2165 the russian city reform in i 0 ... of russia, de...
TRANSCRIPT

_P_S-2_/1 v
POLICY RESEARCH WORKING PAPER 2165
The Russian City Reform in I 0 regional capitalsalong the Volga River is
in TranSitiOn associated with favorable
initial conditions. And both
The First Six Years reform and favorable initial
conditions are associated with
in 10 Volga Capitals relatively successfuleconomic
outcomes - except where
Martha de Melo access to extra resources
Gur Ofer improves outcomes or whereweak government
undermines success.
The World Bank
Development Research GroupPublic EconomicsAugust 1999
Pub
lic D
iscl
osur
e A
utho
rized
Pub
lic D
iscl
osur
e A
utho
rized
Pub
lic D
iscl
osur
e A
utho
rized
Pub
lic D
iscl
osur
e A
utho
rized
Pub
lic D
iscl
osur
e A
utho
rized
Pub
lic D
iscl
osur
e A
utho
rized
Pub
lic D
iscl
osur
e A
utho
rized
Pub
lic D
iscl
osur
e A
utho
rized
I POLiCY RESEARC(H WORKING PAPER 2165
Summary findings
After studying the nature and variety of transition in 10 constitutes a major expenditure category for local
regional capitals of Russia, de Melo and Ofer observe government rather than, as in most western cities, a
that: major source of revenue. A transition mi this area alone
* All cities have experienced radical changes in their could revolutionize the finances and independence of
institutions and economies -changes associated on the Russian cities.
one hand with the abolition of central planning and the The jury is still out on what the right social and
introduction of freer markets, and on the other hand industrial policies were during the first years of reform.
with political decentralization and the introduction of Ulyanovsk clearly lagged on market reforms, and Saratov
local elections. represents a model of liberalization without institutional
These changes have led to a wiide diversity in support. Both extremes have failed, but so far the social
economic and social outcomes, reflecting differences in consequences of the Saratov model appear to be worse
the central governrnent's (inequitable) economic relations than those of the Ulyanovsk model.
with regions as well as differing local and regional With the credibility of Russia's federal government-
policies. Most northern cities adopted policies more at an all-time low, foreign investors have no choice but
consistent with the central government's support of free to rely on the competence and reliability of local leaders,
market reforms; most southern (Red Belt) cities pursued especially mayors and governors. They will be looking
more cautious, protective policies. for evidence of accountability in the form of the rule of* City governments are using more proactive law, and transparency in the form of reliable public
economic policies, including interventions to save local information. Information at the city level - oftenindustries. Such efforts highlight the dual nature of the unavailable and not easily accessible -would be veryRussian transition, characterized by a shift in power from useful in attracting local researchers to monitor progresscentral to local government as well as from public to (as a basis for accountability) and diagnose problems (asprivate enterprises. a basis for public policy debate and political decisions).
* A major difficulty facing Russian cities is the cost ofsubsidies to housing and utilities. Real estate in general
This paper - a product of Public Economics, Development Research Group - is part of a larger effort in the group to studythe causes and effects of fiscal decentralization. The project was carried out in cooperation wvith the New Economic School(NES) in Moscow. This is the first of two papers on the Volga cities. Copies are available free from the World Bank, 181 8H Street, NW, Washington, DC 20433. Please contact Hedy Sladovich, room MC2-609, telephone 202-473-7698, fax202-522-1154, Internet address hsladovichaworldbank.org. Policy Research Working Papers are also posted on the Webat http://www.worldbank.org/html/dec/Publications/Workpapers/home.html. The authors may be contacted atrhanrottCa'erols.com or gur.ofer vyale.edu. August 1999. (58 pages)
The Policy Research Workinig Paper Series disseminates the findings of work in progress to encourage the exchan2ge of ideas aboutdevelopment issues. An objective of the series is to get the findings out quickly, even if the presentations are less than fully polished. Thepapers carny the names of the authors and should be cited accordingly. The findings, interpretations, and conclusions expressed in this
paper are entirely those of the authors. They do not necessarily represent the view of the World Bank, its Executive Directors, or thecountries they represent.
Produced by the Policy Research Dissemination Center

THE RUSSIAN CITY IN TRANSITION:
THE FIRST SIX YEARS IN TEN VOLGA CAPITALS*
Martha de Melo
Gur Ofer
Development Research GroupWorld Bank
Washington, D.C.
*
Martha de Melo is in the Development Research Group of the World Bank; Gur Ofer is Professor ofEconomics at the Hebrew University in Jerusalem. The paper is based partly on research undertaken at theResearch Center of the New Economic School in Moscow and on a separate database developed with theassistance of Michael Haney and Plamen Yossifov. Both efforts were financed by the World Bank, andthe authors greatly appreciate the contributions of those involved. They also thank Dan Berkowitz, LevFreinkman, Philip Hanson, Tim Heleniak, Andrei Markov, John Mikesell, and Valery Nekhaev for theircomments and assistance.


I. INTRODUCTION
In this paper we look at the nature and variety of transition in ten regional capitalssituated along the Volga River. Under the old regime cities were at the lowest level of theplanning hierarchy, and they played an obedient and virtually uniform role. Now,although federal and regional politics are still predominant, many regional capitals andother large cities have gained some autonomy and started to develop independentmunicipal policies. Our approach is to first look at differences at the local level in initialconditions and in the pace and pattern of reform. By providing comparative rankings, wethen suggest how such differences may have affected socioeconomic outcomes. Thus,our focus is on the role and comparative experience of cities, as microcosms of change.
Information on Russian regions, or "federation subjects", is available withincreasing ease. Goskomstat published a two volume statistical document on "Russia'sRegions" in 1997, and Bradshaw and Hanson 1998 provides a convenient review of theEnglish-language literature on political, economic and social transition in the Russianregions. No detailed national statistics for regional capitals have appeared, however,since the publication of Socioeconomic Statistics of Capitals of Republics, Krais andOblasts of the Russian Federation (1994). As a result, data at the city level-with theexception of Moscow and St. Petersburg-are scant and difficult to come by, and littleresearch has been undertaken.
For this study, we draw on a variety of Russian and international sourcesincluding local statistical bulletins, news articles, and unpublished case studies and otherpapers by Russian researchers, as well as better known and more accessible publishedmaterials. Initial conditions are defined as of 1990, the last year of relative stability inprices and institutions before the 1991/92 political and economic upheavals. The latestcomprehensive data are for 1996, permitting an evaluation of the first six years oftransition. For those who know Russia, a cautionary word about the reliability of datamay not be necessary. For others, we acknowledge such difficulties as problematic pricedeflators and alternative values for the same variable found in different sources.
Our findings, which we characterize as concluding hypotheses, are that reform isassociated with favorable initial conditions and that both reform and favorable initialconditions are associated with relatively successful economic outcomes. The exceptionsare typically where access to extra resources enhances outcomes or where weakgovernment undermines success. We note that the association between reforms andoutcomes would be even stronger were it not for time lags and the lack of comprehensiveindicators other than the average wage to measure economic outcomes. As might beexpected, the five Red Belt cities have been more cautious on reform and less successfulin economic outcomes than the other cities, but exceptions exist to this generalization. Inparticular, Saratov and especially Volgograd are more reformist and appear to beinfluenced by a growth pole led by Kazan and Samara.
Section II below looks at initial conditions in the Volga capitals in 1990, shortlybefore the break up of the Soviet Union. Available data suggest that in many ways thesecities were not very different from the Russian average and not dramatically different
I

from each other. Variations in the importance and structure of industry did exist,however, and could have been expected to affect success during the transition to a marketeconomy. Section III focuses on differences through 1996 in specific economicpolicies-namely, price controls, fiscal policies, privatization, and business development.In order to place these policies in context, we review in Section IV the nature of politicalchange and the role of local politics in policy formation. Section V presents the availableindicators of economic and social outcomes and the implied changes during the first sixyears of transition. And finally, Section VI explores the relationship between initialconditions, policies and outcomes and offers some general observations about transition,based on the experience of these ten regional capitals. A brief discussion of partial dataavailable for 1997 and 1998 adds a more recent perspective to this evaluation.
II. INITIAL CONDITIONS
The Volga cities included here stretch from northwest of Moscow to the Caspiansea (Figure 1) and span three of the 11 traditional areas of Russia-Tver and Yaroslavl(Central Region); Nizhny Novgorod and Cheboksary (Volga-Vyatka Region); and Kazan,Ulyanovsk, Samara, Saratov, Volgograd, and Astrakhan (Volga Region). The VolgaRiver has been a north-south trade route for many centuries, and there is substantialsimilarity among the cities. All the Volga cities are old cities with deep historical andcultural roots, several first established in the 11th (Yaroslavl), 12th (Tver) and 13th(Nizhni) centuries. Each one is the capital of its region and has a population of 0.4 to 1.4million people; typically the capital accounts for about a third of the region's population.Historical access to similar information, technology, and cultural influences suggests thatthere would be less diversity in the experience of these cities than cities more varied insize or more widely dispersed across the Russian Federation.
Tables 1 and 2 present a variety of information on the Volga cities as of 1989/90,these being years of relative stability and therefore a useful point of departure. Cities areordered from top to bottom according to their location along the Volga River. Lookingfirst at Table 1, five of the cities are relatively large, around a million population, and fiveare smaller, close to a half million. City per capita incomes are not known, but averagemonthly wages in the cities were very similar in 1990, and slightly below the Russianaverage. The highest average wages (Saratov and Tver) are less than 5 percent above thelowest (Samara and Cheboksary), and available data on living standards fail to reveal theexistence of any clear hierarchy in the standard of living. 1 For example, the lowestinfant mortality is found in the city of Cheboksary, which also has the lowest per capitatrade in consumer goods and services. Only Samara seems to stand out as unfortunate,with the highest infant mortality and a low per capita trade in consumer goods andservices. This observed uniformity in the standard of living among the Volga cities mustsurprise even experienced Soviet "hands".
IMonthly wages at the regional level, which are typically lower than wages in the capital city, have aspread of less than 10 percent, but per capita regional income shows a variation of close to 25 percentbetween Yaroslavl Oblast, with the highest income, and Chuvashia. The higher income variation isexplained in part by lower employment rates for the total population in Chuvashia.
2

Although most Volga cities were major industrial centers with many large finns,the size and structure of industry varied substantially. Industrial employment shares,shown in Table 1, were particularly high in Cheboksary, Kazan, and Ulyanovsk and lowin Astrakhan and Tver. Major sub-sectors by city were as follows:
* Energy, petrochemicals, and chemicals: Volgograd, Yaroslavl, Samara, Saratov,Kazan.
* Military manufacturing and research: Nizhny, Kazan, Samara, Saratov.
* Machine-building: Ulyanovsk and Nizhni (cars); Volgograd and Cheboksary(tractors); Saratov and Kazan (planes); Astrakhan and Yaroslavl (ships).
* Metallurgy: Volgograd.
e Consumer goods (textiles, food industry): Astrakhan, Tver, Cheboksary.
Table 2 gives a more detailed breakdown of the Volga cities' industrial structure,based on the industrial census of Russian enterprises in 1989. The wide differences insize and structure of industry are likely explanations of diverse outcomes, given the manysevere shocks suffered by industry during transition. One shock was the 1992 priceliberalization, associated with opening the Russian internal market to international trade.It resulted in a large increase in the relative price of energy and other raw materials thatin turn raised input costs for heavy industry. A second shock was the drop in centralgovernment procurement orders, which affected the demand for military production andresearch, construction and industrial machinery, as well as cars and planes for civilianuse. A third shock was the disintegration of the pervasive distribution network organizedby the center. Most enterprises had no internal sales departments or marketing strategies.On the supply side, competition from imports affected all sectors, but especially lightindustry, as the domestic variety and quality of textiles, leather and other light industrygoods was poor, in part due to obsolete equipment. Using an ex post analysis of changesin quantity, price, investment and employment, Ivanov 1998b shows that light industryand machinery/metal-working became the two least competitive sectors in Russia as awhole.
Two other characteristics reveal substantial differences among the cities, but theirimplications are not clear. One is the share of defense employment in total industrialemployment, which was high in Nizhni, Kazan, and Samara. On the one hand, defenseindustries present a huge task for restructuring; on the other hand, the high level ofhuman capital associated with defense industries would seem to provide an advantage.Nizhni was classified as a closed city during most of the Soviet era, and restrictions toforeigners also applied to Saratov, Samara, and Volgograd, presumably because of thesensitivity of the type of military production there. The other characteristic is a strongagricultural base. Taking the ratio of agricultural to industrial production in 1995 as anindicator, four cities-namely, Tver, Cheboksary, Saratov, and Astrakhan-are located inregions with a relatively strong agricultural base. Is this an advantage or a disadvantage?On the one hand, relatively high inter-regional transport costs mean that a strong
3

agricultural base can help keep low food prices in the capital city and promote lowindustrial wages. On the other hand, agriculture is generally unreformed and cash poor,adding additional pressure on available public revenues. In our initial evaluation, we willassume the advantages and disadvantages of these two characteristics are offsetting.
Finally, some particular advantages should be mentioned. Two regions, namelyKazan and Saratov, have favorable natural resources (primarily oil) at the regional leveland might be expected to exploit such resources more aggressively under a marketeconomy.2 Nizhni, Samara, Yaroslavl, and Tver all have a favorable geographic locationat the intersection of important rivers, roads, rail lines and (for Samara) pipelines.Nizhni, for example, was famous in the 19th century for its annual fairs, revived in 1991.As of 1990, however, neither these nor other initial conditions discussed above appear tobe associated systematically with indicators of living standards, namely infant mortalityand per capita availability of consumer goods and services.
What might be the expectations of success based on these initial conditions?Table 3 provides a ranking based on four criteria:
* Low share of industrial employment in the urban labor force (low is under 35 percent;high is over 45 percent).
* Low share of industry in the two least competitive sectors, light industry andmachinery/metalworking (low is under 40 percent; high is over 60 percent).
* Low industrial concentration (low is under 25 in any one sub-sector; high is over 45percent).
* Special advantage from location or natural resources.
Based on these criteria, Cheboksary and Ulyanovsk would be expected to encounter themost severe problems with adjustment during transition. Nizhni and Kazan would beexpected to perform significantly better, but worse than the five cities receiving a rank offour. Saratov, with a rank of five, stands out as having an edge on success.
III. ECONOMIC POLICIES
During the early years of transition, cities evolved from a center for purelyadministrative activities to a locus for incipient policy formation. But the degree ofindependence varied among cities as well as over time; and by end-1996 it was in factstill difficult to distinguish city policies from region policies, particularly in the republics.Thus our indicators of "city policies" will inevitably reflect regional influence, if notcontrol. Nevertheless, we look here at four policy categories where cities have at leastsome leeway: pricing, fiscal policy, privatization, and support for business development.For this last category we use indicators of small-scale enterprise development and foreign
2 Rich gas and oil deposits were discovered in Astrakhan in 1994, but this discovery would not affect theperiod considered here.
4

investment. A summary ranking of cities by policy reform is provided and followed by adiscussion of the underlying political landscape.
Pricing
During the Soviet era, government subsidies reduced consumer pricessubstantially below costs in two main categories: food products and services, includinghousing/utilities/public transport, as well as cultural, household and personal services.Food prices were reduced through heavy subsidies to the agricultural sector. Rent andprices for utilities and public transport were reduced by explicit or implicit governmentsubsidies and by direct provision of housing and utilities by enterprises. Underlyingsubsidies were provided through low energy prices.
The 1992 price liberalization eliminated subsidies from the center for almost allmarketed goods, including most food products. Local governments tried to maintain lowfood prices by a variety of methods, many with adverse budget implications. Meanwhile,although prices for municipal services rose, the rate of subsidization actually increasedbecause of high general inflation and a rise in the relative price of energy. The resultingbudgetary pressure forced local governments to gradually give up some controls andincrease the extent of cost recovery. Direct pressure from federal and regionalgovernments, the development of black markets, and difficulties in maintaining localautarky also reinforced this trend. By 1997, most but not all price controls for marketgoods were removed.3
Food prices. Methods for controlling food prices have included: restrictions onexports to other regions (Ulyanovsk, Saratov), despite a federal decree that forbade suchrestrictions; administrative price controls; ceilings on production profits and trademarkups (Ulyanovsk, Astrakhan, Yaroslavl); and requirements for enterprises to supplypart of their production at lower prices, sometimes as an offset to taxes. With pricesbelow market clearing levels, rationing was necessarily introduced in a number ofplaces.4 The Volga cities, and corresponding regions, were part of this process, but eachregion and city implemented its own specific policies in accordance with its ideology,ability and perceived needs.
3The topic of price control on marketed goods, especially food, is covered in many papers, includingBerkowitz (1996), Berkowitz and DeJong (1998), and de Masi and Koen (1996).
4More recently, local officials have used restrictions, including taxes and quality requirements, on regionalimports to keep prices higher; the most common example is restriction of vodka sales in such areas asTatarstan, Nizhni, and Tver. Here the objective is to protect producers, typically public enterprises, ratherthan consumers.
5

Prices in Ulyanovsk city were clearly lower than elsewhere, with VoIgograd alsoshowing the effects of extensive price controls. Nizhni and Samara had the highest prices,with prices in Saratov, Cheboksary and Kazan falling in-between. At the local level,price subsidies have been typically financed from extra-budgetary funds. Special taxes,including those on new businesses, covered part of the cost. In order to control for over-consumption, Ulyanovsk also developed a very elaborate rationing system that wasabolished only in July 1996.
But direct food subsidies have also been partially financed at the regional level.In Ulyanovsk, for example, food subsidies absorbed more than half of the regionaladministration funds for social protection, thus accounting for 5 to 10 percent of thebudget at that level. More commonly, regional governments have devoted a large shareof their budget to agricultural subsidies as a complement to direct price controls, althoughsuch support partially reflects the relative size of the agricultural sector in the region. Thelargest supporters of agriculture, as indicated by expenditure shares in the regionalconsolidated budget for 1995-96, were Tatarstan (18 percent) and Ulyanovsk (16percent), compared to a Russian average of about 16 percent. And Tatarstan had alreadyreduced its state order for grain to 70 percent of production, allowing farmers to sell onthe local market, because agriculture was previously absorbing 25 percent of the regionalbudget. Although providing little or no direct price controls on food, Saratov spent arelatively large amount (13 percent) on agriculture, partly as direct state investment, andalso imposed export restrictions to reduce food prices.
Other prices. Of course, food prices are not the only prices subsidized orotherwise controlled. Appendix Table 5 gives prices of basic municipal services as ofend 1996 in 8 Volga cities. On average and with the exception of natural gas, Ulyanovskprices are again at the lower end of the spectrum. Kazan's remaining price controls arefinanced in part by large subsidies to important state enterprises. Prices appear to behighest on average in Niznhi.
Overallprice controls. Baranchuk 1998 provides three alternative rankings ofprice controls in the Volga cities: the proportion of goods and services under pricecontrol; the severity of the price control method; and deviations from the national averageof a comprehensive ranking based on direct price subsidies, fixed or maximum prices,rationing, limitations on food industry profitability and price mark-ups (Table 4).5 Allthree rankings show that-with the exception of Saratov, vvhere price controls have beenreduced-the "Red Belt" regions have the highest price control. The five "Red Belt"regions, defined as favoring the Communist Party candidate Zuganov over Yeltsin inboth 1st and 2nd rounds of the 1996 presidential elections, are Astrakhan, Volgograd,Saratov, Ulyanovsk and Cheboksary.
5These rankings were originally provided in TACIS 1996 as regional indicators, however the surveys weretaken in the capital cities.
6

These rankings are corroborated by data in Appendix Table 6. The cost of astandard set of 25 basic food items in Ulyanovsk was still the lowest of the Volga capitalsin 1996, although by 1997 it was only slightly below costs in Kazan and Cheboksary. Thehighest costs were in Samara in 1996 and in Samara and Astrakhan in 1997, althoughtheir prices were still slightly lower than the Russian average. Berkowitz and DeJong1998 show that substantial inter-regional price differentials can be explained by supplyand transportation costs, but very large differences, such as between Ulyanovsk or Kazanin the middle Volga and Saratov or Astrakhan further south, clearly result from food-price controls.
Appendix Table 6 also shows the cost of the monthly subsistence minimumcalculated for the regions starting in 1994. Although varying in its composition amongregions, this measure is of interest as it covers a broader category of expenditures than the25 food items. Both measures show that costs are highest in Samara and lowest inUlyanovsk. They also show that prices are relatively lower in the cities of Astrakhan andVolgograd than in their surrounding regions and relatively higher in Nizhni than in itssurrounding region. This difference is consistent with the city rankings on price controlsshowing higher price controls in Astrakhan and Volgograd than in Nizhni. In Section IV,the broader basket will be used as an alternative deflator to the regional CPIs foroutcomes measured in current rubles.
Fiscal Policy at the Municipal Level
Under the soviet regime, cities had no independent policy authority, but theynevertheless provided consumer goods and services such as food markets, laundries, andtheaters. And they had primary responsibility for public services. Even so, some publicservices, such as education (primarily kindergartens), health, housing, utilities, and evensome public transportation and road building fell under the responsibility of largeenterprises operating in the cities. In most cases, the enterprises provided these servicesonly to their employees, but sometimes, as in transportation, the enterprises providedservices for the entire population. The evolving role of fiscal policy in the Russian city isdiscussed in more detail in de Melo, Ofer and Yossifov 1999. Here, we focus on a smallnumber of fiscal policy indicators of reform.
Revenue issues. In fact, it is quite difficult to identify useful indicators. On therevenue side, there are three main sources: shared taxes, transfers, and own revenues.None is a clear indicator of fiscal policy at the municipal level. Shared taxes depend onthe annually negotiated sharing arrangements between the city's surrounding region andthe federal government, as well as on the sharing arrangements between the region andthe city. City officials may influence such arrangements, which vary across regions andcities; but they do not control them. They are sometimes revised during the course of theyear, but less frequently in recent years.. Similarly, city officials have little control overtransfers from higher levels of government. It is likely that cities put more effort intocollecting taxes-such as income and property taxes-that allot them high shares.
The third source, own revenues, is relatively small and may be maintained offbudget. Mitchneck 1994, for example, shows that extra-budgetary funds accounted for
7

an estimated 11 percent of all expenditures by the city of Yaroslavl. The incentives forcities to operate extra-budgetary funds are to maintain legal control and to hide the size oftheir resources from regional authorities that might otherwise reduce their tax shares. Asdocumented by Mitchneck, such funds are financed by fines, revenues from privatization,rental of municipal property, profits from direct economic activity, and carryover from aprevious year budget surplus. Zhuravskaya 1998, however, finds that extra-budgetaryfunds are either very small or non-existent at the local level, partly because there are nostable sources of revenues for such funds. Acknowledging some ambiguity in themeaning of the size of own revenues on budget, we nevertheless use such revenues fromproperty and other taxes as an indicator of municipal tax effort and hence municipalreform.
Expenditure issues. The major categories of expenditure are "national economy"and public services such as education and health. National economy expenditures areassociated with the functions of the former soviet government, which supportedproduction through subsidies and also subsidized housing and utilities to middle-incomefamilies. A declining ratio of expenditures on "national economy" to expenditures onhealth and education has been seen by some as reflecting an important aspect of reform inRussian cities (Zhuravskaya 1998, Halligan 1995), but it is not an unambiguous indicator.This is because it is not always clear whether the subsidies under national economy arethe old style production and housing subsidies or more recent attempts to compensateenterprises for their support of social services. Social spending by Russian enterprises oneducation and health, as well as on public housing and transport, was large prior totransition, representing as much as 20 percent of gross wage costs (Freinkrnan andStarodubrovskaya 1996). The transfer of such social spending from enterprises tomunicipalities is an important aspect of reform, but the acceptance of financialresponsibility for these services by municipalities prior to the transfer was also important,hence the ambiguity.
Another problem, making budgetary expenditures difficult to assess, is thevaluation of revenues and expenditures made in kind. At the regional level, budgetarynon-cash revenues for the first 10 months of 1997 ranged from a low of 6 percent inMoscow City to a high of 76 percent in Chuvashia (MFK Renaissance 1998b, p. 22).Most of the Volga regions had non-cash revenues of around 50 percent; the size of non-cash revenues and the particular prices chosen to apply to in-kind transactions haveimplications for city as well as regional budgets. Typically prices chosen to value in-kindtransactions are some multiple of the market price and so tend to inflate these budgets.
Indicators of reform. As adequate budgetary data are not available for individualcapital cities, we rely on budgetary data for Cities under Regional Jurisdiction (CRJs),supplemented by specialized reports, to detect changes in municipal finances. CRJs aretypically cities with more than 25,000 people (see Appendix Table 2 for CRJ populationby region). They are strongly affected by the capital cities, which in 1996 accounted onaverage for 62 percent of the CRJ population, although this varies by region.
CRJ data are used to obtain the two indicators of fiscal reforrn shown in Table 5.The "tax effort" indicator is calculated as the per capita collection of "property tax" plus
8

"other taxes" by CRJs in 1996 as a percent of the annual wage in the capital city.6 Citiesretain 50 percent of the property tax and so have a strong incentive for collection; othertax shares are much lower. And cities retain a hundred percent of "other taxes", whichthey initiate. Thus high collections of these taxes are likely to indicate a pro-active cityadministration. Interestingly, the highest tax effort occurs in Saratov with one of thelowest wages and in Kazan with one of the highest wages. The lowest tax effort is inAstrakhan. High taxes can of course discourage business activity, but own revenues donot make a large difference in the overall tax burden. Poor tax design and collectionmethods are likely to be reflected in the indicators for favorable business environmentdiscussed below.
The "housing subsidy burden" is calculated as the per capita housing subsidy inVolga CRJs in 1996 as a percent of the annual wage in the capital city. Unlike "taxeffort", which is seen as a reformist policy, a high housing subsidy indicates a laggingeffort to reduce undesirable subsidies for mostly middle-class housing and utilities. It canalso indicate lagging housing privatization, as privatization reduces the burden. The"housing subsidy burden" indicator is highest for Saratov and lowest for Ulyanovsk andCheboksary.
Privatization
City govenuments were responsible for privatization of their housing stock and ofsmall and medium enterprises. Privatization rates are therefore an indication of localgovernment efforts to establish competitive markets with clear property rights. Housingprivatization also helps relieve some of the fiscal burden of cities.
Housing privatization. As a result of the first wave of apartment privatization, theownership structure of city housing changed radically. In Samara, for example, half thehousing stock in 1991 was owned by enterprises and more than a third by the city; only15 percent was in private hands-individual townhouses, rural houses incorporated intothe city as it expanded over time, and cooperatives. By 1996, half the housing stock wasprivate. But privatization rates are actually a better indicator of privatization policy thanownership structure, because of variations in the initial level of private ownership. Table6 shows that by 1996 the Russian average of 36 percent for housing privatization wassurpassed only in Volgograd. It was almost achieved in Nizhni, Astrakhan, and Tver,followed by Saratov, Samara, and Yaroslavl. Cheboksary, and especially Kazan andUlyanovsk, trail far behind.
Small-scale privatization. Most Volga cities privatized their small-scaleenterprises early (I 992-93). The most common initial approach was to lease shops orsmall companies, often with an option to buy; many lessees exercised this option. Afterseveral years, tenders and auctions were used to achieve privatization. In Nizhni,Volgograd, Samara, Yaroslavl and Tver, international agencies, such as the IFC, theEBRD and the EU, were involved in privatization, and privatization proceeded relatively
6Non-tax revenues are excluded from this measure as it is somewhat arbitrary whether such revenues areincluded in the budget or maintained off-budget; in any case, they are small.
9

quickly. In Ulyanovsk, small-scale privatization started later than most Volga cities, withthe main wave occurring in 1994-95. And in Cheboksary, only 58 percent of the originalmunicipally owned enterprises were reported as privatized by mid-1997. There are,however, no readily available, comparable statistics for all the Volga cities on small-scaleprivatization, although cities that privatized early and quickly are likely to score well onthe indicator for small enterprise development discussed below.
Support for the Business Sector
City governments are partly responsible for the creation of a friendly andsupportive environment for business sector development. Such an enviromnent typicallyincludes a variety of activities that are difficult to measure, much less to rank, includingencouragement of banking and other financial services, regulations for registration andlicensing of business activities, business information and training, and support for large-scale enterprises, whether or not privatized by federal or regional authorities. Someindicators, such as the tax regime, are inappropriate in that they are largely dictated byfederal and regional governments. Here we use the number of small enterprises per 1000residents and foreign investment as indicators of city support for the local businesssector.
Small enterprise development. Since 1991, there has been an explosion ofregistered businesses all over Russia. Some were new independent businesses, and otherswere small and medium enterprises privatized by the city government. The growth ofthese two categories depends in part on local govermnent privatization policies. Inaddition, many small businesses were not registered at all (see, for example, Yakovlev1998). According to most statistics, between a half and two thirds of all small businessesare in trade and restaurants, and the rest are divided between consumer services,manufacturing and construction. Most of them are therefore the market network itself.
The regional data on small enterprises per thousand residents is considered anadequate proxy for local government support for small businesses, since most small-scaleenterprises are in the cities. Additional data on the total number of enterprises andorganizations by region are given in Appendix Table 7. During the last years of theSoviet Union, 1990-91, most Volga regions had about two enterprises per thousandpeople, resembling almost a "planning norm". Only Nizhni and Samara deviate on thelower end with significantly less enterprises, and Tver on the upper end with significantlymore. By 1996 the total number of enterprises was at least five times higher across theboard, and particularly high in Samara, Volgograd and Saratov. Samara, and Volgogradregions, together with Yaroslavl, also led in the number of small enterprises. Thelaggards were Ulyanovsk, Chuvashia, and Tatarstan and also, surprisingly, Tver andNizhni. As can be seen from the table, some Volga regions have more enterprises thanthe Russian average, and most other regions are near the average. And yet the Russianaverage, even the Moscow average, is not considered high by East European standards(Frye and Shleifer 1997).
As with other indicators, the small enterprise indicator must be interpreted withcaution. Most Volga regions show a decline in the number of small enterprises during
10

1996, possibly because of consolidation of registries. In any case, Hanson 1997 pointsout that the changes between 1990 and 1996 are difficult to interpret, as many of the stateshops providing local goods and services were not separate accounting units during theSoviet period. Hanson also notes that house building in the countryside around the citiesof Samara and Togliatti and new business and consumer services such as travel agenciesand cafes are extensive, but the regional Goskomstat has no information on suchdevelopments.
Foreign investment. Foreign investment, particularly in the form of realinvestment in joint ventures with a local producer, can be an effective vehicle forenterprise restructuring (see city case studies on Samara, Ulyanovsk, Volgograd, andKazan). In addition to financing, which is scarce and costly in Russia, foreign investorsbring with them modem technology, modem management and ready-made export lines.By the end of 1996, Moscow alone had more than half all the joint ventures in Russia andhad also received about 70 percent of the cumulative foreign investment, includingportfolio investment. While it is true that some Moscow joint ventures benefit, or eventake place in, other regions, there is no question that the regions are less attractive toinvestors.
In the Volga region, foreign investors are attracted by oil, gas, petrochemicals,aerospace and automotive industries. However, actual investment appears to reflect thelocal business environment as much as the presence of such assets. Nizhni quicklygained attention by attracting foreign investment and international support for enterpriserestructuring and early privatizations; but Samara and Tatarstan appear to have matched,if not overtaken, Nizhni in offering a favorable business environment and good publicrelations. Since January 1995 Tatarstan provides exemption from local profits andproperty taxes for 3 to 5 years to companies with at least 30 percent foreign equitytotaling $1million or more. It also authorizes foreign investors to own land andbuildings. President Shamiev is trying to attract domestic as well as foreign funds byfloating special investment and oil bonds and selling government equity stakes inindustrial companies. In Samara, local government officials welcome foreignbusinessmen enthusiastically and describe themselves as facilitators rather thancontrollers of business partners. Astrakhan also has substantial international contacts, butforeign investmnent remains low.
Available data show that Tatarstan and Nizhni regions received the most foreigninvestment per capita in 1997, followed by Samara (Appendix Table 8). Yaroslavl,Volgograd and Saratov received about half the Russian Federation average, whileAstrakhan, Ulyanovsk, Chuvashia and Tver receiv-ed very little. Nizhni and Tatarstan alsoshow the highest regional output by joint ventures (also Appendix Table 8), followeddistantly by Yaroslavl, Saratov and Volgograd. The lowest number ofjoint ventures andtheir lowest real outputs are in Chuvashia, Tver, Ulyanovsk and Astrakhan.7
7Since early 1995, Tver region has provided a five-year exemption from profit, property and land taxes toprivate investors. Ninety percent of the region's joint ventures are located in the city of Tver, which hasparticipated in a number of foreign supported projects aimed at the transforming the city to be compatible
11
Available city data for 1995 and 1996 in Table 6 show that typically the capitalreceives higher foreign investmentper capita than the region as a whole, although this isnot the case for Kazan and Samara where some of the largest enterprises are locatedelsewhere. Of course, foreign investment can vary substantially from year to year, so wealso looked at studies that have ranked the general investment environment in Russianregions. All put Samara, Tatarstan, Nizhni and, more recently Saratov, at the top of thelist, followed by Yaroslavl Volgograd and Tver, with Ulyanovsk, Chuvashia andAstrakhan at the bottom.8 This ranking generally substantiates the use of the foreigninvestment indicator as a proxy for favorable business environment.
Overall Ranking On Policy Reforms
Table 7 provides a rough ranking of policy reform and also cities, concentratingon indicators for which some comparative data are available. The comprehensiveBerkowitz/Baranchuk indicator is used for price liberalization. Tax effort and "housingsubsidy containment" (the inverse of the "housing subsidy burden" in Table 5) are usedfor fiscal policy reform. Housing privatization, number of small-scale enterprises per1000 residents and foreign investment levels are used as indicators of support for localbusiness development. The rankings in the right-hand column suggest that Yaroslavl andSamara are the most active reformers, followed by Tver, Nizhni, and Volgograd. Kazanand Saratov are in the middle, less reformist than those just mentioned but more refonmistthan Cheboksary and Astrakhan. Ulyanovsk is at the bottom of the list.
IV. THE UNDERLYING POLITICAL LANDSCAPE9
Since independence in late 1991, the political power of Russian regions, and alsocities, has increased substantially. Initially local heads of government were appointed, butcentral legislation provided for democratic elections of governors, mayors, regionalparliaments, and city councils. The regions, and among them the republics, led the waywith Tatarstan holding presidential elections in June 1991 and Chuvashia holdingelections in 1994. For the Volga oblasts, political decentralization gained momentum inDecember 1995, when Nizhni, Tver, and Yaroslavl joined nine other oblasts for the firstgubernatorial elections allowed by Yeltsin. These regions were expected to retainYeltsin's appointees in office, and they did. The transition to democratically electedleaders was completed in all the regions by early 1997.
As of August 1997, six of the ten surrounding regions of the Volga capitals hadsigned a bilateral "power-sharing" agreement with the federal government. The first wasTatarstan, and the five others in chronological order are: Chuvashia, Nizhni, Tver,
with a market economy.
8 See for example Expert 1996 and MFK Renaissance 1998. Volchkova (1997) reports 212 joint venturesin Samara, as well as high involvement of large Western companies (Nestle, GM, Corning), and loans fromboth the World Bank and EBRD.
9This section draws on information from news reports, city case studies, MFK Renaissance (1 998b),Zlotnik (1996), and Friedgut and Hahn (1994).
12

Saratov, and Samara. Typically such agreements cover budgetary relations, stateproperty, regulation of branches of industry such as defense or agro-industry, ownershipand use of natural resources. Both political and economic factors lie behind the impetusto conclude them. Tartarstan negotiated the greatest degree of independence and has beenable to retain more than 80 percent of the taxes collected in its territory (OECD 1997)."Surplus" regions such as Samara, Nizhni, and Tatarstan that did not depend onbudgetary transfers from the center, became even stronger.
Independence of Cities
Before 1996, most mayors were appointed by regional governors, withconfirmation by the city council and then by the regional assembly. The most notableexception was Samara, where the first freely contested elections for mayor and citycouncil took place in June 1994. Sysuev, the incumbent, was elected and then reelectedin 1996, both times with a substantial majority. His independent political mandateaffected the relationship between the city and regional administration, so that Samaraunder Sysuev was relatively independent. Cities such as Saratov, Ulyanovsk, Yaroslavl,Kazan, and Cheboksary were much less so.
On balance, the independence of cities appears to be increasing. As oneindication, surveys in Samara in 1994 and 1996 showed a dramatic increase in thepercent of citizens saying city authorities have more influence on local developmentsthan regional or federal authorities (Romanov and Tartakovskaya 1998). The reality is, ofcourse, that elections have given local officials a local power base, with which they canwork to resist pressures from the region or the center. The increasing influence of localbusinessmen is probably a positive development in that politicians are encouraged to bemore pragmatic, but in some cities mayors have allied themselves to some factions withinthe business community, thereby angering others. Councils in cities such as Nizhni,Tver, and Yaroslavl are made up of many small interest groups, making governance moredifficult.
Common Characteristics of Local Leaders
Who are these local leaders and what characteristics do they demonstrate? Table8 provides a list of governors and mayors of the Volga regions and capital cities, withindications of their political orientation. Two common characteristics can be observed.First, many of these leaders are strong, authoritative personalities, adept at publicrelations and image-making. And this characteristic spans the entire political spectrum.It includes conservatives such as Goryachev in Ulyanovsk and Shabunin in Volgograd. Itincludes reformers such as Nemtsov in Nizhni, Titov in Samara and Lysitsin inYaroslavl. And it includes more recently elected populists such as Limanskii in Samaraand Sklyarov in Nizhni.
Second, many successful local leaders have avoided association with any politicalideology in favor of a more pragmatic approach, including a "hands on" involvement inthe local economy. At the city level, Samara's Sysuev campaigned successfully on thebasis of his business skills rather than any specific policies or political affiliation. In
13

Kazan, most of the city council members are directors of enterprises, and polls show thatthe electorate has become increasingly apolitical. At the regional level, Fyodorov ofChuvashia campaigned as a "rule of law" advocate in a region with strong ethnicallybased political positions. And Samara region's Titov, a member of Our Home is Russia, iswell known for his pragmatism and professional skills.
Implications for Reform
At the regional level, reform may be as much a means to an end as an end initself. Malyakin 1997 says Volga regions can be classified into two groups. In the firstgroup, the governor forms a "power pyramid", or alliance, with the center and is acceptedby the local elite. He is rewarded by the center represented by Yeltsin with virtualautonomy, providing a bias in favor of reform.10 This occurred in Samara and Nizhniunder Nemtsov, although Nemtsov complicated the model by becoming a self-publicist.The two republics, Tatarstan and Chuvashia, also belong to this group. The second groupis characterized by weak leadership and thus leads to meddling by the center. Saratov iscited as an example of the second group prior to the appointment in early 1996 ofAyatskov, who brings Saratov into the first group.
The two-group analysis helps to explain the political evolution of some of the"Red Belt" regions. A quick look at Table 7 shows that the five Red Belt cities(Astrakhan, Volgograd, Saratov, Ulyanovsk and Cheboksary) have on average followedthe conservative political orientation of the local population and have undertaken far lessreform than non-Red Belt cities. But Volgograd under Shabunin and more recentlySaratov under Ayatskov have broken out of the traditionalist mold, with more progressivereform profiles similar to those of Nizhni and Kazan. Volgograd gets high marks onreform for small business development and housing privatization. Saratov has been aleader in price liberalization and local resource mobilization. And Saratov region electeda non-communist duma at the end of 1997 and is leading in breakthrough land legislation.It may be deserting the Red Belt in terms of some market reforms, but these reforms areachieved through authoritarian means normally associated with conservative policies.Moreover, the stick of the hard budget constraint in Saratov has not been balanced by thecarrot of good government, which needs to create the right institutional setting andservice support for businesses. Recently Saratov received the lowest rank of six Volgacities on business environment and municipal services from a small survey of businesses,and it is unlikely that governance was better in 1996.11
At the city level, elected mayors begin to differentiate themselves more clearlyfrom the regional leadership starting in 1996. Where differences emerge, the cityleadership appears to be somewhat more reform-minded. This is the case, for example, inUlyanovsk where Marusin won the race for mayor over Ermakov in 1996 partly becausehe was seen as more independent of the governor. Chekov, the communist mayor of
IO Still, some attempts of assertive independence, such as Volgograd's attempt to introduce its own taxes,were successfully quashed by the center.
See de Melo, Ofer, and Yossifov (1999).
14

Volgograd is more refonn-oriented than Maksyuta, a communist who in 1996 defeatedShabunin, the previous governor of Volgograd oblast. Shabunin was initially moderatetraditional but became increasingly autocratic as the economy deteriorated and orthodoxcommunists came to power. Tver may be seen as intermediary, with Belousov popularbut constrained.
The prevalence of pragmatism over ideology can favor market reforms. In somecases, it allows governors and mayors to be sometimes more reform-oriented than the citycouncils or regional assemblies with which they work. At the city level, Volgograd'sChekov, a communist, is more reform-oriented than the city council, and Ulyanovsk'sMarusin is leading the city toward more democracy and more focus on businessdevelopment. At the regional level, Guzhvin of Astrakhan, a non-communist andpragmatist, works with a communist-dominated regional assembly. But pragmatism doesnot always work in one direction. Resource-rich Tatarstan can better afford continuedsubsidies than most of the other regions, a pragmatic consideration. And so Kazan hasbeen only moderately progressive on price liberalization, privatization and containmentof housing subsidies.
Democratization
With few exceptions, local administrations still rely on authoritarian power andcentralization of operations-the "old ways" of governance. Many elected officials heldimportant local positions under the old regime and were appointed to their positions a fewyears before the elections took place. Even when new faces were elected, much of theadministration consists of former bureaucrats who mostly continue to run things asbefore. There is little positive correlation between reformist mayors and a democraticmode of governance. Some of the most successful mayors, and governors, have been ofthe Luzhkov type in the eyes of the people, as well as of foreign investors.Democratization and the pursuit of the "right" policies are still two different matters.
One aspect of authoritarianism is media control. At one extreme, Samara,perhaps the most democratic of the Volga cities, has experienced rapid development of itsmass media. It has about a hundred local newspapers and a dozen local magazines, inaddition to the national papers, and three local private TV stations and six private radiostations, in addition to national and local-government stations. At the other extreme, onlylocal, primarily government-owned newspapers are read in Volgograd and Ulyanovsk,and these cities have no local privately owned TV and radio stations. The mainnewspapers in Cheboksary and Astrakhan are also local and government-owned. InSaratov, the most popular papers are the more open and more informative nationalpapers, distinguishing the local population as more independent and cosmopolitan. ButAyatskov has reportedly recently signed an "Agreement on Civic Peace and SocialPartnership" restricting freedom of speech. Official statistics and documents are difficultto obtain in Saratov, and also in Nizhni and Volgograd. Of the former closed cities, onlySamara seems to have truly opened up.
15

V. OUTCOMES
Economic and social outcomes for the period 1990-96 are no easier to measurethan initial conditions or economic reforms. Two problems are worth mentioning upfront. The first problem is that there is no satisfactory indicator of economic growth inthe Volga capitals. Estimates of money income and GNP are available only on theregional level, and the city index of industrial production ignores any growth in services.The second problem is that, because of differential inflation, indicators expressed incurrent rubles must be converted to more comparable values.12 There are three deflatoroptions: the cost of 25 basic food items in the capital city, the cost of minimumsubsistence for the region, and the regional Consumer Price Index (CPI). The last isgiven in Appendix Table 1 and the other two are given in Appendix Table 6. In whatfollows, "real" economic values are calculated with the CPI, which is the most broadlybased deflator available over the longest period. The CPI currently distinguishes close to400 goods and services.13 In measuring the living standard of lower income groups, weuse the cost of minimum subsistence as it is broader based than the cost of 25 basic fooditems.
Economic Outcomes
As was the case in 1990, no data are available at the city level on per capitaincome or GNP, although such measures would be the most comprehensive measures ofeconomic success and living standards. We therefore look again at the average realwage, a reasonably comprehensive measure of economic outcome earlier in thetransition. As the market economy develops, however, households benefit increasinglyfrom new sources of income, including business profits, rents and returns on financialassets. We therefore consider other possible indicators of economic outcomes, includingthe available city-level data on industrial production and employment and overallchanges in wages and employment.
Real Economic Wage
Figure 2 and Table 9 show 1996 average monthly wages in 1990 rubles, what wecall the "real economic wage" in the Volga capitals. Unlike 1990, when wages werevirtually the same (Table 1), these estimates vary significantly, and they differ from theregional wages shown in Appendix Tables 4 and 9. Tver has the highest real economic
12 Prices of non-traded goods might be expected to differ, but studies show that prices of traded goods alsodiffer substantially from region to region, and only partly because of transport costs (Gluschenko 1998 andBerkowitz and DeJong 1998).
13 Regional weights for the CPI are based on local household budget surveys, but they do not differ greatlyacross regions. Both the list of goods and weights change annually, allowing for variation in quality andtaste, but variations from year to year are modest (see Gluschenko 1998 for more details). The mainproblem with the CPI is that, although it provides the rate of change starting in mid- 1991, no initial pricelevel is provided on which to base this change. Since most prices in 1990-91 were still fixed, and sincethey were fixed at the same level in the Volga regions, we assume that initial price levels were the sameand the annual rate of price change for 1990-9 lwas the same as that for the country as a whole.
16

wage, followed by Kazan, Samara and Volgograd. Ulyanovsk and Saratov have thelowest wages, only 60 percent of those in Tver. Data for 1996 regional real per capitaGDP (Appendix Table 3) suggest that capital-city wages are relatively high in Tver andrelatively low in Ulyanovsk and Saratov, given the strength of the regional economy.
The wage picture at end- 1996 represents a big and significant change from theSoviet period. Not only do wages vary among cities, disparity within cities hasincreased. Data for Samara, for example, show that the decline in the industrial wagewas higher than the decline in the average wage, and substantial differences havedeveloped among other branches of employment. Wages in the financial sector rose tofive times the average wage, and wages in education, science, culture and health caredropped to 60 percent of the average.
Industrial Production and Employment
A decline in the absolute level of industrial production is associated with theshock of transition, and the index of industrial production declined in all ten Volgacapitals through 1996, the last available data (Appendix Table 11). Not one city showedsigns of recovery. As shown in Figure 4, the smallest declines were in Ulyanovsk,Nizhni, and Kazan, in that order. All three cities tried hard to protect their industry and tosome extent succeeded during the period under review. The largest declines were inSaratov, Tver, and Cheboksary. Most industry in Tver and Cheboksary was light industryor machiney/metalworking, the sectors shown by Ivanov 1 998b to be the leastcompetitive. Although only 34 percent of Saratov's industry was concentrated in thesetwo sectors, the hard budget constraint on industry imposed by Ayatskov and hispredecessors was not balanced by any serious institutional reform. Thus, not only didindustrial wages and employment decline precipitously, little was done to promote theregulatory framework and market services required for healthy development of newbusinesses.
Although production and employment both declined during 1990-96, a factconsistent with the expected shift of output in favor of services,15 employment declinedless radically than production. The disparity is explained in large part by substantialdisguised unemployment, suggesting that further loss of jobs in declining industries canbe expected in the future.
Overall Changes in City Wages and Employment
Table 9 summarizes several labor market characteristics in the Volga capitals:changes in city employment and average real wages for 1990-96; and official cityunemployment in 1996. In addition, it shows the stock of regional wage arrears at end-1997 as a percent of the wage bill, reflecting pressures to maintain both wages andemployment. All these indicators deteriorated everywhere in Russia during 1990-96, but
14 Appendix Table 12 shows the empirical analysis of changes in industrial shares for five Volga capitals(Ivanov 1998b).
15 See Easterly, de Melo, and Ofer (1994).
17

the pattern of change suggests differences among the cities in labor market flexibility andassociated policy interventions. Some cities allowed wages to fall in order to preserveemployment, and others tried to maintain wages and let employment absorb marketpressures.
A stylized view of labor market dynamics in Russia during the 1990s is presentedin Figure 3. It shows three types of change, represented by shifts in the relevant curves: adecline in the demand for labor (shift of Ld9o to Ld96); a smaller decline in the supply oflabor due mainly to the exit of women and a discouraged-worker response to the declinein demand (shift of vertical Ls9O to Ls96); and a policy-driven counter shift in the demandfor labor, as city governments use a variety of measures to avoid unemployment (shiftfrom Ld96 to Ld96'). Assuming the shifts represent average movements, the equilibriumpoint would move from AO to Al, which indicates some decline in both wages andemployment. Each Volga city is then positioned in Figure 3 according to the datapresented in Table 9.
The two extreme cases are Samara and Ulyanovsk. Samara had a relativelymoderate decline in wages but the highest recorded decline in employment. Relativelylow wage arrears corroborate the perception that employment absorbs the burden of labormarket adjustment. Ulyanovsk, on the other hand, strongly protected the level ofemployment but had to allow real wages to drop quite sharply. As we know, Ulyanovskthen cushioned those lower wages by price controls. Unemployment was kept low, but arelatively high level of wage arrears suggests the artificial nature of some employment.
Tver stands out as having the lowest decline in real wages, only a modest declinein employment, low official unemployment, and low wage arrears. Kazan is not farbehind Tver, but has a somewhat larger decline in wages and perhaps a smaller decline inemployment. The high level of wage arrears in Tatarstan suggests that employment inKazan was maintained artificially, however. The other city managing to keep a highlevel of employment was Volgograd, combining a moderate decline in wages, significantwage arrears, and pressure on enterprises to maintain jobs. Like Samara, Cheboksary andYaroslavl had large losses in employment, but with smaller declines in wages. In bothcases, official unemployment was relatively high and wage arrears significant.
Social Outcomes
Real Social Wage
The average monthly wage divided by the cost of the subsistence minimum is thebest available measure to show the living standard of the poor. As seen in Figure 2 andTable 9, the ranking of cities by this measure differs from the ranking according to thereal economic wage. In particular, Ulyanovsk, which has the lowest real economic wage,has one of the highest real social wages. 16 And Tver, with the highest real economic
16 Although Ulyanovsk also has the lowest cost of 25 basic foods, the differential with other cities is lessthan the differential for the minimum subsistence.
18

wage, has only a moderately high real social wage. The difference between the twomeasures is the relatively low cost of the subsistence minimum basket in some citiescompared to the regional CPI. Kazan, Nizhni, Ulyanovsk, and Yaroslavl have the highestreal social wage, and Saratov has by far the lowest, combining a situation of loweconomic wages with substantial price liberalization. In fact, Saratov suffers fromdeclining population (low birth rate and very high death rate) and wide income disparitieswith a large percent of the population receiving less than the subsistence minimum.Yaroslavl, Nizhni and especially Ulyanovsk, have dramatically improved the purchasingpower of low income groups by keeping subsistence costs down.
Income DistributionIncreasing inequality in the distribution of income is a well-recognized
consequence of transition. It has been observed in both Central and Eastern Europe and inthe Newly Independent States of the Forner Soviet Union. The statistics available in1996 suggested that in Russia such inequality was already at OECD levels in the late1980s and had increased to the (higher) level of middle income countries by 1993.17Typically, more inequality reflects increases in unemployment and in wage dispersion;higher income from rent and profits, which are less equally distributed than wages; andgrowing regional inequalities.
Appendix Table 13 provides evidence of increasing inequality both within andamnong the Volga cities. Although per capita sales of consumer goods have droppedstrongly in all cities (with available data) except Kazan, telephones and cars per 1000residents have increased substantially. This suggests that while the purchasing power ofthe average citizen is declining, the purchasing power of the top half of households isincreasing. The two most extreme examples appear to be Astrakhan, where consumergoods sales dropped 43 percent and cars increased 60 percent, and Tver, where consumergoods sales dropped 39 percent and cars more than doubled. For evidence on divergingincomes between capital cities and their surrounding regions, see de Melo and Ofer 1999.
Education and Health
There are relatively few output indicators in the social sphere available on acomparative basis at the city level. One set of indicators is provided in Appendix Table14. It includes the level and change in the city population of school age (below theworking age of 15) together with the level and change in the number of children in 2 ndand 3rd shifts. What is striking is that although the school age population declinedbetween 1990 and 1996 in all cities for which data are available, the number of studentsin 2nd and 3rd shifts increased.
7 See Figure 4.1 of World Bank 1996.
19

VI. INTERACTIONS AMONG INITIAL CONDITIONS, POLICIES ANDOUTCOMES AND OTHER OBSERVATIONS
As discussed above, there are no comprehensive indicators of growth at the citylevel, and employment data have more than one interpretation. Data on most socialindicators are partial. We therefore use the real economic wage and the real social wageas indicators of socioeconomic outcomes in the cities, despite their limitations. They areshown in Table 10 along with the summary indicators for initial conditions and policyreform. Given the data available and the methods used, our observations on how they arerelated should be characterized as hypotheses rather than conclusions.
Initial Conditions and Policies
With one exception, namely Astrakhan, rankings on initial conditions and policyreform are similar for all cities. Initial conditions were particularly poor in Cheboksaryand Ulyanovsk and policy reforn has been slow in both cities. In Samara, Yaroslavl, andTver, initial conditions were favorable and policy reform has been relatively strong. Theapparent positive relationship between initial conditions and reform suggests that initialconditions are important for both the speed and success of economic reforms at themunicipal level just as they are at the macro level. It is possible, for example, thatrelatively poor prospects caused local leaders in Ulyanovsk and Cheboksary to be morecautious on reform.
Initial Conditions, Policies and Outcomes
The close correspondence between initial conditions and reform implies that it isdifficult to associate them separately with outcomes. The discussion here will thereforerelate economic and social outcomes to initial conditions and reforms together. In doingthis, it is possible to distinguish three cases, which in turn suggest some generalizations.Saratov epitomizes the first case, where socioeconomic outcomes are worse than onemight expect given initial conditions and policy reforms. Yaroslavl and possiblyVolgograd fall into this camp as real economic wages are less favorable than might beexpected. Ulyanovsk epitomizes the second case, where social, if not economic,outcomes are better than one might expect. Kazan also falls into this camp, althoughKazan's enhanced access to resources provides a fairly clear explanation for its favorableoutcomes. The third case includes the other five cities that have performed more or lessas expected.
In the first case, Yaraoslavl and Volgograd have high rankings on reform,suggesting that there may be a time lag between reform and recovery. Also, it is likelythat in reformist regions, with a more developed private sector, wages contribute less tototal household incomes than in the conservative regions. Thus, any positive relationshipobserved between reforms and outcomes measured only by wages may be understated.The poor performance of Saratov appears to result at least in part from weak leadershipand poor governance prior to Ayatskov and a policy favoring agriculture over industry.
18 See de Melo, Denizer, Gelb, and Tenev (1997) for evidence at the macro level.
20
Kazan's success relative to its initial conditions and reform record is more easilyunderstood. It has extracted large concessions from the center in terms of high taxretention and fiscal transfers. It is rich in natural resources and has attracted foreigninvestment. It has maintained relatively stable real wages and employment and goodrelations with the center. Although total industrial production declined more than inNizhni and Ulyanovsk, it declined considerably less than elsewhere.
The second case also suggests that delaying reforms may help delay productiondeclines or that some "reforms" may be better than others. Ulyanovsk's efforts to protectconsumers by delaying price liberalization for basic foods and municipal services appearto have been successful through 1996. Despite the lowest economic wage, theUlyanovsk's social wage was one of the highest. Given the limited time horizon of thisstudy, it would appear that higher living standard for low-income groups can in fact beachieved by price controls, particularly when those controls are increasingly limited tosubsistence items and efforts are made to target or otherwise prevent over consumption.
In the third case, Samara and Tver score relatively well on socioeconomicoutcomes as well as on initial conditions and reforms. Cheboksary and Astrakhan scorepoorly on most indicators, and Nizhni falls in between. This case highlights the fact thatRed Belt cities have typically lagged in reforms and have had less successful economicoutcomes.
What Matters
What follows are some observations on the hypotheses suggested above:
Resources matter. Kazan has benefited enormously from Tatarstan's uniquearrangements with the federal government. Tatarstan has a bilateral agreement with theFederal government that includes special "single channel" tax arrangements; during1994-96 it paid to the center an average of only 20 percent of regionally collected taxes,whereas the Russia-wide average was 40 percent. The republic was also the biggestrecipient of federal transfers during the first 9 months of 1997 and benefited particularlyfrom political transfers associated with property deals, special agreements and targetedprograms. Other regions received smaller transfers, primarily from the Fund forFinancial Support of the Regions, an equalization fund that accounts for about half of allfederal transfers. In 1996, Saratov was one of the 10 largest recipients of FFSR transfers(MFK Renaissance 1998a).
Other cities and regions may have been less successful in attracting transfers fromthe center, but actions reflect not only the importance of resources but also theimportance of political and legal bargaining in obtaining resources. In November 1996,Volgograd mayor Yuri Chekhov sued the federal government for 200 billion rubles ($37million) owed to the city for wages, pensions, and social programs. Samara is currentlyworking on a deal to exchange federal debt to the region for regional shares in thefederally owned airport. Most cities are making major efforts to attract foreigninvestment and payments from federal and regional authorities to help restructure the
21

largest enterprises. The ability of Boris Nemtsov to arrange for federal assistance to GAZ(the car factory) has made a significant difference to the local economy in Nizhni.
Weak government matters. This hypothesis is not as obvious as it sounds. At thebeginning of transition, some observers thought the market economy and hence growthwould flourish best where government was weak or absent, since the control instinct ofany post-communist government would stifle competition. The model of decentralizeddecision-making by economic agents in this scenario did not require cooperation, muchless bartering and bargaining services, to produce an orderly flow of products and factorsof production. The reality appears to be different, at least in Russia.
Strong leadership at the local level seems to have paid off. Weak leadership hasnot. This may be partly because regional policies are typically more conservative andprevail where local leadership is weak. It may also be that without strong unifiedleadership at the local level, the regions win out in the competition for resources.Uncertain alliances characterized politics at the local level in Saratov and Ulyanovskprior to 1996; and, as mentioned earlier, city councils in Yaroslavl, Tver, and Nizhni aremade up of small interest groups that make governance difficult. Most of these cities (seebelow on Tver) have performed less well than expected. The most obvious example ofweak government is Saratov. The governors prior to Ayatskov, elected at end-I 996,were poor leaders, as were the mayors. The city's fiscal position is poor, with a low shareof cash revenues at the city level, low cost recovery on housing and utilities, and highfiscal deficits.
Time lags may matter. Yaroslavl, a city with favorable initial conditions and thehighest ranking on reforrn, has only a moderate real economic wage after six years oftransition. At the same time, the slowest reformers, namely Ulyanovsk, Cheboksary andAstrakhan have done better than their reform record would indicate ifreform werepositively associated with favorable socioeconomic outcomes. Ulyanovsk was a regionwhere the oblast government tried to maintain enterprise production and employmentdespite low profitability. As a result it had one of the lowest declines in industrialproduction in Russia through 1993, although quite significant declines occurred in 1994-96.
One explanation for these anomalies is the time lag between outcomes and reformshown at the macroeconomic level in de Melo et al (1996, 1997). If it is true, forexample, that the successful adaptation of defense industries is rare, the hard budgetconstraint on Saratov's defense industries may result in large early declines in productionbut release resources to promote a strong subsequent recovery. Reforms would not showup in better economic outcomes until sometime in the future. This same logic wouldimply that production declines in Ulyanovsk would continue in the future even if industryelsewhere picks up. It is too soon to comment definitively on such scenarios.
Red Belt matters, with some exceptions. Red Belt cities all ranked low on thesocioeconomic outcomes indicator, whereas non-Red Belt cities ranked high. This isdespite the fact that one Red Belt city, Astrakhan, appeared initially to have quitefavorable prospects while one non-Red Belt city, Nizhni, did not. These outcomes are
22

likely to be due in part to slower reform in the Red Belt on average. Three of the RedBelt cities-Ulyanovsk, Cheboksary, and Astrakhan-have clearly lagged on reforms.But there is diversity within the Red Belt group. Volgograd was an early reformer, andSaratov has more recently stepped up its reform efforts. Historically, Saratov was acosmopolitan city and in the late 19th century benefited from substantial foreigninvestmnent in industry. Taking into account its favorable natural resources, deserting theRed Belt should not be surprising.
Some non-Red Belt cities may have been slower on reforms than expected. Kazanfalls into this category. High income and access to resources allow Tartarstan to pursue acourse of multiple objectives, permitting it to become an honorary member of the RedBelt, undertaking "development with a human face". Slightly surprising is the absenceof Nizhni from the very top rank on policy reform, as political leaders there projected astrong reformist image during the early days of transition.
Other points:
Growth poles. It may be that Moscow's proximity is an advantage to Tver,providing Tver positive spillover effects from Moscow's size and growth to firms in Tverthat now benefit from economies of scale not otherwise possible given its relatively smallpopulation. Proximity also creates externalities arising from the impetus for innovationand spread of knowledge, assuming their benefits outweigh any congestion costs.Moreover, four adjacent regions in the middle Volga-Tatarstan, Samara, Saratov, andVolgograd-appear to have formed their own growth pole. They are supporting pro-reform politicians and attracting foreign investment. Part of Samara region's success maybe the high urbanization rate and the unusual conglomeration of two large, neighboringcities-Samara and Togliatti. Saratov is an unlikely setting for a reform candidate, as ithas traditionally been a closed city and formed part of the Red Belt. But in November1977, Governor Ayatskov pushed through a path-breaking bill that explicitly allows thepurchase and sale of land within the region by any Russian citizen (MFK Renaissance1998c). It is tempting to speculate that Saratov has been influenced by the proximity ofreformist Samara.
Growth poles can, of course, have negative, as well as positive, effects, especiallyin the short run. For example, Samara appears to have lost out to Togliatti in thecompetition for regional leadership, with the result that local and foreign resources havebeen channeled more to Togliatti and Samara has performed less well than might beexpected. Togliatti, a city of more that 700,00 people, has a youthful population andexperienced a 6 percent plus increase in industrial production in 1996. At this time, theaverage monthly wage in Togliatti was 50 percent higher than for the region while thewage in Samara was 10 percent below the region's wage.19
Natural resources. The energy sector did attract foreign investment in Kazan andSamara, and to a lesser extent in Saratov and Volgograd. But as of end-1996 it was not adetermining factor in overall foreign investment, much less general economic
19 Statistics on Togliatti from "Togliatti in Business," city web page II www.tlt.ru on 11/30/98.
23
performance. With the exception of Tver, the cities in strong agricultural regions appearto have suffered, possibly from agriculture's competition for scarce resources.
Defense industry. We initially took a neutral position regarding the influence ofdefense industry on outcomes. Further analysis does not shed much light on thisquestion. Leaving aside Kazan, because of its better overall access to resources, theexperiences of Nizhni, Samara and Saratov suggest that these cities have not necessarilybenefited from previous high levels of defense industry. On the other hand, they may nothave suffered either, since the large size of these cities results in a relatively high level ofindustrial diversity despite the concentration of defense industry.2 0
City size. With the exception of Tver, economic outcomes appear to be morefavorable in the larger cities than in the smaller ones. Like Tver, Yaroslavl has been anactive reformer, but results are disappointing. The other three smaller cities-Ulyanovsk,Cheboksary, and Astrakhan-have the lowest real economic wage. If small size is adisadvantage, it could be another reason why these cities have been more cautious onreforns. One explanation for less success would be that, compared to larger cities,smaller cities do not have as much political influence, and hence claim on resources, ateither the regional or federal level. Another explanation would be the lower industrialdiversity found in small cities, the same point made for cities with a high level of defenseindustry.
Closed cities. Of the four formerly closed cities (Nizhni, Samara, Saratov andVolgograd), only Samara has a reputation for having an active free press and freelyavailable information.
Developments in 1997 and 1998
The time between the end of 1996 and mid-1998 was a period of "virtualstability" and of hopes for resumed growth in Russia. These hopes ended with the Augustcrisis, but there were earlier warnings. During the period before the crisis, FDI increased,but financial capital flows dominated; high interest rates, especially during the secondhalf of the period, discouraged real investment. Barter transactions and the use of othermoney surrogates increased and arrears proliferated. The following perspective ondevelopments in 1997 and 1998 is based on partial data at both the city and regionallevels.
Production. A number of cities experienced for the first time a small increase inindustrial production in 1997 (Saratov, Cheboxary, some industries in Yaroslavl). Thisincrease was combined with some decline in unemployment, explained in part by acontinued decline in the labor force (Saratov, Yaroslavl).2 ' However, a decline in profits
20 Glaeser et al. (1992) provides evidence for the importance of industrial diversity based on the study ofU.S. cities. Industrial diversity promotes growth, as knowledge spills over industry groups and stimulatesnew ideas and innovations. In other words, competition and inter-industry, rather than intra-industry,knowledge spillovers are important for growth.
21 Interestingly, the 1997 data on registered unemployment show that the only two regions experiencing an
24

during recent years was reported by larger enterprises in Yaroslavl, especially inmanufacturing and trade. And, in a late-1998 survey of 60 small textile enterprises in sixVolga cities, more firms reported losing money than reported making profits (de Melo,Ofer and Yossifov 1999). They also reported a decline over the previous year in laborproductivity and employment.
FDI. In 1997 FDI to Russia increased over 1996, but among the Volga regionsFDI rose only for Samara (from $9 to $18 per capita), which ranked fourth among allRussian regions in FDI. It declined for Tatarstan, Nizhni and Saratov, and these regionsplus Volgograd all ranked below Samara. Nizhni almost vanished from the list. In anevaluation of the investment risk in a number of regions Samara came in fifth place,Nizni sixth, Tatarstan eleventh and Saratov twenty-first (Carana Company 1998).
Prices. Goskomstat data for 1997 show that the disparity in the cost of 25 fooditems has narrowed among the Volga capitals, although the cost is still lowest inUlyanovsk, Cheboksary and Kazan. The disparity in the cost of minimum subsistencehas also narrowed. Saratov was the only city where neither of these costs increased incurrent rubles, so its relative position on the real social wage has improved. We know,however, that price controls still exist. An October 1998 survey of 60 textile and clothingfirms in six of the Volga capitals found that two-fifths of the firms were subject to price
22controls. Firms in Astrakhan and Samara had the most complaints. Most controls wereproduct-specific, but some firms reported controls on retail margins.
Incomes and wages. Disparity in real incomes clearly increased among the Volgaregions, and presumably the capitals, in 1997, with Sarnara showing a growth of 73percent in real per capita income and Chuvashia only 19 percent over an 18-month period(Appendix Table 4).23 Tver had a low-income growth as well as the lowest growth inreal economic wage along with Ulyanovsk, suggesting that weak government may bedominating the Moscow growth pole effect. The picture on wages is different. Thelargest increases in the regional real economic wage in 1997 were in Chuvashia,Astrakhan, and Saratov. Saratov also appears to have experienced some increase in thereal wage in and in regional per capita income during 1998, but this was before the crisis.As these regions contained three of the five capital cities with the lowest real economicwage in 1996, wage disparity appears to have moderated. The real economic wage wasstill quite low in Ulyanovsk and Yaroslavl in 1997, and real wages declined in Yaroslavlin 1998.
Fiscal. The years 1997 and 1998 were the first two in which elected mayors andcity councils were everywhere in place and fiscal relationships with the upper levelgovernment were put in better formal order. In particular, the tax shares and transfers
increase in registered unemployment are Samara and Tatarstan, the most successful otherwise (AppendixTable 10).
22 See de Melo, Ofer, and Yossifov (1999) for further details on this survey.
23 Note that December 1997 wage and income data in Appendix Table 4 will be biased to the extent that end-of-yearbonuses are significant and vary among the regions.
25

accruing to cities were more predictable. All cities for which 1996-98 budgetaryinformation are available managed to increase their share of "own taxes" and thus tooffset declines in shared taxes and transfers from upper level governments. Of the threecities for which more complete budgets are available (Nizhni, Saratov and Yaroslavl), thesituation in Saratov appeared the worse, with a consistent deficit, of 8, 10 and 5 percentduring '96, '97, and '98, respectively. In 1998 budget expenditures in Saratov dropped to63 percent of the 1996 level and only 43 percent of revenues were in cash.
Reforms. Reforms at the city level seem to have slowed in some critical areas.Small-scale privatization of enterprises was more or less completed, and the number ofnewly established private enterprises, and small enterprises more generally, declined insome cities. In Saratov there was still a marginal increase in the number of smallenterprises in 1997, but the increment was less than in previous years, and the number ofjoint stock companies actually declined. The reform of the housing sector-includingprivatization and cost sharing by households-seems to have slowed down. In the 1998city budgets for Yaroslavl, Nizhni-Novgorod and Saratov, expenditures on housing andutilities were between a third plus to 40 percent of total expenditures and growing overtime. Only one region among the ten covered here, Samara, achieved housing cost-sharing of more than 50 percent by 1998, and three more regions-Tver, Chuvashia andVolgograd-achieved shares above 35 percent. Cost sharing in Saratov and Ulyanovskremained below 18 percent, which is considered very low. Arrears of householdpayments for housing and utilities averaged about 20 percent of charges, with a muchhigher figure in Tatarstan (35 percent) and a much lower figure in Samara andVolgograd.2 4
Social. On the bright side, two cities, Saratov and Yaroslavl reported a significantdecline in the number of crimes since 1996. However, the lack of economic growth hasbeen aggravated by increasing income inequality even since 1996. In Yaroslavl, realwages are estimated to have declined by 25 percent in the first nine months of 1998 ascompared to the first nine months of 1997. Income inequality declined very slightly overthe same period but the decile ratio was still over 10 and the Gini coefficient .36(Yaroslavl City 1998). Measures of income inequality for city of Saratov are notavailable, but regional data show an increase from 1997 to 1998, with the decile ratiorising from 7 to 10 and the Gini coefficient from .31 to .35.
Concluding RemarksSeveral more general observations on Russian transition emerge from this paper.
First, all cities have experienced radical changes in their institutions and theireconomies-changes associated on the one hand with the abolition of central planningand the introduction of freer markets and on the other hand with political decentralizationand the introduction of local elections. Second, these changes have led to a widediversity in economic and social outcomes. To some extent this diversity reflects
24 The information on housing is based on Institute for the Urban Economy 1998 and miscellaneousmaterials provided by the Institute.
26

differences in the central government's economic relations with regions, and especiallywith Tatarstan, arising from its lack of resolve and ability to treat them equitably. And tosome extent it is the outcome of differing policies at the regional and local levels. As wehave seen, most northern cities adopted policies more consistent with the centralgovernment's support of free market reforms, and most southern, Red Belt cities pursuedmore cautious and protective policies.
Third, in almost all cases we observe an increasing use of more pro-activeeconomic policies by city governments. The pros and cons of protecting industry mayhave been debated at the federal level, but at the local level city governments do nothesitate to fight for the survival of their local industries on all fronts. Such differences incentral and local govermment approaches seem to occur elsewhere, even in marketeconomies; so it is perhaps not surprising. Nevertheless, pro-active interventions at thelocal level are of particular significance given the nature of Russian transition, wheredecentralization is as much from central government to local government as it is frompublic to private enterprises. A notable exception in recent years is Saratov, whereAyatskov has supported a hard budget constraint for industry.
Fourth, the jury is still out on the question of what were the right social andindustrial policies during the first years of the reform. The possible time lag betweenpolicies and outcomes makes it difficult to judge, but one cannot avoid doubting theconventional wisdom that a more "humanistic" and interventionist economic approachwas misguided. Is it possible that the partial shield provided by many local governmentsagainst radical changes has helped Russia weather an extremely difficult period? Samaraappears to be setting a relatively good example with some institutional support for marketreforms. But Ulyanovsk and Saratov represent two extremes on the policy front.Whereas Ulyanovsk has clearly lagged on market reforms, Saratov appears to represent amodel of liberalization without institutional support. Both extremes have failed, but so farthe social consequences of the Saratov model appear to be worse than those of theUlyanovsk model.
And finally, with the credibility of the federal govermnent in Russia at an all timelow, foreign investors have no choice but to rely on the competence and reliability oflocal leaders, especially mayors and governors. They will be looking for evidence ofaccountability in the form of the rule of law and transparency in the form of reliablepublic information. Yet, information at the city level is often not available and not easilyaccessible. This study tries to demonstrate the potential usefulness of good information.In developed countries, such publicly available stacistics would cover municipalemployment; planned and actual city budgets and any extra-budgetary funds; municipalservices such as public transport, police protection, garbage collection, and fire trucks;social statistics on education, health, and crime; air and water pollution levels;organization and composition of city courts; business statistics on firm ownership,activities, and employees; tourism; and public construction. Good information willattract local researchers to help monitor progress, as a basis for accountability, and tohelp diagnose problems, as a basis for public policy debate and political decisions.
27

References
Andrews, Josephine, and Kathryn Stoner-Weiss. 1995. "Regionalism and Reform inProvincial Russia." Post-Soviet Affairs 11(4): 384-406.
Andrienko, Yury. 1997. "Case Study of Kazan." The New Economic School, Moscow. Mimeo.Andrienko, Yury. 1998. "Industrial Structure and Enterprise Performance during Transition in
Volga Cities." The New Economic School, Moscow. Mimeo.Baranchuk, Nina. 1997. "Case Study of Yaroslavl." The New Economic School, Moscow.
Mimeo.Baranchuk, Nina. 1998. "Liberalization Processes in Volga Cities." The New Economic School,
Moscow. Mimeo.Berkowitz, Daniel. 1996. "On the Persistence of Rationing following Liberalization: A Theory for
Economies in Transition." European Economic Review 40: 1259-1279.Berkowitz, Daniel, and David N. DeJong. 1998b. "Economic Consequences of Russia's Internal
Border." Department of Economics, University of Pittsburg. November, mimeo.Bradshaw, Michael J., and Philip Hanson. 1998. "Understanding Regional Patterns of Economic
Change in Russia: An Introduction." Communist Economies & Economic Transformation10(3): 285-304.
Carana Company. 1998. "Diagnostic Report on Investment Environment and Promotion Effortsin Samara Region." Moscow. October, mimeo.
de Masi, Paula, and Vincent Koen. 1996. "Relative Price Convergence in Russia." IMF StaffPapers 43(l): 97-122.
de Melo, Martha, Cevdet Denizer, and Alan Gelb. 1996. "Patterns of Transition from Plan toMarket." The WorldBankEconomicReview 10(3, September): 397-424.
_ and Stoyan Tenev. 1997. "Circumstance and Choice: The Role of Initial Conditions andPolicies in Transition Economies." Policy Research Working Paper No. 1866. WorldBank, Development Research Group, Washington, D.C.
de Melo, Martha, Gur Ofer, and Plamen Yossifov. 1999. "The Russian City in Transition: AView from the Volga on Government and Economy." World Bank, DevelopmentResearch Group. Washington, D.C. May, mimeo.
Expert Institute. 1997. "Analysis of Tendencies of Russia's Regions, Development in 1991-1996.Political Orientations of the Population of Russian Regions." TACIS Directorate.
Freinkman, Lev, and Irina Starodubravskaya. 1996. "Restructuring of Enterprise Social Assets inRussia." Policy Research Working Paper No. 1635. World Bank, Development ResearchGroup, Washington, D.C.
Freinknan, Lev, Daniel Treisman, and Stepan Titov. 1998. "Preempting a Potential Debt Crisis:Fiscal Performance in Russia's Regions." World Bank, Europe and Central Asia Region,Washington, D.C. July, mimeo.
Friedgut, Theodor, and Jeffrey W. Hahn, eds. 1994. Local Power and Post-Soviet Politics.Armonk, N.Y.: M.E. Sharpe.
Frye, Timothy, and Andrei Shleifer. 1997. "The invisible hand and the grabbing hand." AER 87(2,May): 354-358.
Gaddy G., Clifford. 1996. The Price of the Past: Russia's Struggle with the Legacy of aMilitarized Economy. Washington D.C.: Brookings Institution.
Gibson, John, and Philip Hanson, eds. 1996. Transformation from Below: Local Powerand the Political Economy of Post-Communist Transitions. Cheltenham, U.K.: EdwardElgar Publishing Ltd.
28

Glaeser, Edward L., Hedi D. Kallal, Jose A. Scheinkrran, and Andrei Shleifer. 1992. "Growth inCities." Journal of Political Economy 100(6, December): 1 127-52, University of ChicagoPress, Chicago.
Gluschenko, Konstantin. 1998. "Interregional Variability of Inflation Rates." Institute ofEconomics and Industrial Engineering, Siberian Branch of Russian Academy of Sciences,Novosibirsk. December, mimeo.
Goskomstat. 1997. The Regions of Russia. MoscowGoskomstat. 1995. Socioeconomic Statistics of Capitals of Republics, Krais, and Oblasts of the
Russian Federation (1994). Moscow.Halligan, Lian, Richard Layard, Pavel Teplukhin and Dirk Willer. 1995. "Local Budget in Russia
and Restructuring: Evidence from Yaroslavl and Novgorod." TACIS. Mimeo.Hamm, Michael F., ed. 1976. The City in Russian History. Lexington, KY: University of
Kentucky Press.Hanson, Philip. 1997. "Samara: A Preliminary Profile of a Russian Region and its
Adaptation to the Market." Europe-Asia Studies 49(3): 407-429.Harris, Chauncy D. 1970. Cities of the Soviet Union: Studies in their Functions, Size,
Density, and Growth. Chicago: Rand McNally.Ivanov, Maxim. 1998a. "Case Study of Cheboksary." The New Economic School, Moscow.
Mimeo.Lvanov, Maxim. 1998b. "Industrial Structure in Transition: Experience of Change in Volga
Cities." The New Economic School, Moscow. Mimeo.Ivanov, Maxim, and Elena Lukuyanova. 1998. "Case Study of Saratov." The New Economic
School, Moscow. Mimeo.Lukuyanova, Elena. 1997. "Case Study of Ulyanovsk." The New Economic School, Moscow.
Mimeo.Lukuyanova, Elena. 1998. "Intergovernmental Transfers in Russia: The Case of the Volga
Cities." The New Economic School, Moscow. Mimeo.Malyakin, Ilya. 1997. "The New Political Situation in Russia's Regions: the View from
Saratov." Jamestown Foundation.Markova, N. 1996. "Russia's Regions: The Results of Four Years of Economic Reforms."
Ekonomist 3: 47-55.MFK Renaissance. 1998a. "Passing the Buck - A Guide to Fiscal Federalism in Russia." Moscow.MFK Renaissance. 1998b. "From the Sublime to the Ridiculous - A Credit Rating Model of
Russia's Regions. "Fixed Income Research." Moscow.MFK Renaissance. 1998c. "Various Regional Case Studies." Moscow.Mitchneck, Beth. 1994. "The Changing Role of the Local Budget in Russian Cities: the Case of
Yaroslavl." In Theodor Friedgut and Jeffrey W. Hahn (eds.), Local Power and Post-Soviet Politics. Arnonk, N.Y.: M. E. Sharpe.
OECD. 1997. The Russian Federation, 1997. Paris: OECD.Parfinenko, Nina, and Sveta Shcherbich. 1998. "Case Study of Volgograd." The New Economic
School, Moscow. Mimeo.Romanov, Pavel, and Irina Tartakovskaya. 1998. "Samara Oblast: A Governor and His
Guberniya."Communist Economies & Economic Transformation 10(3): 341-363.TACIS. 1996. "Analysis of Tendencies of Russia's Regions Development in 1992-1995."
Belgium: TACIS Directorate General IA, European Commission.Turuhambetova, Gauhar. 1997. "Case Study of Astrakhan." The New Economic School,
Moscow. Mimeo.
29

Volchkova, Natalya. 1997. "Case Study of Samara." The New Economic School, Moscow.Mimeo.
Yakovleva, Nadya. 1998. "Case Study of Tver." The New Economic School, Moscow. Mimeo.Yaroslavl City. 1998. "Various Aspects of Socioeonomic Development in Yaroslavl City during
the First Nine Months of 1998." Information-Organization Administration, Mayor'sOffice, Yaroslavl.
World Bank. 1996. World Development Report 1996. From Plan to Market. New York: OxfordUniversity Press.
Zhuravskaya, Ekaterina V. 1998. "Incentives to Provide Local Public Goods: Fiscal Federalism,Russian Style." Harvard University and Russian European Center for Economic Policy.Mimeo.
Zlotnik, Marc. 1996. "Russia's Governors: All the President's Men?" Problems of Post-Communism 43(6).
30
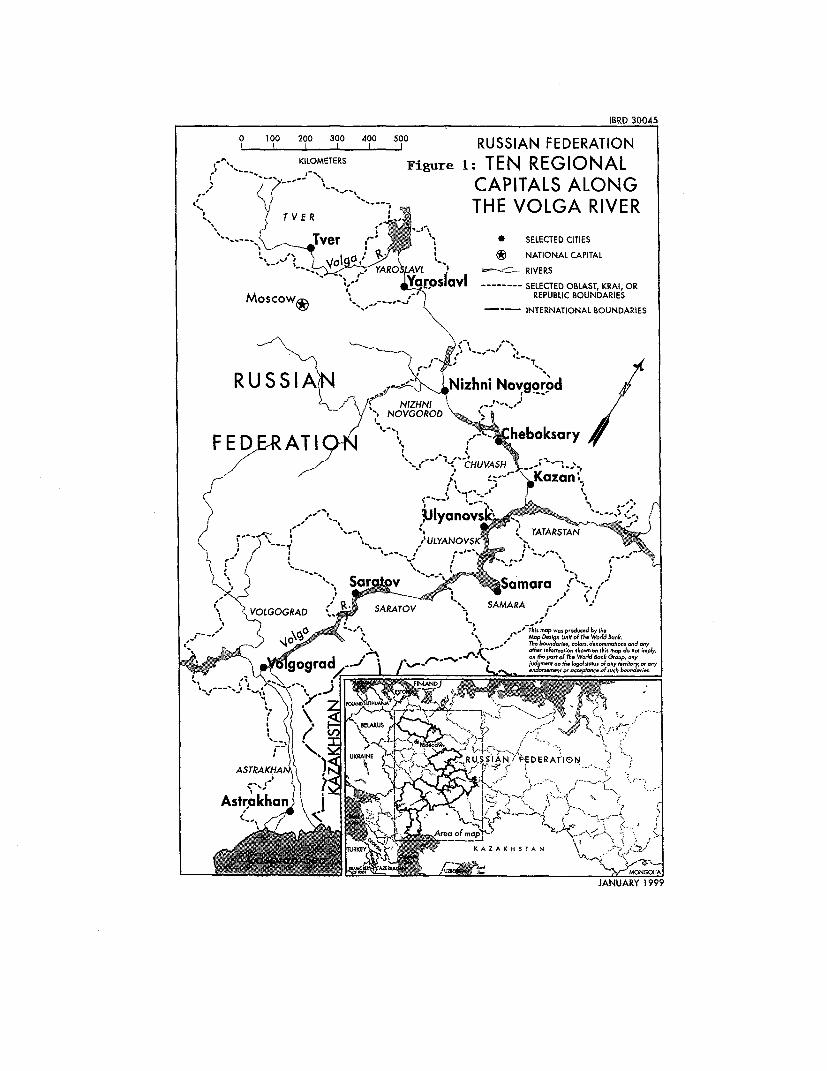
IBRD 30045
0 100 200 300 400 500__________I__I___ RUSSIAN FEDERATION
,-^s, KILOMETERS Figure 1: TEN REGIONAL,'' ,,- t- - '' - ,CAPITALS ALONG
-^s 8 TVER - 8 THE VOLGA RIVER-- -+ I a r /'' T ' SELECTED CITIES
d ® NATIONAL CAPITAL
-'-_s,_,-YARO\LYAVL RIVERS
.,J , .ro---v … SELECTED OBLAST, KRAI, OR
Moscow,* : , REPUBLIC BOUNDARIESINTERNATIONAL BOUNDARIES
RUSSIA Nizhni Novgorod- , 4 NIZHNI ,.J'-S..,-'
F E T91 'A T- - keboksary-, CHUVASH '-'
4 't' 'i'-' jazon'J
B ,,- ''¢s b ,tJlyyanovsj"; ' ' ,,'~~~~IULYANOVSK ',
W '~~~^ S_ffiSamo~~ ra ',
',<VOLGOGRAD v AAO ^ SMR -
< iA4~~~~~ograd itA. 6,__v<-
',^s,___'sl,'Is,A''/,J i{ tr5t,LA._)
1@ X g~~~~~~~~~~~KAIIN~~~~AUR DERT99

Figure 2: Real Monthly Wages and Ratios of Average Monthly Wage to
Subsistence Minimum in Volga Cities in 1996
300 - 3.0
250 2.5 M~~~~~~~~~~~~~~~~~~ Real Monthly Wage in
200 2.0 1990 rubles (left scale)
150 1.5El Ratio of Average Monthly
100 1.0 Wage to Subsistence
50 0.5 Minimum (right scale)
Source: Appendix Table 4.

Figure 3: Labor Market in Volga Cities, 1990 and 1996(indexes equal 100 in 1990)
120Ls9 Ls 90
i- 1001 ----- ---- AOTV
Kz\,a 80 \Sm LD9 0
\rCh 1 ~NN As
C ~ ~~~~C
620
LD96
40
80 90 100 110
Employment Index 1996
Source: Table 9.
Point AO: Initial situation in each city (Real Monthly Wage Index and Employment Index equal100 in 1990)
Stylized changes:(i) LS96 : Decline in labor supply (women and others leaving the labor force)(ii) LD96 : Decline in labor demand
96(iii) LD' : City governments and enterprises try to keep higher employment
artificiallyComment: The shifts in LS96, LD96, LD'96 would normally differ among the cities. The location
of the cities on the diagram assumes these shifts are similar. The rate ofunemployment is notionally the difference between Ls96 curve and the location ofthe city on its left as measured by the horizontal axis.

Figure 4: Index of Physical Volume of Industrial Production in
Volga Cities (1990100)
100
90
80 -
70
60
S 2 iI~~~~~~~~~~~~*996]
40 _ _ _ _ _ _ _ _
30-
20-
1 0
0
Source: Appendix Table 10.

Table 1: Initial Conditions in Volga Cities, 1990
Monthly Per Industrial Defense Favorable City Regional Data
Capital Cites MOl Averagey Trade in Mortalit Employment Employment Location (L) or Average Monthly PerCapial Cties (000's) Wagehl ConsueriGod pert1,000 as Percent of as Percent of Regional Natural Monthly Capita
Wage andsuerviceds pr10 Total Total a! Resources (NR) Wage Income b/and Services _
Tver 460 275 153 17.7 31 <10 + (L) 253 192 (A)
Yaroslavl 635 271 149 14.8 44 10-15 + (L) 264 205
NizhniNovgorod 1421 271 151 14.9 44 25-35 +(L) 259 201
Cheboksaryc/ 429 264 133 13.0 50 <10 ... 243 165 (A)
Kazan c/ 1103 266 169 18.4 47 25-35 + (NR) 266 187
Ulyanovsk 637 270 145 20.0 46 10-15 ... 260 189
Samara 1260 264 140 23.3 43 25-35 + (L) 265 200
Saratov 907 275 145 20.3 41 15-25 + (NR) 255 197 (A)
Volgograd 1003 271 140 15.2 41 <10 ... 273 198
Astrakhan 482 265 142 18.1 34 <10 ... 251 196 (A)
Memo itemRussian Federation 148543 - 158 17.4 30 <10 ... 297 215
Source: Goskomstat, Cities of Russian Federation, 1995, Goskomstat, Regionyi Rossii, Vol.1 and Vol.2, 1997, city case studies and city
statistical bulletins.a/ Classification based on 1985 data in Gaddy (1996) and author's estimates.b/ (A) indicates regions with a relatively strong agricultural base.c/ Cheboksary is the capital of the Chuvash Republic, also know as Chuvashia, and Kazan is the capital of Tatarstan Republic. All other
regions are oblasts with the same name as the capital city, e.g. Tver is the capital of Tver Oblast.

Table 2: Shares of Industrial Sectors by Volume of Sales, 1989(percent)
Industrial Sectors of Yaroslavl Nizhni Cheboksary Kazan Ulyanovsk Samara Saratov Volgograd AstrakhanCapital Cities Novgorod
Chemicalandpetrochemical 47.7 4.3 0.0 31.6 0.1 15.4 26.9 26.2 6.0Metallurgy 0.3 2.4 3.6 0.3 0.0 4.9 0.4 25.8 0.0Machinery and metal-working 25.8 57.7 48.2 20.2 60.5 39.5 27.9 26.4 15.2Forest products 1.9 2.3 0.9 1.6 3.8 2.3 5.0 3.6 9.7Construction materials 2.3 2.3 2.0 3.8 7.7 4.4 7.3 4.5 6.8Light industry 10.4 11.0 32.6 24.2 6.5 5.3 8.0 2.6 28.1Food industry 9.7 18.6 12.6 13.0 17.4 27.3 23.3 9.8 32.7Other 2.1 1.4 0.0 5.3 4.1 0.8 1.2 1.2 1.6Total 100 100 100 100 100 100 100 100 100
Source: Industrial Census 1989 as cited in Ivanov 1998b.
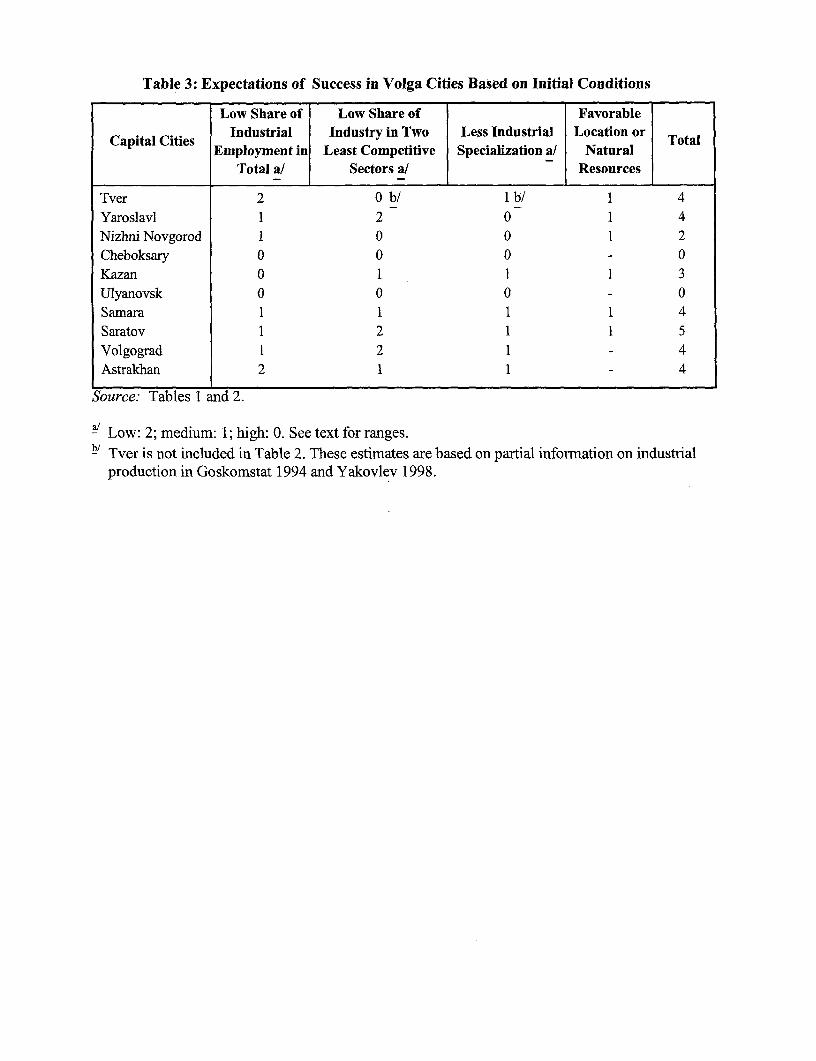
Table 3: Expectations of Success in Volga Cities Based on Initial Conditions
Low Share of Low Share of Favorable
Capital Cities Industrial Industry in Two Less Industrial Location or TotalEmployment in Least Competitive Specialization a! Natural
Total a/ Sectors a/ Resources
Tver 2 0b/ 1 b/ 1 4Yaroslavl 1 2 0 1 4Nizhni Novgorod 1 0 0 1 2Cheboksary 0 0 0 - 0Kazan 0 1 1 1 3Ulyanovsk 0 0 0 - 0Samara 1 1 1 1 4Saratov 1 2 1 1 5Volgograd 1 2 1 - 4Astrakhan 2 1 1 - 4
Source: Tables 1 and 2.
i Low: 2; medium: 1; high: 0. See text for ranges.- Tver is not included in Table 2. These estimates are based on partial information on industrial
production in Goskomstat 1994 and Yakovlev 1998.

Table 4: Price Controls on Goods and Serviees in 1995-1996
Capital Cities and Services Severity Berkowitz\Baranchuk b/
Tver 5-10 Below Average 1.1Yaroslavl 5-10 Above Average 1.7Nizhni Novgorod 10-17 Medium 1.6Cheboksary 18-25+ Above Average 2.2Kazan 10-17 Above Average 2.1Ulyanovsk 10-17 High 4.4Samara 5-10 Low 0.9Saratov 5-10 Low 1.0Volgograd 10-17 High 2.6Astarkhan 18-25 Above Average 2.3
Memo itemRussia 18.1 a/ N/A N/A
Source: Baranchuk 1998.a/ The average percent for Russia is 18. 1, 17.8 for all foods, 8.9 for non-food goods and 38.4
for services.- The higher the rank, the stricter the controls
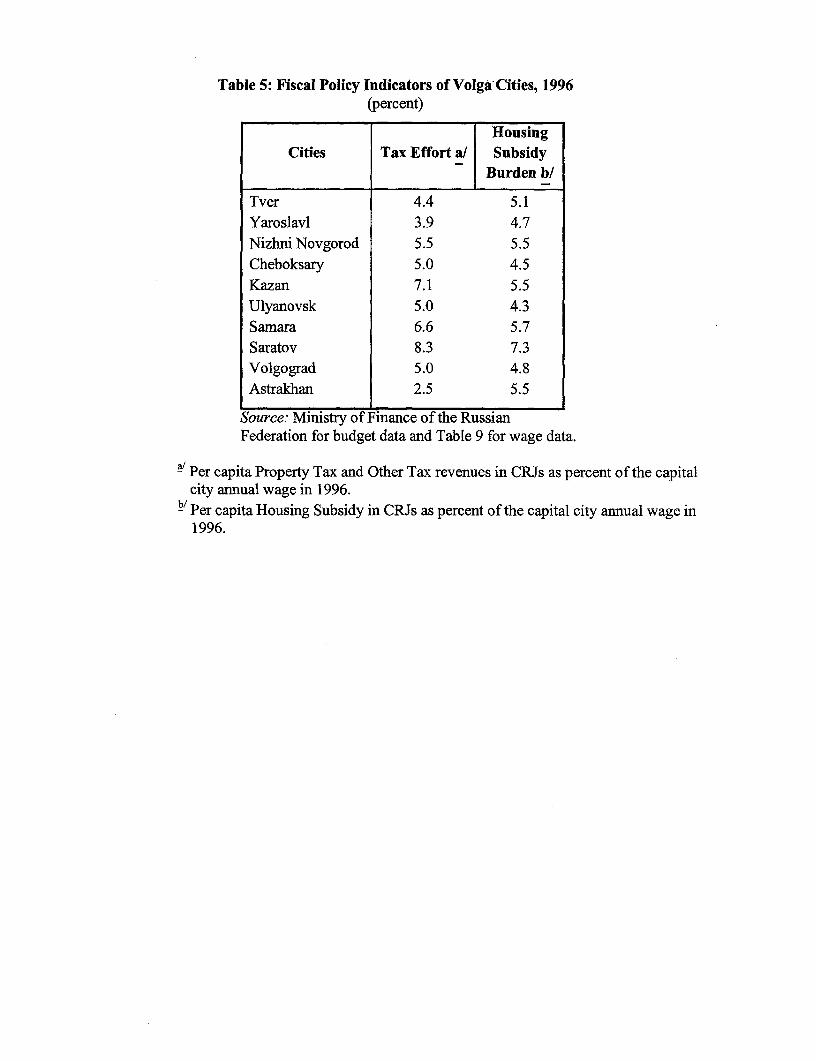
Table 5: Fiscal Policy Indicators of Volga Cities, 1996(percent)
HousingCities Tax Effort a/ Subsidy
Burden b/
Tver 4.4 5.1Yaroslavl 3.9 4.7Nizhni Novgorod 5.5 5.5Cheboksary 5.0 4.5Kazan 7.1 5.5Ulyanovsk 5.0 4.3Samara 6.6 5.7Saratov 8.3 7.3Volgograd 5.0 4.8Astrakhan 2.5 5.5
Source: Ministry of Finance of the RussianFederation for budget data and Table 9 for wage data.
a/Per capita Property Tax and Other Tax revenues in CRJs as percent of the capitalcity annual wage in 1996.
b/ Per capita Housing Subsidy in CRJs as percent of the capital city annual wage in1996.

Table 6: Housing Privatization, Small BusinessgDevelopment andForeign Investment in Volga Cities
Privatization of Small Enterprises Flow of TotalCapital Cities Housing as Percent in Region per Foreign Investment,
of the Entire Thousand (USD per Capita),Eligible Stock, 1996 Residents, 1996 1995 and 1996
Tver 34 2.7 184Yaroslavl 25 5.5 51
Nizhni Novgorod 33 3.8 41 a/
Cheboksary 20 b/ 3.1 N/AKazan 12 4.2 46Ulyanovsk 12 3.3 1Samara 27 5.8 30Saratov 28 3.6 N/AVolgograd 39 4.9 16Astrakhan 32 4.4 2
Source: Goskomstat, Regionyi Rossii, Vol. 2, 1997, city case studies, city statisticalbulletins and authors' calculations.
a' 1996 data onlyb/ 1995 data

Table 7: Policy Reforms in Volga Cities as of 1996
Capital Cities e Tax Housing Housing Small Business Foreign Toa Rak!Capial Oies iberAlization Effort Subsidy Privatization Developmient Investment Toa-aka
Containnment
Tver 2 1 1 2 0 2 8 4Yaroslavl 2 1 2 1 2 2 10 5Nizlhi Novgorod 2 1 1 2 1 2 9 4Cheboksaiy 1 1 2 1 0 0 b/ 5 2Kazan 1 2 1 0 1 2 7 3Ulyanovsk 0 1 2 0 0 0 3 1Samara 2 2 1 1 2 2 10 5Saratov 2 2 0 1 1 1 b/ 7 3Volgograd 1 1 2 2 2 1 9 4Astmikhan 1 0 1 2 1 0 5 2
Source: Tables 4, 5 and 6
High: 2; Medium: 1; Low: 0a/ Total points are translated into ranks by dividing by 2 and rounding to the lower number.b/ Assumption based on regional data.

Table 8: Governors and Mayors: Volga Regions- and Capital Cities
Region / City / Office Years Name Comment
Tver
Governor 1995- VladimiT Platov former mayor of a town, well connected with big businesses199 1-1995 Vladimir Suslov Appointed by Yeltsin
Mayor 1996 Alexander Belousov K Reformist leader, good administrator, popular, initiates FI
YaroslavlReformer, appointed' 92, elected' 95 over a communist candidate.
Governor 1992- AaoyLsisRussia Choice Party, good administratorMayor 1995- IV. Volonchunas Political ally of governor
Nizhni Novgorod
Govemor 1996- Ivan Skylarov Reformer but models himself after Luzhkov, not Nemtsov1991-1996 Boris Nemtsov Early liberal retormer, became minister and Deputy Prime Minister
Mayor 1995-1996 Ivan Skylarov Reformer1992-1994 DDmitri Bednyakov Reformer, appointed by Nemtsov
Chuvash/CheboksaryPresident 1996. Ni .oli F vReformer, previously Law Minister of Russia, good Moscow and
President 1996- Nikolai Fyoderov 1itrainlcnatinternational contactsMayor 1996- Anatoly Igumnov Progressive, first elected oillowing a series of short appointments
Tatarstan/KazanPresident 1996- Minitmer Shaiinev 1ReForm-onented, but in a "human" way, good international contactsMayor 1996- Isakhov Ally of Shaimiev, good administrator
SamaraGovemor Electe 1996KoReformer, Our Home is Russia Party, good influence in Moscow,
Governor Elected 1996 Konstantim Titov prfssoa adinsraoprofessional administrator
1997- Gregory Laminski Elected with support ot Yabloko and Lebed against a communistMayor T991 - 1997 Oleg Sysuyev appointed, then twice elected in '94 and '96. Excellent international
UlyanovskGovemorT1991-el96) YuriGoryaConservative from Our Home is Russia Party, won election against a
Governor 1991- (eL.'96) Yuri Goiyachev communistMayor T996T-~f Vitalii Marusin Run and won against Ermakov, considered more independent
aYr 192- 1996 Sergey Ermakov Dependent on region and (ioryachev
SaratovReform-oriented, with hands-on policies, gives priority to agriculture,
1996- Dmitri Ayatskhov supported by Yeltsin
Govemor 1994- 1996 A.N. Malikov Appointed by Yeltsin, former communist, conservative and not veryGovernor 1994-1996 A.N. Malikov effective
1992-1994 Yuri Belyh Appointed by Yeltsin, former communist, conservative and not very1992-1994 luiBlheffective
Mayor 1996- Yuri Akseyenko FElected after a series of appointed mayors (Kitov, Malikov)
VolgogradGoveor 1996- lNikolai Maksyuta Conservative, defeated Shabunin, governs a communist Duma
G 199 -196 Ivan Shabunin Still influential even after defeat, authoritative, strong administrationMayor 995- Yu Chekov Moderate city council communist, reform-oriented
Astrakhan
Govemor 1991- (el.'96) Anatoly Guzhvin Pragmatist, Our Home is Russia Party. Ifuential in broader VoIgaregion
Mayor 1995. AleanroiAppointed'95, elected' 96, Our Home is Russia Party, efficient andMayor 1995- Alexandrovidh Bezrukavmikov atoiaieSuc:CycsstIes and news soauthoritative.
Source: City case studies and news sources.

Table 9: Capital Cities Real Economic and Social Wages, Employmentand Unemployment plus Regional Wage Arrears
(percent changes over 1990-96 or 1996 levels)
Real Economic Real Social Wage Percent Change Percent Official RegionalCapital Cities Wage (ratio to subsistence in Real Change in Unemployment Wage
(1990 Rubles) minimum) Economic Wage Employment Rate Arrears a/
Tver 241 2.3 -12 -15 2.3 25Yaroslavl 180 2.5 -34 -21 6.9 32Nizhni Novgorod 180 2.6 -34 -16 N/A 22Cheboksary .168 2.0 -36 -20 6.2 37Kazan 207 2.6 -22 -12 N/A 50Ulyanovsk 145 2.5 -46 -7 3.2 39Samara 201 2.4 -24 -23 N/A 12
Saratov 152 b/ 1.4 b/ -45 b/ -14 c/ N/A 36Volgograd 193 d/ 2.3 d/ -29 d/ -9 c/ 2.0 35Astrakhan 171 1.9 -36 -14 3.2 12
Source: Goskomstat, Cities of Russian Federation, 1995, Goskomstat, Regionyi Rossii, Vol. 1 andVol.2, 1997, Figure 15a from MFK Renaissance 1998b, city case studies and city statistical bulletins.
a Wage arrears as percent of the monthly wage bill. The stock of wage arrears is as at the end of1997, wage data is for November, 1997./Nominal wage in Saratov City assumed to be the same as the regional wage, as was the case in1985-1993.
cl Changes in city employment in Saratov and Volgograd are assumed to equal regional ones./Nominal wage in Volgograd City assumed to be 15% above the regional wage, as was the case in1995.

Table 10: Comparison of Initial Conditions and Policy Reform Ratingswith Socioeconomic Outcome in Regional Capitals
Socioeconomic Outcome, 1996Capital Cities Conditions Reform Real Economic Real Social
Wage a/ Wage b/
Tver 4 4 2 2Yaroslavl 4 5 1 2Nizhni Novgorod 2 4 1 2Cheboksary 0 2 1 1Kazan 3 3 2 2Ulyanovsk 0 1 0 2Samara 4 5 2 2Saratov 5 3 0 0Volgograd 4 4 1 2Astrakhan 4 2 1 1
Source: Tables 3, 7 and 9.
a/ Real economic wage is the ratio of the monthly nominal wage and the regional consumerprice index with base in 1990.
b/ Real social wage is the ratio of the monthly nominal wage and the cost of the subsistenceminimum.

Appendix Table 1: Cumulative Growth of Regional Consumer Price Indexes (1990=100)
Regions 91/90 a/ 92/90 b/ 1 93/90 b/ 94/90 b/ 95/90 bl 96/90 c/ 97/90 c/
Tver 1.89 21 190 807 2375 2854 3248Yaroslavl 1.89 23 257 1227 3664 4588 5129Nizhni Novgorod 1.89 27 265 1097 3034 4029 4396Chuvashia 1.89 22 219 904 2706 3388 3781Tatarstan 1.89 22 219 872 2536 3140 3689Ulyanovsk 1.89 24 265 1010 2972 3819 4698Samara 1.89 27 287 1151 3387 4145 4664Saratov 1.89 24 221 874 2469 3202 3692Volgograd 1.89 26 261 1063 3148 3809 4320Astrakhan 1.89 23 237 969 3175 3934 4500
Memo ItemRussian Federation 1.89 27 258 1276 3849 5804 6443Moscow City 1.89 23 224 1010 3013 3615 4078
Source: Goskomstat, Regionyi Rossii, Vol. 2, 1997, Goskomstat, Sotzialnoe Polozhenie i UrovenZhizni Naselenia Rossii, 1997, PlanEcon Report, No. 8-9 and No. 23-24, 1994, Goskomstat,Tzenyi v Rossii, 1998 and authors estimates.
a/ Regional CPIs in 1991 are approximated by the annual average CPI for the Russian Federation.b/ Regional CPIs in 1992-1995 are annual averages estimated from monthly data.£/ Regional CPIs in 1996 and 1997 are December to December values.

Appendix Table 2: Population of Cities Under Regional Jurisdiction(thousands, end of year)
Regions 1990 1991 a/ 1992 a/ 1993 a/ 1994 a/ 1995 1996b/ |1997 c/
Tver 927 926 925 924 922 921 922 922Yaroslavl 1053 1050 1048 1045 1043 1040 1038 1036Nizhni Novgorod 2291 2300 2309 2318 2327 2336 2333 2330Chuvashia 716 720 724 728 732 736 736 737Tatarstan 2408 2417 2425 2433 2442 2450 2452 2454Ulyanovsk 819 827 836 846 855 864 864 864Samara 2555 2553 2552 2551 2549 2548 2546 2545Saratov 1761 1761 1762 1762 1762 1762 1751 1740Volgograd 1593 1597 1601 1605 1609 1613 1614 1615Astrakhan 563 565 567 569 572 574 575 576
Source: Goskomstat "Chislenost Naselenia Rossiiskoi Federatziipo Gorodam, PoselkamGorodskogo Tipa i Rayonam na I Ianvaria 1997g. ", Moskva 1997, Goskomstat "ChislenostNaselenia Rossiiskoi Federatziipo Gorodam, Poselkam Gorodskogo Tipa i Rayonam na 1Ianvaria 1996 g. ", Moskva 1996, Goskomstat "Chislenost Naselenia Rossiiskoi Federatzii poGorodam, Poselkam Gorodskogo Tipa i Rayonam na 1 lanvaria 1991 g.", Moskva 1991.
a/Data for 1991-1994 interpolated assuming constant annual growth rate of population between1990-1995.
bl Data forI 996 interpolated assuming constant annual growth rate of population between 1995-1997.
c/ Beginning of the period value.
Definition of CRJs used:1. Astrakhan Oblast, Chuvashia Republic, Tatarstan Republic, Volgograd Oblast, Yaroslavl
Oblast: Cities above 30 thousand2. Saratov Oblast, Tver Oblast: Cities above 20 thousand3. Nizhegorod Oblast: Cities above 50 thousand plus the three largest cities (out of four) with
population between 30 and 49.9 thousand (excluded - Gorodetz)4. Samara Oblast: Cities above 30 thousand plus the largest city (out of two) with population
between 20 and 29.9 thousand (excluded - Neftegorsk)5. Ulyanovsk Oblast: Cities above 30 thousand plus the largest city (out of two) with population
between 20 and 29.9 thousand (excluded - Bar'ish)
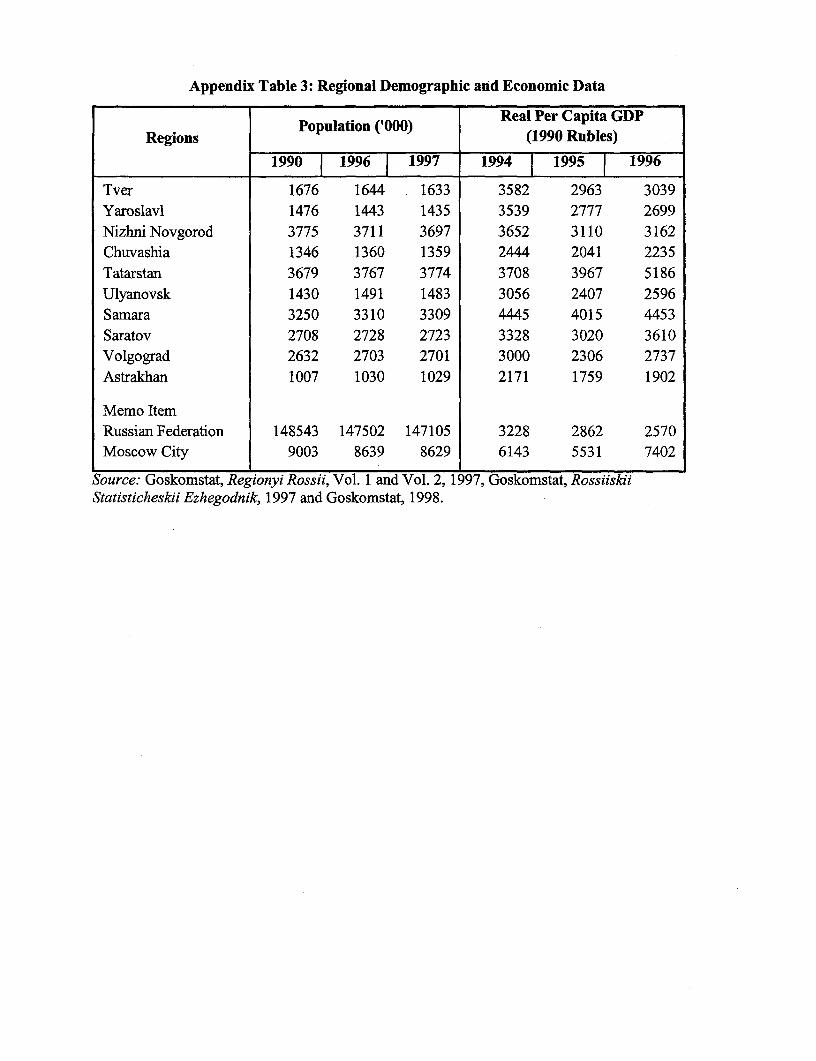
Appendix Table 3: Regional Demographic and Economic Data
Real Per Capita GDPRegions Population ('000) (1990 Rubles)
1990 1996 1997 1994 1995 1996
Tver 1676 1644 1633 3582 2963 3039Yaroslavl 1476 1443 1435 3539 2777 2699Nizhni Novgorod 3775 3711 3697 3652 3110 3162Chuvashia 1346 1360 1359 2444 2041 2235Tatarstan 3679 3767 3774 3708 3967 5186Ulyanovsk 1430 1491 1483 3056 2407 2596Samara 3250 3310 3309 4445 4015 4453Saratov 2708 2728 2723 3328 3020 3610Volgograd 2632 2703 2701 3000 2306 2737Astrakhan 1007 1030 1029 2171 1759 1902
Memo ItemRussian Federation 148543 147502 147105 3228 2862 2570Moscow City 9003 8639 8629 6143 5531 7402
Source: Goskomstat, Regionyi Rossii, Vol. 1 and Vol. 2, 1997, Goskomstat, RossiiskiiStatisticheskii Ezhegodnik, 1997 and Goskomstat, 1998.

Appendix Table 4: Real Wages, Real Average Monthly Income and Ratios of Nominal Monthly Incomeand Wages to Cost of Subsistence Minimum for Volga Regions, 1996 and 1997
Real Monthly Wage Average Monthly Wage to Real Per Capita Monthly Average Monthly Income toRegions (1990 Rubles) Subsistence Minimum Income (1990 Rubles) Subsistence Minimum
1996 1997 a/ 1996 1997 a/ 1996 1997 b/ 1996 1997 b/
Tver 198 257 1.9 2.6 171 210 1.7 2.1Yaroslavl 141 184 2.0 2.7 136 202 1.9 3.0Nizhni Novgorod 160 215 2.3 3.0 130 218 1.9 3.1Chuvashia 130 200 1.6 2.4 117 138 1.4 1.7Tatarstan 230 300 2.9 3.7 176 257 2.2 3.2Ulyanovsk 137 177 2.4 3.1 126 182 2.2 3.2Samara 220 286 2.6 3.7 167 288 2.0 3.7Saratov 152 227 1.4 2.4 141 206 1.3 2.2Volgograd 168 231 2.0 2.9 125 198 1.5 2.4Astrakhan 151 228 1.7 2.8 117 183 1.3 2.2
Memo ItemRussian Federation 136 186 2.1 2.9 132 186 2.1 2.9
Source: Goskomstat, Regionyi Rossii, Vol. 1 and Vol. 2, 1997, Goskomstat, Sotzialno-Ekonomicheskoe Polozhenie Rossii, January,1998.
H: High; M: Medium; L: Lowa/ December, 1997 data. The percentage change over annual data for 1996 is estimated to be the same as for nominal wages plus social
transfers, since data for nominal wages alone are no longer available.b/ December, 1997 data.

Appendix Table 5: Prices and Tariffs on Basic Services Provided by Eight Cities, 1996(Current Rubles, as of 12/31/96)
1NizhniServices / Cities Tver Yaroslavl Novgord Cheboksary Kazan Ulyanovsk Samara Saratov
City Public Bus (I Trip) 700 500 1200 * 700 900 500 1000 800Municipal Housing (Rubles/Sq. Meter) 471 260 543 77 990 25 754 * 45Telephone (Monthly) 18000 * N/A 18000 * N/A N/A 12500 14000 14000Electricity (per 100 Kilowatt/Hour) 6000 12000 12000 14000 * 12000 7200 12500 9000Water Supply and Sewerage (Monthly per Person) 1375 N/A 3496 N/A N/A 1740 5175 * 2934Hot Water Supply (Monthly per Person) 3741 N/A 5064 N/A N/A 1800 7530 * 3185Natural Gas (Monthly per Person) 1200 855 1350 900 1000 1500 * 640 891Central Heating (Monthly per Person per Sq. Meter) 343 662 * 480 480 300 150 351 305Primary Health Care (per Doctor's Visit) 30000 * N/A 19865 20500 19704 8367 5660 1800
Source: City case studies and city statistical bulletins.
*Highest price for this service.

Appendix Table 6: Cost a Set of 25 Food Items and the Subsistence Minimum(thousand current rubles)
Cost of a Set of 25 Basic Food Items in Capital Monthly Minimum Subsistence,Capital Cities City, End of Year a/ Region bJ
1992 e/ 1993 1994 1995 1996 1997 1994 1995 1996 1997 d/
Tver 4 21 82 174 186 203 77 222 294 327Yaroslavl 4 23 85 176 201 219 98 255 329 349Nizhni Novgorod 4 23 94 184 201 206 76 216 282 312Cheboksary 3 19 70 156 179 184 68 197 279 316Kazan 3 19 70 149 166 188 60 192 251 300Ulyanovsk 2 13 51 127 147 183 51 154 217 264Sarnara 4 30 91 213 216 226 79 257 351 359Saratov 4 23 89 187 205 205 84 242 350 349Volgograd 4 23 85 182 196 214 79 237 322 350Astrakhan 3 24 76 176 200 226 77 244 347 367
Memo ItemRussian Federation N/A 26 91 198 220 233 87 264 369 415
Source: Goskomstat, Regionyi Rossii, Vol.2, 1997, Goskomstat, Tzenyi v Rossii, 1998 andGoskomstat, Sotzialno-Ekonomicheskoe Polozhenie Rossii, January, 1998.
The set of 25 food items includes foods from 11 aggregate groups: bread products, potatoes,vegetables, fruits, meat products, fish products, eggs, milk products, sugar and candies, oil andmargarin, salt and pepper.
b Annual average data. The subsistence minimum includes expenditures on minimum quantities ofcertain food items, expenditures on non-food goods and services and payments of taxes and otherrequired payments. The shares of the above mentioned expenditures in the subsistence minimumare determined by their corresponding shares in the expenditures of the households in the lowest10% of the income distribution (see Goskomstat, Sotzialnaia Sfera Rossii, 1996, p.48).
cl Cost of a set of 19 food items.d' December, 1997 data.
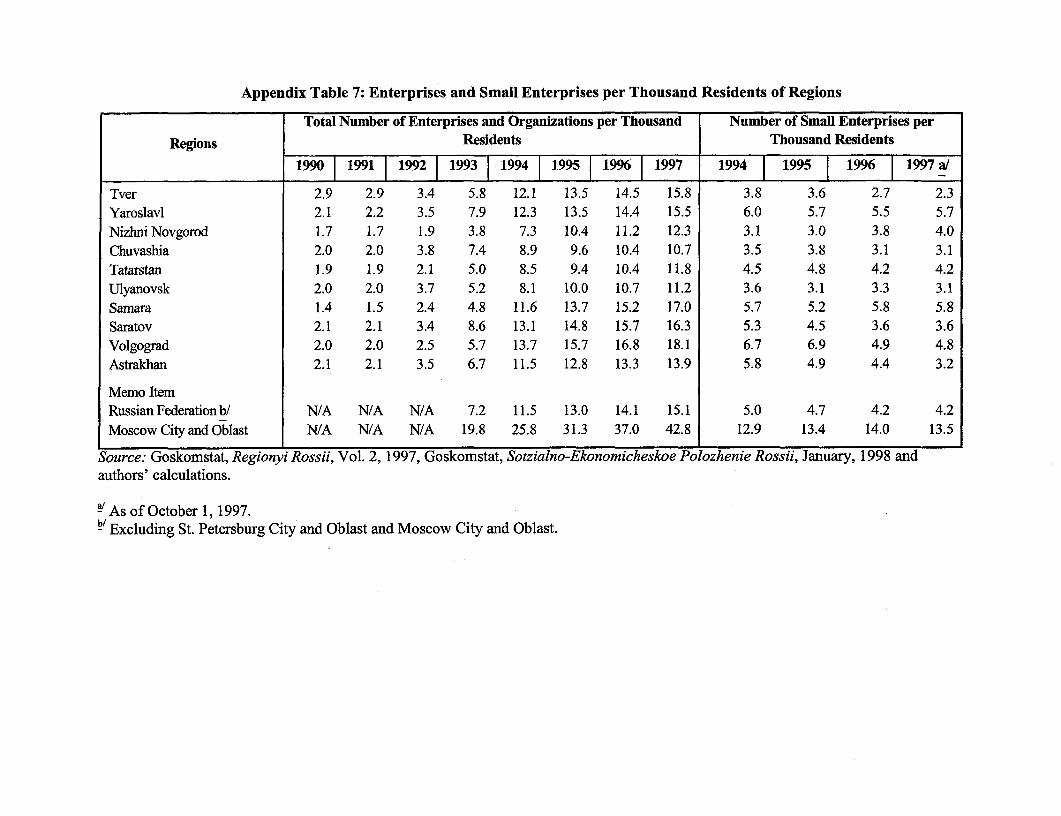
Appendix Table 7: Enterprises and Small Enterprises per Thousand Residents of Regions
Total Number of Enterprises and Organizations per Thousand Number of Small Enterprises perRegions Residents Thousand Residents
1990 1991 1992 1993 1994 1995 1996 1997 1994 1995 1996 1997al
Tver 2.9 2.9 3.4 5.8 12.1 13.5 14.5 15.8 3.8 3.6 2.7 2.3Yaroslavl 2.1 2.2 3.5 7.9 12.3 13.5 14.4 15.5 6.0 5.7 5.5 5.7NizhniNovgorod 1.7 1.7 1.9 3.8 7.3 10.4 11.2 12.3 3.1 3.0 3.8 4.0Chuvashia 2.0 2.0 3.8 7.4 8.9 9.6 10.4 10.7 3.5 3.8 3.1 3.1Tatarstan 1.9 1.9 2.1 5.0 8.5 9.4 10.4 11.8 4.5 4.8 4.2 4.2Ulyanovsk 2.0 2.0 3.7 5.2 8.1 10.0 10.7 11.2 3.6 3.1 3.3 3.1Samara 1.4 1.5 2.4 4.8 11.6 13.7 15.2 17.0 5.7 5.2 5.8 5.8Saratov 2.1 2.1 3.4 8.6 13.1 14.8 15.7 16.3 5.3 4.5 3.6 3.6Volgograd 2.0 2.0 2.5 5.7 13.7 15.7 16.8 18.1 6.7 6.9 4.9 4.8Astrakhan 2.1 2.1 3.5 6.7 11.5 12.8 13.3 13.9 5.8 4.9 4.4 3.2
Memno ItemRussianFederationb/ N/A N/A N/A 7.2 11.5 13.0 14.1 15.1 5.0 4.7 4.2 4.2MoscowCityandOblast N/A N/A N/A 19.8 25.8 31.3 37.0 42.8 12.9 13.4 14.0 13.5
Source: Goskomstat, Regionyi Rossii, Vol. 2, 1997, Goskomstat, Sotzialno-Ekonomicheskoe Polozhenie Rossii, January, 1998 andauthors' calculations.
a' As of October 1, 1997.b/ Excluding St. Petersburg City and Oblast and Moscow City and Oblast.

Appendix Table 8: Main Characteristics of Active Joint Venturesand Foreign Investment in Volga Regions
Active Joint VenturesFlow of Total Foreign
Number of Real Volumie of Investment,Regions Total Number Employees ('000) Production (M. (USD per Capita)
Emploees (000) 1990 Rubles)
_1995 | 1999617_799 1996 1995-96 a/ i 1997Tver 43 40 0.9 0.9 17 27 52 4Yaroslavl 85 91 1.4 13.3 33 167 0.3 b/ 16
NizhniNovgorod 115 140 7.0 7.6 420 252 31 c/ 39Chuvashia 56 59 0.8 0.6 12 18 1 b/ 0.03Tatarstan 125 139 6.6 7.3 323 241 61 185Ulyanovsk 30 22 0.4 1.7 4 78 0.2 2Samara 122 122 4.5 6.3 102 119 54 26Saratov 82 82 4.0 4.8 171 141 10 9Volgograd 157 152 3.8 4.6 89 138 16 10Astrakhan 60 84 1.2 1.2 9 13 1 0.2
Memo ItemRussian Federation d/ 6272 6303 223 283 6926 6156 N/A 26Moscow City 6634 8067 90 146 2683 7945 N/A 820
Source: Goskomstat, Regionyi Rossii, Vol. 2, 1997, Goskomstat, Sotzialno-EkonomicheskoePolozhenie Rossii, January 1998 and authors' calculations.
a' Calculated with 1996 regional population data.bl 1995 data only.£' 1996 data is for the capital city of the region only.d/ Excluding Moscow City and St. Petersburg City.

Appendix Table 9: Changes in Average Real Monthly Wage, Employment andReal per Capita Income in Volga Regions, 1990 - 1996
(percent)
Regions M hAverage Real Employment a Real Per CapitaMonthly Wage _ Income
Tver -22 -16 -11Yaroslavl -47 -14 -34Nizhni Novgorod -38 -9 -35Chuvashia -46 -11 -29Tatarstan -13 -11 -6Ulyanovsk -47 -12 -33Samara -17 -8 -17Saratov -41 -14 -29Volgograd -38 -9 -37Astrakhan -40 -14 -40
Memo ItemRussian Federation -55 -12 -39
Source: Goskomstat, Regionyi Rossii, Vol. 1, 1997, Goskomstat "RossiiskiiStatisticheskii Ezhegodnik 1997".
a/ Regional data is for the period 1990-1995.

Appendix Table 10: Unemployment in-Regions
Unemployment Number of Registered UnemployedRegion Rate a/ (000's)
1995 1995 1996 1997 b/
Tver 8.0 14 20 10Yaroslavl 11.5 61 46 19Nizhni Novgorod 7.8 54 57 47Chuvashia 9.6 48 44 24Tatarstan 6.4 26 37 40Ulyanovsk 7.8 23 21 15Samara 7.3 33 58 64Saratov 9.6 46 46 25Volgograd 10.3 18 26 15Astrakhan 13.1 23 24 17
Memo ItemRussian Federation 8.8 2327 2506 1999
Source: Goskomstat, Regionyi Rossii, Vol. 1 and Vol. 2, 1997, Goskomstat, Sotzialno-Ekonomicheskoe Polozhenie Rossii, January, 1998.
a/ Registered and non-registered unemployed as percent of the economically activepopulation.
As of the end of December, 1997.

Appendix Table 11: Changes in City Industrial Output and Employment, 1990 - 1996
Physical Volume of Industrial Production Share of Workers tCapital Cities (1990=100) Employment (%)
1990 1991 1992 1993 1994 1 1995 1 1996 1990 1996
Tver 100 100 80 73 50 40 30 31 26Yaroslavl 100 97 79 68 51 42 36 44 N/ANizhni Novgorod 100 102 101 105 72 70 67 44 35Cheboksary 100 101 77 66 38 30 25 50 38 a/Kazan 100 101 83 71 52 50 47 47 30 a/Ulyanovsk 100 111 107 113 102 84 79 46 39 a/Samara 100 98 96 79 58 51 36 43 33 a/Saratov 100 103 88 85 46 30 21 41 N/AVolgograd 100 N/A N/A N/A N/A N/A N/A 41 35 a/Astrakhan 100 103 98 81 60 47 33 34 25
Source: Goskomstat, Cities of Russian Federation, 1995, city case studies and city statisticalbulletins.
a/ 1995 data.

Appendix Table 12: Changes in Industry Shares Measured in Current Prices, 1990-1996(percentage points)
Industrial Sectors Yaroslavl Nizho d Kazan Samara Astrakhan RussiaNovgorod
Fuel and energy complex 6.4 14.3 -4.8 29.6 14.3 27.1Chemical and petrochemical 2.4 0.1 12.6 -2.0 0.1 -0.6Metallurgy -0.5 -2.4 -0.1 -0.2 -2.4 1.8Machinery and metal working 5.5 30.5 9.0 -10.2 30.5 -11.1Forest products -5.0 -13.7 -1.8 -2.7 -13.7 -1.6Construction 1.0 -1.9 1.7 -2.4 -1.9 0.8Light industry -12.8 -15.2 -11.6 -4.8 -15.2 -9.1Food industry 2.0 -8.0 -7.7 -2.9 -8.0 -2.9Other 1.2 -3.8 2.7 -4.4 -3.8 -4.3
Source: Calculations from 1990-96 enterprise database, as cited in Ivanov 1998b.

Appendix Table 13: Changes in Telephones and Automobiles Possession and Retail Trade,1990 - 1996
l elephones per lWUU Automobiles per 1WCUResidents Residents Percent Change in Real
Capital Cities Per Capita Retail Trad1990 1996 Percent 1990 1996 Percent in Consumer Goods
Change Change and Services
Tver 80 111 39 54 112 107 -39Yaroslavl 155 2 19 a/ 41 47 87 86 N/ANizhni Novgorod 196 237 21 45 88 96 -71Cheboksary 164 N/A N/A 24 N/A N/A -35Kazan 118 N/A N/A 42 78 a/ 85 6Ulyanovsk 103 134 a/ 30 53 87 a/ 64 -35 a/Samara 156 202 a/ 29 68 116 al 71 -24 a/Saratov 123 151 23 67 118 76 N/AVolgograd 138 200 45 67 89 33 42Astrakhan 116 165 a/ 42 55 88 60 -68 a/
Source: Goskomstat, Cities of Russian Federation, 1995, city case studies and city statisticalbulletins.
!! 1995 data.

Appendix Table 14: School Age Population and Pupils in 2nd and 3rd Shifts,1990 and 1996
School Age Population as Pupils in 2nd and 3rd Shifts as
Capital Cities Percent of the Total Percent of the Total
1990 1996 Percent 1990 1996 PercentChange Change
Tver 19.6 17.8 -9 33.0 35.0 6Yaroslavl 20.5 17.7 -14 24.9 29.8 a/ 20Nizhni Novgoro i N/A N/A N/A 27.1 N/A N/ACheboksary 25.9 23.9 a/ -8 21.2 28.2 a/ 33Kazan N/A 20.7 a/ N/A 22.2 31.4 41Ulyanovsk 24.8 23.5 a/ -5 27.8 b/ 32.9 a/ 18Samara 20.7 b/ 18.0 -13 32.9 37.2 a/ 13Saratov 19.8 18.3 -8 31.9 34.7 9Volgograd 19.7 19.1 -3 26.3 32.1 22Astrakhan N/A N/A N/A 36.5 39.9 9
Source: Goskomstat, Cities of Russian Federation, 1995, city case studies and citystatistical bulletins.
a/ 1995 data.b/ 1992 data.

Poii-, Resea,ch Working Paper Series
ContactTid3e Author Date for paper
WPS2149 Income Gains to the Poor from Jyotsna Jalan July 1999 P. SaderWorkfare: Estimates for Argentina's Martin Ravallion 33902Trabajar Program
WPS215rO Who Wants to Rsdistribute? Russia's Martin Ravallion July 1999 P. SaderTunnel Effect in the 1990s Michael Lokshin 33902
WPS215i A Few Things Transport Regulators Ian Alexander July 1999 G. Chenet-SmithShould Know about Risk and the Cost Antonio Estache 36370Of Capital Adele Oliveri
WPS215,2 Comparing the Performance of Public Antonio Estache July 1999 G. Chenet-Smithand Private Water Companies in the Martin A. Rossi 36370Asia and Pacific Region: What aStochastic Costs Frontier Shows
WPS2153 The Mystery of the Vanishing Martin Ravallion July 1999 P. SaderBenefits: Ms. Speedy Analyst's 33902Introduction to Evaluation
WPS2154 Inter-Industry Labor Mobility in Howard Pack August 1999 H. SladovichTaiwan, China Christina Paxson 37698
WPS2155 Lending Booms, Reserves, and the Barry Eichengreen August 1999 S. KpundehSustainability of Short-Term Debt: Ashoka Mody 39591Inferences from the Pricing ofSyndicated Bank Loans
WPS2156 How Has Regionalism in the 1990s Isidro Soloaga August 1999 L. TabadaAffected Trade? L. Alan Winters 36896
WPS2157 How Regional Blocs Affect Excluded Won Chang August 1999 L. TabadaCountries: The Price Effects of L. Alan Winters 36896MERCOSUR
WPS2158 The Effect of Foreign Entry on George R. G. Clarke August 1999 P. Sintim-AboagyeArgentina's Domestic Banking Robert Cull 38526Sector Laura D'Amato
Andrea Molinari
WPS2159 Provincial Bank Privatization in George R. G. Clarke August 1999 P. Sintim-AboagyeArgentina: The Why, How, and Robert Cull 38526"So What?"
WPS21 60 Protecting the Poor from Francisco Ferreira August 1999 PREMMacroeconomic Shocks Giovanna Prennushi 87736
Martin Ravallion
Policy Research Working Paper Series
ContactTitle Author Date for paper
WPS2161 Will the Real "Natural Trading Maurice Schiff August 1999 M. KasilagPartner" Please Stand Up? 39081
WPS2162 Quantifying the Fiscal Effects Shantayanan Devarajan August 1999 H. Sladovichof Trade Reform Delfin S. Go 37698
Hongyi Li
WPS2163 Coverage under Old-Age Security Estelle James August 1999 M. LeenaertsPrograms and Protection for the 84264Uninsured - What Are the Issues?
WPS2164 Challenging El Salvador's Rural Maureen Lewis August 1999 M. LewisHealth Care Strategy Gunnar S. Eskeland 39080
Ximena Traa-Valerezo