p r rpor or forecast of platinum supply & demand in 2014
TRANSCRIPT

PGM MARKET REPORT NOVEMBER 2014
1
Precious Metals Management
Forecast of PlatinumSUPPLY & DEMAND IN 2014
The loss of well over 1 million oz of platinum production due to a five-month strike in South Africa is expected to push the platinum market into a large deficit this year. While investment and jewellery demand will retreat from the record levels seen in 2013, industrial demand will remain firm, on the back of unusually high demand from the chemicals industry. Platinum sales to automakers are buoyant, in line with strong output of diesel cars in Europe, and the implementation of Euro 6 /Euro VI legislation on light and heavy duty vehicles respectively.
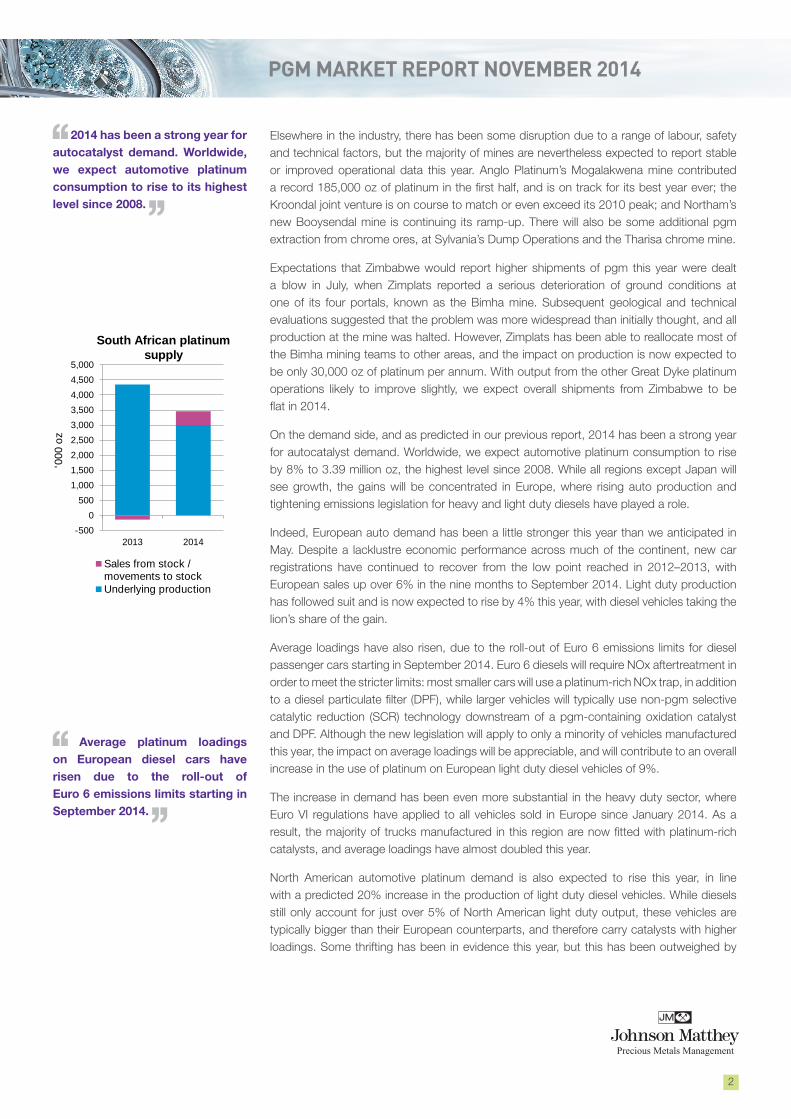
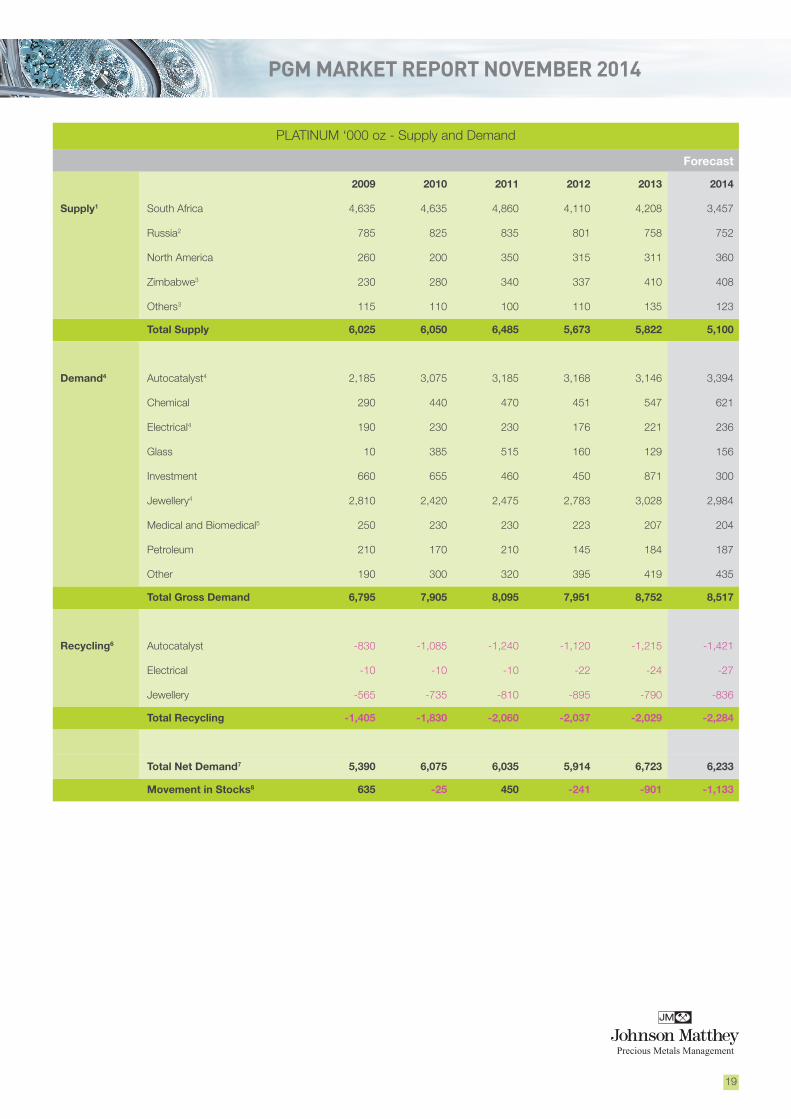
We estimate that world primary supplies of platinum will total 5.1 million oz in 2014, a decline of 12%, reflecting the loss of over five months’ production from strike-hit mines in South Africa. Shipments from other regions will increase slightly this year, due to growth in pgm production by Canadian nickel miners.
Supplies of platinum from South African mines are expected to fall by 18% to 3.46 million oz in 2014, following prolonged industrial action at the western Bushveld operations of Anglo Platinum, Impala Platinum and Lonmin that together account for just over half of South Africa’s platinum production. Our new estimate for 2014 is some 500,000 oz lower than that given in our May report; our previous figure was predicated on a three-month strike, and allowed for the loss of at least 800,000 oz of platinum output due to labour stoppages. Ultimately, the affected mines were closed for over five months, and the amount of production foregone during the strike and the subsequent ramp-up is now thought to be around 1.3 million oz.
Destocking by producers has helped to mitigate the impact of the strike on supplies to the market. During the first half, we estimate that producers refined and sold some 200,000 oz platinum from in-process inventories, and also shipped over 300,000 oz from pre-existing stockpiles of refined metal. We allow for some modest post-strike rebuilding of pipeline and refined inventories: our preliminary estimate of 2014 supplies is based on the assumption that, for the full calendar year, net destocking will contribute around 450,000 oz to South African platinum supplies.
Output from the affected mines resumed in July. The post-strike ramp-up has proceeded more rapidly than many industry observers anticipated, with both Anglo Platinum and Lonmin reporting that production was close to planned levels by the end of the third quarter. Impala’s build-up was hampered by a series of accidents which resulted in the Rustenburg lease area being closed for several days in September, but should improve in the final quarter. However, recent shaft closures combined with delays in the ramp-up of replacement projects mean that capacity at these operations is now considerably lower than it was in the recent past, with an estimated half a million ounces of annual platinum output having been shed in the last five years.
• The deficit in the platinum market will widen to a record 1.13 million oz in 2014, following industrial action at major South African mines.
• Around 1.3 million oz of platinum production were foregone during the five-month strike and the subsequent ramp-up.
• Destocking by producers has helped support South African supplies, which are expected to fall 18% to 3.46 million oz.
• Auto demand is buoyant, especially in Europe, where car production is rising and diesel emissions legislations tightened this year.
• Investment and jewellery demand will retreat from last year’s record levels, but industrial demand will be strong, especially in the Rest of World region.
FORECAST: PLATINUM
Platinum Supply and Demand ‘000 oz
Supply 2012 2013 2014
South Africa 4,110 4,208 3,457
Russia 801 758 752
Others 762 856 891
Total Supply 5,673 5,822 5,100
Gross Demand
Autocatalyst 3,168 3,146 3,394
Jewellery 2,783 3,028 2,984
Industrial 1,550 1,707 1,839
Investment 450 871 300
Total Gross Demand 7,951 8,752 8,517
Recycling -2,037 -2,029 -2,284
Total Net demand 5,914 6,723 6,233
Movements in Stocks -241 -901 -1,133
PGM MARKET REPORT NOVEMBER 2014
Precious Metals Management
2
2014 has been a strong year for autocatalyst demand. Worldwide, we expect automotive platinum consumption to rise to its highest level since 2008.
Elsewhere in the industry, there has been some disruption due to a range of labour, safety and technical factors, but the majority of mines are nevertheless expected to report stable or improved operational data this year. Anglo Platinum’s Mogalakwena mine contributed a record 185,000 oz of platinum in the first half, and is on track for its best year ever; the Kroondal joint venture is on course to match or even exceed its 2010 peak; and Northam’s new Booysendal mine is continuing its ramp-up. There will also be some additional pgm extraction from chrome ores, at Sylvania’s Dump Operations and the Tharisa chrome mine.
Expectations that Zimbabwe would report higher shipments of pgm this year were dealt a blow in July, when Zimplats reported a serious deterioration of ground conditions at one of its four portals, known as the Bimha mine. Subsequent geological and technical evaluations suggested that the problem was more widespread than initially thought, and all production at the mine was halted. However, Zimplats has been able to reallocate most of the Bimha mining teams to other areas, and the impact on production is now expected to be only 30,000 oz of platinum per annum. With output from the other Great Dyke platinum operations likely to improve slightly, we expect overall shipments from Zimbabwe to be flat in 2014.
On the demand side, and as predicted in our previous report, 2014 has been a strong year for autocatalyst demand. Worldwide, we expect automotive platinum consumption to rise by 8% to 3.39 million oz, the highest level since 2008. While all regions except Japan will see growth, the gains will be concentrated in Europe, where rising auto production and tightening emissions legislation for heavy and light duty diesels have played a role.
Indeed, European auto demand has been a little stronger this year than we anticipated in May. Despite a lacklustre economic performance across much of the continent, new car registrations have continued to recover from the low point reached in 2012–2013, with European sales up over 6% in the nine months to September 2014. Light duty production has followed suit and is now expected to rise by 4% this year, with diesel vehicles taking the lion’s share of the gain.
Average loadings have also risen, due to the roll-out of Euro 6 emissions limits for diesel passenger cars starting in September 2014. Euro 6 diesels will require NOx aftertreatment in order to meet the stricter limits: most smaller cars will use a platinum-rich NOx trap, in addition to a diesel particulate filter (DPF), while larger vehicles will typically use non-pgm selective catalytic reduction (SCR) technology downstream of a pgm-containing oxidation catalyst and DPF. Although the new legislation will apply to only a minority of vehicles manufactured this year, the impact on average loadings will be appreciable, and will contribute to an overall increase in the use of platinum on European light duty diesel vehicles of 9%.
The increase in demand has been even more substantial in the heavy duty sector, where Euro VI regulations have applied to all vehicles sold in Europe since January 2014. As a result, the majority of trucks manufactured in this region are now fitted with platinum-rich catalysts, and average loadings have almost doubled this year.
North American automotive platinum demand is also expected to rise this year, in line with a predicted 20% increase in the production of light duty diesel vehicles. While diesels still only account for just over 5% of North American light duty output, these vehicles are typically bigger than their European counterparts, and therefore carry catalysts with higher loadings. Some thrifting has been in evidence this year, but this has been outweighed by
Average platinum loadings on European diesel cars have risen due to the roll-out of Euro 6 emissions limits starting in September 2014.
-500
0
500
1,000
1,500
2,000
2,500
3,000
3,500
4,000
4,500
5,000
2013 2014
'000 o
z
South African platinum supply
Sales from stock /movements to stockUnderlying production

PGM MARKET REPORT NOVEMBER 2014
3
Precious Metals Management
61%
15%
17%
2%
5%
LD Diesel LD Gasoline HDD Motorcycles NRMM
Platinum demand by auto sector 2014
Platinum Demand: Autocatalyst ‘000 oz
Gross Recycling Net
2012 2013 2014 2012 2013 2014 2012 2013 2014
Europe 1,331 1,330 1,528 -367 -457 -566 964 873 962
Japan 608 568 561 -82 -83 -91 526 485 470
North America 380 334 370 -577 -563 -634 -197 -229 -264
China 93 119 131 -15 -19 -25 78 100 106
Rest of World 756 795 804 -79 -93 -105 677 702 699
Total 3,168 3,146 3,394 -1,120 -1,215 -1,421 2,048 1,931 1,973
gains in vehicle output. This strong performance reflects buoyant demand for larger vehicles, which are often used for commercial purposes, along with the introduction of a wider range of lighter diesel models by US automakers.
Japanese automakers are the only remaining significant users of platinum
in gasoline emissions control, both in their home market and in their transplants in other regions. While we expect light duty vehicle output in Japan to improve marginally this year, thrifting and substitution continue to erode platinum usage on gasoline catalysts generally, while the Japanese domestic market has also been affected by a shift towards smaller vehicles.
In China, light duty vehicle sales continue their ascent, but most of the increase will be in the gasoline market where platinum usage is low. In the Rest of World region, light duty vehicle production has been lacklustre, especially in the diesel sector. The one bright spot has been the heavy duty sector in Mexico, where trucks are built for the US market. US truck sales have been strong this year, due to an improving economy and the need to replace an ageing fleet.
The use of platinum on autocatalysts to control emissions from diesel non-road mobile machinery (NRMM) is expected to rise by over a third in 2014, as smaller engines begin to fall within the remit of European, Japanese and North American legislation. While thrifting is becoming more evident in this sector, at present it is being more than offset by increases in the number of engines requiring catalyst fitment.
World jewellery demand is now forecast to contract marginally in 2014, to just below 3 million oz. Sales to North American jewellers have been lacklustre: local manufacturers appear to have lost market share to imports, and we also allow for some inventory reductions.
In Europe, there has been a sharp fall in sales of platinum to Swiss watch makers, following a very strong year in 2013 when several new series of luxury watches were issued. However, purchases of platinum by Indian jewellery makers are expected to rise by 24% this year, with men’s jewellery performing particularly well. Chain is a popular purchase for male jewellery buyers and, while unit volumes are relatively small, a chain typically contains much more platinum than a ring.
Chinese jewellery demand has historically been sensitive to short-term price trends, with local jewellery manufacturers proving adept at buying into price dips in order to replenish stocks of metal, which they subsequently draw upon when prices move higher. This year has been no exception. Following unusually strong purchasing during the second half of 2013, demand remained at high levels through the early part of this year, as prices remained largely unmoved by the threat, and then the reality, of a major strike in South Africa. Purchasing slackened over the northern hemisphere

PGM MARKET REPORT NOVEMBER 2014
Precious Metals Management
4
spring and summer but, since then, there is some evidence that lower platinum prices have prompted renewed buying interest: September SGE sales for jewellery were at their highest level for two years.
For the year as a whole, we expect gross sales of platinum to Chinese jewellery manufacturers to decline
marginally, but to remain over 2 million oz. This is in the context of much more muted activity in the gold jewellery market than last year, and therefore fewer opportunities for platinum to benefit from the increased retail footfall that was associated with the sharp fall in the gold price in early 2013. This has been broadly offset by continued retail expansion, albeit at a slower pace than in previous years, and by the limited premium of platinum jewellery over gold that continues to facilitate ‘upselling’ by retailers. Overall, we believe that consumer demand for platinum jewellery remains robust.
Industrial demand for platinum has generally been positive, with total usage in chemical, glass, electrical, petroleum and other applications rising by 8% to 1.84 million oz in 2014. However, this figure falls significantly short of the forecast we gave in our May 2014 report, when we expected industrial consumption to exceed 2 million oz this year. The primary reasons for this change are downgrades in our glass and petroleum refining estimates, details of which are given below.
Purchases of platinum by chemical companies reached an all-time high in 2013 and have remained strong during 2014, reflecting continued investment in on-purpose propylene production. One propylene synthesis route involves propane dehydrogenation (PDH) in the presence of a platinum catalyst; the economics of this process are currently attractive due to an abundant supply of propane, a natural gas liquid extracted from shale gas wells. As a result, there has been significant investment in new PDH plants using platinum technology in North America and China, although since our May report we have slightly reduced our estimates of Chinese demand, in line with new information regarding project implementation.
Demand for platinum from the electrical sector is expected to grow modestly, to 236,000 oz this year. Most of this is for hard disk drive applications. Although desktop and portable
PC sales continue to contract, with tablets and phones taking an increasing share of the personal computing market, there has been solid growth in the ‘enterprise’ storage sector (servers for business and for cloud computing). Indeed, memory requirements are growing rapidly, with demand for data storage capacity expected to grow by around 40% this year.
Despite this, the number of drives shipped is expected to grow by only around 4%. While the next generation of hard disk technology is still some years away, disk manufacturers have fine-tuned existing perpendicular magnetic recording (PMR) technology in order to improve areal density (the amount of data that can be stored on a given area of disk). One such development is shingled magnetic recording (SMR) which involves writing data
We expect sales of platinum to Chinese jewellery manufacturers to decline marginally, but to remain over 2 million oz.
Platinum Demand: Jewellery ‘000 oz
Gross Recycling Net
2012 2013 2014 2012 2013 2014 2012 2013 2014
Europe 179 219 204 -5 -5 -5 174 214 199
Japan 312 309 313 -284 -282 -270 28 27 43
North America 187 213 203 -3 0 -7 184 213 196
China 1,950 2,100 2,040 -600 -500 -550 1,350 1,600 1,490
Rest of World 155 187 224 -3 -3 -4 152 184 220
Total 2,783 3,028 2,984 -895 -790 -836 1,888 2,238 2,148
Purchases of platinum by chemical companies reached an all-time high last year and have remained strong during 2014.
0
200
400
600
800
1,000
1,200
1,400
1,600
1,800
Jan Feb Mar Apr May Jun Jul Aug Sep Oct Nov Dec
'00
0 o
z
Estimated cumulative annual purchasing by the platinum jewellery industry in China
2012 2013 2014
PGM MARKET REPORT NOVEMBER 2014
in overlapping bits, giving the effect of a shingled roof, and can be used without significant alterations to existing media and writing head technology.
Net sales to glass makers are now expected to improve only modestly this year, due to overcapacity in the LCD and fibreglass sectors, which has led to further sales of excess metal stocks. Japanese display glass producers have transferred some production lines off-shore, in response to high domestic energy costs, and have also cut overall capacity. There has also been some rationalisation in other parts of Asia. Nevertheless, Chinese LCD glass producers continue to invest in new facilities, with the aim of capturing local market share.
We have reduced our estimates of petroleum refining demand for 2012 and 2013, and our 2014 figure has also been revised downwards. This has been a period of rationalisation in Europe and North America, with a number of refineries closing due to poor margins. Many refineries located in OECD countries face competition from newer facilities in Asia and the Middle East, and European refiners in particular have been challenged by weak local gasoline demand due to the prolonged recession, growing use of diesel and biofuels, and improvements in fuel economy. We had previously assumed that much of the platinum released by refinery closures would be retained to fund top-up demand and expansions elsewhere, but it is now clear that more metal was returned to the market over the 2012 to 2013 period than we had previously allowed for.
We have downgraded our estimate of medical demand for platinum. Over the last several years, the use of pgm alloys in dentistry has been affected by a combination of improved dental hygiene, which has reduced demand for reconstructive dental work in most developed countries, and substitution with base metal alloys and ceramics. In addition, there has been a move from platinum-gold to cheaper palladium-based alloys in the German market. This process appears to have accelerated in the recent past and as a result we have adjusted our estimates.
Demand for platinum in other applications is expect to expand modestly in 2014. Much of the growth is being driven by the continued expansion of the Chinese auto market, which has generated increased requirements for pgm-containing components such as auto sensors and spark plugs.
We anticipated in our May report that physical investment would play a smaller role in determining the market balance this year, with net inflows into ETFs predicted to contract
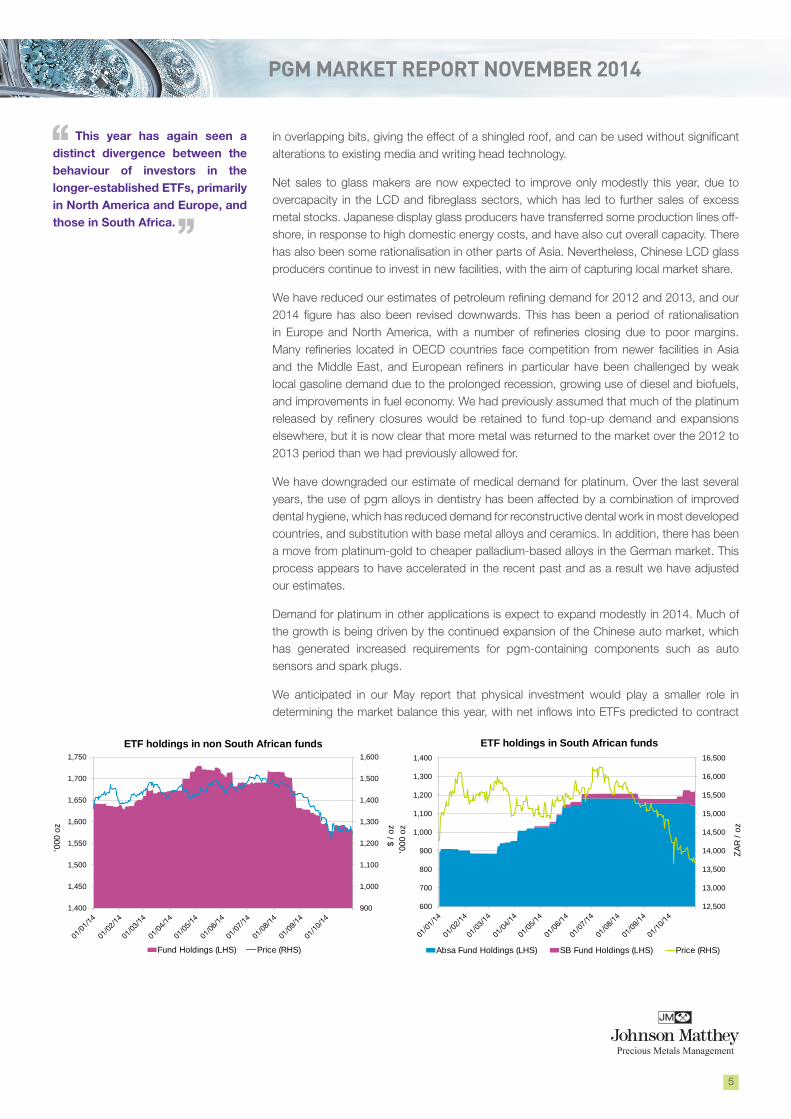
This year has again seen a distinct divergence between the behaviour of investors in the longer-established ETFs, primarily in North America and Europe, and those in South Africa.
Precious Metals Management
5
900
1,000
1,100
1,200
1,300
1,400
1,500
1,600
1,400
1,450
1,500
1,550
1,600
1,650
1,700
1,750
$ /
oz
'000
oz
ETF holdings in non South African funds
Fund Holdings (LHS) Price (RHS)
12,500
13,000
13,500
14,000
14,500
15,000
15,500
16,000
16,500
600
700
800
900
1,000
1,100
1,200
1,300
1,400
ZA
R /
oz
'000
oz
ETF holdings in South African funds
Absa Fund Holdings (LHS) SB Fund Holdings (LHS) Price (RHS)
PGM MARKET REPORT NOVEMBER 2014
sharply. In the event, net ETF purchases were just under 260,000 oz in the ten months to October, compared with over 770,000 oz in the same period of 2013. For the full year, we expect net physical investment demand to total 300,000 oz; this figure allows for modest disinvestment in Japan, where holders of large platinum bars have returned some metal to the market.
This year has once again seen a distinct divergence between the behaviour of investors in the longer-established ETFs, primarily in North America and Europe, and those in South Africa. The former reacted to the prospect of supply disruptions by making modest additions to net holdings in the early months of 2014. When substantial price gains failed to materialise, holdings were subsequently liquidated. This selling occurred both immediately ahead of, and during, the price reversal that began in August. However, both inflows and outflows were comparatively muted; net holdings fell by just over 70,000 oz in the ten months to October, reflecting the limited potential for profit-taking at recent price levels.
In contrast, the newer South African funds saw steady accumulation of platinum, at a rate of nearly 50,000 oz a month, through the first half of 2014. Thereafter, total holdings in these products have remained relatively stable, even as dollar prices retreated.
The recovery of platinum from secondary materials will return to growth in 2014, although it will not compensate for the steep drop in primary supplies. Recycling of platinum from end-of-life vehicles in Europe could rise by as much as 24% in 2014, reflecting historic trends in pgm auto demand in the 2000–2005 timeframe. During this period, platinum usage on European vehicles more than trebled, due to significant growth in diesel’s share of the passenger car market at a time when loadings were climbing steeply.
It should be noted that autocatalyst recovery can show short-term price-driven fluctuations. Our estimate for 2014 assumes that lower platinum prices during the final quarter of 2014 will not result in any significant stockpiling of catalyst scrap by collectors.
Overall, we estimate that the deficit in the platinum market will widen to 1.13 million oz in 2014, up from 901,000 oz last year. However, this figure somewhat underestimates the impact of the South African strike on the availability of metal for automotive and industrial consumers, most of whom require platinum sponge for their processes: we estimate that at least 1.3 million oz of platinum sponge production has been foregone this year. As a result, there has been a significant draw down of market stocks of sponge, while producer inventories have also been depleted.
Remaining market stocks are now overwhelmingly in the form of ingot. Thus, despite rising deliveries of sponge from the recycling of autocatalyst scrap, and recovering output from South Africa, availability has tightened during the final quarter of 2014. A persistent imbalance would be corrected by fabricators and refiners converting market stocks of ingot into sponge, as has happened in the palladium market this year.
Growth in recovery from secondary materials wil not compensate for the drop in primary supplies.
Precious Metals Management
6
The platinum market deficit will widen to 1.13 million oz in 2014, and we estimate that at least 1.3 million oz of platinum sponge production has been foregone this year.

PGM MARKET REPORT NOVEMBER 2014
7
Precious Metals Management
Outlook for PlatinumSUPPLY & DEMAND IN 2015
Following the negotiation of a three-year wage agreement in order to bring to an end the AMCU strike, we believe that production losses in 2015 are likely to be significantly lower than in 2012 and 2014. If this proves correct, underlying South African mine output should recover strongly. Indeed, there is the potential for platinum production to outstrip the 2013 total, despite shaft closures in the intervening period, although this will depend on the extent to which mining is disrupted by safety, technical and geological factors. Supplies will also be affected by any decisions to replenish stocks that were depleted in 2014, thereby reducing the availability of metal for sale.
There are some uncertainties surrounding the outlook for supplies. At the time of writing, Anglo Platinum was reviewing offers to buy its Union section, and still intends to sell its Rustenburg mines, or to spin them off into a separate company. Impala Platinum is conducting a wide-ranging review of its operations, the results of which will be disclosed next February. It is widely rumoured that Glencore intends to exit its platinum business, which includes the Eland mine, a half-share in the Mototolo joint venture, and a 25% stake in Lonmin. Any decisions to rationalise mining operations, by their existing or future owners, have the potential to trigger industrial action.
While not all divestment will have a direct impact on production, it is indicative of the difficulty of making adequate returns from platinum mining in South Africa at current pgm prices. Despite the loss of well over 1 million oz of platinum production, the dollar price of a typical basket of South African pgm fell by 2% in the first 10 months of this year compared to the same period of 2013. However, rand depreciation over the same period has sheltered the South African industry from weak dollar prices: the rand value of a typical pgm basket was around 12,800 rand per ounce in the January to October 2014 period, an 11% increase on the previous year. Nevertheless, for many operations, these gains have been wiped out by
increases in labour and other costs.
Elsewhere, we expect supplies to be broadly stable in 2015. Zimplats has mitigated the impact of the closure of its Bimha shaft by allocating mining teams elsewhere, and production losses are now expected to be smaller than initially anticipated. Overall, shipments from Zimbabwe will be similar to those in 2014. Neither do we expect any significant change in Russian or North American supplies.
Availability of secondary platinum should also improve next year, largely as a function of increasing availability of highly-loaded catalysts removed from scrapped European diesel vehicles.Growth in North American recoveries is expected to flatten
• South African mine output should recover strongly in 2015, and could even outstrip the 2013 total, despite shaft closures in the intervening period.
• Availability of secondary platinum should also rise, due to increasing availability of highly-loaded diesel catalyst scrap.
• Significant gains in autocatalyst demand and an improvement in industrial purchasing should keep the market in significant deficit.
• Price movements may have a short-term impact on purchasing by Chinese jewellery makers, but the prospects for underlying market growth remain strong.
OUTLOOK: PLATINUM
60
70
80
90
100
110
120
130
140
4E
Bask
et
Price Ind
ex (04/0
1/1
1=
100)
PGM basket price
ZAR USD

PGM MARKET REPORT NOVEMBER 2014
Precious Metals Management
8
starting in 2015, reflecting the erosion of platinum’s share of the US autocatalyst market that began in the late 1990s and became very significant after 2007. We expect total recoveries of platinum from secondary sources to rise by around 7%. This means that total availability of platinum, from combined primary and secondary sources, could exceed 8 million oz for the first time.
However, regardless of growth in primary and secondary shipments, it is likely that the market will be in deficit once again. Gross demand for platinum totalled 8.5 million oz in 2014, and we expect this figure to increase next year, reflecting significant gains in the autocatalyst sector and a further improvement in industrial purchasing, where inventory movements may have less impact than in the last two to three years. Jewellery and investment demand remains more subject to short-term fluctuations, but assuming that total sales to these sectors remain close to the 2014 level, we would expect total world consumption of platinum to rise by at least 5% next year.
In the autocatalyst sector, Euro 6 legislation will apply to all new light duty diesel models sold in Europe in 2015, and will be extended to existing models from September. As a direct consequence of the new emissions limits, average platinum loadings on European diesel cars will rise by over 10%. The extent of the impact on platinum demand will also depend on the performance of the European auto industry; our current forecast assumes that light duty diesel production will rise by only 1% next year.
Outside Europe, automotive platinum demand is also expected to increase. Light duty diesel production in North America is slated to rise by 15%, with diesel’s share set to reach a record 6% (before this year, diesel share in this region was consistently below 5%). We also anticipate healthy growth in the Indian market, where light duty diesel output is expected to exceed 2 million units for the first time. In addition, 2015 will see the roll-out of Bharat IV emissions standards to additional cities, as the availability of low-sulphur diesel improves. This will have a material impact on average platinum loadings on Indian diesels.
There will also be a larger contribution from the non-road sector, where demand is expected to exceed 200,000 oz for the first time, despite thrifting of pgm loadings in some engine categories. The progressive implementation of stage 4 legislation will continue during 2015, while there will also be additional fitment of catalysts to smaller engines under stage 3 regulations. Emissions control strategies vary widely between manufacturers and we expect to see greater use of diesel particulate filters (DPFs) as well as some ammonia slip catalysts in conjunction with non-pgm SCR technology.
The outlook for industrial demand is generally positive. Platinum usage in the chemicals sector will once again be driven by the construction of new propane dehydrogenation capacity; we expect at least one more year of strong investment in this process, although it should be noted that capacity additions are unlikely to continue at the current pace after 2015. Elsewhere, steady growth in data storage requirements should contribute to higher electrical demand, while inventory movements may have less of an impact on sales to glass manufacturers next year.
Price will continue to exert a material influence on short-term purchasing patterns in the Chinese jewellery market. However, all the prerequisites for underlying growth remain in place: platinum is sought-after by younger consumers with increasing disposable incomes, while both manufacturing and retail margins are higher for platinum than for gold. Although
Automotive platinum demand is also expected to increase outside Europe, particularly in North America and India.
Demand in non-road emissions control is expected to exceed 200,000 oz for the first time, despite thrifting.
Steady growth in data storage requirements should contribute to higher electrical demand.
PGM MARKET REPORT NOVEMBER 2014
Precious Metals Management
9
the rate of retail expansion has slowed, we continue to expect steady progress in the number of outlets offering platinum jewellery. Next year should also see substantial growth in the Indian market, which could see it vault ahead of North America and Europe to become the world’s third largest platinum jewellery manufacturer, after China and Japan.
Investment demand is also partly a function of price. ETF purchasing has historically shown a positive correlation with rising price, but the reaction of investors to lower prices has generally been muted. Over time, this behaviour has led to the accumulation of substantial holdings of platinum totalling 2.8 million oz at the end of October 2014. We remain convinced that significant selling of these holdings is unlikely: at current prices, a large proportion of ETF investment (particularly the metal held in the established European and North American funds) is ‘out of the money’ and is likely to be liquidated only under stressed market conditions. Nevertheless, there is a risk that should prices remain persistently low, some investors will seek to cut their losses and move their funds into alternative products.
2015 should see substantial growth in the Indian platinum jewellery market.

PGM MARKET REPORT NOVEMBER 2014
10
Precious Metals Management
Forecast of PalladiumSUPPLY & DEMAND IN 2014
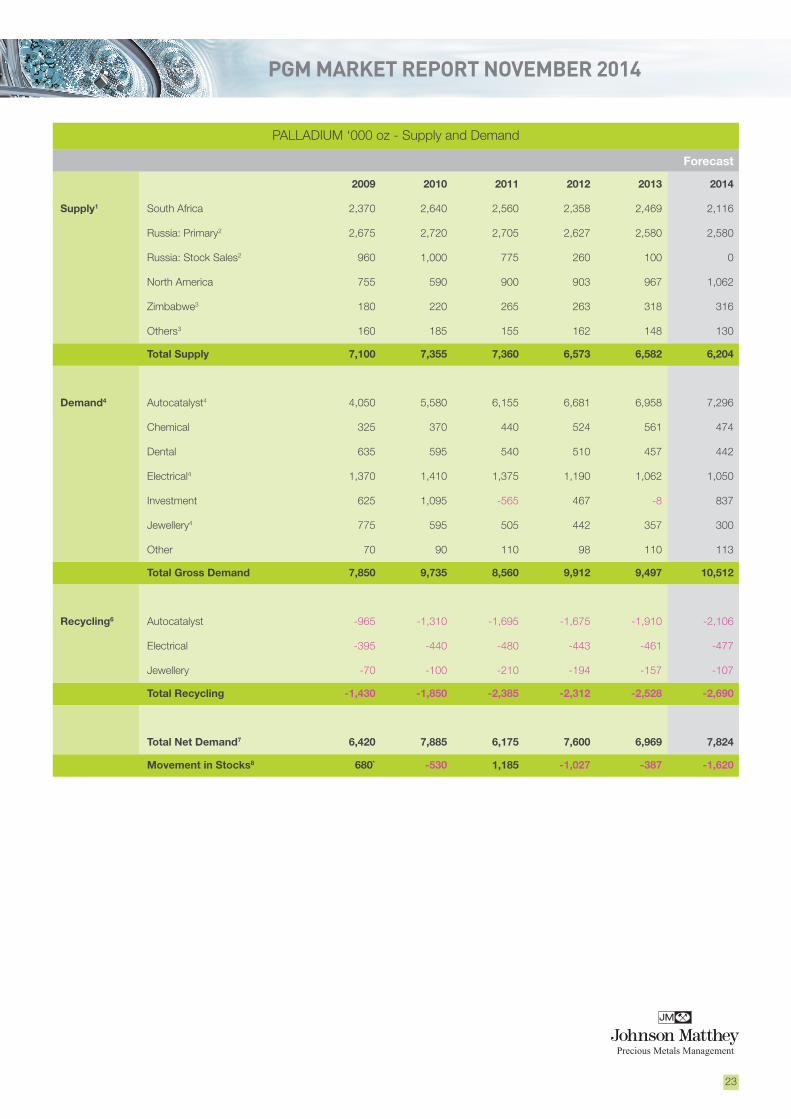
Global shipments of palladium have been less affected by industrial action in South Africa than those of its sister metals: we expect primary world supplies in 2014 to fall by only 6%, compared with platinum’s 12% drop. This is primarily because much of the world’s palladium is sourced from outside South Africa: the latter accounts for less than half of world palladium supplies, compared with over 70% for platinum and nearly 80% for rhodium.
In South Africa, underlying mine output of palladium is expected to fall by less than 25% this year, compared to 31–32% for the other pgm. Palladium production in South Africa is more heavily concentrated on the northern and eastern limbs of the Bushveld Complex, neither of which were impacted by the AMCU strike. The Platreef in the north is particularly rich in palladium and the only mine currently exploiting this orebody, Anglo’s Mogalakwena open pit, is expected to achieve record output this year. After allowing for estimated sales from inventories, South African supplies will total just over 2.1 million oz, down by around 350,000 oz compared with 2013.
Palladium output from Norilsk Nickel’s Russian operations was almost unchanged in the first half of 2014, at 1.31 million oz. The company expects production for the full year to be flat, at 2.50–2.58 million oz. Our estimate for 2014 does not allow for any shipments of palladium from Russian state stocks, as there is currently no evidence that any such sales have taken or will take place this year.
Stillwater Mining Company, the only pgm miner in the USA, produced 198,000 oz of palladium in the first half of 2014, marginally down on the previous year. The company’s East Boulder operation performed strongly, but output from the Stillwater mine fell, in line with a management decision to bypass unprofitable areas of ore and to prioritise returns over volumes. For the year as a whole, palladium sales should be little changed on 2013.
Canadian shipments of palladium will be up strongly this year. North American Palladium’s Lac des Isles operation continues to ramp up production from its new underground mine, despite delays caused by equipment shortages and geological issues. Meanwhile, sales of palladium by Canadian nickel miners should also increase this year: Vale reported
that palladium production rose by 12% to 286,000 oz in the nine months to September, even though output was affected by safety and maintenance shutdowns at the Sudbury operations during the second quarter.
Shipments of palladium from Zimbabwe are forecast to be flat this year, but there will be a decline in output from the Tati Nickel mine in Botswana (the latter is included in our ‘other supplies’ figure). It was announced in October that Norilsk Nickel had sold its African operations, comprising an 85% share in the Tati mine and 50% of the Nkomati Nickel operation in South Africa, to Botswana copper producer BCL.
• Global palladium supplies will fall by 6% to 6.2 million oz, due to lower shipments from strike-hit South African producers and the cessation of Russian stock sales.
• Autocatalyst demand will hit a record 7.3 million oz, on strong growth in Chinese car output and higher catalyst loadings in North America.
• Investment demand has been galvanised by the launch of two rand-denominated palladium ETFs, which held over 1.1 million oz at the end of October 2014.
• Disruption to South African shipments caused a squeeze on sponge supplies, and refiners converted market stocks of ingot into sponge to meet consumer demand.
FORECAST: PALLADIUM
Palladium Supply and Demand ‘000 oz
Supply 2012 2013 2014
South Africa 2,358 2,469 2,116
Russia 2,887 2,680 2,580
Others 1,328 1,433 1,508
Total Supply 6,573 6,582 6,204
Gross Demand
Autocatalyst 6,681 6,958 7,296
Jewellery 442 357 300
Industrial 2,322 2,190 2,079
Investment 467 -8 837
Total Gross Demand 9,912 9,497 10,512
Recycling -2,312 -2,528 -2,690
Total Net demand 7,600 6,969 7,824
Movements in Stocks -1,027 -387 -1,620

PGM MARKET REPORT NOVEMBER 2014
11
Precious Metals Management
Palladium Demand: Autocatalyst ‘000 oz
Gross Recycling Net
2012 2013 2014 2012 2013 2014 2012 2013 2014
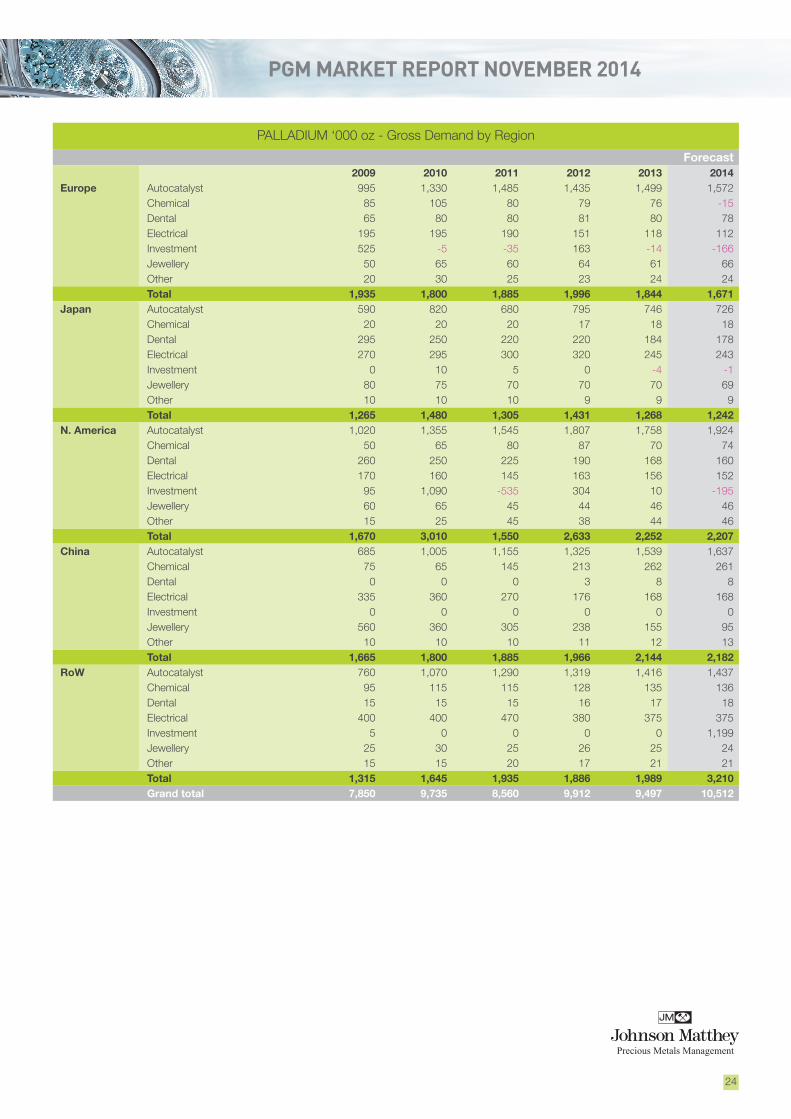
Europe 1,435 1,499 1,572 -308 -410 -458 1,127 1,089 1,114
Japan 795 746 726 -105 -129 -132 690 617 594
North America 1,807 1,758 1,924 -1,078 -1,149 -1,246 729 609 678
China 1,325 1,539 1,637 -46 -57 -82 1,279 1,482 1,555
Rest of World 1,319 1,416 1,437 -138 -165 -188 1,181 1,251 1,249
Total 6,681 6,958 7,296 -1,675 -1,910 -2,106 5,006 5,048 5,190
Global primary supplies of palladium will total just over 6.2 million oz, and a further 2.69 million oz will be recovered from automotive, jewellery and electronic scrap. This represents a 6% gain in recycling, with a strong increase in automotive recoveries partly offset by a decline in jewellery returns.
The majority of vehicles being scrapped this year were constructed in the late 1990s and early 2000s, a period of extraordinary expansion in the use of palladium on US and European vehicles. Scrap from this era can be particularly rich in palladium, because palladium catalyst technology was less advanced than it is today: loadings therefore needed to be significantly higher, even though emissions limits were less demanding. Recoveries of palladium from automotive scrap are forecast to increase by around 10% this year to exceed 2 million oz for the first time.
The gain in secondary recoveries will not be sufficient to offset the contraction in primary supplies, and combined primary and secondary shipments will decline by 2% to 8.89 million oz. This is significantly below the level of new demand, which is expected to jump by over 1 million oz to a record 10.5 million oz. The consequence has been a further draw down of market stocks, the bulk of which were accumulated between 1995 and 2010, when Russia exported much of its strategic stockpile and the market was consequently in persistent surplus.
Two applications account for almost all the increase in palladium consumption: autocatalyst and investment. Demand for palladium ETFs was galvanised by the launch of two new rand-denominated products, by Absa and Standard Bank, in March 2014 (see page 13). These new funds accumulated metal throughout the year, with a combined 1.17 million oz of palladium under management by the end of October. However, this activity has been offset by some profit-taking in other regions, as investors took advantage of gains in the palladium price which – despite the retracement since August – remains in positive territory for the year as a whole. In total, the longer-established ETFs in North America and Europe shed nearly 330,000 oz in the ten months to October 2014, nearly five times the volume of platinum disinvestment: this reflects the greater potential for profit-taking in palladium. Overall, we forecast that net palladium investment in 2014 will total 837,000 oz, a major swing from the moderate net disinvestment of the previous year.
The use of palladium in autocatalysts is anticipated to rise by around 340,000 oz this year, to a new peak of 7.3 million oz. China remains an important contributor to this growth – adding 100,000 oz of demand this year, on the back of a 10% gain in gasoline vehicle output – but the most important contributor in 2014 has been the North American market. While gasoline vehicle production in this region will rise by a modest 2%, average catalyst loadings are rising in response to an imminent tightening of emissions legislation and consumer demand
for cleaner vehicles. Californian LEV III emission standards (also adopted by other ‘Green States’) are due to be phased in from the 2015 model year, but manufacturers can certify vehicles to LEV III standards ahead of this schedule. This year, US automakers have increased their output of vehicles meeting ULEV (Ultra Low Emission
South African platinum
Underlying production
0
500
1,000
1,500
2,000
2,500
3,000
2013 2014
South African palladium supply
Sales from stock /movements to stockUnderlying production
'00
0 o
z

PGM MARKET REPORT NOVEMBER 2014
12
Precious Metals Management
Palladium Demand: Jewellery ‘000 oz
Gross Recycling Net
2012 2013 2014 2012 2013 2014 2012 2013 2014
Europe 64 61 66 0 0 0 64 61 66
Japan 70 70 69 -17 -17 -17 53 53 52
North America 44 46 46 0 0 0 44 46 46
China 238 155 95 -177 -140 -90 61 15 5
Rest of World 26 25 24 0 0 0 26 25 24
Total 442 357 300 -194 -157 -107 248 200 193
Vehicle) standards, contributing to higher palladium loadings. In addition, stricter Corporate Average Fuel Economy (CAFE) requirements have motivated the adoption of turbo-charged engines in some applications. While engine-downsizing is typically negative for pgm demand, in this instance the overall effect has been positive. Emissions from turbo-charged
engines can be more difficult to control, while the location of the catalyst is typically further downstream from the engine, meaning that the temperature of the gases entering the catalyst is lower. Both these factors can favour higher palladium loadings.
Elsewhere, palladium demand has been comparatively subdued this year. Jewellery demand is set to fall again, as demand in China ebbs away to insignificant levels. Outside China, the majority of palladium jewellery demand is generated by its use in white metal alloys – palladium is added to some platinum alloys in Japan, and is used as an alloying component of white gold alloys in most regions – rather than as a jewellery metal in its own right.
In the industrial sector, thrifting and substitution continue to take their toll on electrical and dental applications, while continued strong sales of process catalysts to chemical companies in China and the Far East have been partially offset by plant closures in Europe. Total industrial demand is set to fall by 5% to 2.08 million oz this year.
Most industrial users of palladium require metal in the form of sponge, as do automakers. Overall, notwithstanding the decline in industrial demand, we estimate that global palladium sponge requirements will rise by about 3% this year. This growth triggered a squeeze on sponge supplies during the period of disruption to South African shipments, causing a sharp increase in the premium over ingot. In order to meet demand from their auto and industrial customers, fabricators and refiners converted several hundred thousand ounces of palladium ingot into sponge. This provides material evidence of the continuing transfer of market stocks (which are almost exclusively in the form of ingot) into the hands of industrial consumers.
We estimate that global palladium sponge requirements will rise by about 3% this year.

PGM MARKET REPORT NOVEMBER 2014
13
Precious Metals Management
500
550
600
650
700
750
800
850
900
950
1,000
1,200
1,300
1,400
1,500
1,600
1,700
1,800
1,900
2,000
2,100
2,200
$ /
oz
'000
oz
ETF holdings in non South African funds
Fund Holdings (LHS) Price (RHS)
7,000
7,500
8,000
8,500
9,000
9,500
10,000
10,500
0
200
400
600
800
1,000
1,200
1,400
ZA
R /
oz
'000
oz
ETF holdings in South African funds
Absa Fund Holdings (LHS) SB Fund Holdings (LHS) Price (RHS)
-350
-300
-250
-200
-150
-100
-50
0
50
100
'000
oz
Net investment in non South African ETFs
Pt Pd
• The longer-established palladium ETFs in North America and Europe shed nearly 330,000 oz in the ten months to October 2014, nearly five times the volume of platinum ETF disinvestment in these regions, reflecting the greater potential for profit-taking in palladium.
• Two new rand-denominated ETFs were launched by Absa and Standard Bank in early 2014. By end-October these funds held a combined 1.17 million oz under management, with the weak price environment in August–October incentivising additional investment demand.
• Profit-taking in Europe and North America preceded the beginning of the price correction in August, but has been exacerbated by the sharp decline in the palladium price since then.

PGM MARKET REPORT NOVEMBER 2014
14
Precious Metals Management
Outlook for PalladiumSUPPLY & DEMAND IN 2015
Palladium production in South Africa should rebound strongly in 2015, but total world supplies are likely to remain below the levels seen in the 1995–2013 period, when sales from Russian stocks supplemented primary output. We do not at present expect any further sales of palladium from government inventories; indeed it is possible that Gokhran will purchase metal from Russian miners next year.
It has been suggested that the Russian Central Bank (which holds significant quantities of palladium acquired out of past market surpluses) could sell part of its stockpile to Norilsk Nickel. However, even if such a deal were to be concluded, this would simply represent a movement in above-ground stocks, and would not affect our assessment of the market balance.
More metal will also be refined from jewellery, autocatalyst and electrical scrap. Once again, the bulk of the growth will come from the refining of highly-loaded gasoline catalyst scrap collected from European and North American vehicles built in the late 1990s and early 2000s. However, we are starting to see consistent growth in recoveries from China – where significant numbers of vehicles were fitted with mainly palladium catalysts starting in the mid 2000s – and in the Rest of World region, primarily from vehicles first registered in Mexico, Brazil and Korea.
Demand is almost certain to fall. A repeat of this year’s exceptionally high ETF demand is unlikely, although some further accumulation of metal in the new South African funds is possible. Elsewhere, the majority of palladium investors are ‘in the money’, and this could motivate further profit-taking. Autocatalyst demand will expand once again, but at a lower rate than this year, while combined industrial and jewellery demand is likely to decline marginally.
China should reassert itself as the largest source of growth in auto demand next year, based on forecasts of an 8% gain in light duty gasoline vehicle production. There should also be some incremental gains in North America, in line with moderate, legislation-driven growth in overall gasoline catalyst loadings.
However, sales of palladium to European and Japanese automakers could retreat slightly. The domestic Japanese market is struggling to recover from a hike in the consumption tax in April 2014, and a second increase is slated for October 2015. At the same time, local automakers are continuing to move production destined for export closer to the final markets. These factors are expected to contribute to a slump in gasoline car output in Japan next year.
In Europe, modest growth in the use of palladium on gasoline cars will be offset by lower palladium loadings on diesel engines. The on-going shift to Euro 6 technology will cause a modest reversal of recent trends towards an increased proportion of palladium in the diesel
• Palladium supplies should rebound in 2015, as South African pgm production recovers from this year’s strike, but will remain below pre-2013 levels.
• Autocatalyst usage will rise, on the back of more growth in Chinese car production and some legislation-driven growth in US catalyst loadings.
• Total demand will contract, as ETF purchasing falls from the exceptional levels seen in 2014, but the market should remain in significant deficit.
OUTLOOK: PALLADIUM

PGM MARKET REPORT NOVEMBER 2014
Precious Metals Management
15
catalyst mix: in order to optimise NOx aftertreatment it is necessary to control the NO to NO2 ratio in the gas stream, and this favours the use of platinum.
With total non-autocatalyst demand also expected to ease slightly, gross world demand could fall back towards 10 million oz. However, this is still significantly above the level of combined primary and secondary supply, and should leave the market substantially in deficit for a fourth consecutive year.
PGM MARKET REPORT NOVEMBER 2014
16
Precious Metals Management
Forecast of RhodiumSUPPLY & DEMAND IN 2014
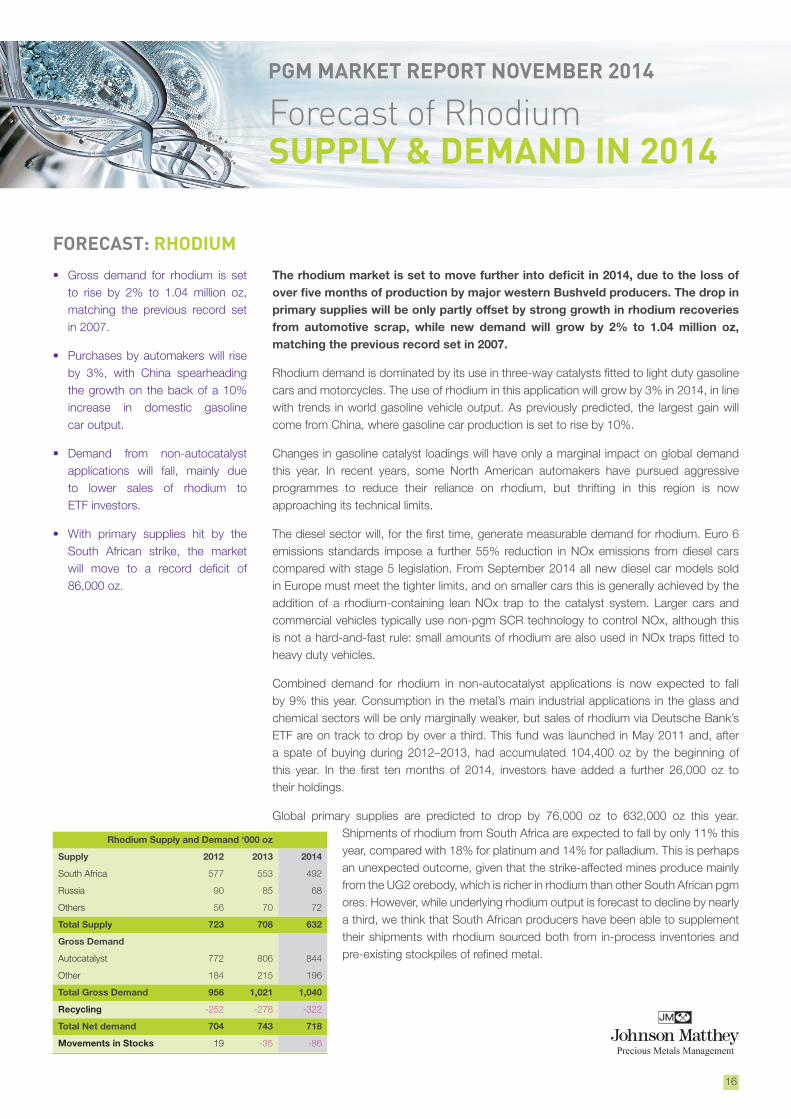
The rhodium market is set to move further into deficit in 2014, due to the loss of over five months of production by major western Bushveld producers. The drop in primary supplies will be only partly offset by strong growth in rhodium recoveries from automotive scrap, while new demand will grow by 2% to 1.04 million oz, matching the previous record set in 2007.
Rhodium demand is dominated by its use in three-way catalysts fitted to light duty gasoline cars and motorcycles. The use of rhodium in this application will grow by 3% in 2014, in line with trends in world gasoline vehicle output. As previously predicted, the largest gain will come from China, where gasoline car production is set to rise by 10%.
Changes in gasoline catalyst loadings will have only a marginal impact on global demand this year. In recent years, some North American automakers have pursued aggressive programmes to reduce their reliance on rhodium, but thrifting in this region is now approaching its technical limits.
The diesel sector will, for the first time, generate measurable demand for rhodium. Euro 6 emissions standards impose a further 55% reduction in NOx emissions from diesel cars compared with stage 5 legislation. From September 2014 all new diesel car models sold in Europe must meet the tighter limits, and on smaller cars this is generally achieved by the addition of a rhodium-containing lean NOx trap to the catalyst system. Larger cars and commercial vehicles typically use non-pgm SCR technology to control NOx, although this is not a hard-and-fast rule: small amounts of rhodium are also used in NOx traps fitted to heavy duty vehicles.
Combined demand for rhodium in non-autocatalyst applications is now expected to fall by 9% this year. Consumption in the metal’s main industrial applications in the glass and chemical sectors will be only marginally weaker, but sales of rhodium via Deutsche Bank’s ETF are on track to drop by over a third. This fund was launched in May 2011 and, after a spate of buying during 2012–2013, had accumulated 104,400 oz by the beginning of this year. In the first ten months of 2014, investors have added a further 26,000 oz to their holdings.
Global primary supplies are predicted to drop by 76,000 oz to 632,000 oz this year. Shipments of rhodium from South Africa are expected to fall by only 11% this year, compared with 18% for platinum and 14% for palladium. This is perhaps an unexpected outcome, given that the strike-affected mines produce mainly from the UG2 orebody, which is richer in rhodium than other South African pgm ores. However, while underlying rhodium output is forecast to decline by nearly a third, we think that South African producers have been able to supplement their shipments with rhodium sourced both from in-process inventories and pre-existing stockpiles of refined metal.
• Gross demand for rhodium is set to rise by 2% to 1.04 million oz, matching the previous record set in 2007.
• Purchases by automakers will rise by 3%, with China spearheading the growth on the back of a 10% increase in domestic gasoline car output.
• Demand from non-autocatalyst applications will fall, mainly due to lower sales of rhodium to ETF investors.
• With primary supplies hit by the South African strike, the market will move to a record deficit of 86,000 oz.
FORECAST: RHODIUM
Rhodium Supply and Demand ‘000 oz
Supply 2012 2013 2014
South Africa 577 553 492
Russia 90 85 68
Others 56 70 72
Total Supply 723 708 632
Gross Demand
Autocatalyst 772 806 844
Other 184 215 196
Total Gross Demand 956 1,021 1,040
Recycling -252 -278 -322
Total Net demand 704 743 718
Movements in Stocks 19 -35 -86

PGM MARKET REPORT NOVEMBER 2014
Precious Metals Management
17
The fall in primary shipments will be partly offset by strong growth in autocatalyst recycling, up 16% to 322,000 oz. Overall, we anticipate that demand will fall short of combined primary and secondary supplies by 86,000 oz – the largest deficit we have ever recorded in the rhodium market. However, to date this has had little impact on price. The market was in persistent surplus between 2008 and 2012, and we believe that considerable quantities of rhodium remain in the hands of speculators.
-100
0
100
200
300
400
500
600
700
2013 2014
South African rhodium supply
Sales from stock /movements to stockUnderlying production
'000 o
z

PGM MARKET REPORT NOVEMBER 2014
18
Precious Metals Management
Outlook for RhodiumSUPPLY & DEMAND IN 2015
The deficit in the rhodium market this year was almost entirely due to the fall in primary production as a result of the South African strike. It follows that if output returns to normal in 2015, as we anticipate, then we should see the rhodium market return close to balance.
Since 2012, growth in the consumption of rhodium in autocatalysts has been almost exactly matched by increases in recoveries from end-of-life vehicles. This trend is expected to continue next year. While we think that there is potential for expansion of rhodium usage in NOx traps, this is a limited market; gasoline three-way catalysts will remain the primary application for rhodium going forward. There are currently no pressing legislative reasons for automakers to increase the proportion of rhodium in their catalysts, although beyond 2015 those North American automakers that have aggressively thrifted rhodium may need to add back some of this metal in order to meet LEV III limits. We therefore believe that short-term growth in rhodium demand will be largely dependent upon the expansion of gasoline vehicle production. Industry forecasts suggest that output will rise by 3–4% next year, with growth once more concentrated in China.
Combined demand in other applications may decline again next year. We believe that the glass industry is well-stocked with rhodium from recent plant closures, and metal requirements for LCD glass manufacture will be partly satisfied from inventories. In the fibre glass sector, a period of alloy switching in favour of alloys with a higher rhodium content now appears to be over.
Investors in the Deutsche Bank rhodium ETF held 130,400 oz at the end of October 2014. Most of this total has been acquired since mid-2012, and for much of this period the price was below current levels; thus, it is likely that most of the current holdings are ‘in the money’. However, there has been no significant net disinvestment in the fund’s history and, in the absence of large price movements, we believe that investment should remain positive next year.
On the supply side, we expect a rebound in South African production to pre-strike levels, despite some rationalisation over the last eighteen months that has mostly affected shafts mining the UG2 reef, which is the source of most of South Africa’s rhodium output. These shaft closures should be broadly offset by a recovery in production at Anglo Platinum’s Amandelbult Section (a large producer of UG2 ore), and by the commissioning and ramping-up of newer shafts at both Lonmin’s and Impala’s western Bushveld operations.
• Assuming supplies rebound to more normal levels in 2015, we should see the rhodium market return to balance.
• Sales of rhodium to automakers will follow trends in global gasoline car production, but growth in gross demand will be offset by higher scrap recoveries.
• Industrial demand may weaken, now that the glass industry has completed a programme of switching to higher rhodium content alloys.
OUTLOOK: RHODIUM
PGM MARKET REPORT NOVEMBER 2014
Precious Metals Management
19
PLATINUM ‘000 oz - Supply and Demand
Forecast
2009 2010 2011 2012 2013 2014
Supply1 South Africa 4,635 4,635 4,860 4,110 4,208 3,457
Russia2 785 825 835 801 758 752
North America 260 200 350 315 311 360
Zimbabwe3 230 280 340 337 410 408
Others3 115 110 100 110 135 123
Total Supply 6,025 6,050 6,485 5,673 5,822 5,100
Demand4 Autocatalyst4 2,185 3,075 3,185 3,168 3,146 3,394
Chemical 290 440 470 451 547 621
Electrical4 190 230 230 176 221 236
Glass 10 385 515 160 129 156
Investment 660 655 460 450 871 300
Jewellery4 2,810 2,420 2,475 2,783 3,028 2,984
Medical and Biomedical5 250 230 230 223 207 204
Petroleum 210 170 210 145 184 187
Other 190 300 320 395 419 435
Total Gross Demand 6,795 7,905 8,095 7,951 8,752 8,517
Recycling6 Autocatalyst -830 -1,085 -1,240 -1,120 -1,215 -1,421
Electrical -10 -10 -10 -22 -24 -27
Jewellery -565 -735 -810 -895 -790 -836
Total Recycling -1,405 -1,830 -2,060 -2,037 -2,029 -2,284
Total Net Demand7 5,390 6,075 6,035 5,914 6,723 6,233
Movement in Stocks8 635 -25 450 -241 -901 -1,133

PGM MARKET REPORT NOVEMBER 2014
Precious Metals Management
20
PLATINUM ‘000 oz - Gross Demand by Region
Forecast2009 2010 2011 2012 2013 2014
Europe Autocatalyst 970 1,495 1,505 1,331 1,330 1,528Chemical 70 110 120 109 99 103Electrical 20 15 20 17 15 15Glass 5 10 30 2 7 11Investment 385 140 155 135 -40 -45Jewellery 185 175 175 179 219 204Medical and Biomedical 115 90 90 78 70 69Petroleum 25 20 35 -1 -8 18Other 55 100 95 116 118 120Total 1,830 2,155 2,225 1,966 1,810 2,023
Japan Autocatalyst 395 550 500 608 568 561Chemical 45 50 35 35 42 42Electrical 30 30 25 21 27 29Glass 40 90 130 -3 -20 -92Investment 160 45 250 98 -40 -35Jewellery 335 325 310 312 309 313Medical and Biomedical 20 20 20 20 18 18Petroleum 10 5 5 4 4 4Other 15 40 40 63 65 66Total 1,050 1,155 1,315 1,158 973 906
N. America Autocatalyst 370 405 370 380 334 370Chemical 65 100 95 106 102 128Electrical 25 25 25 21 20 19Glass -35 10 -5 7 7 13Investment 105 465 10 187 57 29Jewellery 135 175 185 187 213 203Medical and Biomedical 90 90 90 89 82 80Petroleum 15 25 50 48 27 37Other 90 105 110 117 123 125Total 860 1,400 930 1,142 965 1,004
China Autocatalyst 85 100 105 93 119 131Chemical 40 80 100 89 146 123Electrical 20 30 30 31 37 40Glass -90 130 10 44 110 170Investment 0 0 0 0 0 0Jewellery 2,080 1,650 1,680 1,950 2,100 2,040Medical and Biomedical 10 10 10 15 16 16Petroleum 10 15 15 13 58 31Other 10 25 30 40 49 56Total 2,165 2,040 1,980 2,275 2,635 2,607
RoW Autocatalyst 365 525 705 756 795 804Chemical 70 100 120 112 158 225Electrical 95 130 130 86 122 133Glass 90 145 350 110 25 54Investment 10 5 45 30 894 351Jewellery 75 95 125 155 187 224Medical and Biomedical 15 20 20 21 21 21Petroleum 150 105 105 81 103 97Other 20 30 45 59 64 68Total 890 1,155 1,645 1,410 2,369 1,977Grand total 6,795 7,905 8,095 7,951 8,752 8,517

PGM MARKET REPORT NOVEMBER 2014
Precious Metals Management
21
PLATINUM Tonnes - Supply and Demand
Forecast
2009 2010 2011 2012 2013 2014
Supply1 South Africa 144.2 144.2 151.2 127.8 130.9 107.5
Russia2 24.4 25.7 26.0 24.9 23.6 23.4
North America 8.1 6.2 10.9 9.8 9.7 11.2
Zimbabwe3 7.2 8.7 10.6 10.5 12.8 12.7
Others3 3.6 3.4 3.1 3.4 4.2 3.8
Total Supply 187.4 188.2 201.7 176.4 181.2 158.6
Demand4 Autocatalyst4 68.0 95.6 99.1 98.5 97.9 105.5
Chemical 9.0 13.7 14.6 14.1 17.0 19.3
Electrical4 5.9 7.2 7.2 5.6 6.9 7.3
Glass 0.3 12.0 16.0 5.0 4.0 4.8
Investment 20.5 20.4 14.3 13.9 27.1 9.3
Jewellery4 87.4 75.3 77.0 86.6 94.1 92.8
Medical and Biomedical5 7.8 7.2 7.2 7.0 6.6 6.4
Petroleum 6.5 5.3 6.5 4.5 5.6 5.9
Other 5.9 9.3 10.0 12.2 13.0 13.5
Total Gross Demand 211.3 245.9 251.8 247.4 272.2 264.8
Recycling6 Autocatalyst -25.8 -33.7 -38.6 -34.9 -37.8 -44.2
Electrical -0.3 -0.3 -0.3 -0.7 -0.7 -0.8
Jewellery -17.6 -22.9 -25.2 -27.9 -24.5 -26.0
Total Recycling -43.7 -56.9 -64.1 -63.5 -63.0 -71.0
Total Net Demand7 167.6 189.0 187.7 183.9 209.2 193.8
Movement in Stocks8 19.8 -0.8 14.0 -7.5 -28.0 -35.2

PGM MARKET REPORT NOVEMBER 2014
Precious Metals Management
22
PLATINUM Tonnes - Gross Demand by Region
Forecast2009 2010 2011 2012 2013 2014
Europe Autocatalyst 30.2 46.5 46.8 41.4 41.4 47.5Chemical 2.2 3.4 3.7 3.4 3.1 3.2Electrical 0.6 0.5 0.6 0.5 0.5 0.5Glass 0.2 0.3 0.9 0.1 0.2 0.3Investment 12.0 4.4 4.8 4.2 -1.3 -1.4Jewellery 5.8 5.4 5.4 5.6 6.8 6.3Medical and Biomedical 3.6 2.8 2.8 2.4 2.2 2.1Petroleum 0.8 0.6 1.1 0.0 -0.3 0.6Other 1.7 3.1 3.0 3.6 3.7 3.7Total 56.9 67.0 69.2 61.2 56.3 62.8
Japan Autocatalyst 12.3 17.1 15.6 18.9 17.7 17.4Chemical 1.4 1.6 1.1 1.1 1.3 1.3Electrical 0.9 0.9 0.8 0.7 0.8 0.9Glass 1.2 2.8 4.0 -0.1 -0.6 -2.9Investment 5.0 1.4 7.8 3.0 -1.2 -1.1Jewellery 10.4 10.1 9.6 9.7 9.6 9.7Medical and Biomedical 0.6 0.6 0.6 0.6 0.6 0.6Petroleum 0.3 0.2 0.2 0.1 0.1 0.1Other 0.5 1.2 1.2 2.0 2.0 2.1Total 32.7 35.9 40.9 36.0 30.3 28.1
N. America Autocatalyst 11.5 12.6 11.5 11.8 10.4 11.5Chemical 2.0 3.1 3.0 3.3 3.2 4.0Electrical 0.8 0.8 0.8 0.7 0.6 0.6Glass -1.1 0.3 -0.2 0.2 0.2 0.4Investment 3.3 14.5 0.3 5.8 1.8 0.9Jewellery 4.2 5.4 5.8 5.8 6.6 6.3Medical and Biomedical 2.8 2.8 2.8 2.8 2.6 2.5Petroleum 0.5 0.8 1.6 1.5 0.8 1.2Other 2.8 3.3 3.4 3.6 3.8 3.9Total 26.7 43.5 28.9 35.5 30.0 31.3
China Autocatalyst 2.6 3.1 3.3 2.9 3.7 4.1Chemical 1.2 2.5 3.1 2.8 4.5 3.8Electrical 0.6 0.9 0.9 1.0 1.2 1.2Glass -2.8 4.0 0.3 1.4 3.4 5.3Investment 0.0 0.0 0.0 0.0 0.0 0.0Jewellery 64.7 51.3 52.3 60.7 65.3 63.5Medical and Biomedical 0.3 0.3 0.3 0.5 0.5 0.5Petroleum 0.3 0.5 0.5 0.4 1.8 1.0Other 0.3 0.8 0.9 1.2 1.5 1.7Total 67.3 63.5 61.6 70.9 81.9 81.1
RoW Autocatalyst 11.4 16.3 21.9 23.5 24.7 25.0Chemical 2.2 3.1 3.7 3.5 4.9 7.0Electrical 3.0 4.0 4.0 2.7 3.8 4.1Glass 2.8 4.5 10.9 3.4 0.8 1.7Investment 0.3 0.2 1.4 0.9 27.8 10.9Jewellery 2.3 3.0 3.9 4.8 5.8 7.0Medical and Biomedical 0.5 0.6 0.6 0.7 0.7 0.7Petroleum 4.7 3.3 3.3 2.5 3.2 3.0Other 0.6 0.9 1.4 1.8 2.0 2.1Total 27.7 35.9 51.2 43.8 73.7 61.5Grand total 211.3 245.9 251.8 247.4 272.2 264.8
PGM MARKET REPORT NOVEMBER 2014
Precious Metals Management
23
PALLADIUM ‘000 oz - Supply and Demand
Forecast
2009 2010 2011 2012 2013 2014
Supply1 South Africa 2,370 2,640 2,560 2,358 2,469 2,116
Russia: Primary2 2,675 2,720 2,705 2,627 2,580 2,580
Russia: Stock Sales2 960 1,000 775 260 100 0
North America 755 590 900 903 967 1,062
Zimbabwe3 180 220 265 263 318 316
Others3 160 185 155 162 148 130
Total Supply 7,100 7,355 7,360 6,573 6,582 6,204
Demand4 Autocatalyst4 4,050 5,580 6,155 6,681 6,958 7,296
Chemical 325 370 440 524 561 474
Dental 635 595 540 510 457 442
Electrical4 1,370 1,410 1,375 1,190 1,062 1,050
Investment 625 1,095 -565 467 -8 837
Jewellery4 775 595 505 442 357 300
Other 70 90 110 98 110 113
Total Gross Demand 7,850 9,735 8,560 9,912 9,497 10,512
Recycling6 Autocatalyst -965 -1,310 -1,695 -1,675 -1,910 -2,106
Electrical -395 -440 -480 -443 -461 -477
Jewellery -70 -100 -210 -194 -157 -107
Total Recycling -1,430 -1,850 -2,385 -2,312 -2,528 -2,690
Total Net Demand7 6,420 7,885 6,175 7,600 6,969 7,824
Movement in Stocks8 680` -530 1,185 -1,027 -387 -1,620
PGM MARKET REPORT NOVEMBER 2014
Precious Metals Management
24
PALLADIUM ‘000 oz - Gross Demand by Region
Forecast2009 2010 2011 2012 2013 2014
Europe Autocatalyst 995 1,330 1,485 1,435 1,499 1,572Chemical 85 105 80 79 76 -15Dental 65 80 80 81 80 78Electrical 195 195 190 151 118 112Investment 525 -5 -35 163 -14 -166Jewellery 50 65 60 64 61 66Other 20 30 25 23 24 24Total 1,935 1,800 1,885 1,996 1,844 1,671
Japan Autocatalyst 590 820 680 795 746 726Chemical 20 20 20 17 18 18Dental 295 250 220 220 184 178Electrical 270 295 300 320 245 243Investment 0 10 5 0 -4 -1Jewellery 80 75 70 70 70 69Other 10 10 10 9 9 9Total 1,265 1,480 1,305 1,431 1,268 1,242
N. America Autocatalyst 1,020 1,355 1,545 1,807 1,758 1,924Chemical 50 65 80 87 70 74Dental 260 250 225 190 168 160Electrical 170 160 145 163 156 152Investment 95 1,090 -535 304 10 -195Jewellery 60 65 45 44 46 46Other 15 25 45 38 44 46Total 1,670 3,010 1,550 2,633 2,252 2,207
China Autocatalyst 685 1,005 1,155 1,325 1,539 1,637Chemical 75 65 145 213 262 261Dental 0 0 0 3 8 8Electrical 335 360 270 176 168 168Investment 0 0 0 0 0 0Jewellery 560 360 305 238 155 95Other 10 10 10 11 12 13Total 1,665 1,800 1,885 1,966 2,144 2,182
RoW Autocatalyst 760 1,070 1,290 1,319 1,416 1,437Chemical 95 115 115 128 135 136Dental 15 15 15 16 17 18Electrical 400 400 470 380 375 375Investment 5 0 0 0 0 1,199Jewellery 25 30 25 26 25 24Other 15 15 20 17 21 21Total 1,315 1,645 1,935 1,886 1,989 3,210Grand total 7,850 9,735 8,560 9,912 9,497 10,512

PGM MARKET REPORT NOVEMBER 2014
Precious Metals Management
25
PALLADIUM Tonnes - Supply and Demand
Forecast
2009 2010 2011 2012 2013 2014
Supply1 South Africa 73.7 82.1 79.6 73.3 76.8 65.8
Russia: Primary2 83.2 84.6 84.1 81.7 80.2 80.3
Russia: Stock Sales2 29.9 31.1 24.1 8.1 3.1 0
North America 23.5 18.4 28.0 28.1 30.1 33.0
Zimbabwe3 5.6 6.8 8.2 8.2 9.9 9.8
Others3 5.0 5.8 4.8 5.0 4.6 4.0
Total Supply 220.8 228.8 228.9 204.4 204.7 192.9
Demand4 Autocatalyst4 126.0 173.6 191.4 207.7 216.4 226.9
Chemical 10.1 11.5 13.7 16.3 17.4 14.8
Dental 19.8 18.5 16.8 15.8 14.1 13.7
Electrical4 42.6 43.9 42.8 37.1 33.1 32.7
Investment 19.4 34.1 -17.6 14.6 -0.2 26.0
Jewellery4 24.1 18.5 15.7 13.8 11.1 9.3
Other 2.2 2.8 3.4 3.0 3.5 3.5
Total Gross Demand 244.2 302.8 266.2 308.3 295.4 326.9
Recycling6 Autocatalyst -30.0 -40.7 -52.7 -52.2 -59.4 -65.5
Electrical -12.3 -13.7 -14.9 -13.7 -14.3 -14.8
Jewellery -2.2 -3.1 -6.5 -6.0 -4.9 3.3
Total Recycling -44.5 -57.5 -74.2 -71.9 -78.6 -83.6
Total Net Demand7 199.7 245.3 192.1 236.4 216.8 243.3
Movement in Stocks8 21.2 -16.5 36.9 -32.0 -12.1 -50.4
PGM MARKET REPORT NOVEMBER 2014
Precious Metals Management
26
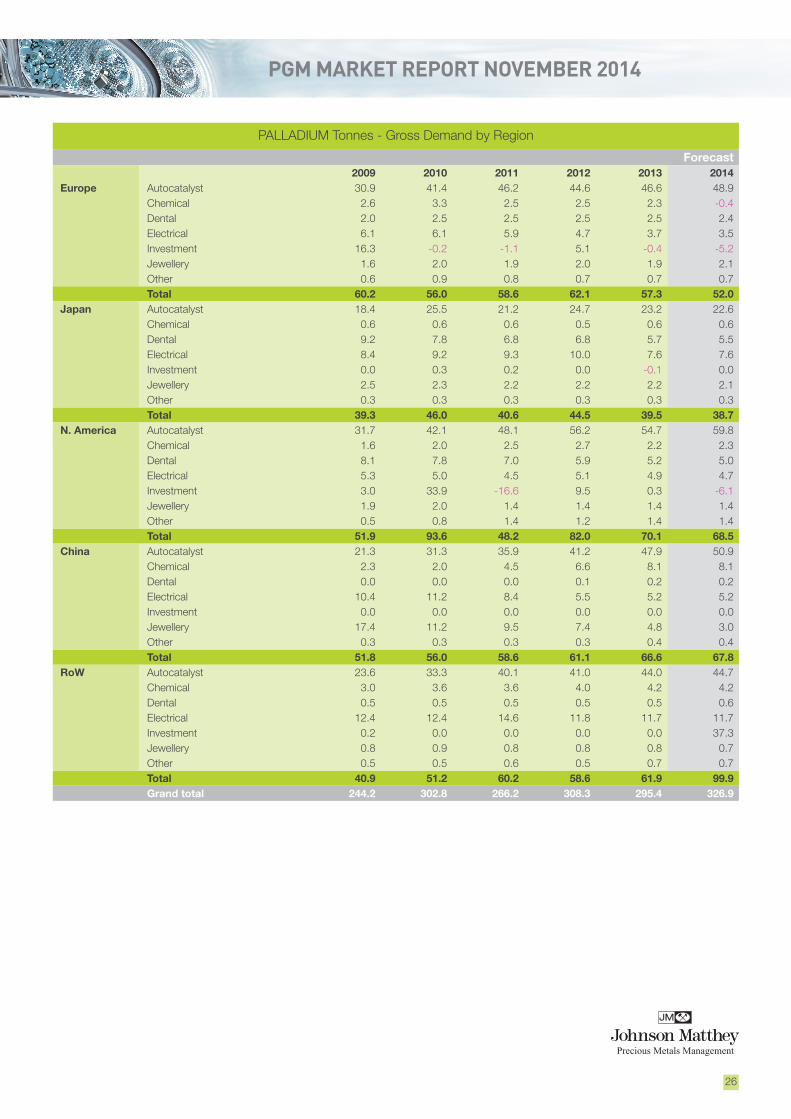
PALLADIUM Tonnes - Gross Demand by Region
Forecast2009 2010 2011 2012 2013 2014
Europe Autocatalyst 30.9 41.4 46.2 44.6 46.6 48.9Chemical 2.6 3.3 2.5 2.5 2.3 -0.4Dental 2.0 2.5 2.5 2.5 2.5 2.4Electrical 6.1 6.1 5.9 4.7 3.7 3.5Investment 16.3 -0.2 -1.1 5.1 -0.4 -5.2Jewellery 1.6 2.0 1.9 2.0 1.9 2.1Other 0.6 0.9 0.8 0.7 0.7 0.7Total 60.2 56.0 58.6 62.1 57.3 52.0
Japan Autocatalyst 18.4 25.5 21.2 24.7 23.2 22.6Chemical 0.6 0.6 0.6 0.5 0.6 0.6Dental 9.2 7.8 6.8 6.8 5.7 5.5Electrical 8.4 9.2 9.3 10.0 7.6 7.6Investment 0.0 0.3 0.2 0.0 -0.1 0.0Jewellery 2.5 2.3 2.2 2.2 2.2 2.1Other 0.3 0.3 0.3 0.3 0.3 0.3Total 39.3 46.0 40.6 44.5 39.5 38.7
N. America Autocatalyst 31.7 42.1 48.1 56.2 54.7 59.8Chemical 1.6 2.0 2.5 2.7 2.2 2.3Dental 8.1 7.8 7.0 5.9 5.2 5.0Electrical 5.3 5.0 4.5 5.1 4.9 4.7Investment 3.0 33.9 -16.6 9.5 0.3 -6.1Jewellery 1.9 2.0 1.4 1.4 1.4 1.4Other 0.5 0.8 1.4 1.2 1.4 1.4Total 51.9 93.6 48.2 82.0 70.1 68.5
China Autocatalyst 21.3 31.3 35.9 41.2 47.9 50.9Chemical 2.3 2.0 4.5 6.6 8.1 8.1Dental 0.0 0.0 0.0 0.1 0.2 0.2Electrical 10.4 11.2 8.4 5.5 5.2 5.2Investment 0.0 0.0 0.0 0.0 0.0 0.0Jewellery 17.4 11.2 9.5 7.4 4.8 3.0Other 0.3 0.3 0.3 0.3 0.4 0.4Total 51.8 56.0 58.6 61.1 66.6 67.8
RoW Autocatalyst 23.6 33.3 40.1 41.0 44.0 44.7Chemical 3.0 3.6 3.6 4.0 4.2 4.2Dental 0.5 0.5 0.5 0.5 0.5 0.6Electrical 12.4 12.4 14.6 11.8 11.7 11.7Investment 0.2 0.0 0.0 0.0 0.0 37.3Jewellery 0.8 0.9 0.8 0.8 0.8 0.7Other 0.5 0.5 0.6 0.5 0.7 0.7Total 40.9 51.2 60.2 58.6 61.9 99.9Grand total 244.2 302.8 266.2 308.3 295.4 326.9

Precious Metals Management
27
PGM MARKET REPORT MAY 2014
RHODIUM ‘000 oz - Supply and Demand
Forecast
2009 2010 2011 2012 2013 2014
Supply1 South Africa 663 632 641 577 553 492
Russia2 70 70 70 90 85 68
North America 15 10 23 25 29 33
Zimbabwe3 19 19 29 28 36 34
Others3 3 3 2 3 5 5
Total Supply 770 734 765 723 708 632
Demand4 Autocatalyst4 619 727 715 772 806 844
Chemical 54 67 72 80 83 82
Electrical 3 4 6 6 5 5
Glass 19 68 77 35 49 47
Other 21 21 38 63 78 62
Total Gross Demand 716 887 908 956 1,021 1,040
Recycling6 Autocatalyst -187 -241 -277 -252 -278 -322
Total Recycling -187 -241 -277 -252 -278 -322
Total Net Demand7 529 646 631 704 743 718
Movement in Stocks8 241 88 134 19 -35 -86

PGM MARKET REPORT NOVEMBER 2014
Precious Metals Management
28
RHODIUM Tonnes - Supply and Demand
Forecast
2009 2010 2011 2012 2013 2014
Supply1 South Africa 17.9 20.6 19.7 17.9 17.2 15.3
Russia2 2.6 2.2 2.2 2.8 2.6 2.1
North America 0.6 0.5 0.3 0.8 0.9 1.0
Zimbabwe3 0.5 0.6 0.6 0.9 1.1 1.1
Others3 0.1 0.1 0.1 0.1 0.2 0.2
Total Supply 21.6 23.9 22.8 22.5 22.0 19.7
Demand4 Autocatalyst4 23.9 19.3 22.6 24.0 25.0 26.3
Chemical 2.1 1.7 2.1 2.5 2.6 2.6
Electrical 0.1 0.1 0.1 0.1 0.1 0.1
Glass 1.1 0.6 2.1 1.1 1.5 1.5
Other 0.7 0.7 0.7 2.0 2.5 1.9
Total Gross Demand 27.9 22.3 27.6 29.7 31.7 32.4
Recycling6 Autocatalyst -7.1 -5.8 -7.5 -7.8 -8.6 -10.0
Total Recycling -7.1 -5.8 -7.5 -7.8 -8.6 -10.0
Total Net Demand7 20.8 16.5 20.1 21.9 23.1 22.4
Movement in Stocks8 0.8 7.5 2.7 0.6 -1.1 -2.7

PGM MARKET REPORT NOVEMBER 2014
Precious Metals Management
29
IRIDIUM ‘000 oz - Demand
Forecast
2009 2010 2011 2012 2013 2014
Demand Chemical 11 18 19 19 20 23
Electrical 7 201 195 28 35 44
Electrochemical 33 79 76 73 57 60
Other 30 40 42 75 79 88
Total Demand 81 338 332 195 191 215
IRIDIUM Tonnes - Demand
Forecast
2009 2010 2011 2012 2013 2014
Demand Chemical 0.3 0.6 0.6 0.6 0.6 0.7
Electrical 0.2 6.3 6.1 0.9 1.1 1.4
Electrochemical 1.0 2.5 2.4 2.3 1.8 1.9
Other 0.9 1.2 1.3 2.3 2.4 2.7
Total Demand 2.4 10.6 10.4 6.1 5.9 6.7

PGM MARKET REPORT NOVEMBER 2014
Precious Metals Management
30
RUTHENIUM ‘000 oz - Demand
Forecast
2009 2010 2011 2012 2013 2014
Demand Chemical 89 100 273 185 314 329
Electrical 336 679 536 247 336 368
Electrochemical 95 124 130 171 153 162
Other 54 42 58 79 108 110
Total Demand 574 945 997 682 911 969
RUTHENIUM Tonnes - Demand
Forecast
2009 2010 2011 2012 2013 2014
Demand Chemical 2.8 3.1 8.5 5.7 9.7 10.2
Electrical 10.5 21.1 16.7 7.7 10.4 11.5
Electrochemical 3.0 3.9 4.0 5.3 4.8 5.0
Other 1.7 1.3 1.8 2.5 3.4 3.4
Total Demand 17.9 29.4 31.0 21.2 28.3 30.1
PGM MARKET REPORT NOVEMBER 2014
Precious Metals Management
31
1Supply figures represent estimates of sales by the mines of primary pgm and are allocated to where the initial mining took place rather than the location of refining. Additionally, we continue to report sales of metal which we believe has not previously been priced, principally sales of Russian state stocks, as supplies.
2Our Russian supply figures represent the total pgm sold in all regions, including Russia and the ex-CIS. Demand in Russia and the ex-CIS states is included in the Rest of the World region. Russian supply figures for palladium have been split into sales from primary mining and sales of stocks.
3Supplies from Zimbabwe have been split from Others’ supplies. Platinum group metals mined in Zimbabwe are currently refined in South Africa, and our supply figures represent shipments of pgm in concentrate or matte, adjusted for typical refining recoveries.
4Gross demand figures for any given application represent the sum of manufacturer demand for metal in that application and any changes in unrefined metal stocks in that sector. Increases in unrefined stocks lead to additional demand, reductions in stock lead to a lower demand figure.
5Our Medical and Biomedical category represents combined metal demand in the medical, biomedical and dental sectors.
6Recycling figures represent estimates of the quantity of metal recovered from open loop recycling (i.e. where the original purchaser does not retain control of the metal throughout). For instance, autocatalyst recycling represents the weight of metal recovered from end of life vehicles and aftermarket scrap in an individual region, allocated to where the car is scrapped rather than where the metal is finally recovered. These figures do not include warranty or production scrap. Where no recycling figures are given, open loop recycling is negligible.
7Net demand figures are equivalent to the sum of gross demand in an application less any metal recovery from open loop scrap in that application, whether the recycled metal is reused in that industry or sold into another application. Where no recycling figure is given for an application, gross and net demand are identical.
8Movements in stocks in any given year reflect changes in stocks held by fabricators, dealers, banks and depositories but excluding stocks held by primary refiners and final consumers. A positive figure (sometimes referred to as a ‘surplus’) reflects an increase in market stocks. A negative value (or ‘deficit’) indicates a decrease in market stocks.
NOTES TO TABLES

PGM MARKET REPORT NOVEMBER 2014
Precious Metals Management
32
Johnson Matthey PLC endeavours to ensure the accuracy of the information and materials contained within this report, but makes no warranty as to accuracy, completeness or suitability for any particular purpose. Johnson Matthey PLC accepts no liability whatsoever in respect of reliance placed by the user on information and materials contained in this report, which are utilised expressly at the user’s own risk.
In particular, this report and the information and materials in this report are not, and should not be construed as, an offer to buy or sell, or solicitation of an offer to buy or sell, any regulated precious metal related products or any other regulated products, securities or investments, or making any recommendation or providing any investment or other advice with respect to the purchase, sale or other disposition of, any regulated precious metal related products or any other regulated products, securities or investments including, without limitation, any advice to the effect that any precious metal related transaction is appropriate or suitable for any investment objective or financial situation of a prospective investor.
A decision to invest in any regulated precious metal related products or any other regulated products, securities or investments should not be made in reliance on any of the information or materials in this report. Before making any investment decision, prospective investors should seek advice from their financial, legal, tax and accounting advisers, take into account their individual financial needs and circumstances and carefully consider the risks associated with such investment decisions. This report does not, and should not be construed as acting to, sponsor, advocate, endorse or promote any regulated precious metal related products or any other regulated products, securities or investments.
DISCLAIMER
This report is produced in hard copy only to minimise the risk of wider circulation. It is intended for a select list of readers, and the information contained herein is for those readers only. Please do not distribute to any third parties without prior agreement with Johnson Matthey.
CONFIDENTIALITY