p eripheral t-c ell l ymphomas : h ow i m anage ptcl in the f rontline s etting professor of...
TRANSCRIPT

PERIPHERAL T-CELL LYMPHOMAS: HOW I MANAGE PTCL IN THE FRONTLINE
SETTING
Professor of Medicine and Experimental TherapeuticsDirector, Center for Lymphoid Malignancies
Columbia University Medical Center – College of Physicians and Surgeons
The New York Presbyterian HospitalNew York, N.Y.
Owen A. O’Connor, M.D., [email protected]
Center for Lymphoid Malignancies

PERIPHERAL T-CELL LYMPHOMAS: HOW I MANAGE FRONTLINE DISEASE
· Putting The T-cell Lymphomas in Context
· What Are the Optimal Upfront Treatment Considerations
· Bridging Patients with Relapsed or Refractory Disease with Novel Drugs
· Conclusion
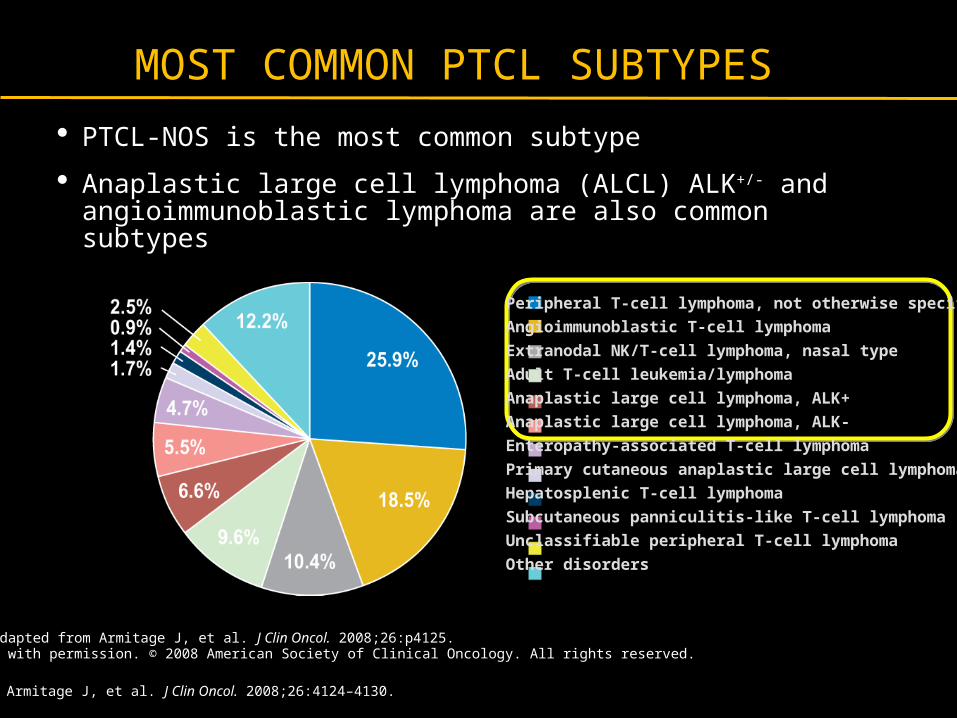
MOST COMMON PTCL SUBTYPES
· PTCL-NOS is the most common subtype
· Anaplastic large cell lymphoma (ALCL) ALK+/- and angioimmunoblastic lymphoma are also common subtypes
1. Armitage J, et al. J Clin Oncol. 2008;26:4124–4130.
Source: Adapted from Armitage J, et al. J Clin Oncol. 2008;26:p4125.Reprinted with permission. © 2008 American Society of Clinical Oncology. All rights reserved.
Peripheral T-cell lymphoma, not otherwise specified
Angioimmunoblastic T-cell lymphoma
Extranodal NK/T-cell lymphoma, nasal type
Adult T-cell leukemia/lymphoma
Anaplastic large cell lymphoma, ALK+
Anaplastic large cell lymphoma, ALK-
Enteropathy-associated T-cell lymphoma
Primary cutaneous anaplastic large cell lymphoma
Hepatosplenic T-cell lymphoma
Subcutaneous panniculitis-like T-cell lymphoma
Unclassifiable peripheral T-cell lymphoma
Other disorders

CLASSIFICATION OF PERIPHERAL T-CELL LYMPHOMA (PTCL)
· PTCL is a heterogeneous group of aggressive mature T-/NK-cell lymphomas1
– PTCL does not refer to anatomic sites, but rather to the involvement of more mature (post-thymic) T cells vs pre-thymic or immature T cells1
1. Armitage JO, et al. Ann Oncol. 2004;15:1447–1449. 2. Adapted from Rodriguez J, et al. Crit Rev Oncol Hematol. 2008.3. Adapted from Swerdlow SH, et al. WHO Classification of Tumours of Haematopoietic and Lymphoid Tissues. 2008.
Non-Hodgkins Lymphoma
Precursor Lymphoid
Neoplasms
T-Lymphoblastic Leukemia/Lymphoma
Cutaneous
Primary Cutaneous CD30+ T-cell
Disorders
Mycosis Fungoides (MF)
T-/NK-cell NeoplasmsB-cell Neoplasms
Extranodal
NK/TCL Nasal Type
Adult T-cell Leukemia/Lymphoma
T-cell Large Granular Lymphocytic
Leukemia
Subcutaneous Panniculitis-like TCL
Leukemic
Enteropathy- associated TCL
Hepatosplenic TCL
Aggressive NK-Cell Leukemia
T-cell Prolymphocytic Leukemia
Transformed MF
Mature T-/NK-cell Neoplasms
Primary Cutaneous Gamma/Delta TCL
Sézary Syndrome
Peripheral TCL-NOS
Nodal
Angioimmunoblastic TCL
Anaplastic Large Cell Lymphoma (ALK +/-)
20
08
WH
O C
las
sif
ica
tio
n
of
Ma
jor
Su
bty
pe
s2,
3
NH
L N
eo
pla
sm
G
rou
pin
g
Aggressive

NO IMPROVEMENTS IN SURVIVAL
Source: International T-Cell Lymphoma Project. J Clin Oncol. 2008;26:4124-4130 and courtesy of the T-Cell
Project Executive Committee, unpublished data.

PTCL PROGNOSIS
· Most PTCL subtypes have a worse prognosis than aggressive B-cell NHL– Median overall survival for most subtypes of PTCL is 1–3 years1,2
– 5-year overall survival is approximately 26%3
– ALK+ ALCL is an exception, with a 5-year survival of 65–90%2
Armitage JO, et al. Towards understanding the peripheral T-cell lymphomas. Ann Oncol. 2004;15:1447–1449. by permission of Oxford University Press.
1. Armitage JO, et al. Ann Oncol. 2004;15:1447–1449.2. Savage KJ. Blood Rev. 2007;21:201–216.3. Rüdiger T, et al. Ann Oncol. 2002;13:140–149.

FIRST-LINE THERAPYClinical Trial Preferred
CHOP appropriate for ALCL alk+CHOEP, CHOP followed by ICE, CHOP followed by IVE
HyperCVAD
FIRST-LINE ConsolidationAll patients, except low risk IPI consider consolidation with high
dose therapy and stem cell rescue(ALCL ALK Positive is a subtype with good prognosis and dose not
need consolidative transplant if in remission
NCCN Practice Guidelines in Oncology v 3. 2011
NCCN- 2011 PTCL PRACTICE GUIDELINESFIRST LINE THERAPY
PERIPHERAL T-CELL LYMPHOMAS: HOW I MANAGE FRONTLINE DISEASE
· Putting The T-cell Lymphomas in Context
· What Are the Optimal Upfront Treatment Considerations
· Bridging Patients with Relapsed or Refractory Disease with Novel Drugs
· Conclusion
Time
Pro
po
rtio
n
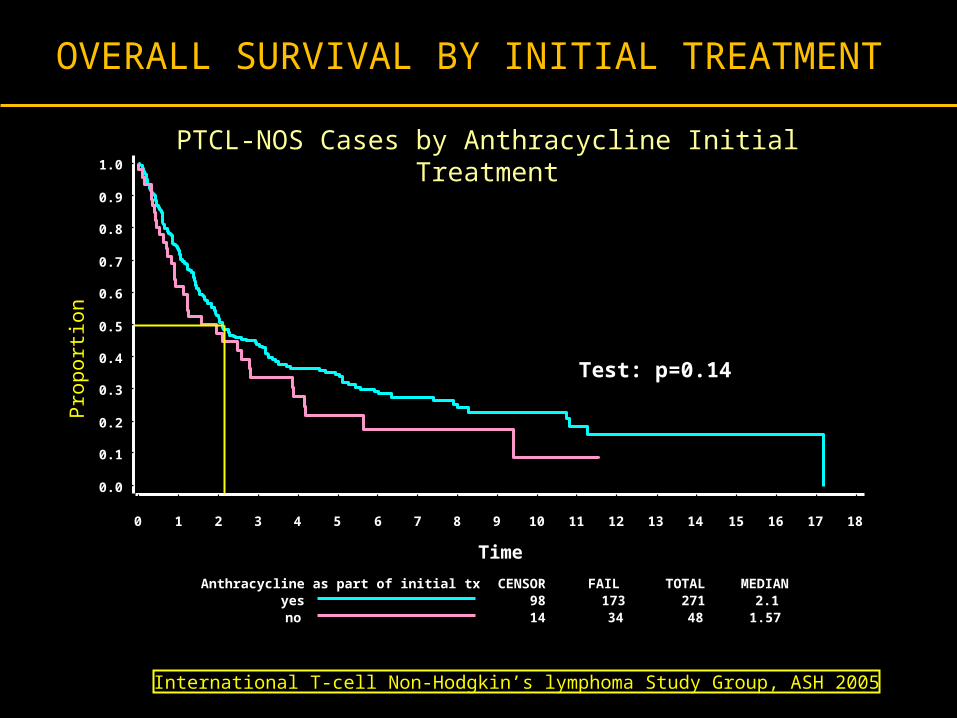
Anthracycline as part of initial tx CENSOR FAIL TOTAL MEDIANyes 98 173 271 2.1no 14 34 48 1.57
Test: p=0.14
0.0
0.1
0.2
0.3
0.4
0.5
0.6
0.7
0.8
0.9
1.0
0 1 2 3 4 5 6 7 8 9 10 11 12 13 14 15 16 17 18
PTCL-NOS Cases by Anthracycline Initial Treatment
International T-cell Non-Hodgkin’s lymphoma Study Group, ASH 2005
OVERALL SURVIVAL BY INITIAL TREATMENT

Baseline with CHOP/CHOP-Like Therapy: PTCL-By IPI: Is there Favorable Risk Disease?
OS (Yrs)
Cum
ulati
ve S
urvi
val
0
0.2
0.4
0.6
0.8
1.0
0 2 4 6 8 10 12 14 16
CR: 64%PFS: 24%
0, 1 (n = 36)
2, 3 (n = 54)
4, 5 (n = 27)
Courtesy British Columbia Cancer Agency

ARE ETOPOSIDE CONTAINING REGIMENS BETTER?
Blood 2010;116:3418-25
PTCL subtype
N pts
ALCL alk+ 78
ALCL alk- 113
PTCL-NOS
70
AITL 28
Other 31
Total 320
Breakdown by Subtype of T-Cell Lymphoma
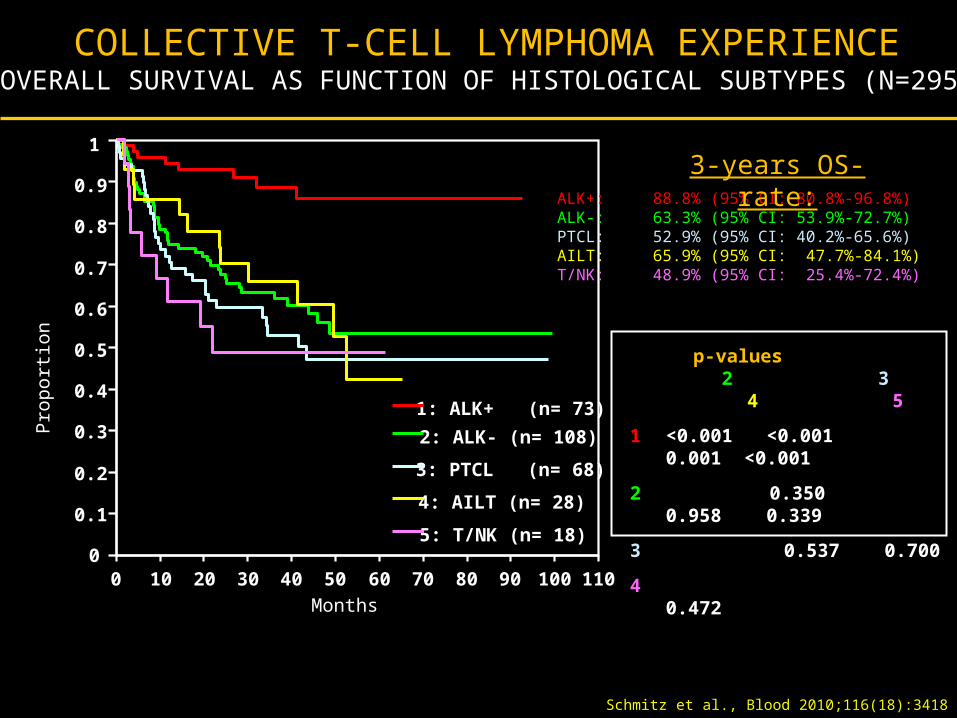
COLLECTIVE T-CELL LYMPHOMA EXPERIENCEOVERALL SURVIVAL AS FUNCTION OF HISTOLOGICAL SUBTYPES (N=295)
0
0.1
0.2
0.3
0.4
0.5
0.6
0.7
0.8
0.9
1
Pro
por
tion
0 10 20 30 40 50 60 70 80 90 100 110
Months
1: ALK+ (n= 73)
2: ALK- (n= 108)
3: PTCL (n= 68)
4: AILT (n= 28)
5: T/NK (n= 18)
p-values 2 3 4 5
1 <0.001 <0.001 0.001 <0.001
2 0.350 0.958 0.339
3 0.537 0.700
4 0.472
ALK+: 88.8% (95% CI: 80.8%-96.8%)ALK-: 63.3% (95% CI: 53.9%-72.7%)
PTCL: 52.9% (95% CI: 40.2%-65.6%)AILT: 65.9% (95% CI: 47.7%-84.1%)T/NK: 48.9% (95% CI: 25.4%-72.4%)
3-years OS-rate:
Schmitz et al., Blood 2010;116(18):3418

EVENT FREE SURVIVAL OF 320 PATIENTS WITH T-CELL LYMPHOMA
ACCORDING TO HISTOLOGIC SUBTYPE
Eve
nt
Fre
e S
urv
ivia
l %
0
10
20
30
40
50
60
70
80
90
100
Months
0 10 20 30 40 50 60 70 80 90 100 110
ALCL/ALK+ (n=78)
ALCL/ALK- (n=113)
PTCLU (n=70)
AITL (n=28)
Other (n=31)
Schmitz et al., Blood 2010;116(18):3418

%
0
10
20
30
40
50
60
70
80
90
100
Months
0 10 20 30 40 50 60 70 80 90 100 110
p=0.057
non Etoposide (n=29)
Etoposide (n=69)
PATIENTS WITH OTHER MAJOR SUBTYPES (PATIENTS WITH ALK+ OR ALCL EXLCUDED)
GERMAN HIGH-GRADE NHL STUDY GROUP (DSHNHL)
www.lymphome.de/en/Groups/DSHNHL
EFS OF YOUNGER PATIENTS (18-60 YEARS, LDH<=UNV) TREATED ON THE NHL-B1 OR HI-CHOEP
PHASE II/III TRIALS Schmitz et al., Blood 2010;116(18):3418

CHOEP-14d x 3
CR, PR SD,PD
CHOEP-14d x 3
(stem cell collection)
NLG-T-01: 2001-2007 Design and schedule
HDT (BEAM)
CR, PR SD,PD
Follow-up
Excluded: 1) Alk pos ALCL T/0 2) CTCL3) Leukemic T-
NHL
Nordic PTCL project
d’Amore et al EHA 2009: abs.#53
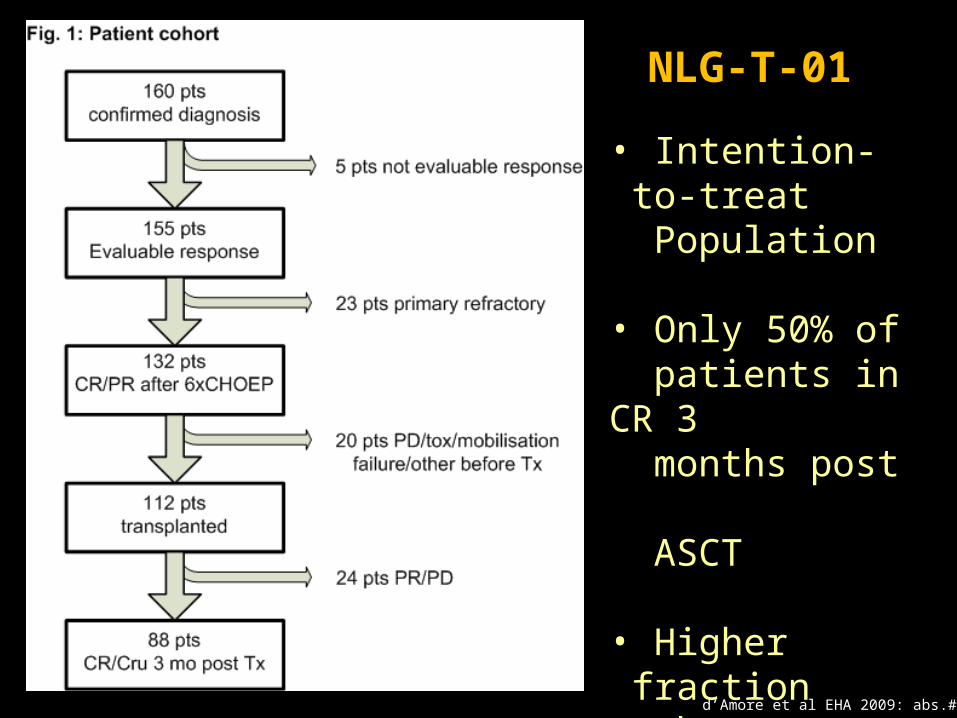
NLG-T-01
• Intention-to-treat
Population
• Only 50% of patients in CR 3 months post ASCT
• Higher fraction than expected made it to ASCT
d’Amore et al EHA 2009: abs.#53
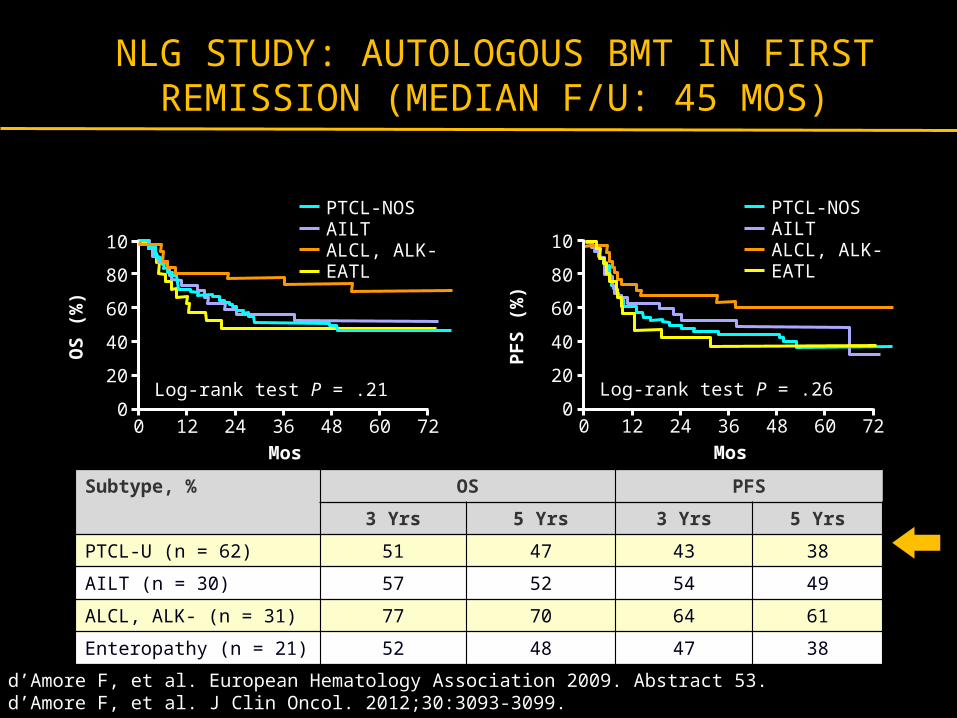
Subtype, % OS PFS
3 Yrs 5 Yrs 3 Yrs 5 Yrs
PTCL-U (n = 62) 51 47 43 38
AILT (n = 30) 57 52 54 49
ALCL, ALK- (n = 31) 77 70 64 61
Enteropathy (n = 21) 52 48 47 38
d’Amore F, et al. European Hematology Association 2009. Abstract 53.d’Amore F, et al. J Clin Oncol. 2012;30:3093-3099.
NLG STUDY: AUTOLOGOUS BMT IN FIRST REMISSION (MEDIAN F/U: 45 MOS)
Mos
OS
(%
)
10
80
60
40
20
0
PTCL-NOSAILTALCL, ALK-EATL
0 12 24 36 48 60 72
Log-rank test P = .21
Mos
PF
S (
%)
10
80
60
40
20
0
PTCL-NOSAILTALCL, ALK-EATL
0 12 24 36 48 60 72
Log-rank test P = .26

AUTOLOGOUS STEM CELL TRANSPLANTATION (AUTOSCT) AS FIRST-LINE THERAPY IN PERIPHERAL T-CELL
LYMPHOMAS (PTCL):RESULTS OF A PROSPECTIVE MULTICENTER STUDY
STUDY DESIGN
PTCL
Collection of stem cells
Cyc 120mg / kg+ TBI AutoSCT
CH
OP
-21
CH
OP
-21
CH
OP
-21
CH
OP
-21
CH
OP
-21
CH
OP
-21
De
xa
BE
AM
/ E
SH
AP
De
xa
BE
AM
/ E
SH
AP
PR/CR PR/CR PR/CR
Reimer et al., 2009

PTCL
n= 83
DeadCompleteRemission
Alive with Disease
n= 17n= 6n= 32
No autoSCT
n= 28
AUTOLOGOUS STEM CELL TRANSPLANTATION (AUTOSCT) AS FIRST-LINE THERAPY IN PERIPHERAL T-CELL
LYMPHOMAS (PTCL): OUTCOME
AutoSCT
n= 55
DeadComplete Remission
Alive with Disease
n= 23n= 2n= 3
N = 24 progressive disease
N = 2 patient request
N = 2 other
Reimer et al., 2009, JCO 27(1): 106-113

GERMAN PROSPECTIVE STUDY: OS AFTER ASCT IN FIRST REMISSION
• PIT group 1: 0 risk factors• PIT group 2: 1 risk factor• PIT group 3: 2 risk factors• PIT group 4: 3-4 risk factors
• N = 83• CHOP x 4-6• If ≥ PR, dexaBEAM or ESHAP• dexaBEAM or ESHAP ± TBI• Median follow-up: 33 mos
Reimer P, et al. J Clin Oncol. 2009;27:106-113.
Nontransplanted patients did poorly
Poor-risk patients did poorlyPro
po
rtio
n A
ch
iev
ing
OS
1.0
0.8
0.6
0.4
0.2
00 12 24 36 48 60
Mos
P < .001
Transplanted (n = 55)
Nontransplanted (n = 28)
Pro
po
rtio
n A
ch
iev
ing
OS
1.0
0.8
0.6
0.4
0.2
00 12 24 36 48 60
Mos
P = .0414
PIT group 2 (n = 34)
PIT group 4 (n = 3)PIT group 3
(n = 21)
PIT group 1 (n = 25)

ASCT 1st line in PTCLOS + PFS in the two largest PTCL-restricted ASCT trials
OS NLG-T-01(EHA 09)
Reimer et al(JCO 09)
3-yrs 57% 48%
5-yrs 50% 40%
PFS NLG-T-01(EHA 09)
Reimer et al(JCO 09)
3-yrs 49% 36%
5-yrs 43% n.d.
InductionConditioning
regimen
Nordic trial CHOEP-14 x6 BEAM
German trial
CHOP-21 x4-6+ DexaBEAM (mobilizing)
HdCy+TBI
Differences in treatment schedule
NLG-T = Etoposide in Induction vs Reimer = No Etoposide in Induction
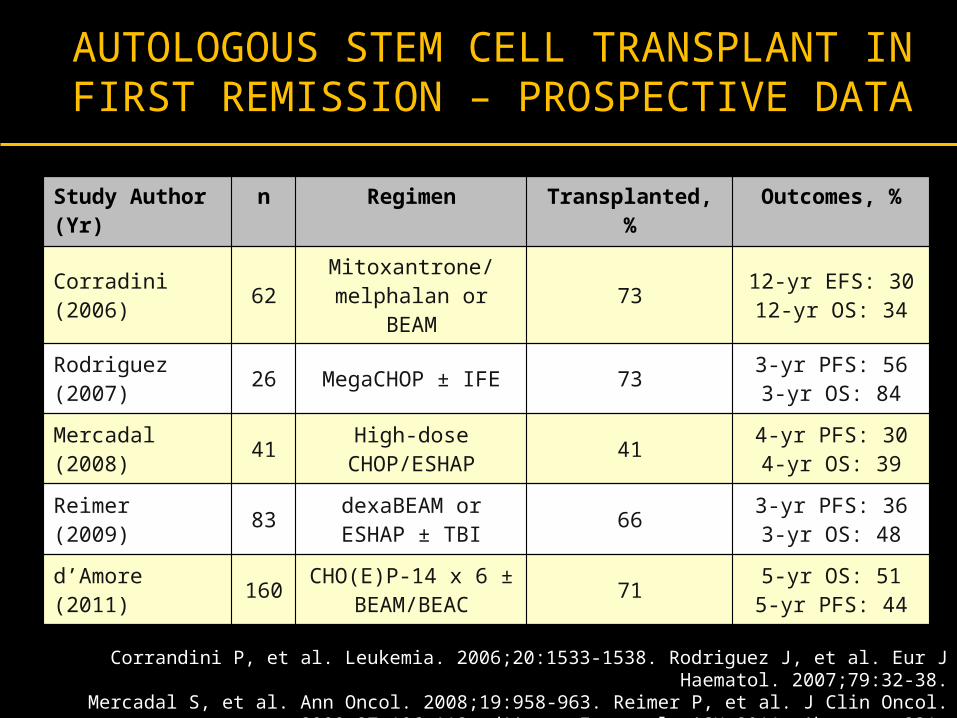
AUTOLOGOUS STEM CELL TRANSPLANT IN FIRST REMISSION – PROSPECTIVE DATA
Study Author(Yr)
n Regimen Transplanted, % Outcomes, %
Corradini(2006) 62 Mitoxantrone/
melphalan or BEAM 73 12-yr EFS: 3012-yr OS: 34
Rodriguez(2007) 26 MegaCHOP ± IFE 73 3-yr PFS: 56
3-yr OS: 84
Mercadal(2008) 41 High-dose
CHOP/ESHAP 41 4-yr PFS: 304-yr OS: 39
Reimer(2009) 83 dexaBEAM or ESHAP
± TBI 66 3-yr PFS: 363-yr OS: 48
d’Amore(2011) 160 CHO(E)P-14 x 6 ±
BEAM/BEAC 71 5-yr OS: 515-yr PFS: 44
Corrandini P, et al. Leukemia. 2006;20:1533-1538. Rodriguez J, et al. Eur J Haematol. 2007;79:32-38.Mercadal S, et al. Ann Oncol. 2008;19:958-963. Reimer P, et al. J Clin Oncol. 2009;27:106-113. d’Amore F,
et al. ASH 2011. Abstract 331.
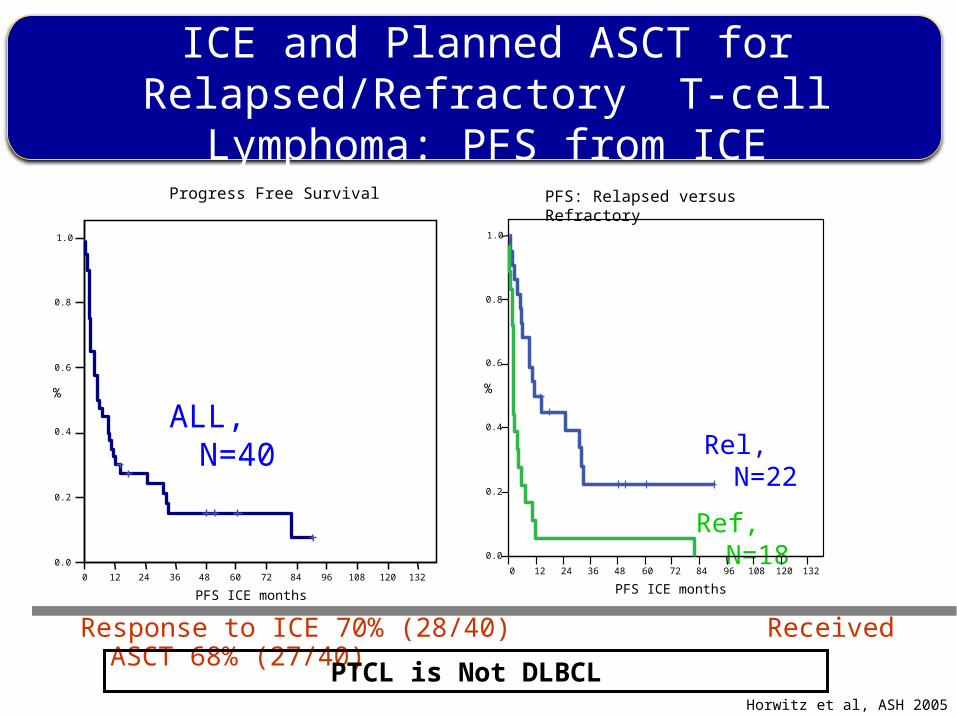
ICE and Planned ASCT for Relapsed/Refractory T-cell Lymphoma: PFS from ICE
ALL, N=40 Rel, N=22
Ref, N=18
Horwitz et al, ASH 2005
Response to ICE 70% (28/40) Received ASCT 68% (27/40)
0 12 24 36 48 60 72 84 96 108 120 132
PFS ICE months
0.0
0.2
0.4
0.6
0.8
1.0
%
Progress Free Survival
0 12 24 36 48 60 72 84 96 108 120 132
PFS ICE months
0.0
0.2
0.4
0.6
0.8
1.0
%
PFS: Relapsed versus Refractory
PTCL is Not DLBCL

PERIPHERAL T-CELL LYMPHOMAS: HOW I MANAGE FRONTLINE DISEASE
· Putting The T-cell Lymphomas in Context
· What Are the Optimal Upfront Treatment Considerations
· Bridging Patients with Relapsed or Refractory Disease with Novel Drugs
· Conclusion

70% of responders did so in Cycle 1
Central Review(N=109)
InvestigatorAssessment
(N=109)
n Percent n Percent
Best Response
CR+CRu+PR 32 29% 43 39%
CR 11 10% 17 16%
CRu 1 1% 3 3%
PR 20 18% 23 21%
SD 21 19% 22 19%
PD 40 37% 40 37%
UE 2 2% 0 0%
ND: off-treatment in Cycle 1 14 13% 5 5%
SUMMARY OF RESPONSEPROPEL
O. A. O’Connor et al., JCO, 2011; 29(9): 1182-1189

CASE MATCHING PROCEDURES USING 4 DATABASES FROM 3 CONTINENTS
MSKUNMCGELASMCTotalTimeframe1997-20111984-20101997-20081995-20071984-2011
N17176117504868
Patients with: Relapsed/refractory PTCL Appropriate histology
No pralatrexate
Matched by:(1) Histology(2) No. therapies(3) Age ranges(4) Gender
Medical review
1:1 match
Historical control
N
PralatrexateN
868 -
390 109
280 75
92 75
66 66MSK UNMC GELA SMC22 13 22 9
Very Closely Matched Patients Populations
Courtesy Charlie Morris
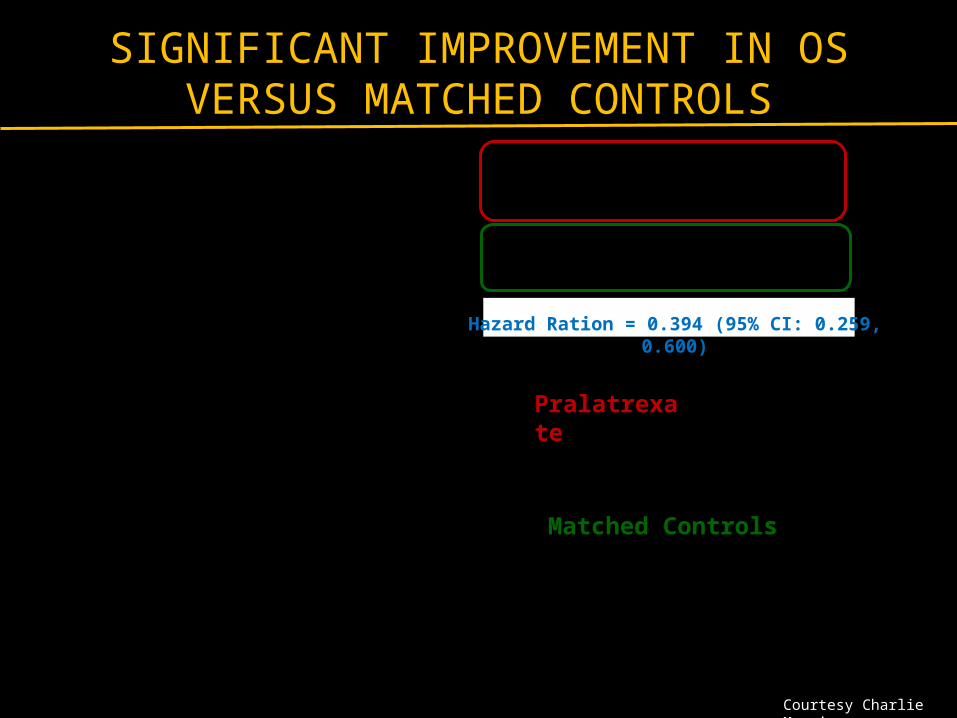
SIGNIFICANT IMPROVEMENT IN OS VERSUS MATCHED CONTROLS
Pralatrexate
Matched Controls
Hazard Ration = 0.394 (95% CI: 0.259, 0.600)
Courtesy Charlie Morris
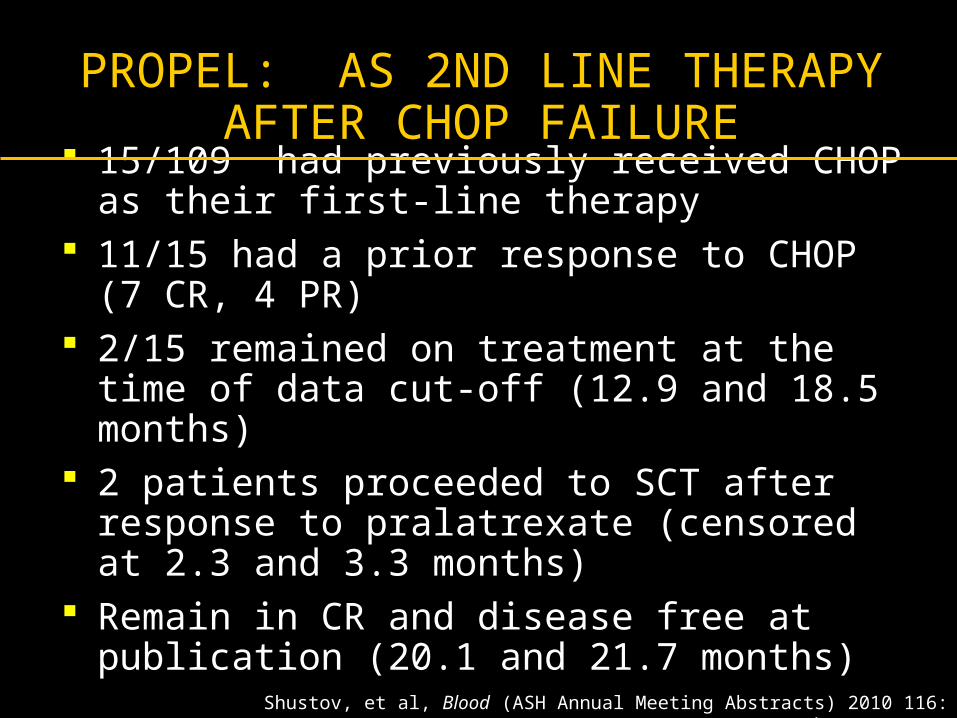
PROPEL: AS 2ND LINE THERAPY AFTER CHOP FAILURE
15/109 had previously received CHOP as their first-line therapy
11/15 had a prior response to CHOP (7 CR, 4 PR)
2/15 remained on treatment at the time of data cut-off (12.9 and 18.5 months)
2 patients proceeded to SCT after response to pralatrexate (censored at 2.3 and 3.3 months)
Remain in CR and disease free at publication (20.1 and 21.7 months)
Shustov, et al, Blood (ASH Annual Meeting Abstracts) 2010 116: Abstract 4882
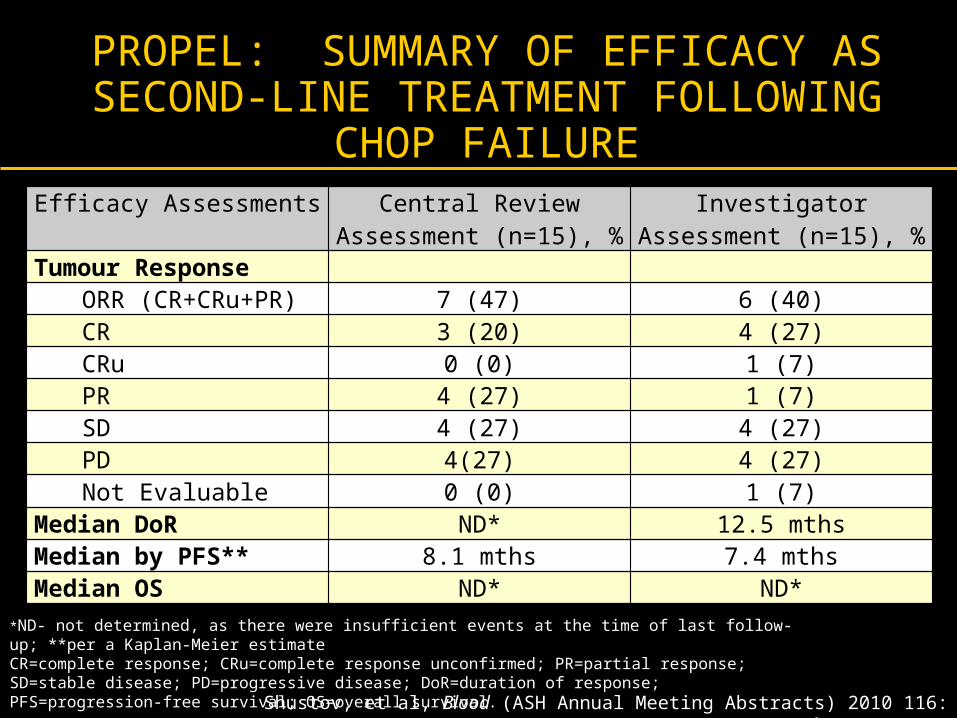
PROPEL: SUMMARY OF EFFICACY AS SECOND-LINE TREATMENT FOLLOWING
CHOP FAILURE
*ND- not determined, as there were insufficient events at the time of last follow-up; **per a Kaplan-Meier estimateCR=complete response; CRu=complete response unconfirmed; PR=partial response; SD=stable disease; PD=progressive disease; DoR=duration of response; PFS=progression-free survival; OS=overall survival.
Shustov, et al, Blood (ASH Annual Meeting Abstracts) 2010 116: Abstract 4882
Efficacy Assessments Central Review Assessment (n=15), %
Investigator Assessment (n=15), %
Tumour ResponseORR (CR+CRu+PR) 7 (47) 6 (40)CR 3 (20) 4 (27)CRu 0 (0) 1 (7)PR 4 (27) 1 (7)SD 4 (27) 4 (27)PD 4(27) 4 (27)Not Evaluable 0 (0) 1 (7)
Median DoR ND* 12.5 mthsMedian by PFS** 8.1 mths 7.4 mthsMedian OS ND* ND*
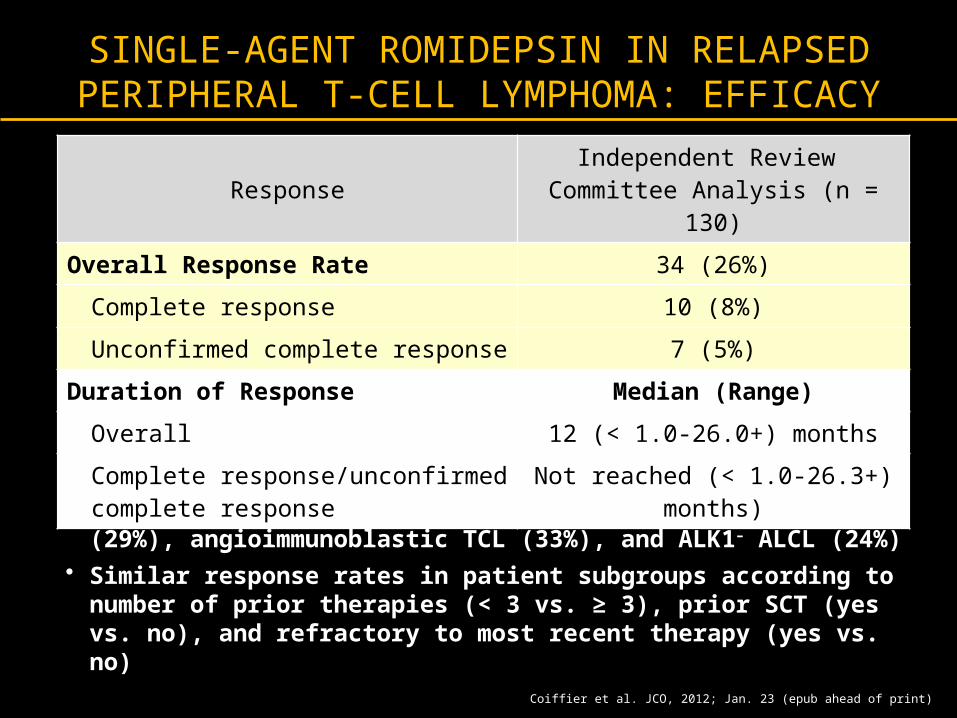
SINGLE-AGENT ROMIDEPSIN IN RELAPSED PERIPHERAL T-CELL LYMPHOMA: EFFICACY
• Responses reported in PTCL (not otherwise specified) (29%), angioimmunoblastic TCL (33%), and ALK1– ALCL (24%)
• Similar response rates in patient subgroups according to number of prior therapies (< 3 vs. ≥ 3), prior SCT (yes vs. no), and refractory to most recent therapy (yes vs. no)
Coiffier et al. JCO, 2012; Jan. 23 (epub ahead of print)
ResponseIndependent Review
Committee Analysis (n = 130)
Overall Response Rate 34 (26%)
Complete response 10 (8%)
Unconfirmed complete response 7 (5%)
Duration of Response Median (Range)
Overall 12 (< 1.0-26.0+) months
Complete response/unconfirmed complete response
Not reached (< 1.0-26.3+) months)
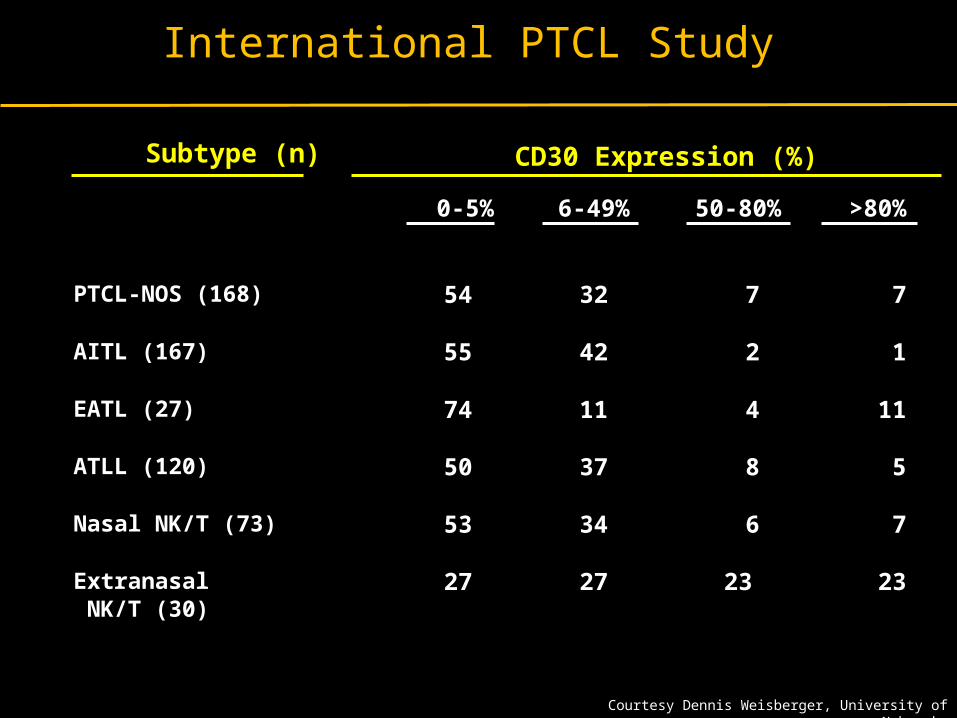
International PTCL Study
Subtype (n) CD30 Expression (%)
0-5% 6-49% 50-80% >80%
PTCL-NOS (168) 54 32 7 7
AITL (167) 55 42 2 1
EATL (27) 74 11 4 11
ATLL (120) 50 37 8 5
Nasal NK/T (73) 53 34 6 7
Extranasal NK/T (30)
27 27 23 23
Courtesy Dennis Weisberger, University of Nebraska
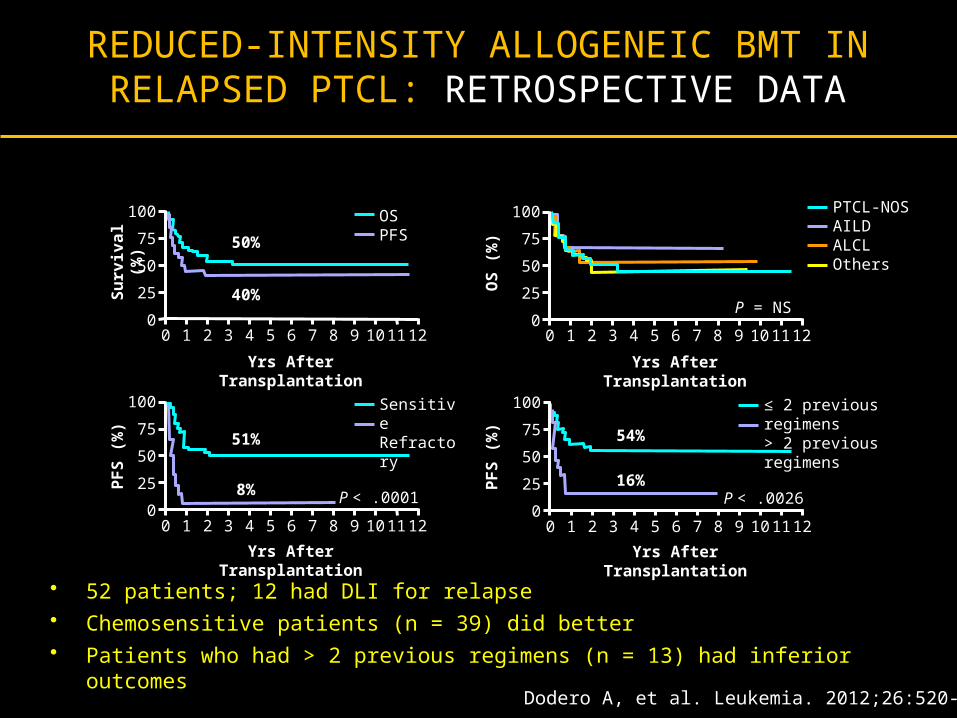
REDUCED-INTENSITY ALLOGENEIC BMT IN RELAPSED PTCL: RETROSPECTIVE DATA
• 52 patients; 12 had DLI for relapse• Chemosensitive patients (n = 39) did better • Patients who had > 2 previous regimens (n = 13) had inferior outcomes
Dodero A, et al. Leukemia. 2012;26:520-526.
100
75
50
25
0
Su
rviv
al
(%)
Yrs After Transplantation
120 1 2 3 4 5 6 7 8 9 10 11
50%
40%
OSPFS
100
75
50
25
0
PF
S (
%)
Yrs After Transplantation
120 1 2 3 4 5 6 7 8 9 10 11
51%
8%
SensitiveRefractory
P < .0001
100
75
50
25
0P
FS
(%
)
Yrs After Transplantation
120 1 2 3 4 5 6 7 8 9 10 11
54%
16%
≤ 2 previous regimens> 2 previous regimens
P < .0026
100
75
50
25
0
OS
(%
)
Yrs After Transplantation
120 1 2 3 4 5 6 7 8 9 10 11
PTCL-NOSAILDALCLOthers
P = NS

Confirm Hematopathology : CD30, CD52 Expression
Baseline CT/PET and Bone Marrow Biopsy, full skin exam with punch biopsy of suspicious lesions; HLA Typing, viral studies including HTLV-1, HIV
Combination Chemotherapy: EPOCH / CHOEP x 6 – 8 cycles
Complete Remission
Autologous Stem Cell Transplant
Partial Remission or Worse
PralatrexateRomidepsinBrentuximabGemcitabine
Partial Remission or Worse
Consider Allogeneic Stem Cell TransplantPalliative Care
AN ALGORITHM FOR THE MANAGEMENT OF PTCL-NOS UPFRONT
Relapse
Complete Remission

Peripheral T-Cell Lymphomas: How I Manage Frontline Disease
• CHOP clearly inferior, but is a regulatory standard. Integrating
etoposide may provide advantage?
• Caution removal of doxorubicin based upon the T-cell Lymphoma
Project
• Consolidation with ASCT probably beneficial, and more so then in the
relapsed or refractory setting
• Allogeneic stem cell transplant should be considered in eligible patients with
R/R disease
• USE NEWER FDA APPROVED DRUGS earlier in the natural history of
the disease.
• Many new studies emerging as CHOP additions (Pralatrexate,
Romidepsin, Brentuximab vedotin, Belinostat)

THANK YOU

Peripheral T-Cell Lymphomas: How I Manage Frontline Disease
· Putting The T-cell Lymphomas in Context
· Defining ‘Standards of Care’ for Upfront Treatment (won’t take long)
· Newly Emerging Options for Advanced (R/R) Disease: Is combination the right way to go?
- Pralatrexate in Relapsed/Refractory PTCL
- Targeting the Epigenome in PTCL
- Targeting CD30+ T-cell Malignancies
· Conclusion

NCCN GUIDELINESFOR RELAPSED OR REFRACTORY PTCLSA
CLINICAL TRIAL IS RECOMMENDED FIRST!
a Reproduced from NCCN Practice Guidelines in Oncology – v.2.2009.b See suggested regimens (TCEL-B).
Clinical trial preferred for 1st and 2nd relapse; no therapies other than clinical trial described
for 2nd relapse
Relapsed/ refractory disease
Relapsed/Refractory
disease
Clinical trialpreferred
-or-Second-line
therapyb
Clinical trial preferred-or-
Second-line therapyb
-or-Palliative RT
Completeresponse
-or-Partial
response
No response
Clinicaltrial-or-
Auto- orallo- SCT
Clinical trial
Clinical trial-or-
Best supportive care-or-
Palliative RT
Candidate for high-dose
therapy
Non-candidatefor high-dose
therapy
Relapse #2 or greater
Consolidation/ additional therapy
Response#2
Additional therapy
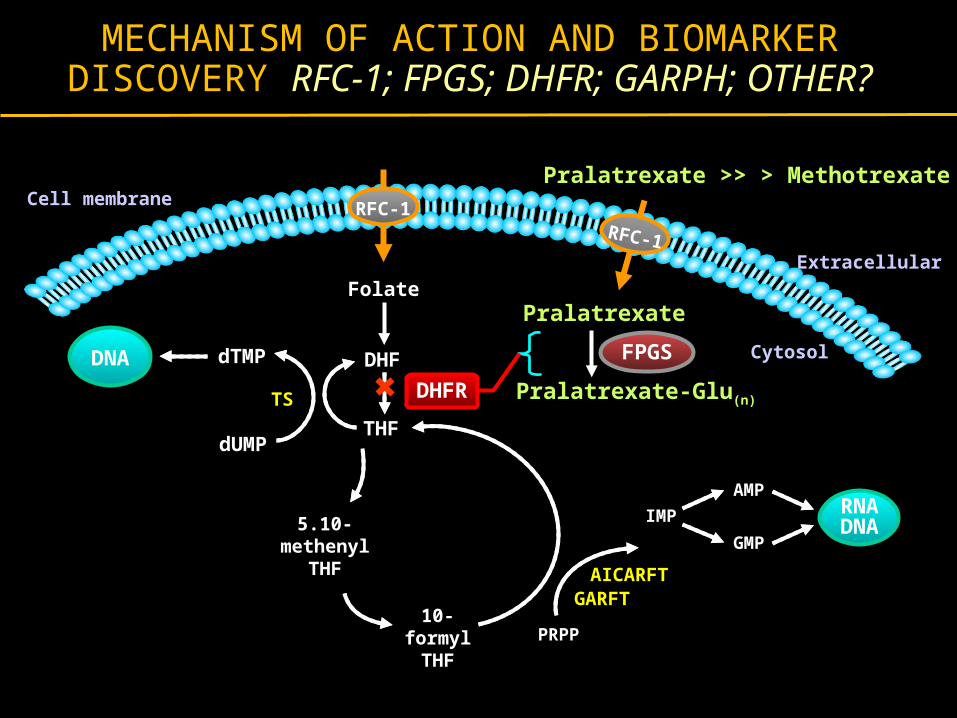
MECHANISM OF ACTION AND BIOMARKER DISCOVERY RFC-1; FPGS; DHFR; GARPH; OTHER?
RFC-1
Cell membrane
Extracellular
Cytosol
Pralatrexate >> > Methotrexate
DNA
10-formyl
THF
5.10-methenyl
THF
Pralatrexate
THF
Folate
DHF
PRPP
GARFT
Pralatrexate-Glu(n)
IMP
AICARFT
AMP
GMP
dUMP
dTMP
DHFR
RNADNA
TS
FPGS
RFC-1
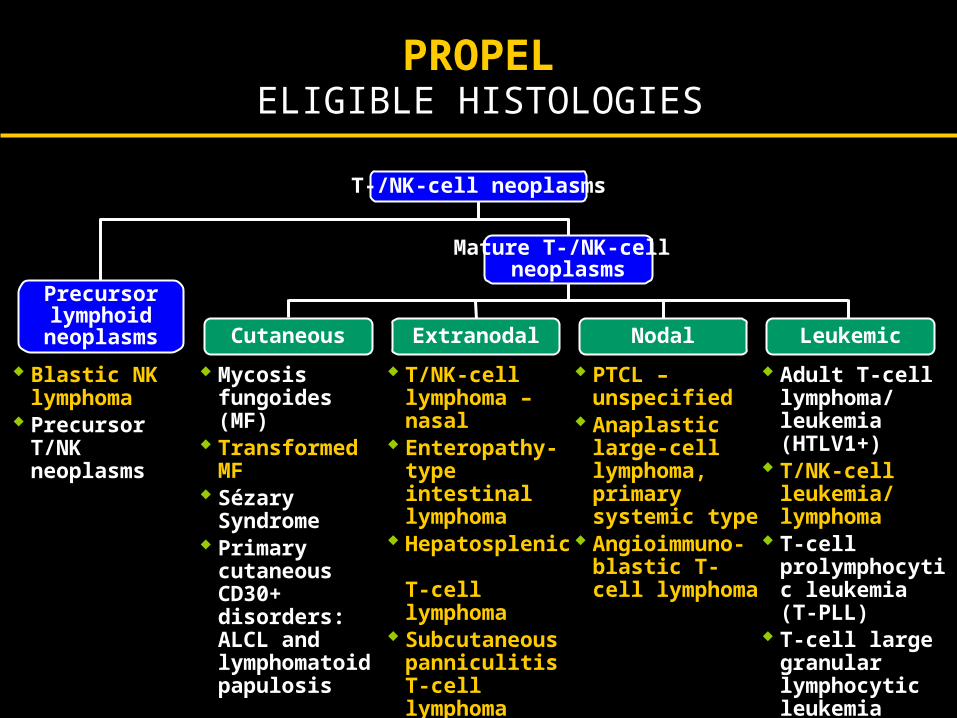
Adapted from Jaffe et al. WHO Classification of Tumours of Haematopoietic and Lymphoid Tissues. 2001.
T-/NK-cell neoplasms
Extranodal Leukemic
Mature T-/NK-cell neoplasms
NodalCutaneous
Precursor lymphoid
neoplasms
Blastic NK lymphoma
Precursor T/NK neoplasms
Mycosis fungoides (MF)
Transformed MF Sézary Syndrome Primary cutaneous
CD30+ disorders: ALCL and lymphomatoid papulosis
T/NK-cell lymphoma – nasal
Enteropathy-type intestinal lymphoma
Hepatosplenic T-cell lymphoma
SubcutaneouspanniculitisT-cell lymphoma
Peripheral T/NK-cell lymphoma unspecified
PTCL –unspecified
Anaplastic large-cell lymphoma, primary systemic type
Angioimmuno-blastic T-cell lymphoma
Adult T-celllymphoma/ leukemia (HTLV1+)
T/NK-cell leukemia/ lymphoma
T-cell prolymphocytic leukemia (T-PLL)
T-cell large granular lymphocytic leukemia
ELIGIBLE HISTOLOGIESPROPEL

PROPEL
N=111
Number of Regimens n Percent
1 23 21%
2 30 27%
3 23 21%
4 14 13%
≥ 5 21 19%
Median (range) 3.0 (1-12)
53% of patients had no evidence of response tothe most recent line of prior therapy
25% of patients had no evidence of response toany prior therapy
NUMBER OF PRIOR SYSTEMIC REGIMENS
O. A. O’Connor et al., JCO, 2011; 29(9): 1182-1189

PROPEL
Parameter Category IWC Response Rate 95% CI
RegionNorth America
Europe27 / 85 (32%)5 / 24 (21%)
(22%, 43%)(7%, 42%)
Histology
PTCL NOSAnaplastic LC
AngioimmunoblasticTransformed MF
Other
19 / 59 (32%)6 / 17 (35%)1 / 13 (8%)
3 / 12 (25%)3 / 8 (25%)
(21%, 46%)(14%, 62%)(0%, 36%)(5%, 57%)(9%, 76%)
Prior transplantYesNo
6 / 18 (33%)26 / 91 (20%)
(13%, 59%)(20%, 39%)
RESPONSE BY KEY SUBSETS
OO. A. O’Connor et al., JCO, 2011; 29(9): 1182-1189

RESPONSE BY PRIOR TREATMENTPROPEL
Parameter Category Response Rate 95% CI
Prior systemictherapy
1 regimen2 regimens
> 2 regimens
8 / 23 (30%)7 / 29 (24%)
17 / 57 (30%)
(16%, 57%)(10%, 44%)(18%, 43%)
Best Response to Any Prior Therapy
CR / PRSD / PD / Unknown
25 / 83 (30%)5 / 26 (19%)
(21%, 41%)(7%, 39%)
Response to Most Recent Therapy
CR / PRSD / PD
Unknown
13 / 40 (32%)14 / 57 (25%)3 / 12 (25%)
(19%, 49%)(14%, 38%)(5%, 57%)
Prior Methotrexate
YesNo
5 / 21 (24%)25 / 88 (28%)
(8%, 47%)(19%, 39%)
O. A. O’Connor et al., JCO, 2011; 29(9): 1182-1189
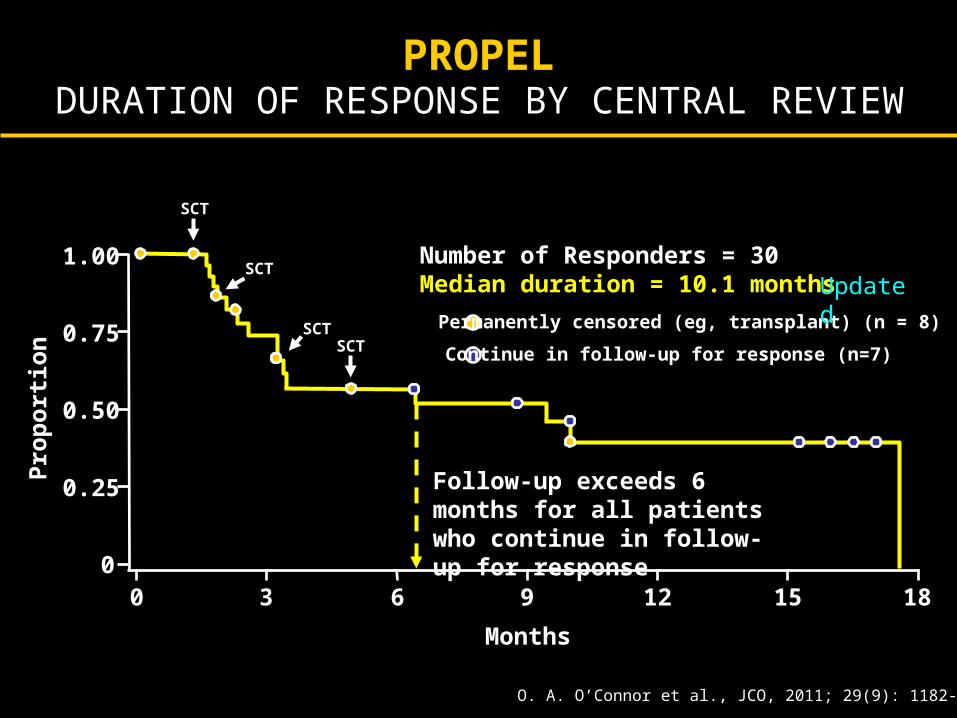
DURATION OF RESPONSE BY CENTRAL REVIEWPROPEL
1.00
0.75
0.50
0.25
00 3 6 9 12 15 18
Months
Pro
po
rtio
n
Number of Responders = 30Median duration = 10.1 months
Permanently censored (eg, transplant) (n = 8)
Continue in follow-up for response (n=7)
Follow-up exceeds 6 months for all patients who continue in follow-up for response
SCT
SCT
SCTSCT
O. A. O’Connor et al., JCO, 2011; 29(9): 1182-1189
Updated
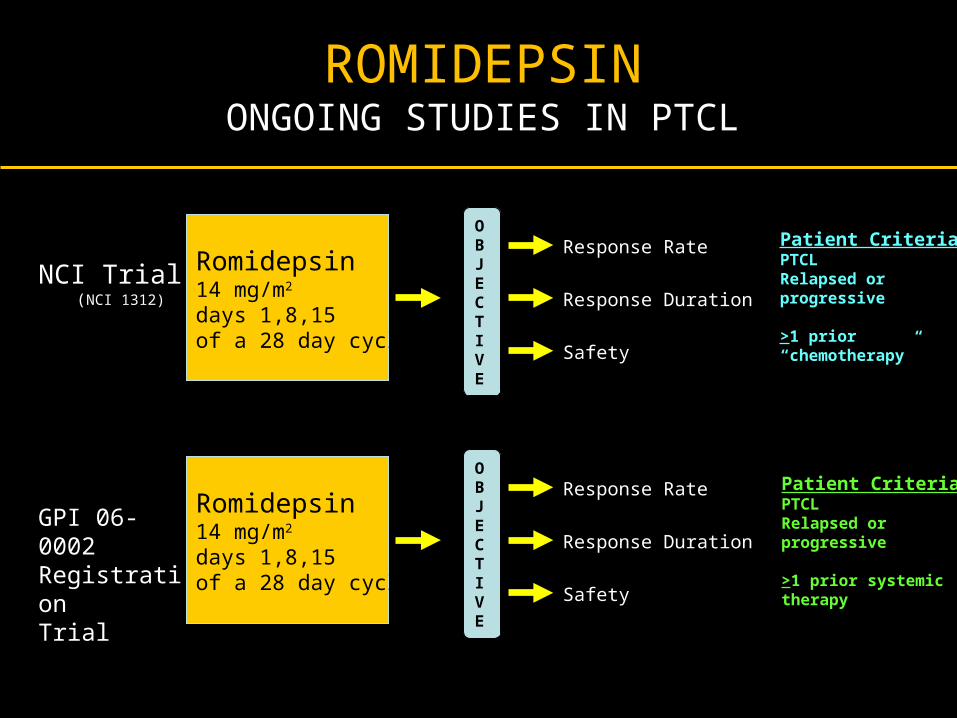
GPI 06-0002 RegistrationTrial
Romidepsin14 mg/m2
days 1,8,15of a 28 day cycle
OBJECTIVE
Response Rate
Response Duration
Safety
Patient Criteria:PTCLRelapsed orprogressive
>1 prior systemic therapy
NCI Trial (NCI 1312)
Romidepsin14 mg/m2
days 1,8,15of a 28 day cycle
OBJECTIVE
Response Rate
Response Duration
Safety
Patient Criteria:PTCLRelapsed orprogressive
>1 prior “chemotherapy”
ROMIDEPSINONGOING STUDIES IN PTCL

PHASE 2 ROMIDEPSIN IN PTCL
RESPONSE RATES
All Pts N=48
Pts ≥ 2 cycles**N=34
ORR (CR+PR), n (%) 15 (31%) 15 (44%)
CR*, n (%) 4 (8%) 4 (12%)
PR, n (%) 11 (23%) 11 (32%)
SD, n(%) 7 (15%) 7 (21%)
s Piekarz et al., Blood, 2011; 117(2):5827-5834
Overall Response Rates

PHASE 2 ROMIDEPSIN IN PTCL RESPONSE DATA
Duration of Response (DOR) &Time to Disease Progression (TTP)
Median time to first response was 1.8 (1-6) months
Population N*Median (range) DOR
in monthsMedian (range) TTP
in months
ORR (CR & PR) 15 9 (2 – 61+) 12 (4 – 63+)
CR 4 34 (3 – 61+) NR (14 – 63+)
PR 11 8 (2 – 41+) 10 (4 – 42+)
SD 7 – 9 (3 – 26+)
PD 19–
1.4 (.2– 4)
*7 patients were not evaluable; NR, median not yet reached; + denotes continuing responsePiekarz et al., Blood, 2011; 117(2):5827-5834

PHASE II TRIAL OF ROMIDEPSIN IN RELAPSED OR PROGRESSIVE PERIPHERAL T-CELL
LYMPHOMA FOLLOWING PRIOR SYSTEMIC THERAPY
• Patient population: – 131 enrolled– 130 with confirmed PTCL– Failed ≥ 1 prior systemic therapy
• Treatment regimen: romidepsin 14 mg/m2, days 1, 8, and 15 q 28 days × 6 cycles; continued beyond 6 cycles in responding patients at investigator and patient discretion
• Primary endpoint: CR/CRu by independent review• Secondary endpoints including: ORR, duration of response,
TTP, tolerability, and safety
Coiffier et al. JCO, 2012; Jan. 23 (epub ahead of print)

Peripheral T-Cell Lymphomas: How I Manage Frontline Disease
· Putting The T-cell Lymphomas in Context
· Defining ‘Standards of Care’ for Upfront Treatment (won’t take long)
· Newly Emerging Options for Advanced (R/R) Disease: Is combination the right way to go?
- Pralatrexate in Relapsed/Refractory PTCL
- Targeting the Epigenome in PTCL
- Targeting CD30+ T-cell Malignancies
· Conclusion
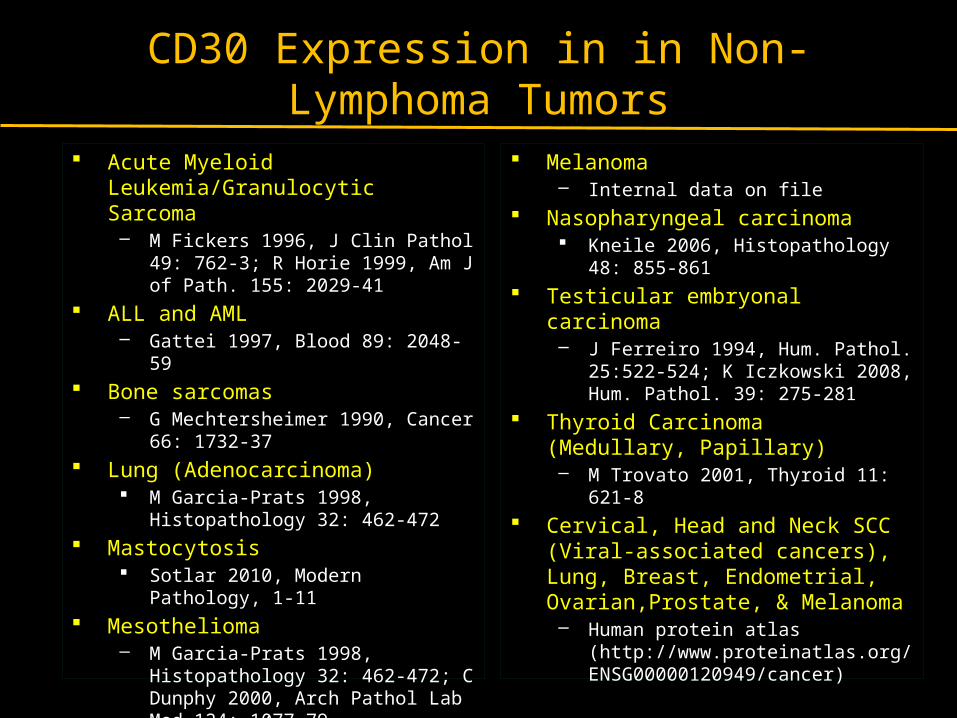
CD30 Expression in in Non-Lymphoma Tumors
Acute Myeloid Leukemia/Granulocytic Sarcoma– M Fickers 1996, J Clin Pathol 49: 762-
3; R Horie 1999, Am J of Path. 155: 2029-41
ALL and AML – Gattei 1997, Blood 89: 2048-59
Bone sarcomas – G Mechtersheimer 1990, Cancer 66:
1732-37 Lung (Adenocarcinoma)
M Garcia-Prats 1998, Histopathology 32: 462-472
Mastocytosis Sotlar 2010, Modern Pathology, 1-11
Mesothelioma– M Garcia-Prats 1998, Histopathology
32: 462-472; C Dunphy 2000, Arch Pathol Lab Med 124: 1077-79
Melanoma– Internal data on file
Nasopharyngeal carcinoma Kneile 2006, Histopathology 48: 855-
861 Testicular embryonal carcinoma
– J Ferreiro 1994, Hum. Pathol. 25:522-524; K Iczkowski 2008, Hum. Pathol. 39: 275-281
Thyroid Carcinoma (Medullary, Papillary)– M Trovato 2001, Thyroid 11: 621-8
Cervical, Head and Neck SCC (Viral-associated cancers), Lung, Breast, Endometrial, Ovarian,Prostate, & Melanoma– Human protein atlas
(http://www.proteinatlas.org/ENSG00000120949/cancer)

CD30 Expression in DLBCL
Citation CD30+ High CD30+
Stein et al., 1985 4% (2/45) 0% (0/45)
Norton et al., 1987 11% (3/28) 7% (2/28)
Hall et al., 1988 10% (6/60) 2% (1/60)
Schwarting et al., 1989 29% (35/121) 9% (11/121)*
Miettinen, 1992 38% (14/37) 11% (4/37)
Noorduyn et al., 1994 40% (36/91) 23% (21/91)
Eow et al., 2006 4% (3/67) 0% (0/67)
Total 22% (99/449) 9% (39/449)
Courtesy Dennis Weisberger, University of Nebraska

Anaplastic Large cell Lymphoma: A Unique Entity Among PTCL
• sALCL is a CD30-positive aggressive subtype of peripheral T-cell lymphoma
• 4065% of patients develop recurrent disease after initial multiagent chemotherapy1
• To improve OS, durable responses must be attained – few therapies available for this unmet need
1 Savage et al, 20082 Data provided by J. Connors, BC Cancer Agency
Sur
viva
l
Time (years)
Median = 3.3 monthsN = 61
Overall Survival After Failure of Primary Therapy2

BRENTUXIMAB VEDOTIN MECHANISM OF ACTION
Brentuximab vedotin (SGN-35) ADCmonomethyl auristatin E (MMAE), potent antimicrotubule agent
protease-cleavable linker
anti-CD30 monoclonal antibody
ADC binds to CD30
MMAE disruptsmicrotubule network
ADC-CD30 complex traffics to lysosome
MMAE is released
Apoptosis
G2/M cellcycle arrest
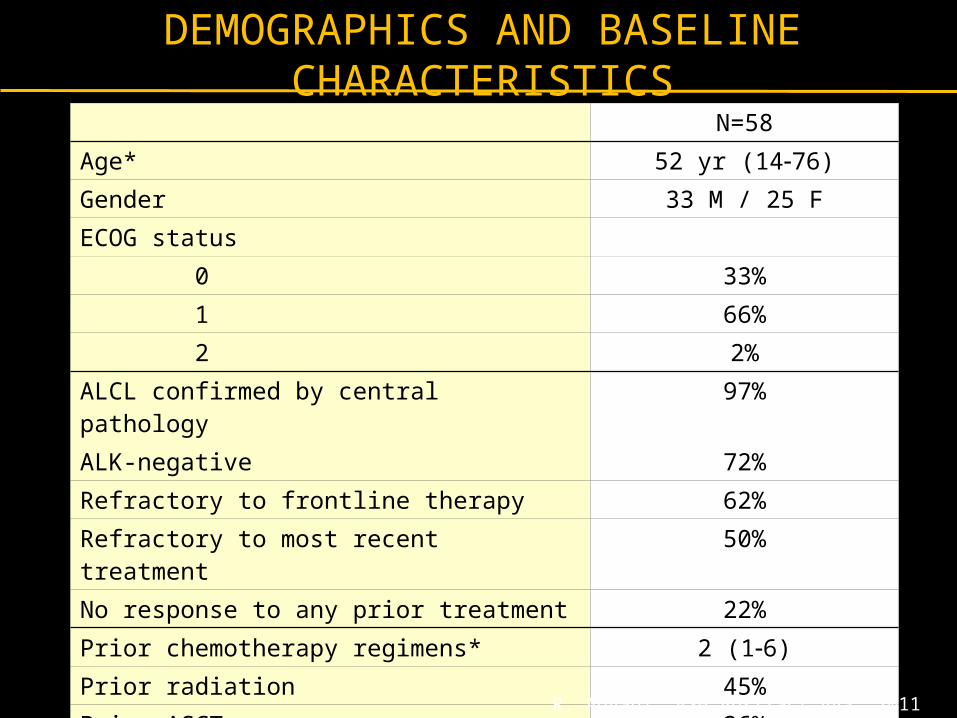
DEMOGRAPHICS AND BASELINE CHARACTERISTICS
N=58
Age* 52 yr (1476)
Gender 33 M / 25 F
ECOG status
0 33%
1 66%
2 2%
ALCL confirmed by central pathology 97%
ALK-negative 72%
Refractory to frontline therapy 62%
Refractory to most recent treatment 50%
No response to any prior treatment 22%
Prior chemotherapy regimens* 2 (16)
Prior radiation 45%
Prior ASCT 26%
* Median (range)
R. Advani, ASH Abstract 443, 2011

KEY RESPONSE RESULTS SUMMARY
N=58
Objective response rate (95% CI) 86% (75, 94)
Median duration of OR (95% CI) 12.6 mo (5.7, )
CR rate (95% CI) 57% (43, 70)
Median duration of response in patients with CR (95% CI)
13.2 mo (10.8, )
Median PFS (95% CI) 13.3 mo (6.9, )
Median OS Not reached
R. Advani, ASH Abstract 443, 2011

Maximum Tumor Reduction
97% of patients achieved tumor reduction
Individual Patients (n=57)
Tum
or S
ize
(% C
hang
e fr
om B
asel
ine)
Complete remission
R. Advani, ASH Abstract 443, 2011

PFS by Disease Response
Median PFS(months)
CR 14.6PR 4.2SD 2.7PD 1.2HI*
Time (months)
% P
atie
nts
Fre
e of
PD
or
Dea
th
* Histologically ineligible
R. Advani, ASH Abstract 443, 2011

PFS: Brentuximab Vedotin vs. Last Prior Therapy
91% of the most recent prior therapies were multiagent chemotherapy or ASCT
Time (months)
% P
atie
nts
Fre
e of
PD
or
Dea
th
* Investigator-assessed
PFS brentuximab vedotin*; median = 14.3 monthsPFS last prior therapy; median = 5.9 monthsHR=0.48 (p=0.001)
R. Advani, ASH Abstract 443, 2011

STRATEGIES TO IMPROVE UPFRONT THERAPY FOR PTCL
CHOP based
+ Etoposide- CHOEP, EPOCH
+ Alemtuzumab+ Pralatrexate+ anti CD4+ anti CXC4+ lenalidomide+ Brentuximab vendotin
Novel combinations
PEGS (cisplatin, etoposide, gemcitabine,
methylprednisolone)
Pralatrexate + Bortez + SAHA
Pralatrexate + Romidepsin
Novel targeted agents + monoclonal antibodies

Thank You

AUTOLOGOUS STEM CELL TRANSPLANTATION (AUTOSCT) AS FIRST-LINE THERAPY IN PERIPHERAL T-CELL
LYMPHOMAS (PTCL): IMPROVED OVERALL SURVIVAL WITH ASCT
Overall Survival(IPI: high/intermediate high vs. low/intermediate low)
0
0,2
0,4
0,6
0,8
1
0 12 24 36 48 60
Time (months)
IPI: high/intermediate high (n=42) IPI: low /intermediate low (n=41)
p= 0,1799p= 0,1799
Overall survival
IPI: high / interm.high vs. low / interm.low
high / interm.high (n= 42) low / interm.low (n= 41)
Overall Survival(Transplanted vs. non-transplanted)
0
0,2
0,4
0,6
0,8
1
0 12 24 36 48 60
Time (months)
non-transplanted (n=28) transplanted (n=55)
p< 0.001p< 0.001
Overall survival
Transplanted vs. non-transplanted
time (months)
transplanted (n= 55) non-transplanted (n= 28)
estimated 3-year OS: 71% vs. 11%
Reimer et al., 2009, JCO 27(1): 106-113

NLG-T-01: OS + PFS (Med follow-up 45 mos)Subtype Analysis
0.00
0.20
0.40
0.60
0.80
1.00
0 12 24 36 48 60 72analysis time
rhistdia = ptcl, nos rhistdia = aildrhistdia = alcl, alk neg
OS : ALCL, AIL, PTCL-NOS
0.00
0.20
0.40
0.60
0.80
1.00
0 12 24 36 48 60 72analysis timerhistdia = ptcl, nos rhistdia = aild
rhistdia = alcl, alk neg
PFS : ALCL, AIL, PTCL-NOS
OS PFSSubtype 3-yr 5-yr 3-yr 5-yrPTCLu (n=62) 51% 45% 43% 34%
AIL (n=30) 57% 50% 54% 47%
ALCL alk-neg (n=31) 77% 73% 64% 64%
Enteropathy (n=21) 52% 44% 47% 40%
d’Amore et al EHA 2009: abs.#53

PROPEL: PRIOR ICE
20/109 had previously received ICE-based regimen 2nd line
ORR to ICE-based regimens was 25% (3 CR, 2 PR)
Median duration on treatment for responders was <1 month
9/20 received an ICE-based regimen immediately before pralatrexate
Of those 9, 2 did not respond to the ICE-based regimen, but did respond to pralatrexate (1 CR, 1 PR)
Goy A, et al, Blood (ASH Annual Meeting Abstracts) 2010 116: Abstract 1753

PROPEL: PRIOR ICE (N=20)
• ORR (CR + PR): 40% • CR: 25% by Investigator Assessment• Median Duration of Response: 16.2 months by Investigator
Assessment
Efficacy AssessmentsCentral Review Assessment
(n=20), %Investigator Assessment
(n=20), %Tumor Response
ORR (CR+PR) 8 (40) 8 (40)
CR 5 (25) 3 (15)
PR 3 (15) 5 (25)
SD 5 (25) 2 (10)
PD 6 (30) 4 (20)
Not Evaluable 1 (5) 6 (30)
Median DoR 16.2 mths 13.1 mths
Goy A, et al, Blood (ASH Annual Meeting Abstracts) 2010 116: Abstract 1753