ozone depletion enhanced by volcanism is a primary … · 1 summary ozone depletion enhanced by...
TRANSCRIPT
1
Summary
Ozone depletion enhanced by volcanism is a primary cause of global warming Peter L. Ward
Earth is warmed predominantly by visible light from the sun, whereas Earth’s atmosphere is
warmed primarily by invisible, solar, ultraviolet radiation containing sufficient energy to cause
photodissociation of oxygen and ozone. When trace amounts of ozone are depleted, some
atmospheric warming is transferred to Earth. Global warming has been greatest in regions where
and when ozone depletion was greatest. Anthropogenic chlorofluorocarbons depleted ozone 3%
over thirty years while the 1991 eruption of Pinatubo volcano depleted ozone an additional 6%
within one year. Large explosive volcanic eruptions also form sulfuric-acid aerosols in the lower
stratosphere that reflect, scatter and absorb solar radiation, causing net cooling. But small, effusive,
basaltic eruptions deplete ozone substantially without forming significant aerosols, causing net
warming. Anthropogenic ozone depletion compounded by eruptions of Icelandic, basaltic volcanoes
Eyjafjallajökull (2010) and Grímsvötn (2011) depleted ozone 14% above Toronto, playing a major
role in abnormal warming and drought during 2011-2012.
2
Ozone depletion enhanced by volcanism is a primary cause of global warming Peter L. Ward
1
1 U.S. Geological Survey, retired, Teton Tectonics, P.O. Box 4875, Jackson, WY 83001, USA.
Greenhouse gas concentrations are essentially homogeneous around the globe and have been
increasing monotonically over many decades. Greenhouse-gas theory, therefore, cannot
explain well-observed decadal to yearly changes in climate within specific geographic regions
or more frequent changes in weather without appealing to short-term instabilities in oceanic
and atmospheric currents and many other complexities within the climate system. The
detailed links between gas concentrations and climate change and between climate change and
weather are not clear.
Earth is warmed fundamentally by radiant energy from the sun filtered by the
atmospheric ozone column, which can vary more than 10% within hours at mid-latitudes1 and
as much as 50% seasonally in polar regions. Global warming is well-observed to be greatest
when and where ozone depletion is greatest2,3
. Ozone depletion allows solar ultraviolet energy
that normally warms the stratosphere to penetrate toward Earth’s surface, cooling the
stratosphere, warming the troposphere and warming Earth. Anthropogenic
chlorofluorocarbons depleted total column ozone 3% over thirty years while the 1991
eruption of Pinatubo volcano depleted ozone an additional 6% within one year. Large
explosive volcanic eruptions also form sulfuric-acid aerosols in the lower stratosphere that
reflect, scatter, and absorb solar radiation, causing net cooling. But small, effusive, basaltic
eruptions deplete ozone substantially without forming significant aerosols, causing net
warming. Ozone records from Toronto, Canada, show that anthropogenic ozone depletion
compounded by eruptions of Icelandic, basaltic volcanoes Eyjafjallajökull in 2010 and
Grímsvötn in 2011 is contemporaneous with and a likely cause of abnormal warming and
drought during 2011-2012.
Most solar radiation passes through the atmosphere to heat Earth’s surface. Earth loses this heat by
conduction, evaporation, convection, and radiation as temperatures fall an average of 6.4°C for each
kilometer of increasing altitude throughout the troposphere (Fig. 1). The troposphere is thus heated
from below. The stratosphere, on the other hand, is heated from above primarily by solar ultraviolet
radiation containing sufficient energy to photodissociate molecular oxygen (O2) into two atomic
oxygen atoms (O) that recombine with O2 to form ozone (O3).
Photodissociation is the most effective way to convert electromagnetic radiation into
temperature because all of the oscillatory kinetic energy absorbed to break a molecular bond is
converted into translational kinetic energy of the two separating atoms or molecules and, according
to the kinetic theory of gases, the temperature of a gas is equal to the average translational kinetic
energy of all of its atoms and molecules times a constant. The minimum amount of energy required
to photodissociate O2 is nominally 5.11 eV (electronvolts). Since, according to Planck’s postulate,
energy (E) in an electromagnetic field equals Planck’s constant times the frequency of the radiation,
only solar radiation containing wavelengths (λ) less than 242.4 nm (nanometers) can provide
enough energy to photodissociate O2.
The highest-energy components of ultraviolet solar radiation are absorbed (filtered out) near
the top of the atmosphere. Lower and lower energy components are filtered out progressively closer
and closer to earth. The thermal structure of the atmosphere is a dynamic balance primarily between
the highest energy solar radiation to penetrate to a given altitude, i.e. the amount of energy that one
molecule can absorb, the concentration of molecules that can absorb it, and the rapid increase in
3
density (black line, Fig. 1, logarithmic scale), i.e. the number of molecules whose translational
kinetic energy must be increased to raise the temperature. Modern chemical-transport climate
models include more than 45 photodissociation reactions and more than 100 gas-phase chemical
reactions4, but the most important for warming center around nitrogen, making up 78% of the
volume of the atmosphere, oxygen (21%), and ozone (<0.0015%). The very small amounts of ozone
are important because the photodissociation of ozone and its recombination are catalytic processes
that typically occur over and over, converting electromagnetic energy into temperature while not
necessarily changing the amount of ozone.
The small amount of solar radiation in the extreme ultraviolet (λ<124 nm, E>10.0 eV) is
absorbed above an altitude of ~85 km primarily through photoionization of N2, O2, and NO. CO2 is
photodissociated when λ<167 nm (E>7.4 eV); SO2 when λ<200 nm (E>6.2 eV).
The greatest heating of the Earth/atmosphere system occurs all day, every day at the
stratopause near 50 km altitude where the temperature is maintained typically 55oC warmer than the
temperature at the tropopause. The stratopause if formed at an altitude where there are sufficient O2
molecules at sufficiently low enough atmospheric densities being dissociated by sufficiently
energetic ultraviolet radiation to cause the maximum increase in temperature. At decreasing
altitudes in the stratosphere, lower and lower energy radiation is still available, so that even though
there are rapidly increasing numbers of atoms and molecules, their mean translational velocities
decrease, limiting the temperature increase.
The tropopause is the boundary between the troposphere heated from below and the
stratosphere heated from above. It also forms a boundary between low ozone mixing ratios in the
troposphere and high ozone mixing ratios in the stratosphere especially between 14 and 32 km (Fig.
1). The troposphere contains <10% of total column ozone1. The average height of the tropopause
varies from 16.6 km near the equator where solar radiation is most intense to 9 km near the poles5.
Annual mean heights increased ~160 m between 1980 and 2004 while the lower stratosphere cooled
~2oC, the upper troposphere warmed
5 ~0.1
oC and mean surface temperatures in the northern
hemisphere6 rose ~0.5
oC.
But the tropopause is a very dynamic boundary. On June 19, 2004, for example, the height of
the tropopause above Montreal, Canada, dropped from 13.5 km to 8.5 km in 5 hours at the same
time that total column ozone increased 20% (70 DU, Dobson Units)1. “From the time of Dobson's
early measurements” in the 1920s, “it has been known that the total ozone amount undergoes large
day-to-day fluctuations”7 in the mid to high latitudes where the Brewer-Dobson circulation brings
stratospheric ozone formed mostly in the tropics down into the lower stratosphere and upper
troposphere. Averages of these large changes are now mapped daily throughout the world as
observed from satellites and ground stations8 (Fig. S5 in the Supplementary Information).
Early observations similarly showed “that there is a strong correlation between column ozone
and meteorological conditions”1,7
including atmospheric and surface temperatures and the resulting
depth and location of surface pressure highs and lows. These meteorological conditions have
traditionally been assumed to cause ozone variations. But ozone depletion allowing more high-
energy ultraviolet solar radiation into the lower stratosphere and troposphere and associated
exothermic photodissociation provides a clear mechanism to heat the atmosphere differentially
across small regions and over timescales of hours to days having a direct impact on weather
systems. Long-term changes in ozone are thus highly likely to have a major impact on climate.
The narrow band for photodissociation
The spectrum of radiation available from an overhead sun that normally reaches a given altitude is
shown by actinic flux (AF) in Fig. 2. Absorption by the ozone layer is essentially the difference in
actinic flux at 40 and 15 km (dashed red and solid purple lines respectively in Figs. 1 and 2).
4
Tropospheric warming due to photodissociation is confined to a very narrow bandwidth (red shaded
area) sandwiched between the very rapidly increasing availability of solar energy with wavelengths
>290 nm (red dotted and purple lines) and the rapidly increasing absorptivity of ozone at
wavelengths <340 nm (black line).
A 30% decrease in total column ozone will increase UV radiation at Earth’s surface 1.02 W
m-2
for overhead Sun and 0.276 W m-2
for a solar zenith angle of 70o (red shaded area)
9. These
changes in energy flux, when integrated over Earth’s surface, have the potential to explain at least
some and possibly most of the observed warming believed caused by changes of <1 W m-2
in the
total energy budget of Earth’s atmosphere10
.
The primary exothermic photochemical process in the lower stratosphere and down into the
troposphere is the photodissociation of O3 to form O2 plus an excited oxygen atom, O(1D), for
λ<310 nm (E>4.0 eV). Quantum yields (fraction of molecules dissociated) as large as 0.08 have
been observed for λ=330 nm11
. Matsumi et al.11
find that “photodissociation from vibrationally
excited ozone contributes approximately 25 to 40% to the overall production rate for solar zenith
angles from 40o to 80
o respectively.” Note the increase as ray paths lengthen toward the poles.
Longer wavelengths (463-1180 nm) throughout the range of visible light into the near infrared
have sufficient energy to photodissociate ozone into O2 plus the ground state oxygen atom O(3P)
that reacts with O2 to form ozone again11
. The net amount of ozone does not change, but this
catalytic reaction continually converts radiant energy into higher velocities of the molecules,
increasing temperature. Photodissociation of nitrogen dioxide (NO2) can similarly produce O(3P)
for λ<397.8 nm but with quantum yields >0.1 for λ<~411 nm12
. Note in Fig. 2 the sudden decrease
in actinic flux at all levels for λ<~411 nm.
Ozone depletion increases the amount of high-energy ultraviolet radiation reaching the lower
troposphere to cause photodissociation of O3 and NO2, to be absorbed by SO2, and to be absorbed at
Earth’s surface. On land, much of the energy absorbed during the day is radiated back into the
atmosphere at night. At sea, however, ultraviolet radiation penetrates the ocean to depths >10
meters13
and is thus more effective at heating the ocean than infrared radiation absorbed near the
surface where much of the energy is lost back into the atmosphere at night. The effect of this UV on
surface temperatures could be small, while its effect on increasing ocean heat content could be
substantial.
Regions and times of greatest warming
The greatest warming observed on Earth between 1976 and 2005, according to the
Intergovernmental Panel on Climate Change, was during June through August around the Western
Antarctica Peninsula2 and during December through February in North America, northern Europe
and northwestern Russia3, the times and locations of greatest ozone depletion where there is still
sufficient solar flux to cause warming. At Faraday/Vernadsky station on the Antarctic Peninsula
(65.4oS) increases in temperature are strongly correlated with decreases in total column ozone
14.
Minimum monthly temperatures increased 6.7oC from 1951 to 2003
14, the greatest warming of this
region in more than 1800 years15
. Maximum monthly temperatures and ozone levels changed very
little during summer months while summer surface temperatures of the Bellingshausen Sea rose
1oC
16. Winter sea ice decreased 10% per decade and shortened in seasonal duration
17; 87% of
marine glaciers in this region retreated, many collapsing into the ocean following the loss of seven
very large ice shelves18
. The Circumpolar Deep Water of the Antarctic Circumpolar Current
warmed17
. Warming of interior Antarctica was slowed by the high mean albedo (~0.86) of Antarctic
snow, nearly twice the albedo of Arctic snow19
, and by the increase in solar zenith angle (decrease
in solar flux) approaching South Pole.
5
In the Arctic, ozone depletion in early 2011 was unprecedented, exceeding 80% at altitudes of
18-20 km, comparable for the first time with the Antarctic ozone hole20
. The extent of Arctic sea
ice, declining at >11% per decade since 197921
, reached a record low on September 16, 2012, nearly
50% lower than the average extent between 1979 and 200022
. The estimated maximum extent of
seasonally frozen ground in the northern hemisphere23
has decreased ~7% from 1901 to 2002, with
the largest changes since 1980.
The greatest global warming observed has been in the regions and at the times of the greatest
ozone depletion.
Ozone depletion observed over time
The longest continuous measurements of total column ozone have been made since 1927 at
Arosa, Switzerland (black line, Fig. 3). The dashed gray line with blue data markers shows from
1964 to 2009 the annual mean area-weighted total ozone deviation from the 1964-1980 means for
northern mid-latitudes (30oN-60
oN) scaled from -8% at the bottom of the figure to 10% at the top
24.
Years of increasing or decreasing ozone are nearly identical at Arosa and for this area-weighted
mean with small differences in amplitude. Thus the Arosa data provide a reasonable approximation
for ozone changes throughout northern mid-latitudes since 1927.
Total column ozone at Arosa averaged around 331 DU until 1974, fell 9.4% to 300 DU by
1993 and began generally rising again until 2011. The long-term decrease in ozone has been
reliably associated with an increase in concentrations of anthropogenic chlorine (green line, y-axis
inverted) through chlorine catalyzed destruction of ozone25
. The resulting Montreal Protocol on
Substances That Deplete the Ozone Layer was signed beginning in 1987, leading to phasing out the
production of chlorofluorocarbons and hydrochlorofluorocarbons and a decrease in tropospheric
chlorine beginning in 1993. Long-term ozone concentrations are expected to return to late-1970’s
levels by 204025
.
The largest short-term peak in annual mean total column ozone shown in Fig. 3 occurred in
1940-1941, possibly related in some way to the onset of World War II. Large peaks in ozone also
occur during years containing the three largest atmospheric nuclear tests labeled in black with yield
in megatons. There is a peak in 1998 during one of the largest El Niños in history but no obvious
peak in 1982-1983 during an El Niño with a comparably large multivariate ENSO index26
, although
the latter observation may have been complicated by the eruption of El Chichón in 1982. But the
most consistent short-term changes in ozone in Fig. 3 are an apparent increase in ozone during the
year of a volcanic eruption followed by a much larger depletion during the next few years.
The major effects of volcanism on ozone
The largest eruption since 1912 was in 1991 from Pinatubo with a VEI (logarithmic Volcano
Explosivity Index) of 6. An even larger ozone anomaly in 2010 is associated with the 100-times
smaller basaltic fissure eruption of Eyjafjallajökull in Iceland (VEI=4). A slightly larger VEI=4
eruption of Grímsvötn, 140 km northeast of Eyjafjallajökull, occurred in May, 2011, compounding
the amount of ozone depletion during 2011-2012. The amplitudes of these short-term ozone
anomalies since 1990 are larger than the amplitudes of earlier volcanic anomalies before the global
rise in tropospheric chlorine (green line, y-axis inverted). Anomalies appear associated with the
eruption of Hekla in Iceland (1970, VEI=3) and with the larger eruptions of El Chichón in Mexico
(1982, VEI=5 and 4+) and Agung in Bali (1963, VEI=5 and 4). Mt. St. Helens in Washington state
(1980, VEI=5) had little effect on global temperature or ozone most likely because the main
eruption was a blast of steam triggered by a landslide on the intruding volcanic plug27
. The increase
in ozone during the year of each major eruption is discussed in the Supplementary Information.
6
Depletion of stratospheric ozone during years following a volcanic eruption has been
observed widely especially related to Pinatubo28,29
. By January-April, 1993, total column ozone was
11 to 17% below preceding years throughout Canada with a peak loss of 30% at ~16 km30
. On
average, total ozone decreased 8% in Europe, 5-6% in North America, Russia, and Asia but <2% in
the tropics29
. Following Agung and El Chichón, the deceases were 5%, 2-3%, and <2% in these
same regions. Following Pinatubo, lower tropospheric warming of up to 3oC during the winter was
observed throughout the more northerly parts of the northern continents31
, the parts with greater
depletion of ozone. Related major changes in atmospheric chemistry are well documented by a 45%
drop in total column NO2 above Switzerland beginning five months after the Pinatubo eruption and
returning to normal with an e-folding time of two years32
, a 40% decrease in NO2 column observed
above New Zealand33
, and substantial increases in HNO3 concentrations due to heterogeneous
conversion of N2O534
.
The observed ozone depletion (black line, Fig. 3) was accompanied by cooling of the
stratosphere (purple line) occurring mostly “as two downward ‘steps’ coincident with the cessation
of transient warming after the major volcanic eruptions of El Chichón and Mount Pinatubo”35
and a
similar downward step following the 1963 eruption of Agung volcano36
.
Ozone depletion following volcanic eruptions has traditionally been explained by new
aerosols formed in the lower stratosphere providing substantial new surfaces for heterogeneous
chemical reactions to form ozone-destroying chlorine at cold temperatures37
. Yet water vapor
(H2O), the most voluminous gas erupted from volcanoes, is the primary source of OH radicals that
catalytically destroy ozone in the stratosphere34,38
. Volcanoes also erupt megatons of halogens34
,
primarily chlorine and bromine39
and only one halogen molecule can destroy >100,000 molecules
of ozone40
. During explosive eruptions, many of these halogens appear to be removed immediately
from the eruptive cloud in condensed supercooled water41
. But effusive, basaltic eruptions such as
Eyjafjallajökull and Grímsvötn do not form significant eruption columns that remove halogens and
that create aerosols in the stratosphere. They typically involve 10-100 times more volatiles per cubic
kilometer of magma than explosive eruptions caused by more chemically evolved magmas42
. Ozone
depletion is substantial within the plumes of erupting volcanoes; detailed observations imply that
“the most likely cause for the observed rapid and sustained O3 loss to be catalytic reactions with
halogen, mainly bromine, radicals”43
. Recent field observations have shown that even the plumes of
quiescently degassing volcanoes are chemically very active containing halogens that modeling
shows cause ozone depletion44
.
Volcanic eruptions are typically followed a year later by ~6% depletion of ozone averaged
throughout the year (Fig. 3). How do these short-term effects of volcanism compare to the longer-
term effects of anthropogenic chlorofluorocarbons? The green line for chlorine is inverted and has
been scaled so that the increase in anthropogenic tropospheric chlorine from 1965 to 1993 has
approximately the same rate of change as the corresponding long-term decrease in ozone as
expected by current theory. This visual fit suggests that depletion of ozone following the Pinatubo
eruption (~20 DU) was twice as large as the depletion due to chlorofluorocarbons since 1960 (~10
DU) and that it takes more than a decade for ozone concentrations to return to pre-eruption levels.
Large, explosive volcanic eruptions are well known to form sulfuric acid aerosols in the lower
stratosphere that reflect, scatter, and absorb solar radiation, causing cooling at Earth’s surface of
~0.5oC over three years. These explosive eruptions also deplete ozone causing warming that lasts 3
to 5 times longer than the aerosols, but the cooling effects of the aerosol predominate. The much
less explosive and much more numerous basaltic effusive eruptions such as Eyjafjallajökull and
Grímsvötn as well as quiescently degassing volcanoes44
do not form significant aerosols in the
lower stratosphere so that ozone depletion and related warming are dominant.
7
Warming and drought in 2011-2012 The blue line in Fig. 4a shows the average monthly total column ozone measured above Toronto,
Canada, averaged for the years 1961 through 1970 when anthropogenic tropospheric chlorine had
only increased 16% from levels in 1925 towards peak levels in 1994 (green line, Fig. 3). The green
line in Fig. 4a shows average monthly column ozone for 2009 when anthropogenic chlorine had
decreased 9% from its peak value. Note that ozone depletion is greatest between December and
May, the months of greatest warming in the northern hemisphere3. According to theory, the mean
change in radiative forcing between the 1960s and 2009 caused by ozone depletion should be
directly proportional to the area between the blue and green lines.
The solid red line includes both the increase in ozone during February preceding the first
eruption of Eyjafjallajökull in March, 2010, discussed in the Supplementary Information, and
subsequent depletion. The dashed red line shows total ozone in 2011 including depletion due to
Eyjafjallajökull and increases and decreases related to the eruption of Grímsvötn. The double red
line shows ozone levels in 2012. Note that since November 2011, the times when monthly
maximum temperature records have been set throughout central North America45
, ozone has been
depleted as much as 14% below mean values in the 1960s.
The dashed black line in Fig. 4b shows the average for each year of the monthly mean total
column ozone above Toronto averaged over four consecutive months from December through
April; the dashed red line (y-axis inverted) shows the same average for monthly mean minimum
temperatures. The solid lines are the same data smoothed using a 3-month symmetric running mean.
A substantial decrease in ozone is typically but not always associated with an increase in minimum
temperature except in 1992-1995 when aerosols in the lower stratosphere following the June, 1991,
eruption of Pinatubo decreased radiation from the Sun as much as 2.7±1.0 W m-2
during August and
September decaying exponentially to negligible values by 199546
. Note the extremely low ozone
and high temperature in early 2012 (circled data points, lower right).
These data suggest that depletion of ozone due to the eruption of Eyjafjallajökull in 2010 and
Grímsvötn in 2011 supplemented anthropogenic depletion leading to extreme ozone depletion and
the resulting extreme temperatures and drought observed throughout central North America during
late 2011 and 2012 and the highest sea surface temperatures ever recorded on the continental shelf
off the northeastern United States during the first half of 201247
. The drought of 2012 approached
the intensity of the great Dust Bowl droughts of 1934 and 1936 when a highly unusual sequence of
seven VEI 4 and 5 eruptions occurred from 1931 through 1933 in Indonesia, Japan, Kurile Islands,
Kamchatka, Alaskan, Guatemala, and Chile48
.
Recent warming and drought might have been enhanced by the fact that November, 2011, had
the largest number of sunspots per month since October, 200249
, and ultraviolet insolation increases
four to six times more than broadband irradiance during solar cycles50
. In 1933 and 1934, however,
the numbers of sunspots per month were relatively low until late in 1936.
Photodissociation is required for warming
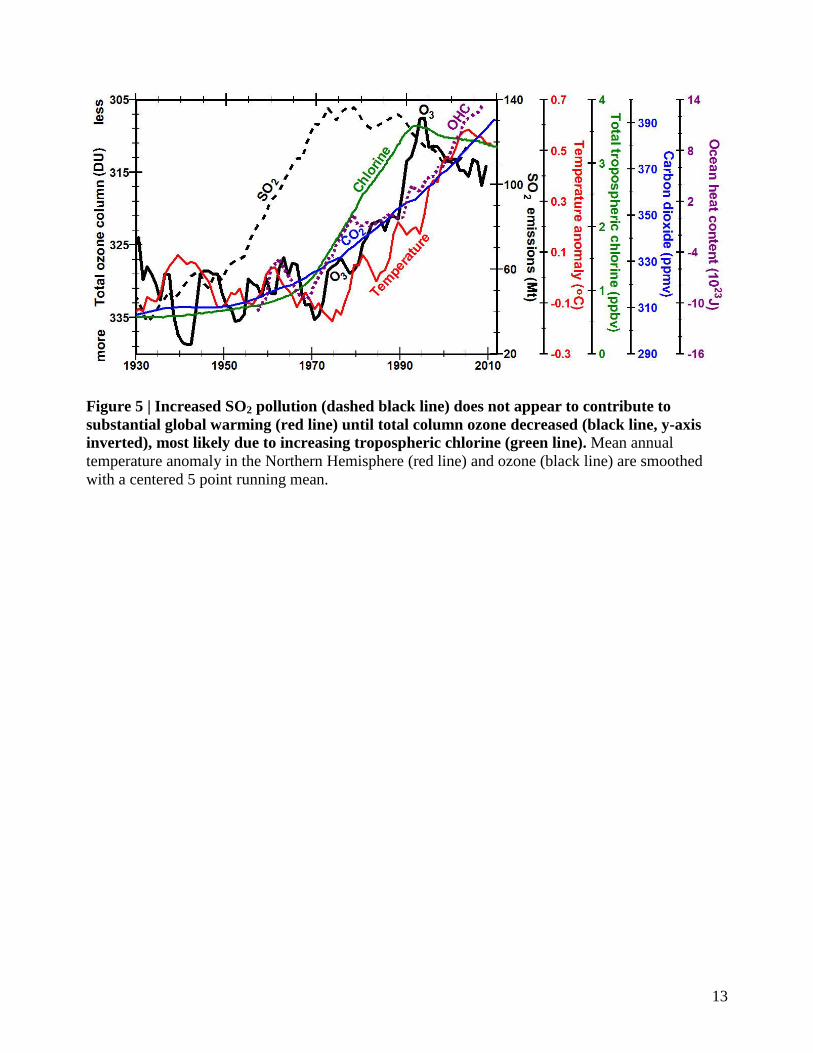
Annual mean surface temperatures in the northern hemisphere (red line, Fig. 5) increased during the
1930s, cooled during the 1940s, remained relatively constant until 1975, rose rapidly until 1998
with a net temperature increase of ~0.8oC, and have remained relatively constant until 2011
51,52.
Total tropospheric chlorine caused by anthropogenic chlorofluorocarbons (green line)
increased rapidly from 1970, reached a peak in 1993 due to implementation of the Montreal
Protocol and continues to decline slowly.
Annual mean total column ozone (O3, black line, y-axis inverted) fell rapidly from 1971 to
1995 and has been recovering slowly until the volcanic eruptions in 2010 and 2011. A slight delay
after changes in chlorine concentration is expected since most ozone is formed above the tropics
8
and moves slowly via Brewer-Dobson circulation to high latitudes where most ozone destruction
occurs during winter associated with polar stratospheric clouds.
The primary time delay in the atmospheric system involves the heat capacity of the ocean
covering 71% of Earth. The observation in Fig. 5 that ocean surface temperature rose ~5 years after
the decrease in ozone is in the range of calculations by Hansen et al.53
for a 3.5-year e-folding time
for warming the ocean if the equilibrium temperature of Earth suddenly increased a small amount
and a 10-year e-folding time taking into account an ocean with a 100-meter-thick mixed-layer.
World ocean heat content (dashed purple line) increased from 1970 to 1980, remained
relatively constant until 1990, and has been increasing ever since. The time relationship between
ocean heat content, volcanism, and annual total ozone is shown more clearly by the dashed red line
in Fig. 3 where the ozone data have not been smoothed. The slow change in ocean heat content
between 1980 and 1990, smoothed with a 5-year running mean, reflects the observed global cooling
of up to 0.5oC for up to three years following the eruptions of El Chichón (1982) and Pinatubo
(1991)54
. Continued rise of ocean heat content since 1998 is expected since column ozone has
remained depleted.
The annual rate of increase in concentrations of CO2 (blue line) was <0.1 ppm/yr from 1938
to 1947 but began increasing to 0.7 ppm/yr by 1960 as concentrations of SO2 and other
anthropogenic pollutants (Fig. S3) were rapidly increasing. From 1976, when ocean heat content
began increasing, the annual rate of increase of CO2 doubled and even quadrupled to between 1.3
and 2.7 ppm/yr most likely due to decreasing CO2 solubility in a warming ocean. Annual CO2
concentrations increased with industrialization and with ocean temperature, but slowed during the
three years following major volcanic eruptions even though CO2 was the second most voluminous
gas erupted after water vapor.
SO2 emissions (dashed black line), 88% from burning fossil fuels, rose rapidly from 1950
until 1973 when concern over acid rain led to the addition of smokestack-scrubbers and other
emission controls, as well as substitution of North Sea oil for coal in Europe. The result was a 20%
decrease in SO2 emissions by 2002. Similar increases were observed in NOX, methane, and black
carbon accompanied by a decrease and then increase in surface solar radiation (Fig. S3).
SO2 and related pollution increased ~30 years before the major increase in temperature
suggesting that major increases in anthropogenic pollution did not affect global temperatures until
ozone was depleted. Thus absorption without photodissociation does not appear to cause substantial
global warming. Similarly, the observation that the lowest temperatures in the stratosphere are near
the base of the ozone layer where ozone concentrations are highest (Fig. 1) implies that simple
absorption by ozone is less important for warming the stratosphere than absorption that leads to
photodissociation.
What about greenhouse gases?
Concentrations of CO2 increased monotonically at an accelerating rate since 1998, while mean
global temperatures remained relatively constant51,52
. The sensitivity of climate to a doubling of
carbon dioxide has not been observed directly in nature nor in the laboratory but has been estimated
by assuming temperature increases over specific time intervals resulted primarily from absorption
by greenhouse gases. Yet photodissociation and ozone depletion clearly contribute to warming and
absorption without photodissociation may not cause much warming. There are several issues
explained in the Supplementary Information that need to be evaluated in the laboratory and in the
field before we can determine quantitatively the relative importance of greenhouse gases:
1. Molecules of greenhouse gases are well documented to absorb radiant energy along spectral
lines that correspond to combinations of the resonant frequencies of the gas molecule’s chemical
bonds and rotational degrees of freedom (Figs. S1 and S2). This means that oscillatory kinetic
9
energy in the radiation field is absorbed as oscillatory kinetic energy within each molecule. But
temperature of a gas is proportional to translational kinetic energy. What proportion of the
oscillatory kinetic energy is converted to translational kinetic energy during the numerous
collisions of gas molecules in the atmosphere?
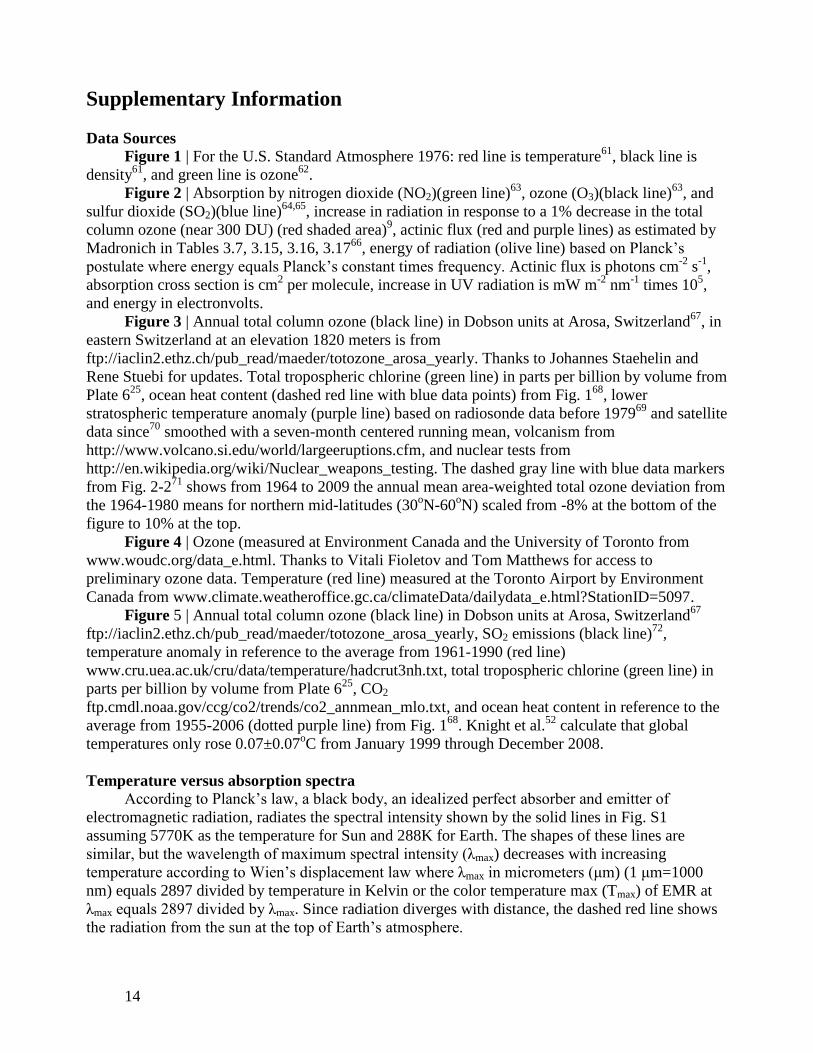
2. An incandescent light bulb emits a broad spectrum of radiation described by Planck’s law for
black-body radiation (blue line, Fig. S1) and is perceived as being hot. A fluorescent light bulb
emits radiation over very narrow parts of the visible spectrum (black line, Fig. S1) and is
perceived as being cool. Over how broad a spectrum does a layer of molecules dispersed in a
gas radiate? Is a layer of gas properly described as a black body?
3. Heat in matter flows from warm to cool. If radiation is absorbed via resonance, which it appears
to be, heat flows from higher spectral intensity in the radiation field to lower spectral intensity
within the molecule. While radiation propagates in all directions, absorption may only occur
from higher to lower spectral amplitude; otherwise the radiation is reflected. Our bodies absorb
radiant heat, but we do not perceptively absorb radiant cold; instead we lose body heat more
efficiently into a cold environment. We sense an ice cube by touch and the flow of heat from our
body to the ice cube.
High-resolution paleoclimatic studies in the Late Miocene55
and the existence of glaciation in
Devonian and Permian-Triassic times when CO2 concentrations were >10 and >5 times
preindustrial values respectively56
question prevailing thoughts that increased concentrations of CO2
cause global warming. Similarly the width of the tropical belt widened 2o to 5
o in latitude since
197957
. While expansion in the Southern Hemisphere has been attributed to ozone depletion58
, Allen
et al.59
, use the Community Atmosphere Model to suggest that “recent Northern Hemisphere
tropical expansion is driven mainly by black carbon and tropospheric ozone, with greenhouse gases
playing a smaller part.”
Periods of sudden global warming are contemporaneous with major increases in volcanism at
the end of the last ice age (Fig. S4), during 13 Dansgaard-Oeschger sudden warming events in the
past 46,000 years, during the opening of the North Atlantic in the Early Eocene, and during the 12
largest mass extinctions over the past 360 million years60
explained in more detail in the
Supplementary Information.
Discussion
The temperature of Earth’s surface is a very delicate and dynamic balance between solar energy
received at the surface and thermal energy flowing away from the surface, but the tropopause forms
the physical boundary between the troposphere heated from below by a sun-warmed Earth and the
stratosphere heated from above. The height of the tropopause can vary by kilometers within hours
and is closely related by observations and theory to total column ozone. More ozone absorbs more
solar ultraviolet energy in the stratosphere, warming the stratosphere, lowering the height of the
tropopause, and cooling earth. Less ozone allows more ultraviolet energy to reach Earth, cooling the
stratosphere, raising the height of the tropopause, and warming Earth. Total column ozone is
depleted primarily by chemically active forms of chlorine and bromine emitted by man and by
volcanic eruptions. Trace amounts of ozone are so effective because ozone is photodissociated by
ultraviolet and visible radiation in cyclic processes that efficiently convert oscillatory energy in
radiation into translational kinetic energy (temperature) in the atmosphere. The greatest warming at
Earth’s surface is in the places and at times of greatest ozone depletion. Widespread observations
show the importance of these processes qualitatively. A quantitative proof will only be possible
when climate models are adapted to include the many issues raised in this paper and listed at the
end of the Supplementary Information.
10
Supplementary Information is available in the online version of the paper.
Acknowledgments All data plotted in this paper are available on Internet as described in the
Supplementary Information. Thanks to Huiming Bao, James Bjorken, Terrance Gerlach, Peter
Giles, Zach Hall, William Happer, Bertram Raynes, and Adrienne Ward for critical comments and
to Michael MacCracken and Peter Molnar for critical reviews of many drafts.
Author Information Reprints and permissions information is available at
www.nature.com/reprints. The authors declare no competing financial interests. Readers are
welcome to comment on the online version of the paper. Correspondence and requests for materials
should be addressed to P.L.W. ([email protected]).
Figure Captions
11
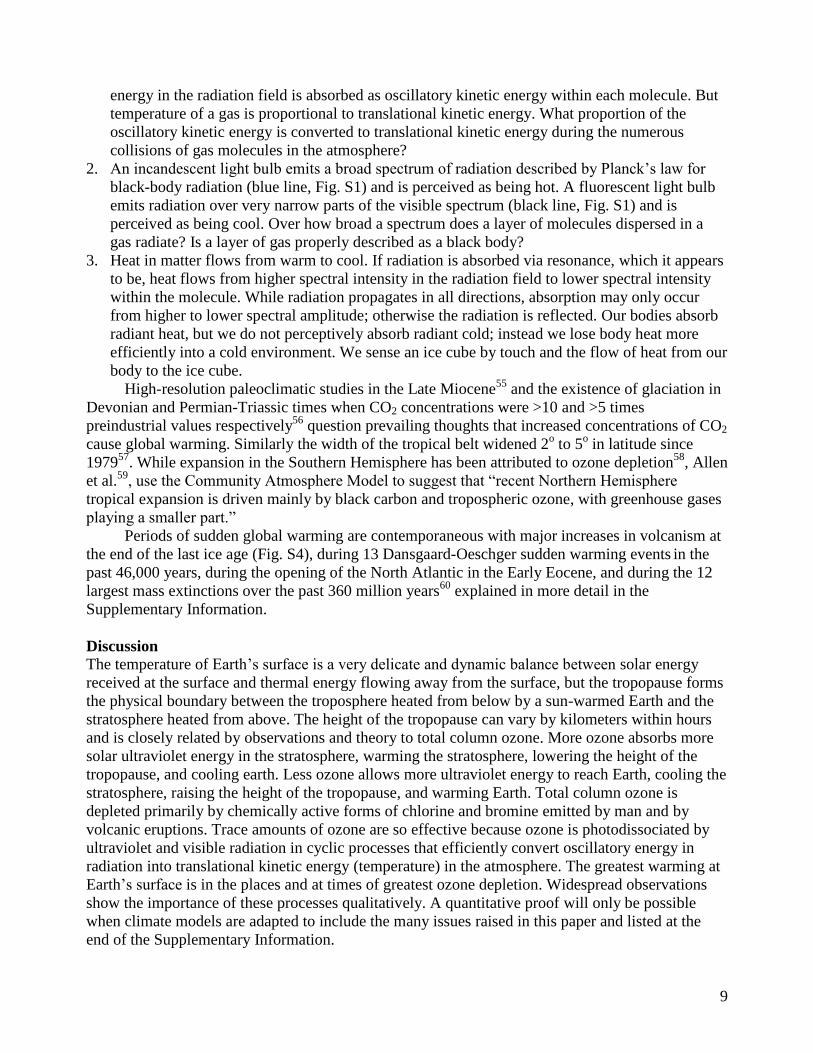
Figure 1 | The greatest warming in the atmosphere is between 35 and 60 km while the greatest
concentrations of ozone are between 14 and 32 km. The profiles shown are for the U.S. Standard
Atmosphere 1976. Actual profiles vary primarily with latitude, time of day, season and amount of
ozone depletion. The dashed and dotted red lines and solid purple line correspond to altitudes of
actinic flux calculations in Fig. 2. The sources and units for all data plotted in all figures are listed in
the Supplementary Information available in the online version of the paper.
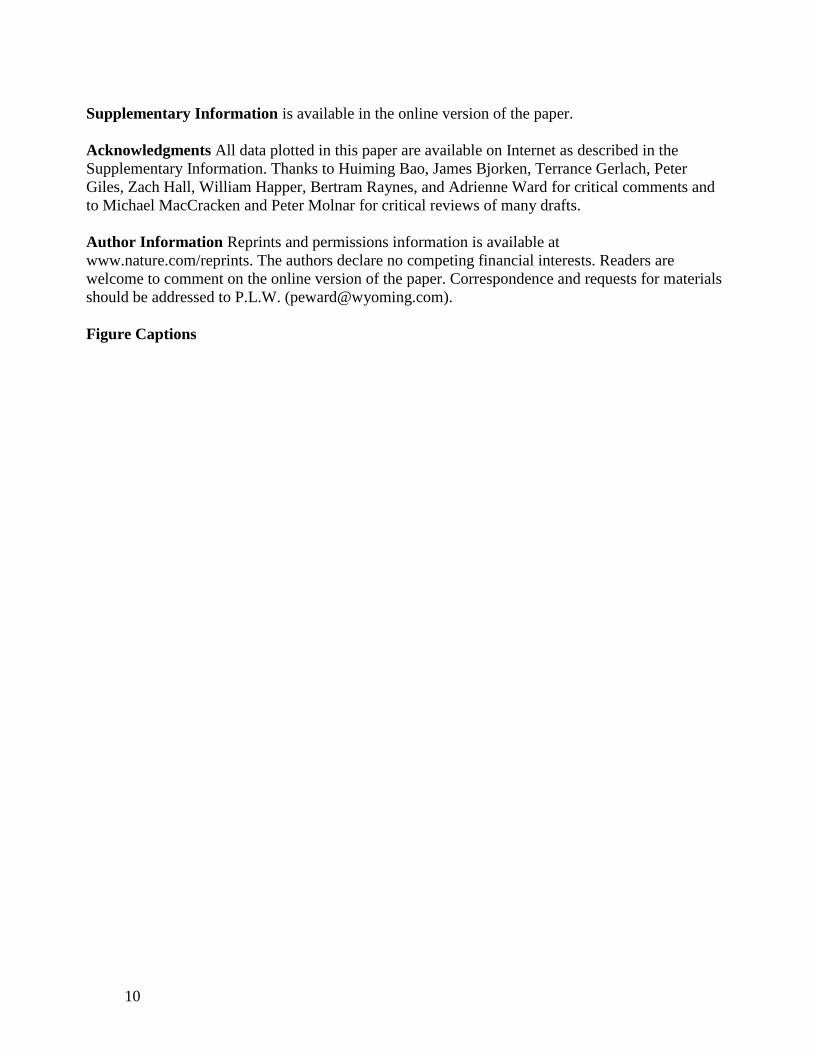
Figure 2 | A 30% decrease in total column ozone increases ultraviolet radiation reaching
Earth’s surface by ~1.02 W m-2
between 290 and 340 nm (red shaded area) when Sun is directly
overhead9. O3, SO2, and NO2 absorb solar energy strongly at wavelengths <400 nm. Absorption by
O3 and NO2 typically leads to photodissociation for wavelengths <411 nm.
12
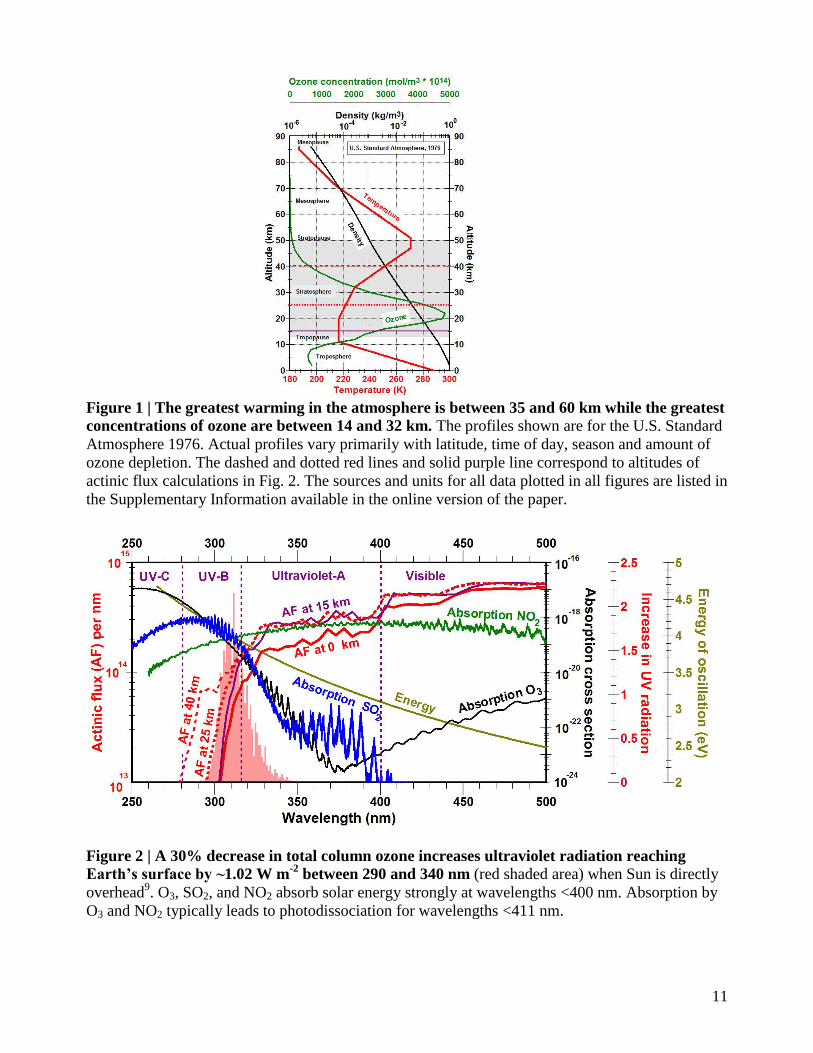
Figure 3 | Total column ozone (black line) peaks during years with major volcanic eruptions
and then drops precipitously by more than twice as much during the following year causing a
cooling in the lower stratosphere (purple line). The ozone data were measured at Arosa,
Switzerland. The names of the erupting volcanoes and the Volcano Explosivity Index (VEI) for
each large eruption are labeled in red. The green line shows annual mean tropospheric chlorine with
the y-axis inverted. The dashed red line with the y-axis inverted shows the increase of ocean heat
content.
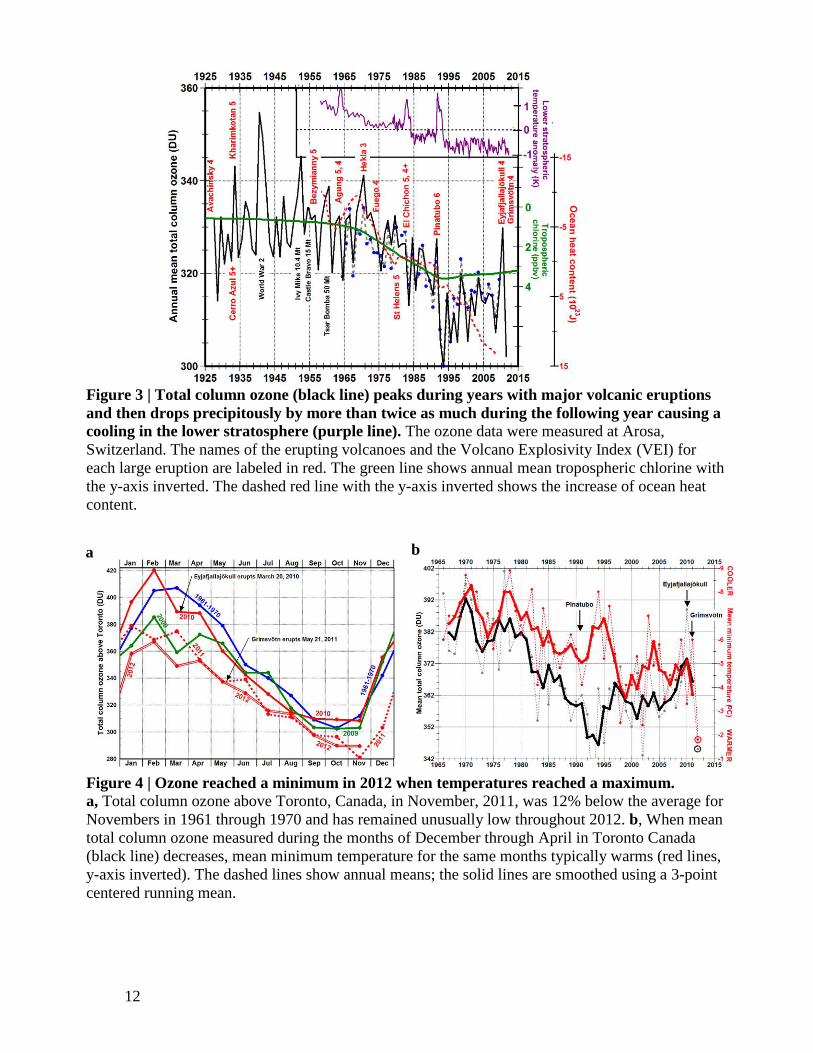
Figure 4 | Ozone reached a minimum in 2012 when temperatures reached a maximum.
a, Total column ozone above Toronto, Canada, in November, 2011, was 12% below the average for
Novembers in 1961 through 1970 and has remained unusually low throughout 2012. b, When mean
total column ozone measured during the months of December through April in Toronto Canada
(black line) decreases, mean minimum temperature for the same months typically warms (red lines,
y-axis inverted). The dashed lines show annual means; the solid lines are smoothed using a 3-point
centered running mean.
a b
13
Figure 5 | Increased SO2 pollution (dashed black line) does not appear to contribute to
substantial global warming (red line) until total column ozone decreased (black line, y-axis
inverted), most likely due to increasing tropospheric chlorine (green line). Mean annual
temperature anomaly in the Northern Hemisphere (red line) and ozone (black line) are smoothed
with a centered 5 point running mean.
14
Supplementary Information
Data Sources
Figure 1 | For the U.S. Standard Atmosphere 1976: red line is temperature61
, black line is
density61
, and green line is ozone62
.
Figure 2 | Absorption by nitrogen dioxide (NO2)(green line)63
, ozone (O3)(black line)63
, and
sulfur dioxide (SO2)(blue line)64,65
, increase in radiation in response to a 1% decrease in the total
column ozone (near 300 DU) (red shaded area)9, actinic flux (red and purple lines) as estimated by
Madronich in Tables 3.7, 3.15, 3.16, 3.1766
, energy of radiation (olive line) based on Planck’s
postulate where energy equals Planck’s constant times frequency. Actinic flux is photons cm-2
s-1
,
absorption cross section is cm2 per molecule, increase in UV radiation is mW m
-2 nm
-1 times 10
5,
and energy in electronvolts.
Figure 3 | Annual total column ozone (black line) in Dobson units at Arosa, Switzerland67
, in
eastern Switzerland at an elevation 1820 meters is from
ftp://iaclin2.ethz.ch/pub_read/maeder/totozone_arosa_yearly. Thanks to Johannes Staehelin and
Rene Stuebi for updates. Total tropospheric chlorine (green line) in parts per billion by volume from
Plate 625
, ocean heat content (dashed red line with blue data points) from Fig. 168
, lower
stratospheric temperature anomaly (purple line) based on radiosonde data before 197969
and satellite
data since70
smoothed with a seven-month centered running mean, volcanism from
http://www.volcano.si.edu/world/largeeruptions.cfm, and nuclear tests from
http://en.wikipedia.org/wiki/Nuclear_weapons_testing. The dashed gray line with blue data markers
from Fig. 2-271
shows from 1964 to 2009 the annual mean area-weighted total ozone deviation from
the 1964-1980 means for northern mid-latitudes (30oN-60
oN) scaled from -8% at the bottom of the
figure to 10% at the top.
Figure 4 | Ozone (measured at Environment Canada and the University of Toronto from
www.woudc.org/data_e.html. Thanks to Vitali Fioletov and Tom Matthews for access to
preliminary ozone data. Temperature (red line) measured at the Toronto Airport by Environment
Canada from www.climate.weatheroffice.gc.ca/climateData/dailydata_e.html?StationID=5097.
Figure 5 | Annual total column ozone (black line) in Dobson units at Arosa, Switzerland67
ftp://iaclin2.ethz.ch/pub_read/maeder/totozone_arosa_yearly, SO2 emissions (black line)72
,
temperature anomaly in reference to the average from 1961-1990 (red line)
www.cru.uea.ac.uk/cru/data/temperature/hadcrut3nh.txt, total tropospheric chlorine (green line) in
parts per billion by volume from Plate 625
, CO2
ftp.cmdl.noaa.gov/ccg/co2/trends/co2_annmean_mlo.txt, and ocean heat content in reference to the
average from 1955-2006 (dotted purple line) from Fig. 168
. Knight et al.52
calculate that global
temperatures only rose 0.07±0.07oC from January 1999 through December 2008.
Temperature versus absorption spectra
According to Planck’s law, a black body, an idealized perfect absorber and emitter of
electromagnetic radiation, radiates the spectral intensity shown by the solid lines in Fig. S1
assuming 5770K as the temperature for Sun and 288K for Earth. The shapes of these lines are
similar, but the wavelength of maximum spectral intensity (λmax) decreases with increasing
temperature according to Wien’s displacement law where λmax in micrometers (μm) (1 μm=1000
nm) equals 2897 divided by temperature in Kelvin or the color temperature max (Tmax) of EMR at
λmax equals 2897 divided by λmax. Since radiation diverges with distance, the dashed red line shows
the radiation from the sun at the top of Earth’s atmosphere.
15
Figure S1 | The spectral radiance from a black body such as an incandescent light bulb (blue
line, 2700K) is over a broad spectrum, while the radiance from a fluorescent light bulb (black
line on top of the rainbow of visible light) is confined to very narrow parts of the visible
spectrum. The incandescent light bulb has perceptible heat, the fluorescent bulb does not.
Absorption by greenhouse gases shown in the lower part is also confined to very narrow spectral
bands73
.
The blue curve shows the spectrum radiated by a typical incandescent light bulb where the
temperature of the tungsten filament is 2700K thermally isolated from the bulb by a partial vacuum.
Note how little of the energy radiated is in the visible spectrum (rainbow colors from violet to red,
0.380-0.750 μm). Most energy is in the infrared and this is what we perceive as temperature (heat).
The radiation from a typical fluorescent lamp with rare-earth phosphor is shown by the black line
overlying the visible spectrum74
. The y-scale for intensity is not scaled to the spectral radiance.
Ultraviolet light generated inside the lamp tube causes the terbium, mercury, and europium coating
on the glass tube to fluoresce especially strongly at 0.5424, 0.5465 and 0.6116 μm respectively
emitting almost all the radiation within the visible spectral band accompanied by very little heat.
This is why fluorescent bulbs produce much more visible light using much less energy than
incandescent bulbs and why they do not get as hot. The three spectral peaks have color temperatures
of 5341K, 5301K, and 4737K respectively but this is really not temperature as we perceive it. We
can think of it as microscopic color temperature representing the frequency of the microscopic
oscillation of the terbium, mercury, and europium molecules, but there is no warmth without the
broad spectrum of infrared radiation.
Greenhouse gases similarly absorb narrow spectral ranges of radiation from Earth and Sun
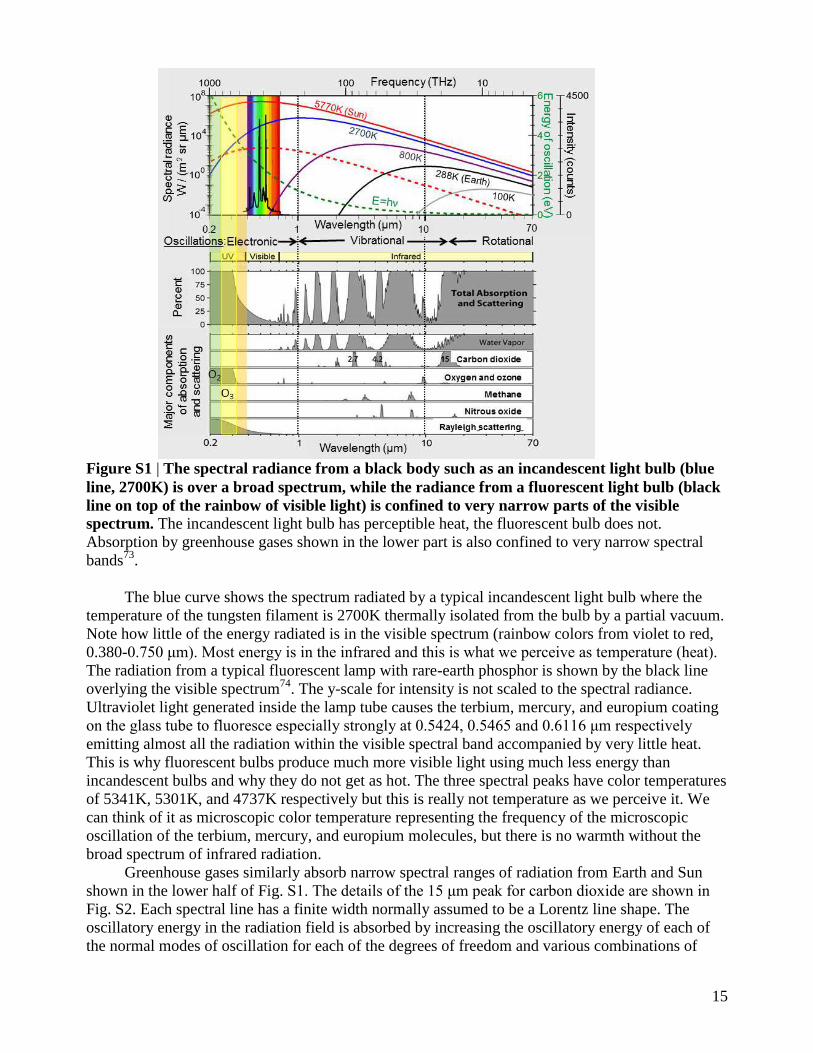
shown in the lower half of Fig. S1. The details of the 15 μm peak for carbon dioxide are shown in
Fig. S2. Each spectral line has a finite width normally assumed to be a Lorentz line shape. The
oscillatory energy in the radiation field is absorbed by increasing the oscillatory energy of each of
the normal modes of oscillation for each of the degrees of freedom and various combinations of
16
different degrees of freedom of each absorbing molecule. This oscillatory energy in gas molecules
is not perceptible as heat (temperature) until it is converted into translational kinetic energy
averaged among all the other gas molecules by the billions of collisions per second that occur in
gases near Earth’s surface. The efficiency of this conversion is not clear, but by the classical law of
equipartition, only some oscillatory energy would be converted. The total amount of energy
involved is small compared to the broadband radiation spectrum from Earth.
Figure S2 | Absorption of infrared electromagnetic radiation by CO2 is very selective along
spectral lines.
The very narrow spectral lines of absorption imply high-Q resonance such that the oscillatory
electromagnetic energy transferred from the field to the molecule at each resonant frequency is
equal to one-half the difference between the intensity (spectral radiance) in the field at the resonant
frequency and the intensity in the molecule at the same frequency. This means that oscillatory
energy (microscopic heat) only flows from higher intensity to lower intensity so as to equalize
intensities. When substantial mass “bakes” in sunlight, such as a rock in the desert, the shorter
wavelength, higher microscopic color temperature energy must be absorbed by the rock but then
heat flows within the rock to raise the temperature of the rock over a wide spectrum such as plotted
in the top part of Fig. S1. Thus it does not seem appropriate to assume, as most radiation codes do,
that radiation from layers in the atmosphere that are cooler than Earth’s surface is absorbed at
Earth’s surface.
The green shaded band in Fig. S1 shows wavelengths less than 0.242 μm that dissociate
molecular oxygen (O2). The yellow band shows wavelengths between 0.242 μm and 0.310 μm that
dissociate ozone (O3). The orange band shows wavelengths between 0.310 μm and visible light
(0.380 μm) that can dissociate O3 and NO2 at lower quantum yield. The dashed green line shows
Planck’s postulate (E=hν). Note how the energy of solar radiation absorbed by a molecule of ozone
at a wavelength of 0.310 μm (4.3 eV) is 52 times greater than the energy at 15.0 μm (0.0827 eV)
absorbed by a molecule of CO2 and that all of the energy absorbed to sever the O3 molecular bond is
converted by photodissociation directly into translational kinetic energy (temperature of a gas)
while only a fraction of the energy absorbed by CO2 is converted to temperature through collisions.
Relative timing of pollution
Mean surface temperatures (red line in Fig. S3) increased during the 1930s, cooled during the
1940s, remained relatively constant until 1975, rose rapidly until 1998, and remained relatively
17
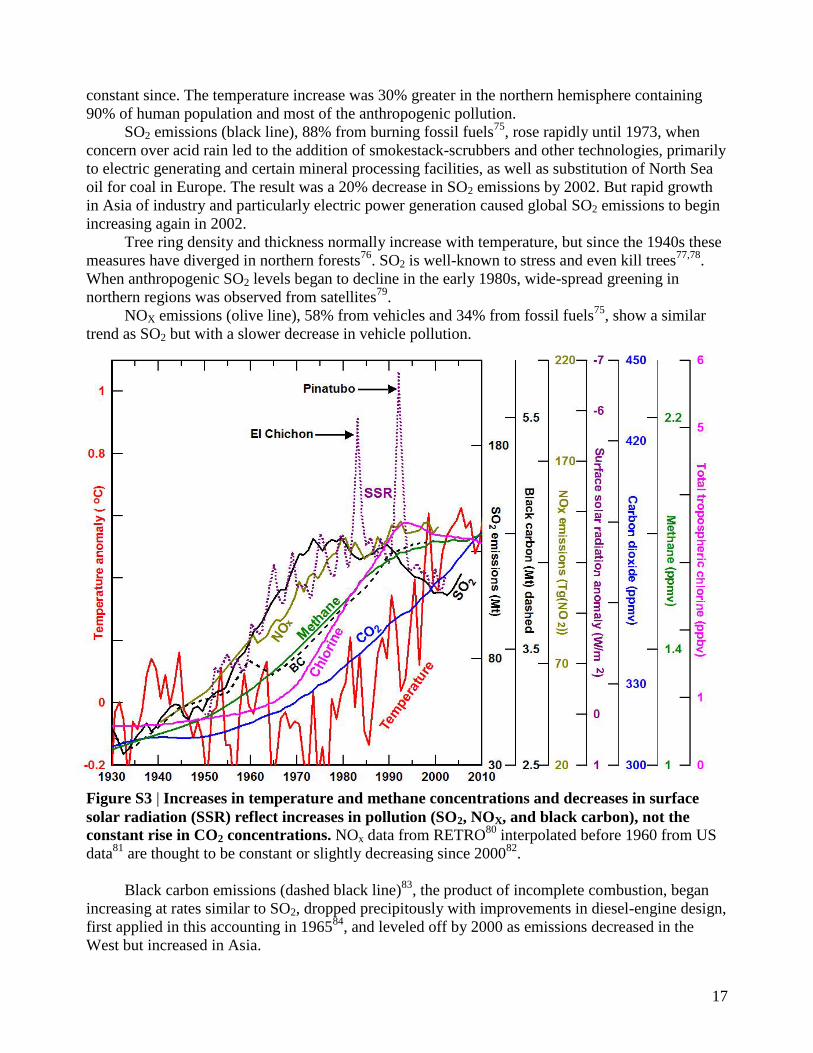
constant since. The temperature increase was 30% greater in the northern hemisphere containing
90% of human population and most of the anthropogenic pollution.
SO2 emissions (black line), 88% from burning fossil fuels75
, rose rapidly until 1973, when
concern over acid rain led to the addition of smokestack-scrubbers and other technologies, primarily
to electric generating and certain mineral processing facilities, as well as substitution of North Sea
oil for coal in Europe. The result was a 20% decrease in SO2 emissions by 2002. But rapid growth
in Asia of industry and particularly electric power generation caused global SO2 emissions to begin
increasing again in 2002.
Tree ring density and thickness normally increase with temperature, but since the 1940s these
measures have diverged in northern forests76
. SO2 is well-known to stress and even kill trees77,78
.
When anthropogenic SO2 levels began to decline in the early 1980s, wide-spread greening in
northern regions was observed from satellites79
.
NOX emissions (olive line), 58% from vehicles and 34% from fossil fuels75
, show a similar
trend as SO2 but with a slower decrease in vehicle pollution.
Figure S3 | Increases in temperature and methane concentrations and decreases in surface
solar radiation (SSR) reflect increases in pollution (SO2, NOX, and black carbon), not the
constant rise in CO2 concentrations. NOx data from RETRO80
interpolated before 1960 from US
data81
are thought to be constant or slightly decreasing since 200082
.
Black carbon emissions (dashed black line)83
, the product of incomplete combustion, began
increasing at rates similar to SO2, dropped precipitously with improvements in diesel-engine design,
first applied in this accounting in 196584
, and leveled off by 2000 as emissions decreased in the
West but increased in Asia.

18
Methane concentrations (green line)85-87
increased gradually with emissions of other
pollutants, reached a relatively constant rate of increase of ~14 ppb/year from 1955 to 1992, stopped
increasing by 2006 and began increasing again at a rate of ~6 ppb/year in 200785,86
. The lifetime of
methane is ~12 years, partially explaining the time lag. Methane concentrations are increased by
fossil fuel use88
, biomass burning, certain types of agriculture89
, and thawing of permafrost.
Methane is removed from the atmosphere when oxidized by OH. Observed changes in OH
concentrations may explain much of the observed changes in methane.
OH concentrations increase with increasing NOX, tropospheric O3, and sunlight, and decrease
with increasing SO2, CO, methane, and other pollutants it oxidizes. Global concentrations of OH are
difficult to observe and model and are affected by many factors, but modeling suggests they have
decreased 9% since preindustrial times90
. CH2O data from Greenland suggest OH concentrations
may have decreased by as much as 30%91
. Detailed observations show a gradual decrease from
1980 to 200092
.
CO in the northern hemisphere increased 0.85%/year from 1950 to 198793
, decreased very
slightly from 1988 (when detailed measurements began) to 2001, and increased slightly to 200594
.
Concentrations of water vapor and ozone in the lowermost stratosphere increased until 2000
but began decreasing suddenly in 200195,96
when emissions of SO2 stopped declining and began to
increase again.
Total tropospheric chlorine caused by anthropogenic chlorofluorocarbons (fuchsia line)
increased rapidly after 1970 but reached a peak in 1993 due to implementation of the Montreal
Protocol and is expected to return to late-1970s levels by 204025
.
Annual total column ozone at Arosa, Switzerland (green line, y-axis reversed, Fig. 5), fell
rapidly from 1970 to 1994 as a result of the rise in chlorine, and has been increasing until the
eruption of Eyjafjallajökull67
.
The purple dotted line (y-axis reversed) shows simulated annual clear-sky surface solar
radiation (SSR) anomalies for mid-latitudes in the northern hemisphere97
. SSR decreased with
increasing SO2 and related pollution and increased with decreasing pollution. SSR decreased rapidly
in East Asia after 2000 in phase with dramatic local increases in SO2 and BC emissions98
. Note the
rapid decreases in SSR for ~3 years following the large volcanic eruptions of El Chichón and
Pinatubo.
Yearly CO2 concentrations rose monotonically (blue line, Fig. 5 and S3)99,100
. Climate models
that assume CO2 is the primary driver of temperature increase have overestimated global warming
since 1998101,102
and are probably overestimating warming in future decades.
Increases in all these types of pollution did not raise global temperatures until chlorine
(fuchsia line) increased, depleting total column ozone (green line, Fig. 5).
Volcanism is a primary driver of climate change
Layers of ice beneath Summit Greenland that contain the largest concentrations of volcanic
sulfate per century (red line, Fig. S4)103
also contain δ18
O evidence104
for the most rapid global
warming (green line) during the Bolling warming (B), decreasing during the cooler Younger Dryas
(Y), and increasing again during the Preboreal warming (P). Volcanic sulfate is total sulfate minus
the small contributions from sea salt and dust based on sodium and calcium content105
. Volcanic
sulfate forms through oxidation of SO2 emitted by volcanoes. The rapid increase in “volcanic”
sulfate during the 20th
century primarily results from anthropogenic emissions of SO2 (Fig. 5 and
S3) from northern Russia, northern Europe, and central North America106
.
This temporal association of SO2 emissions with warming over the past 25,000 years is
unambiguous. Sulfate and the δ18
O proxy for temperature are measured in the same ice layers so
there is little error in relative timing. Peak sulfate per century during peak warming (2028 ppb) is
19
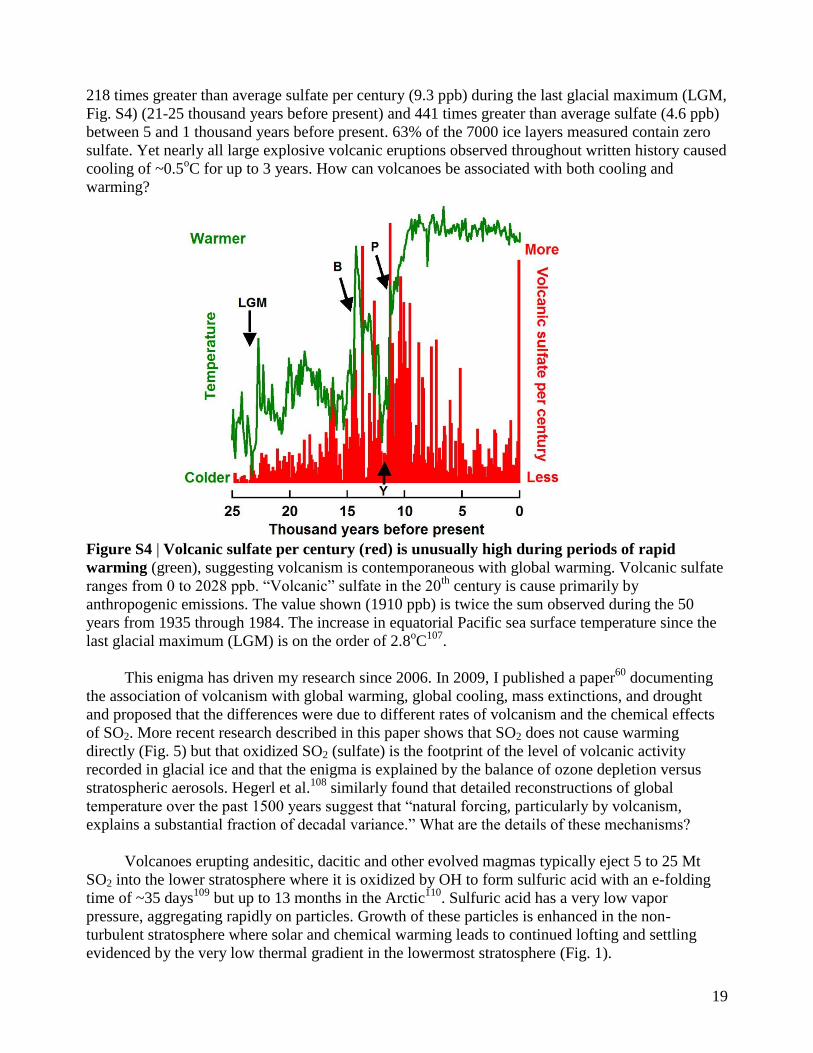
218 times greater than average sulfate per century (9.3 ppb) during the last glacial maximum (LGM,
Fig. S4) (21-25 thousand years before present) and 441 times greater than average sulfate (4.6 ppb)
between 5 and 1 thousand years before present. 63% of the 7000 ice layers measured contain zero
sulfate. Yet nearly all large explosive volcanic eruptions observed throughout written history caused
cooling of ~0.5oC for up to 3 years. How can volcanoes be associated with both cooling and
warming?
Figure S4 | Volcanic sulfate per century (red) is unusually high during periods of rapid
warming (green), suggesting volcanism is contemporaneous with global warming. Volcanic sulfate
ranges from 0 to 2028 ppb. “Volcanic” sulfate in the 20th
century is cause primarily by
anthropogenic emissions. The value shown (1910 ppb) is twice the sum observed during the 50
years from 1935 through 1984. The increase in equatorial Pacific sea surface temperature since the
last glacial maximum (LGM) is on the order of 2.8oC
107.
This enigma has driven my research since 2006. In 2009, I published a paper60
documenting
the association of volcanism with global warming, global cooling, mass extinctions, and drought
and proposed that the differences were due to different rates of volcanism and the chemical effects
of SO2. More recent research described in this paper shows that SO2 does not cause warming
directly (Fig. 5) but that oxidized SO2 (sulfate) is the footprint of the level of volcanic activity
recorded in glacial ice and that the enigma is explained by the balance of ozone depletion versus
stratospheric aerosols. Hegerl et al.108
similarly found that detailed reconstructions of global
temperature over the past 1500 years suggest that “natural forcing, particularly by volcanism,
explains a substantial fraction of decadal variance.” What are the details of these mechanisms?
Volcanoes erupting andesitic, dacitic and other evolved magmas typically eject 5 to 25 Mt
SO2 into the lower stratosphere where it is oxidized by OH to form sulfuric acid with an e-folding
time of ~35 days109
but up to 13 months in the Arctic110
. Sulfuric acid has a very low vapor
pressure, aggregating rapidly on particles. Growth of these particles is enhanced in the non-
turbulent stratosphere where solar and chemical warming leads to continued lofting and settling
evidenced by the very low thermal gradient in the lowermost stratosphere (Fig. 1).
20
Several months after the 1991 eruption of Pinatubo, particle sizes were typically 300 to 500
nm, reflecting, Mie scattering, and absorbing sunlight, warming the stratosphere 2-3oC within 4-5
months (purple line, Fig. 3), and cooling Earth up to 0.5oC for three years
111. These stratospheric
aerosols decreased average total solar irradiance at Earth’s surface by less than 1%112
. Modeling
shows that such cooling may have affected ocean temperatures for more than 100 years following
the VEI=6 eruption of Krakatoa in 1883113
and that cooling can accumulate over many eruptions114
incrementing the globe into an ice age when rates of major explosive volcanism are 5 to 10 times
more active than throughout written history60
. SO2 is widely assumed to have the same cooling
effect in the troposphere, but this seems highly unlikely. With an e-folding time of 35 days to be
oxidized, SO2 is spread around the world and replenished continuously by anthropogenic
emissions115,116
. Furthermore the particle sizes cannot grow large enough to reflect significant
amounts of sunlight due to turbulence except possibly by circulation in certain types of clouds.
These large volcanic eruptions also deplete total column ozone for up to a decade, but the
absorption, reflection and scattering of sunlight by the aerosols is more dominant for the first few
years except during northern winters where and when ozone depletion is greatest. Temperatures
over large parts of continents in the northern hemisphere, increase by as much as 3oC during the two
winters following the 1991 eruption of Pinatubo31
.
Volcanoes on oceanic islands such as Iceland and Hawaii, erupt more primitive basaltic
magmas, extrude cubic kilometers of lava flows on the surface, display impressive lava fountains
often along kilometers of linear vents, emit megatons of SO2 and halogens such as chlorine,
bromine, and fluorine, but rarely eject these gases into the stratosphere. Global warming
predominates because ozone depletion is substantial and cooling by aerosols is minimal.
Warming was clearly observed during the ten eruptive phases of the basaltic fissure volcano
Laki (Lakagigar) in South Iceland from June 8, 1783 until February 7, 1784117
, the largest basaltic
lava flow in written history except for the eruption of nearby Eldgjá in 934 A.D. Laki ejected ~24
Mt of SO2 into the lower stratosphere where it most likely spread eastward and northward
ultimately providing cooling. Pinatubo only erupted ~17 Mt SO2, but Laki ejected an additional ~96
Mt SO2 into the troposphere where the jet stream carried much of it southeastward to Europe.
Severe acid damage to vegetation from Iceland to Eastern Europe, to Italy suggests concentrations
of SO2 could have been as high as 1,000 ppb117
, roughly three orders of magnitude larger than
background. A “dry fog” blanketed much of Europe primarily from June 14 through August. “Many
people experienced troublesome headaches, respiratory difficulties, and asthma attacks”117
. SO2 is
invisible but when absorbing ultraviolet radiation, the electronic transitions cause fluorescence in
the visible spectrum explaining this “dry fog”. In July, surface temperatures increased as much as
3.3oC above the 30-year mean centered on 1783, the highest temperatures recorded from the first
measurements in 1659 until 1983117,118
. There was not time for significant amounts of aerosol to
form in the stratosphere nor for ozone to be depleted by chlorine released through heterogeneous
processes. But the eruption did release ~7 Mt of hydrochloric acid and ~15 Mt of hydrofluoric
acid119
that could have caused rapid depletion of ozone.
The Laki eruption deposited ~115 ppb sulfate in snow at Summit Greenland103
. During the
major Preboreal warming (P in Fig. S4) (11,700-9,800 years before present), sulfate per century in
this ice was as much as 2028 ppb, 18 times more than from Laki. Laki-type activity continuing for
these 1900 years appears to have played a major role in finally warming the oceans out of the last
ice age. Basaltic volcanism under ice leads to long, flat-topped, steep-sided table mountains or tuyas
found throughout Iceland. “12 of the 13 dated table mountains experienced their final eruptive
phase during the last deglaciation”120
.
Volcanism was similarly highest during the other 13 Dansgaard-Oeschger sudden warmings
between 46,000 and 11,600 years before present when tropical sea-surface temperatures rose ~3oC
21
in a decade or two and then decreased back to ice-age temperatures over decades to centuries as
volcanism waned before the deep ocean could be warmed60,121,122
.
The Late Paleocene thermal maximum (54.18-53.90 Ma, million years before present) is
contemporaneous with the massive sub-aerial volcanism during the opening of the North Atlantic
Ocean123
.
Laki extruded 12.3 km3 of lava flowing over an area of 565 km
2. Every 25 million years, on
average, there have been massive eruptions of millions of cubic kilometers of basalt typically
associated with major mass extinctions60,124,125
. The Siberian Traps, for example, extruded ~250 Ma,
cover an area today larger than the states of Washington, Oregon, California, Idaho, Nevada, and
Arizona combined and when forming may have covered an area as large as 71% of the size of the
United States126
. Visscher et al.127
document increased mutations in herbaceous lycopsids during the
end-Permian mass extinction that imply substantial depletion of ozone.
The location, volume, type, and timing of volcanism are determined by the motion of large
lithospheric plates (plate tectonics). Sub-aerial basaltic eruptions are most common on islands along
mid-ocean ridges and places where these ridges are overrun by continents. Major explosive
volcanoes are most common where oceanic plates are being subducted beneath continents, such as
around most of the Pacific Ocean. Explosive eruptions generally cool Earth, incrementing it into an
ice age if sufficiently frequent; basaltic eruptions generally warm Earth60
. Basaltic eruptions deep
under oceans do not appear to influence climate directly, but major increases in the area of ocean
crust formed per year at 33.9, 12, and 3 Ma, imply major increases in rates of subduction are
associated with major cooling60,128
. Sulfate and ash in ice cores record the level of volcanism
faithfully, but the ratio of stratospheric aerosols to ozone depletion controls the effects of this
volcanism on temperature.
Apparent increase in ozone before large volcanic eruptions
Annual total column ozone observed at Arosa appears to have increased 12 DU (3.9%) in
1991 when Pinatubo erupted but decreased 28 DU (8.5%) by 1993 (Fig. 3). Similarly ozone appears
to have increased 14 DU (4.4%) in 2010 when Eyjafjallajökull erupted but decreased 28 DU (8.4%)
in 2011. Other volcanic eruptions shown in Fig. 3 are also contemporaneous with a modest increase
in ozone followed the next year by a much larger decrease.
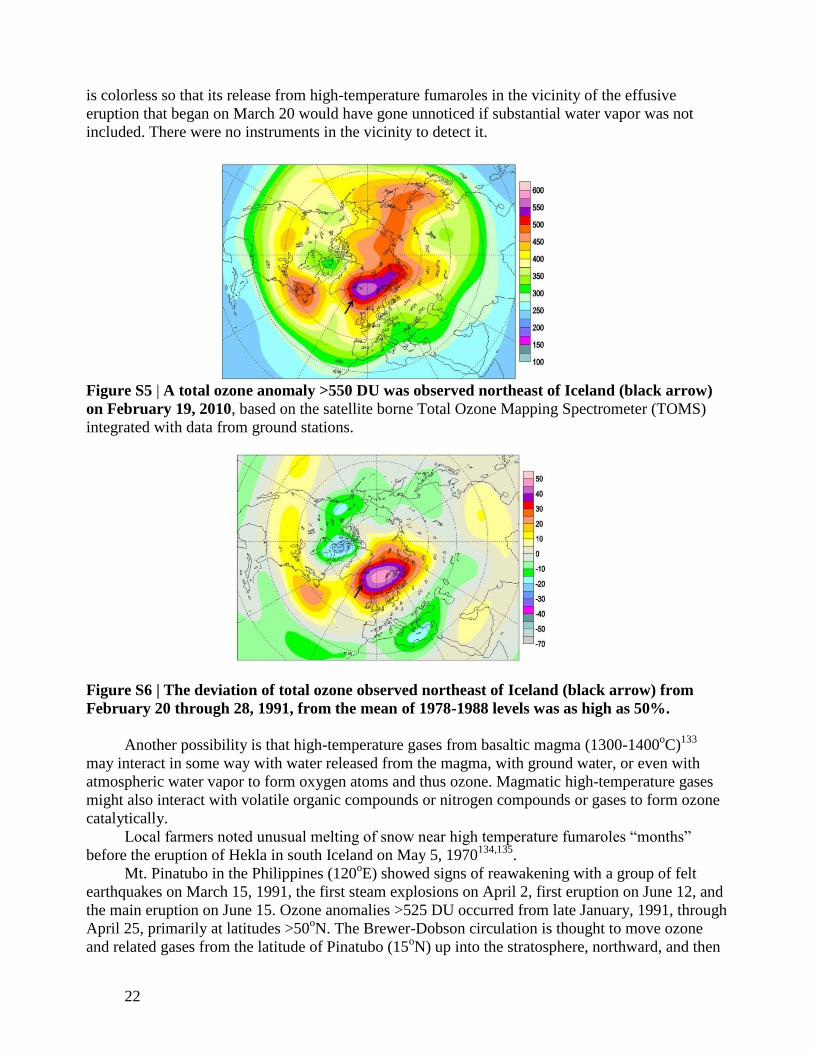
The ozone increase in 2010 occurred primarily between February 19 and February 26, ~4
weeks before the first effusive flank eruption of basalt from March 20 to April 12 and ~7 weeks
before the main explosive eruption of trachyandesite on April 14. Fig. S5 shows that total ozone
northeast of Iceland increased to more than 550 DU on February 19 over a background of ~325 DU,
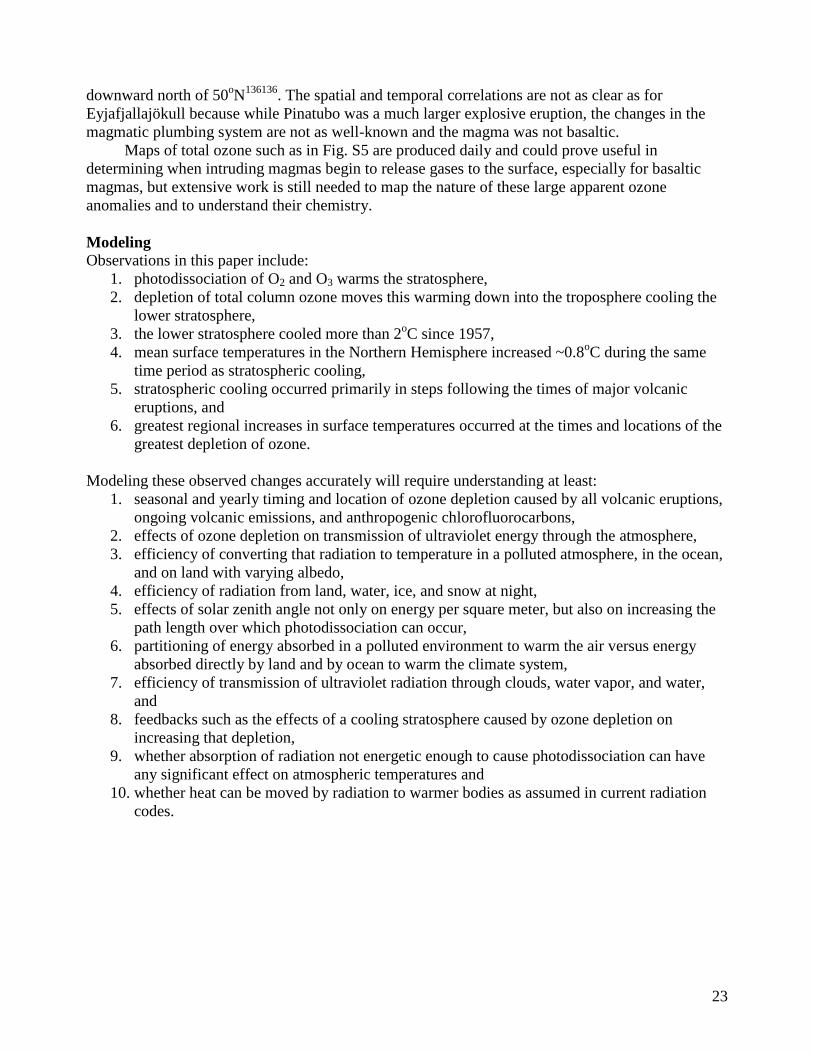
an increase of ~70%8. The deviation of total ozone over the period from February 21 to February 28
increased 45% compared to mean levels from 1978 thru 1988 (Fig. S6)8.
At Eyjafjallajökull, seismic activity and deformation began in December, 2009, “explained by
a single horizontal sill inflating at a depth of 4.0-5.9 km under the southeastern flank of the
volcano”129
. Deformation increased exponentially in February, suggesting a major change in
pressure conditions within the system by March 4. Thus a substantial release of gas from the top of
the magma body is highly likely to have occurred in late February as the roof of the intrusion
fractured to the surface.
Ozone is not a likely volcanic gas because magma has a reduced oxidation state at high
temperature. Primary gases observed from high-temperature fumaroles include SO2, which absorbs
ultraviolet solar radiation strongly at the same wavelengths as ozone (Fig. 2) and is known to affect
ozone measurements in urban areas such as Uccle, just outside of Brussels, Belgium130
. Basaltic
effusive eruptions typically emit 10 to 100 times more SO2 per cubic kilometer of magma than the
more explosive eruptions from volcanoes such as Pinatubo with more evolved magmas42,131,132
. SO2
22
is colorless so that its release from high-temperature fumaroles in the vicinity of the effusive
eruption that began on March 20 would have gone unnoticed if substantial water vapor was not
included. There were no instruments in the vicinity to detect it.
Figure S5 | A total ozone anomaly >550 DU was observed northeast of Iceland (black arrow)
on February 19, 2010, based on the satellite borne Total Ozone Mapping Spectrometer (TOMS)
integrated with data from ground stations.
Figure S6 | The deviation of total ozone observed northeast of Iceland (black arrow) from
February 20 through 28, 1991, from the mean of 1978-1988 levels was as high as 50%.
Another possibility is that high-temperature gases from basaltic magma (1300-1400oC)
133
may interact in some way with water released from the magma, with ground water, or even with
atmospheric water vapor to form oxygen atoms and thus ozone. Magmatic high-temperature gases
might also interact with volatile organic compounds or nitrogen compounds or gases to form ozone
catalytically.
Local farmers noted unusual melting of snow near high temperature fumaroles “months”
before the eruption of Hekla in south Iceland on May 5, 1970134,135
.
Mt. Pinatubo in the Philippines (120oE) showed signs of reawakening with a group of felt
earthquakes on March 15, 1991, the first steam explosions on April 2, first eruption on June 12, and
the main eruption on June 15. Ozone anomalies >525 DU occurred from late January, 1991, through
April 25, primarily at latitudes >50oN. The Brewer-Dobson circulation is thought to move ozone
and related gases from the latitude of Pinatubo (15oN) up into the stratosphere, northward, and then
23
downward north of 50oN
136136. The spatial and temporal correlations are not as clear as for
Eyjafjallajökull because while Pinatubo was a much larger explosive eruption, the changes in the
magmatic plumbing system are not as well-known and the magma was not basaltic.
Maps of total ozone such as in Fig. S5 are produced daily and could prove useful in
determining when intruding magmas begin to release gases to the surface, especially for basaltic
magmas, but extensive work is still needed to map the nature of these large apparent ozone
anomalies and to understand their chemistry.
Modeling
Observations in this paper include:
1. photodissociation of O2 and O3 warms the stratosphere,
2. depletion of total column ozone moves this warming down into the troposphere cooling the
lower stratosphere,
3. the lower stratosphere cooled more than 2oC since 1957,
4. mean surface temperatures in the Northern Hemisphere increased ~0.8oC during the same
time period as stratospheric cooling,
5. stratospheric cooling occurred primarily in steps following the times of major volcanic
eruptions, and
6. greatest regional increases in surface temperatures occurred at the times and locations of the
greatest depletion of ozone.
Modeling these observed changes accurately will require understanding at least:
1. seasonal and yearly timing and location of ozone depletion caused by all volcanic eruptions,
ongoing volcanic emissions, and anthropogenic chlorofluorocarbons,
2. effects of ozone depletion on transmission of ultraviolet energy through the atmosphere,
3. efficiency of converting that radiation to temperature in a polluted atmosphere, in the ocean,
and on land with varying albedo,
4. efficiency of radiation from land, water, ice, and snow at night,
5. effects of solar zenith angle not only on energy per square meter, but also on increasing the
path length over which photodissociation can occur,
6. partitioning of energy absorbed in a polluted environment to warm the air versus energy
absorbed directly by land and by ocean to warm the climate system,
7. efficiency of transmission of ultraviolet radiation through clouds, water vapor, and water,
and
8. feedbacks such as the effects of a cooling stratosphere caused by ozone depletion on
increasing that depletion,
9. whether absorption of radiation not energetic enough to cause photodissociation can have
any significant effect on atmospheric temperatures and
10. whether heat can be moved by radiation to warmer bodies as assumed in current radiation
codes.
24
References
1 Fioletov, V. Ozone climatology, trends, and substances that control ozone. Atmos. Ocean 46,
39-67 (2008).
2 Folland, C. K. et al. in Climate Change 2001: The Scientific Basis. Contribution of Working
Group I to the Third Assessment Report of the Intergovernmental Panel on Climate Change
(eds J.T. Houghton et al.) 99-181 (Cambridge University Press, 2001).
3 Trenberth, K. E. et al. in Climate Change 2007: The Physical Science Basis. Contribution of
Working Group I to the Fourth Assessment Report of the Intergovernmental Panel on
Climate Change (eds S. Solomon et al.) 235-336 (Cambridge University Press, 2007).
4 Kinnison, D. et al. Sensitivity of chemical tracers to meteorological parameters in the
MOZART-3 chemical transport model. J. Geophys. Res 112, D20302 (2007).
5 Seidel, D. J. & Randel, W. J. Variability and trends in the global tropopause estimated from
radiosonde data. J. Geophys. Res. 111, D21101 (2006).
6 HadCRUT3_NH, <www.cru.uea.ac.uk/cru/data/temperature/hadcrut3nh.txt> (2012).
7 Reed, R. J. The role of vertical motion in ozone-weather relationship. J. Meteorol. 7, 263-
267 (1950).
8 Environment Canada. Archive of world ozone maps, <exp-
studies.tor.ec.gc.ca/clf2/e/ozoneworld.html> (2012).
9 Madronich, S. in The Role of the Stratosphere in Global Change Vol. 8, NATO ASI Series
I: Global Environmental Change (ed M.L. Chanin) 463-471 (Springer-Verlag, 1993).
10 Trenberth, K. E., Fasullo, J. T. & Kiehl, J. Earth's Global Energy Budget. Bull. Am.
Meteorol. Soc. 90, 311-323 (2009).
11 Matsumi, Y. et al. Quantum yields for production of O(1D) in the ultraviolet photolysis of
ozone: Recommendation based on evaluation of laboratory data. J. Geophys. Res. 104, 12
(2002).
12 Sander, S. P. et al. Chemical Kinetics and Photochemical Data for Use in Atmospheric
Studies Evaluation Number 15. Vol. 06-2 (Jet Propulsion Laboratory, 2006).
13 Tedetti, M. & Sempéré, R. Penetration of ultraviolet radiation in the marine environment. A
review. Photochemistry and Photobiology 82, 389-397 (2006).
14 Hughes, G. L., Rao, S. S. & Rao, T. S. Statistical analysis and time-series models for
minimum/maximum temperatures in the Antarctic Peninsula. Proc. Roy. Soc. London, Ser. A
463, 241-259 (2007).
15 Mulvaney, R. et al. Recent Antarctic Peninsula warming relative to Holocene climate and
ice-shelf history. Nature 489, 141-144 (2012).
16 Meredith, M. P. & King, J. C. Rapid climate change in the ocean west of the Antarctic
Peninsula during the second half of the 20th century. Geophys. Res. Lett 32, L19604 (2005).
17 Clarke, A. et al. Climate change and the marine ecosystem of the western Antarctic
Peninsula. Phil. Trans. R. Soc. London, Ser. B 362, 149-166 (2007).
18 Stammerjohn, S. E., Martinson, D. G., Smith, R. C. & Iannuzzi, R. A. Sea ice in the western
Antarctic Peninsula region: Spatio-temporal variability from ecological and climate change
perspectives. Deep Sea Res. II 55, 2041-2058 (2008).
19 Wang, X. & Zender, C. S. Arctic and Antarctic diurnal and seasonal variations of snow
albedo from multiyear Baseline Surface Radiation Network measurements. J. Geophys. Res.
116, F03008 (2011).
20 Manney, G. L. et al. Unprecedented Arctic ozone loss in 2011. Nature 478, 469 (2011).
21 Kwok, R. & Untersteiner, N. The thinning of Arctic sea ice. Physics Today 64, 36-41
(2011).
25
22 NSIDC. Arctic sea ice reaches lowest extent for the year and the satellite record,
<nsidc.org/news/press/2012_seaiceminimum.html> (2012).
23 Lemke, P. et al. in Climate Change 2007: The physical science basis (eds S. Solomon et
al.) 337-383 (Cambridge University Press, 2007).
24 A. Douglass et al., in Scientific Assessment of Ozone Depletion: 2010. (World
Meteorological Organization Global Ozone Research and Monitoring Project - Report No.
52, 2011) Figure 2-2.
25 Solomon, S. Stratospheric ozone depletion: A review of concepts and history. Rev. Geophys.
37, 275-316 (1999).
26 Multivariate ENSO index (MEI), <www.esrl.noaa.gov/psd/enso/mei/> (2012).
27 Druitt, T. Emplacement of the 18 May 1980 lateral blast deposit ENE of Mount St. Helens,
Washington. Bull. Volcanol. 54, 554-572 (1992).
28 Gleason, J. et al. Record low global ozone in 1992. Science 260, 523 (1993).
29 Angell, J. K. Estimated impact of Agung, El Chichon and Pinatubo volcanic eruptions on
global and regional total ozone after adjustment for the QBO. Geophys. Res. Lett. 24, 647–
650 (1997).
30 Kerr, J., Wardle, D. & Tarasick, D. Record low ozone values over Canada in early 1993.
Geophys. Res. Lett. 20, 1979-1982 (1993).
31 Robock, A. Pinatubo eruption: The climatic aftermath. Science 295, 1242-1244 (2002).
32 De Mazière, M. et al. Quantitative evaluation of the post–Mount Pinatubo NO2 reduction
and recovery, based on 10 years of Fourier transform infrared and UV-visible spectroscopic
measurements at Jungfraujoch. J. Geophys. Res. 103, 10849-10810,10858 (1998).
33 Johnston, P., McKenzie, R., Keys, J. & Matthews, W. Observations of depleted stratospheric
NO2 following the Pinatubo volcanic eruption. Geophys. Res. Lett. 19, 211-213 (1992).
34 Coffey, M. T. Observations of the impact of volcanic activity on stratospheric chemistry. J.
Geophys. Res. 101, 6767–6780 (1996).
35 Thompson, D. W. J. & Solomon, S. Understanding recent stratospheric climate change. J.
Clim. 22, 1934-1943 (2009).
36 Randel, W. J. in The Stratosphere: Dynamics, Transport and Chemistry, Geophysical
Monograph Series Vol. 190 (eds L. M. Polvani, A. H. Sobel, & D. W. Waugh) 123-135
(AGU, 2010).
37 Angell, J. K. Stratospheric warming due to Agung, El Chichón, and Pinatubo taking into
account the quasi-biennial oscillation. J. Geophys. Res. 102, 9479–9486 (1997).
38 Anderson, J. G., Wilmouth, D. M., Smith, J. B. & Sayres, D. S. UV Dosage Levels in
Summer: Increased Risk of Ozone Loss from Convectively Injected Water Vapor. Science
337, 835-839 (2012).
39 SPARC. The Role of Halogen Chemistry in Polar Stratospheric Ozone Depletion,
<www.atmosp.physics.utoronto.ca/SPARC/HalogenChem_Final_20090213.pdf> (2009).
40 Molina, M. J. & Rowland, F. S. Stratospheric sink for chlorofluoromethanes: Chlorine
catalysed destruction of ozone. Nature 249, 810-814 (1974).
41 Tabazadeh, A. & Turco, R. P. Stratospheric chlorine injection by volcanic eruptions: HCl
scavenging and implications for ozone. Science 260, 1082-1084 (1993).
42 Self, S., Blake, S., Sharma, K., Widdowson, M. & Sephton, S. Sulfur and chlorine in late
Cretaceous Deccan magmas and eruptive gas release. Science 319, 1654-1657 (2008).
43 Vance, A. et al. Ozone depletion in tropospheric volcanic plumes. Geophys. Res. Lett. 37
(2010).
44 von Glasow, R. Atmospheric chemistry in volcanic plumes. Proc. Nat. Acad. Sci. U.S.A.
107, 6594-6599 (2010).
26
45 NOAA. U.S. Records,
<www.ncdc.noaa.gov/extremes/records/daily/maxt/2012/03/00?sts[]=US> (2012).
46 Minnis, P. et al. Radiative climate forcing by the Mount Pinatubo eruption. Science 259,
1411-1415 (1993).
47 Sea Surface Temperatures Reach Record Highs on Northeast Continental Shelf,
<www.nefsc.noaa.gov/press_release/2012/SciSpot/SS1209/> (2012).
48 Global Volcanism Program. Large Holocene eruptions,
<www.volcano.si.edu/world/largeeruptions.cfm> (2012).
49 NASA. Sunspot number per month, <solarscience.msfc.nasa.gov/greenwch/spot_num.txt>
(2012).
50 Haigh, J. D., Winning, A. R., Toumi, R. & Harder, J. W. An influence of solar spectral
variations on radiative forcing of climate. Nature 467, 696-699 (2010).
51 Trenberth, K. E. An imperative for climate change planning: tracking Earth's global energy.
Curr. Opin. Environ. Sustain. 1, 19-27 (2009).
52 Knight, J. et al. in State of the Climate in 2008 Vol. 90 (eds T. C. Peterson & M. O.
Baringer) S22-S23 (Bull. Am. Meteorol. Soc., 2009).
53 Hansen, J. et al. Climate response times: dependence on climate sensitivity and ocean
mixing. Science 229, 857 (1985).
54 Domingues, C. M. et al. Improved estimates of upper-ocean warming and multi-decadal sea-
level rise. Nature 453, 1090-1093 (2008).
55 LaRiviere, J. P. et al. Late Miocene decoupling of oceanic warmth and atmospheric carbon
dioxide forcing. Nature 486, 97-100 (2012).
56 Berner, R. A. Phanerozoic atmospheric oxygen: New results using the GEOCARBSULF
model. Am. J. Sci. 309, 603 (2009).
57 Seidel, D. J., Fu, Q., Randel, W. J. & Reichler, T. J. Widening of the tropical belt in a
changing climate. Nat. Geosci. 1, 21-24 (2008).
58 Polvani, L. M., Waugh, D. W., Correa, G. J. P. & Son, S. W. Stratospheric ozone depletion:
The main driver of twentieth-century atmospheric circulation changes in the Southern
Hemisphere. J. Clim. 24, 795-812 (2011).
59 Allen, R. J., Sherwood, S. C., Norris, J. R. & Zender, C. S. Recent Northern Hemisphere
tropical expansion primarily driven by black carbon and tropospheric ozone. Nature 485,
350-354 (2012).
60 Ward, P. L. Sulfur dioxide initiates global climate change in four ways. Thin Solid Films
517, 3188-3203 (2009).
61 Committee on Extension to the Standard Atmosphere. U.S. Standard Atmosphere, 1976.
(U.S. Government Printing Office, 1976).
62 Krueger, A. J. & Minzner, R. A. A mid-latitude ozone model for the 1976 US standard
atmosphere. J. Geophys. Res. 81, 4477-4481 (1976).
63 Rothman, L. S. et al. The HITRAN 2008 molecular spectroscopic database. J. Quant.
Spectrosc. Radiat. Transfer 110, 533-572 (2009).
64 Hermans, C., Vandaele, A. C. & Fally, S. Fourier transform measurements of SO2
absorption cross sections:I. Temperature dependence in the 24000–29000cm−1 (345–
420nm) region. J. Quant. Spectrosc. Radiat. Transfer 110, 756-765 (2009).
65 Vandaele, A. C., Hermans, C. & Fally, S. Fourier transform measurements of SO2
absorption cross sections: II.Temperature dependence in the 29000–44000cm−1 (227–
345nm) region. J. Quant. Spectrosc. Radiat. Transfer 110, 2115-2126 (2009).
66 Finlayson-Pitts, B. J. & Pitts, J. N. Chemistry of the Upper and Lower Atmosphere: Theory,
Experiments, and Applications. (Academic Press, 1999).
27
67 Staehelin, J. et al. Total ozone series at Arosa (Switzerland): Homogenization and data
comparison. J. Geophys. Res. 103, 5827-5841 (1998).
68 Levitus, S. et al. World ocean heat content and thermosteric sea level change (0-2000 m),
1955-2010. Geophys. Res. Lett. 39, in press (2012).
69 Hadley Centre. HadAT: globally gridded radiosonde temperature anomalies from 1958 to
present, <www.metoffice.gov.uk/hadobs/hadat/images.html> (2012).
70 Remote Sensing Systems. <www.remss.com/msu/msu_data_description.html> (2012).
71 Douglass, A. et al. in Scientific Assessment of Ozone Depletion: 2010 (ed C. A. Ennis) 76
(World Meteorological Organization Global Ozone Research and Monitoring Project -
Report No. 52, 2011).
72 Smith, S. J. et al. Anthropogenic sulfur dioxide emissions: 1850–2005. Atmos. Chem. Phys.
11, 1101-1116 (2011).
73 Rohde, R. A. Radiation transmitted by the atmosphere,
<commons.wikimedia.org/wiki/File:Atmospheric_Transmission.png> (2012).
74 Fluorescent lamp: Phosphors and the spectrum of emitted light,
<en.wikipedia.org/wiki/Fluorescent_lamp#Phosphors_and_the_spectrum_of_emitted_light>
(2012).
75 EPA. Air emission sources, <www.epa.gov/air/emissions/> (2012).
76 D'Arrigo, R., Wilson, R., Liepert, B. & Cherubini, P. On the ‘Divergence Problem’in
Northern Forests: A review of the tree-ring evidence and possible causes. Global Planet.
Change 60, 289-305 (2008).
77 Keller, T. Direct effects of sulphur dioxide on trees. Phil. Trans. R. Soc. London, Ser. B 305,
317-325 (1984).
78 Manninen, S. & Huttunen, S. Response of needle sulphur and nitrogen concentrations of
Scots pine versus Norway spruce to SO2 and NO2. Environ. Pollut. 107, 421-436 (2000).
79 Nemani, R. et al. Climate-driven increases in global terrestrial net primary production from
1982 to 1999. Science 300, 1560 (2003).
80 Schultz, M. & Rast, S. REanalysis of the TROpospheric chemical composition over the past
40 years,, <retro.enes.org/reports/D1-6_final.pdf > (2008).
81 U. S. Environmental Protection Agency. National Air Pollutant Emission Trends, 1900 -
1998. (2000).
82 Cofala, J., Rafaj, P., Schöpp, W., Klimont, Z. & Amann, M. Emissions of Air Pollutants for
the World Energy Outlook 2009 Energy Scenarios,
<worldenergyoutlook.org/docs/Emissions_of_Air_Pollutants_for_WEO2009.pdf> (2009).
83 Bond, T. C. et al. Historical emissions of black and organic carbon aerosol from energy-
related combustion, 1850–2000. Global Biogeochem. Cycles 21, GB2018 (2007).
84 Novakov, T. et al. Large historical changes of fossil-fuel black carbon aerosols. Geophys.
Res. Lett. 30, 1324 (2003).
85 Dlugokencky, E. J. Carbon dioxide, nitrous oxide, methane, CFC-12, CFC-11,
<www.esrl.noaa.gov/gmd/aggi/aggi_2010.fig2.png> (2010).
86 Etheridge, D. M., Steele, L. P., Francey, R. J. & Langenfelds, R. L. Atmospheric methane
between 1000 A.D. and present: Evidence of anthropogenic emissions and climatic
variability J. Geophys. Res. 103, 15979-15993 (1998).
87 Dlugokencky, E. J. et al. Observational constraints on recent increases in the atmospheric
CH4 burden. Geophys. Res. Lett. 36, L18803 (2009).
88 Aydin, M. et al. Recent decreases in fossil-fuel emissions of ethane and methane derived
from firn air. Nature 476, 198-201 (2011).
28
89 Kai, F. M., Tyler, S. C., Randerson, J. T. & Blake, D. R. Reduced methane growth rate
explained by decreased Northern Hemisphere microbial sources. Nature 476, 194-197
(2011).
90 Wang, Y. & Jacob, D. J. Anthropogenic forcing on tropospheric ozone and OH since
preindustrial times. J. Geophys. Res. D23, 31123-31136 (1998).
91 Staffelbach, T., Neftel, A., Stauffer, B. & Jacob, D. Formaldehyde in polar ice cores: a
possibility to characterize the atmospheric sink of methane in the past. Nature 349, 603-605
(1991).
92 Bousquet, P., Hauglustaine, D. A., Peylin, P., Carouge, C. & Ciais, P. Two decades of OH
variability as inferred by an inversion of atmospheric transport and chemistry of methyl
chloroform. Atmos. Chem. Phys. 5, 1679-1731 (2005).
93 Zander, R., Demoulin, P., Ehhalt, D., Schmidt, U. & Rinsland, C. Secular increase of the
total vertical column abundance of carbon monoxide above central Europe since 1950. J.
Geophys. Res. 94, 11021-11011,11028 (1989).
94 Duncan, B. N. et al. Global budget of CO, 1988–1997: Source estimates and validation with
a global model. J. Geophys. Res. 112, D22301 (2007).
95 Randel, W. J., Wu, F., Vömel, H., Nedoluha, G. E. & Forster, P. Decreases in stratospheric
water vapor after 2001: Links to changes in the tropical tropopause and the Brewer-Dobson
circulation. J. Geophys. Res. 111, D12312 (2006).
96 Solomon, S. et al. Contributions of stratospheric water vapor to decadal changes in the rate
of global warming. Science 327, 1219-1223 (2010).
97 Wild, M. Global dimming and brightening: A review. J. Geophys. Res. 114, D00D16
(2009).
98 Lu, Z. et al. Sulfur dioxide emissions in China and sulfur trends in East Asia since 2000.
Atmos. Chem. Phys. 10, 8657-8715 (2010).
99 Etheridge, D. M. et al. Historical CO2 record from the Law Dome DE08, DE08-2, and DSS
ice cores, <cdiac.ornl.gov/ftp/trends/co2/lawdome.combined.dat> (1998).
100 NOAA ESRL. Trends in atmospheric carbon dioxide,
<www.esrl.noaa.gov/gmd/ccgg/trends/#mlo_full> (2010).
101 Trenberth, K. & Fasullo, J. Tracking Earth's Energy. Science 328, 316 (2010).
102 Hansen, J. et al. Earth's energy imbalance: Confirmation and implications. Science 308,
1431-1435 (2005).
103 Zielinski, G. A., Mayewski, P. A., Meeker, L. D., Whitlow, S. & Twickler, M. A 110,000-
year record of explosive volcanism from the GISP2 (Greenland) ice core. Quat. Res. 45, 109
(1996)
(ftp.ncdc.noaa.gov/pub/data/paleo/icecore/greenland/summit/gisp2/chem/volcano.txt1996).
104 White, J. W. C. et al. The climate signal in the stable isotopes of snow from Summit,
Greenland: Results of comparisons with modern climate observations. J. Geophys. Res. 102,
26425 (1997)
(ftp.ncdc.noaa.gov/pub/data/paleo/icecore/greenland/summit/gisp2/isotopes/stacked.txt).
105 Mayewski, P. A. et al. Major features and forcing of high-latitude northern hemisphere
atmospheric circulation using a 110,000-year-long glaciochemical series. J. Geophys. Res.
102, 26345–26366 (1997).
106 Barrie, L., Hoff, R. & Daggupaty, S. The influence of mid-latitudinal pollution sources on
haze in the Canadian Arctic. Atmos. Environ. 15, 1407-1419 (1981).
107 Lea, D. W. Climate Impact of Late Quaternary Equatorial Pacific Sea Surface Temperature
Variations. Science 289, 1719-1724 (2000).
29
108 Hegerl, G. C. et al. Detection of human influence on a new, validated 1500-year temperature
reconstruction. J. Clim. 20, 650-666 (2007).
109 Bluth, G. J. S., Doiron, S. D., Schnetzler, C. C., Krueger, A. J. & Walter, L. S. Global
tracking of the SO2 clouds from the June, 1991 Mount Pinatubo eruptions. Geophys. Res.
Lett. 19, 151-154 (1992).
110 Stone, R. S., Keys, J. & Dutton, E. G. Properties and decay of stratospheric aerosols in the
Arctic following the 1991 eruptions of Mount Pinatubo. Geophys. Res. Lett. 20, 2539-2362
(1993).
111 Self, S., Zhao, J.-X., Holasek, R. E., Torres, R. C. & King, A. J. in Fire and Mud: Eruptions
and lahars of Mount Pinatubo, Philippines (eds Christopher G. Newhall & Raymundo S.
Punongbayan) 1089-1115 (Philippine Institute of Volcanology and Seismology and
University of Washington Press, 1996).
112 Stenchikov, G. et al. Arctic Oscillation response to volcanic eruptions in the IPCC AR4
climate models. J. Geophys. Res. 111, D07107 (2006).
113 Gleckler, P. J. et al. Krakatoa’s signature persists in the ocean. Nature 439, 675 (2006).
114 Gregory, J. M., Lowe, J. A. & Tett, S. F. B. Simulated global-mean sea level changes over
the last half-millennium. J. Clim. 19, 4576-4591 (2006).
115 Fiedler, V. et al. East Asian SO2 pollution plume over Europe–Part 1: Airborne trace gas
measurements and source identification by particle dispersion model simulations. Atmos.
Chem. Phys. 9, 4717–4728 (2009).
116 Fiedler, V. et al. East Asian SO2 pollution plume over Europe-Part 2: Evolution and
potential impact. Atmos. Chem. Phys. 9, 4729-4745 (2009).
117 Thordarson, T. & Self, S. Atmospheric and environmental effects of the 1783–1784 Laki
eruption: A review and reassessment. J. Geophys. Res. 108, 4011 (2003).
118 Ward, P. L. Understanding volcanoes may be the key to controlling global warming. Soc.
Vac. Coaters Bull. Summer, 26-34 (2010).
119 Thordarson, T., Self, S., Oskarsson, N. & Hulsebosch, T. Sulfur, chlorine, and fluorine
degassing and atmospheric loading by the 1783–1784 AD Laki (Skaftár Fires) eruption in
Iceland. Bull. Volcanol. 58, 205-225 (1996).
120 Licciardi, J. M., Kurz, M. D. & Curtice, J. M. Glacial and volcanic history of Icelandic table
mountains from cosmogenic 3He exposure ages. Quat. Sci. Rev. 26, 1529-1546 (2007).
121 Rahmstorf, S. Timing of abrupt climate change: A precise clock. Geophys. Res. Lett. 30,
1510 (2003).
122 Severinghaus, J. P. Abrupt climate change at the end of the last glacial period inferred from
trapped air in polar ice. Science 286, 930-934 (1999).
123 Norris, R. D. & Rohl, U. Carbon cycling and chronology of climatewarming during the
Palaeocene/Eocene transition. Nature 401, 775-778 (1999).
124 Courtillot, V. E. & Renne, P. R. On the ages of flood basalt events. C.R. Geosci. 335, 113-
140 (2003).
125 Wignall, P. The link between large igneous province eruptions and mass extinctions.
Elements 1, 293-297 (2005).
126 Siberian traps, <en.wikipedia.org/wiki/Siberian_Traps> (2012).
127 Visscher, H. et al. Environmental mutagenesis during the end-Permian ecological crisis.
Proc. Nat. Acad. Sci. U.S.A. 101, 12952 (2004).
128 Cogné, J.-P. & Humler, E. Trends and rhythms in global seafloor generation rate.
Geochemistry Geophysics Geosystems 7, Q03011 (2006).
129 Sigmundsson, F. et al. Intrusion triggering of the 2010 Eyjafjallajökull explosive eruption.
Nature 468, 426-430 (2010).

30
130 De Muer, D. & De Backer, H. Revision of 20 years of Dobson total ozone data at Uccle
(Belgium): Fictitious Dobson total ozone trends induced by sulfur dioxide trends. J.
Geophys. Res. 97, 5921-5937 (1992).
131 Palais, J. & Sigurdsson, H. in Understanding Climate Change Vol. 52 (eds A. Berger, R.E.
Dickinson, & John W. Kidson) 31-56 (American Geophysical Union Geophysical
Monograph, 1989).
132 Freda, C., Baker, D. & Scarlato, P. Sulfur diffusion in basaltic melts. Geochim. Cosmochim.
Acta 69, 5061-5069 (2005).
133 Lee, C. T. A., Luffi, P., Plank, T., Dalton, H. & Leeman, W. P. Constraints on the depths
and temperatures of basaltic magma generation on Earth and other terrestrial planets using
new thermobarometers for mafic magmas. Earth Planet. Sci. Lett. 279, 20-33 (2009).
134 Thorarinsson, S. & Sigvaldason, G. The Hekla eruption of 1970. Bull. Volcanol. 36, 269-288
(1972).
135 Thorarinsson, S. Hekla: A notorius volcano. (Almenna Bokafelagid, 1970).
136 Cordero, E., Newman, P. A., Weaver, C. & Fleming, E. The Brewer-Dobson Circulation,
<www.ccpo.odu.edu/~lizsmith/SEES/ozone/class/Chap_6/index.htm> (2012).