oxygen consumption of equine articular chondrocytes ... · chondrocytes cultured in alginate beads...
TRANSCRIPT

Published in : Cell Biology International (2007), vol. 31, pp. 878-886. Status : Postprint (Author’s version)
Oxygen consumption of equine articular chondrocytes: Influence of applied oxygen tension and glucose concentration during culture
Nicole Schneider a,c, Ange Mouithys-Mickalad a, Jean-Philippe Lejeune c, Claire Duyckaerts a, Francis Sluse a, Ginette Deby-Dupont a, Didier Serteyn a,b a Centre of Oxygen Research & Development (CORD), Institut de Chimie, B6a, Sart Tilman, University of Liège, 4000 Liège, Belgium
b Department of Clinical Sciences, Large Animal Surgery, Faculty of Veterinary Medicine, B41, Sart Tilman, University of Liège, 4000 Liège, Belgium
c Centre Européen du Cheval, Mont-le-Soie, Vielsam, Belgium
Abstract
We investigated the oxygen (O2) uptake of equine articular chondrocytes to assess their reactions to anoxia/re-oxygenation. They were cultured under 5% or 21% gas phase O2 and at glucose concentrations of 0, 1.0 or 4.5 g/L in the culture medium (n = 3). Afterwards, the O2 consumption rate of the chondrocytes was monitored (oxymetry) before and after an anoxia period of 25 min. The glucose consumption and lactate release were measured at the end of the re-oxygenation period. The chondrocytes showed a minimal O2 consumption rate, which was hardly changed by anoxia. Independently from the O2 tension, glucose uptake by the cells was about 30% of the available culture medium glucose, thus higher for cells at 4.5 g/L glucose (n = 3). Lactate release was also independent from O2 tension, but lower for cells at 4.5 g/L glucose (n = 3). Our observations indicated that O2 consumption by equine chondrocytes was very low despite a functional mitochondrial respiratory chain, and nearly insensitive to anoxia/re-oxygenation. But the chondrocytes metabolism was modified by an excess of O2 and glucose.
Keywords : Equine ; Chondrocytes ; Oxygen ; Glucose ; Anoxia
1. Introduction
The oxygen (O2) content of the synovial liquid and cartilage is known to be inferior to most of other tissues, about 7% according to Grimshaw and Mason (2000); it ranges from 3% to 9% in healthy synovial fluid, with the lowest values in the depth of the joint, close to the articular cartilage (Ferell and Najafipour, 1992). This lack of O2 seems partially compensated by a heterogenous distribution: the composition of the cartilage directs the passage of O2 near to the cells, so that the highest O2 permeability is in the cellular and pericellular regions (Gonsalves et al., 2000). Moreover, in the deepest layers of the articular cartilage, the availability of O2 will depend not only on the density of chondrocytes, which constitute just about 1-2% of the equine articular cartilage (Todhunter and Lust, 1992) and on their particular cellular respiration rate, but also on the diffusion and the gradient of O2. The mitochondrial respiration of the chondrocytes in cartilage is not the main pathway for their energetic metabolism (Lee and Urban, 2002), and hyaline articular chondrocytes employ anaerobic pathways to provide their energy needs (Lane et al., 1977), which could make them more resistant to anoxia. We found that synoviocytes, but not equine articular chondrocytes produce reactive oxygen species after cycles of anoxia/ re-oxygenation (Schneider et al., 2005).
In another study, we demonstrated that the intracellular ATP levels were not significantly different for equine chondrocytes cultured in alginate beads for eight days with 4.5 g glucose/L, at 1%, 5% or 21% O2 as regulated in the gas phase, suggesting that the rate of the mitochondrial respiration did not intensively change whatever the applied O2 tension was (Schneider et al., 2004). Furthermore, we observed a cell survival of 40-60% at 1% O2 tension, even in the complete absence of glucose. This raised the question: how do equine articular chondrocytes achieve to deal their energy needs and how much oxygen do they consume in presence of different glucose concentrations in the medium. Many authors reported data on O2 consumption by chondrocytes (Haselgrove et al., 1993; Nehring et al., 1999; Obradovic and Meldon, 2000; Malda et al., 2004) but their approaches were generally tissue engineering for cartilage repair and thus cell multiplication with most often cartilage dedifferentiation. They often used immature cartilage.

Published in : Cell Biology International (2007), vol. 31, pp. 878-886. Status : Postprint (Author’s version)
In this paper our aim was mature chondrocytes culture not for multiplication but for the study of the effects of anoxia/ re-oxygenation, which is considered to occur in vivo (James et al., 1990; McIlwraith, 1996; Dimock et al., 2000; Lee et al., 2004). We cultured the cells under 5% or 21% O2, as regulated in the gas phase, with variable glucose concentrations: 0 g/L as an extreme condition, 1.0 g/L similar to in vivo conditions (Liberg et al., 1977), and 4.5 g/L because this glucose concentration is commonly used for the culture of articular chondrocytes. We measured the O2 uptake of equine chondrocytes that have been maintained in these variable culture conditions for 48 h directly before and after a short period of deep hypoxia (< 1% O2) in order to assess the effects of anoxia/re-oxygenation on the respiration rate of the cells. We used this short culture time of mature equine articular chondrocytes to prevent cell dedifferentiation. The glucose consumption and the lactate production of the chondrocytes were measured at the end of the 2 h lasting oxymetry experiments to assess more aspects of the cell metabolism. Finally, to control the evolution of chondrocytes at the different culture conditions, we cultured mature equine articular chondrocytes in alginate beads for 11 days and monitored their viability and morphology.
2. Materials and methods
2.1. Materials
PenStrep and HEPES were from Cambrex (Belgium). Trizma (2-amino-2-(hydroxymethyl)-1,3-propanediol), Triton X-100, Cytochrome c, collagenase, hyaluronidase, alginate, calcium chloride, sodium salts, ascorbic acid and Oil Red-O were from Sigma-Aldrich (Belgium). Amphotericin B, proline, glutamine, Ultroser G, DMEM (Dulbecco's modified Eagle's medium) with 0 g/L glucose (with phenol red), 1 g or 4.5 g/L glucose (without phenol red) were purchased from Invitrogen (Belgium). Pronase and isopropanol were from Merck (VWR International, Belgium) and trypan blue from ICN Biomaterials (Germany). Lactate and D-glucose kits (Biopharm/Roche) were purchased from Stag (Belgium). Premixed gases were obtained from Air Liquide (Belgium).
2.2. Dissection of articular cartilage and enzymatic isolation of chondrocytes
The cartilage was harvested from stifle joints of three horses (older than 2 years) euthanasied for welfare reasons or slaughtered at a local abattoir. An area of about 20 × 20 cm at the stifle was clipped, and the skin was removed without preliminary opening of the joint cavity. The joint capsule was dissected, and the isolation of equine articular cartilage was performed aseptically as previously described (Schneider et al., 2004). The cartilage, cut in small pieces, was submitted to a triple enzymatic digestion (sequentially: hyaluronidase, pronase, collagenase) in DMEM without glutamine, added with 10 mM HEPES, 2% Ultroser G, 1 g/L of glucose and a mixture of antibiotics and amphotericin B (Sanchez et al., 2002; Schneider et al., 2004). After digestion, the cell suspension was filtered (filter porosity 70 µm), centrifuged (5 min at 2500 g) and washed three times in culture medium. The cells of an aliquot sample were counted and their viability was quantified by trypan blue exclusion (0.4% in buffered saline solution).
2.3. Preconditioning cells before the oxymetric assays
10 × 106 chondrocytes were suspended in sterile tubes in a final volume of 10 mL DMEM culture medium with 0, 1.0 or 4.5 g/L glucose, supplemented with 2% Ultroser G, PenStrep (104 UI/mL and 10 mg/mL), HEPES (10 mM), glutamine (200 µg/mL), proline (2 mM) and amphotericin B (0.5 µg/mL). The medium was equilibrated 30 min with a premixed gas composition: 21% or 5% O2 tensions, 5% carbon dioxide (CO2) and 74% or 90% nitrogen (N2). The cells were cultured in closed tubes at 37 °C in a humidity-saturated atmosphere, 21% or 5% O2 tension, 5% carbon dioxide (CO2) and 74% or 90% nitrogen (N2), respectively, for 48 h (conditioning culture).
Cell handling for the culture at 5% O2 was performed in a sterile glove box (glove box C45201; Fisher Bioblock, Belgium), gas-controlled (N2, O2 and CO2) by micro flow rotameters. The O2 content of the glove box was measured with an oxymeter (Oxycom 100 D, Germany). The media used for the culture at 5% O2 were balanced to the needed O2 condition by bubbling with a gas mixture of 5% O2, 5% CO2 and 90% N2 during 30 min prior to culture. For the culture at 21% O2, the cell manipulations were done at ambient air under a laminar flow hood. During conditioning culture, the chondrocytes were maintained in suspension on an orbital shaker working at 80 rpm at 37 °C. Cultures were performed with three different cartilage samples for each condition of the culture period.

Published in : Cell Biology International (2007), vol. 31, pp. 878-886. Status : Postprint (Author’s version)
2.4. Oxymetric assays
After the conditioning culture period, the cells were centrifuged, suspended in 2 mL of the corresponding medium, and immediately counted for viability determination or used for oxymetry after transfer to the respiration chamber of the oxymeter.
The O2 consumption by the chondrocytes suspension (10 × 106 cells/assay) was measured with a Clark electrode, at 37 °C in 2 mL of a 50% O2 saturated medium (103 µmol O2), corresponding to a 10.5% O2 oxygen tension. The kinetics of O2 consumption was recorded with an oxygraph (Oroboros Instruments, Austria). The software associated to the Oroboros oxygraph calculated the values of the O2 consumption rate.
After 45 min of respiration, the cells were submitted to an anoxia/re-oxygenation test, following a previously described technique adapted for chondrocytes (Mouithys-Mickalad et al., 2002). Anoxia was obtained by bubbling with N2 and maintained for 25 min. Re-oxygenation was performed by exposure of the medium to air under stirring, until the O2 conditions applied at the start of the oxymetry assay were reached. The further O2 uptake pattern was followed during 30 min. At the end of the complete procedure (about 2 h), supernatants and cells were separated by centrifugation. The viability of the cells was controlled by the technique of trypan blue exclusion.
In order to validate the oxymetry technique, the O2 uptake by chondrocytes was compared to the O2 consumption of 107 aerobic cells (human promonocytes, THP-1 cell line) which O2 consumption has been previously established. THP-1 cells were cultured in RPMI-1640 with different agents as previously described (Mouithys-Mickalad et al., 2001).
2.5. Cytochrome c oxidase activity
The Cytochrome c oxidase activity measurement was used to control the functional quality of the mitochondrial respiratory chain of the chondrocytes. One million cells were centrifuged at 8000 g for 1 min. The pellet was suspended in 2 mL ultrapure water, added with 10 µL of a 10% Triton-X 100 solution of Trizma-HCl buffer (0.1 M, pH 7.4) and 50 µM reduced Cytochrome c, which was prepared before the assays by a reduction with ascorbate, and an elimination of the excess of ascorbate by a gel filtration chromatography. The Cytochrome c oxidase activity was determined at 25 °C by measurement of the absorbance change at 550-540 nm with an Aminco DW-2000 spectrophotometer (Verlaet et al., 2002).
2.6. Glucose uptake and lactate production
Lactate and glucose were measured by an enzymatic assay, (UV visible spec-trophotometry) in the supernatants collected after the oxymetric assays. These parameters reflect a 2 h cell metabolism. Glucose uptake and lactate release could not be measured for the assays with 0 g/L glucose, because the phenol red of this culture medium interfered with the enzymatic method. The measurement of D-glucose was established in presence of hexokinase and ATP with formation of D-glucose-6-phosphate and ADP: the consumption of ATP was followed by a spectrophotometric lecture (340 nm). The measurement of L-lactate was done in presence of lactate dehydrogenase and NAD+ which were transformed to pyruvate and NADH: the transformation of NAD+ was observed by spectrophotometry (340 nm). Measurements were made at least in duplicate.
2.7. Cell culture in alginate beads
For the microscopy of chondrocytes in alginate beads, the cell suspension was adjusted to 4 × 10⁶ chondrocytes/mL in a sterile 1.2% alginate/0.9% sodium chloride solution, buffered by 1% HEPES. Beads were formed by addition to 0.1 M calcium chloride solution (5 mL/mL of cell-alginate suspension). About 1 × 10⁶ chondrocytes were incorporated in 18 alginate beads. The beads were divided into three batches and cultured (37 °C) under different gas phase O2 concentrations in a humidity-saturated atmosphere. Chondrocytes in alginate beads (18 beads/well, 24 wells-plate Nunclon, Invitrogen) were cultured with 1 g/L glucose during four weeks before observation in light microscopy, but with a change of the medium every three days. After sampling, the beads were washed two times with saline, and depolymerised in 1 mL of 0.1 M sodium citrate (prepared in saline equilibrated to the required O2 tension). The cells were then centrifuged for 15 min at 160 g, washed three times and submitted to microscopy.
For cell growth kinetics, the equine articular chondrocytes were cultured on alginate beads, too. After a two days period an aliquot was counted at different oxygen tensions (1%, 5% and 21% O2); the cells were adapted to

Published in : Cell Biology International (2007), vol. 31, pp. 878-886. Status : Postprint (Author’s version)
different glucose concentrations in the medium (0.1 or 4.5 g/L glucose). Aliquots were sampled and the chondrocytes counted at day 2, than every three days and the medium was changed at the same time.
2.8. Microscopy
To show the lipid inclusions in the cells, we used the Oil Red-O staining. 0.5 g Oil Red-O was dissolved in 30 mL of isopropanol and the total volume was adjusted to 50 mL with distilled water. The solution was filtered and stocked at 4 °C. A pellet of chondrocytes was transferred to an Eppendorff vial and covered with the Oil Red-O solution during 8 min. After centrifugation (3 min at 200 g), the cell pellet was recovered, rinsed by water and again centrifuged. Finally the stained chondrocytes were transferred to light microscopic observation. All microscopic observations were done with an Axioskop 20 (Zeiss).
2.9. Statistical analysis
Data were treated by Student's t test for paired values and by multivariate analysis (GLM-SAS program) for comparison between O2 and glucose conditions. Significance was set at p < 0.05.
3. Results
3.1. Viability of chondrocytes after isolation from articular cartilage and cell survival in suspension culture
After their isolation from cartilage, the viability of chondrocytes was >95%. Sufficient cells were isolated from all the biopsies to perform all assays at different oxygen and glucose concentrations. After 48 h of conditioning culture, the number of living chondrocytes remained stable, around 10 × 106 cells, except for a significant decrease at 21% O2 and 0 g/L glucose compared to chondrocytes cultured with 1.0 g/L glucose at either 21% O2 or 5% O2 (Fig. 1). The culture conditions of 5% and 1.0 g/L were the more physiologic ones: in these conditions the cell number remained stable (slight, but not significant increase), as it occurs in vivo (Murphy and Sambanis, 2001a).
Fig. 1. Counts of viable chondrocytes (mean ± SD) after 48 h of conditioning culture under variable O2 tensions and glucose concentrations in the medium.
3.2. Oxymetric assays
The O2 consumption rate was calculated as a function of time for each assay. The O2 consumption curves of chondrocytes (n = 3) were linear, with a very weak O2 consumption rate, independent from the glucose concentration of the culture medium and the conditioning culture conditions (Fig. 2 and Table 1). Before anoxia, the oxygen consumption rate values ranged from 0.046 to 0.133. An average O2 consumption rate by

Published in : Cell Biology International (2007), vol. 31, pp. 878-886. Status : Postprint (Author’s version)
chondrocytes was calculated around 20.5 pmol O2/ min/106 cells, 26 times lower than the O2 consumption of human promonocytes (THP-1 cells), which was 544 pmol/ min/106 cells (Fig. 3). After the anoxia period, there was an increase of the rate of the O2 consumption for cells conditioned at 21% O2, without modification of the shape of the curve: the mean value was significantly increased independently from the glucose concentration of the medium (Table 1). On the contrary, anoxia clearly decreased the O2 consumption rate of THP-1 cells and transformed the shape of the O2 consumption from a linear to a parabolic curve, a sign of cell respiration function alteration (Du et al., 1999) (Fig. 3).
Fig. 2. O2 consumption of 107 chondrocytes conditioned by a 48 h culture in suspension at 5% (I) or 21% (II) O2, and with variable glucose concentrations in the medium. Curve A: 0 g/L glucose; Curve B: 1.0 g/L glucose; Curve C: 4.5 g/L glucose. Double-headed arrows indicate the anoxia period (25 min). The left arrowhead indicates the moment of N2 bubbling and the right one the onset of re-oxygenation.

Published in : Cell Biology International (2007), vol. 31, pp. 878-886. Status : Postprint (Author’s version)
Table 1 Rate of O2 consumption by chondrocytes, expressed by the slope values (negative values) calculated from the oxymetric curves (mean ± SD). The curves were obtained for cells conditioned under 21 % or 5% O2 in the gaseous phase and variable glucose concentrations in the culture medium (n = 3 for each condition) Culture conditions Slope value (pmol O2/min) O2 (%) Glucose (g/L) Before anoxia After anoxia 21 0 0.083 ± 0.043 0.114 ± 0.006 1.0 0.081 ± 0.020 0.144 ± 0.046 4.5 0.092 ± 0.020 0.121 ± 0.012 Mean value for 21% O2 0.085 ± 0.027 0.129 ± 0.027* 5 0 0.082 ± 0.032 0.068 ± 0.044 1.0 0.105 ± 0.024 0.079 ± 0.020 4.5 0.106 ± 0.033 0.099 ± 0.020 Mean value for 5% O2 0.097 ± 0.029 0.082 ± 0.029 *p < 0.01 versus before anoxia.
Fig. 3. Comparison between O2 consumption (before and after anoxia) of 107 human promonocytes (THP-1 cell line) and 2.6 × 10 chondrocytes. The chondrocytes were conditioned for 48 h at 5% O2 and 1.0 g/L glucose in the culture medium prior to oxymetry. The double-headed arrows indicate the anoxia period. The promonocytes achieved spontaneous anoxia. For chondrocytes, anoxia was obtained by N2 bubbling.
3.3. Cytochrome c oxidase activity
The activity of the chondrocyte Cytochrome c oxidase (the O2 reducing complex of the respiratory chain) was measured after permeabilisation by Triton X-100. These cells were conditioned for 48 h at 5% O2 and 1.0 g/L glucose, and compared to the Cytochrome c oxidase activity of Triton X-100 treated THP-1 cells to verify if the differences in the respiration rate could be explained by different activities of this enzymatic complex. The values were 0.35 and 1.02 µmol oxidized Cytochrome c/min/106 cells for chondrocytes and THP-1, respectively, suggesting that the respiratory chain of the chondrocytes was functional and confirming their lower respiration rate compared to monocytes, though the activity of the chondrocyte Cytochrome c oxidase was more effective than we expected when considering the oxygen uptake during the oxymetric assays. This could indicate that the mitochondrial chain is partially blocked.
3.4. Glucose uptake and lactate production
The glucose uptake by 107 cells put in 2 mL of culture medium for a 2 h period is shown in Fig. 4 (n = 3). The available glucose was 11 µmol and 50 µmol in 2 mL of the medium, respectively, at 1.0 g/L and 4.5 g/L glucose. After oxymetry, the remaining glucose in the 2 mL was about 65-75%. The glucose uptake by the cells was significantly higher at 4.5 g/L glucose, independently from the O2 tension applied during the 48 h conditioning
Published in : Cell Biology International (2007), vol. 31, pp. 878-886. Status : Postprint (Author’s version)
culture.
The release of lactate was significantly higher for chondrocytes at 1.0 g/L glucose compared to 4.5 g/L glucose, independently from the O2 tension (n = 3) (Fig. 5).
Fig. 4. Glucose uptake (mean ± SD) by 107 chondrocytes during the oxymetry assay. The cells were conditioned for 48 h at 5% or 21% O2 and 1.0 or 4.5 g/L glucose in the medium.
Fig. 5. Lactate release (mean ± SD) by 107 chondrocytes during the oxymetry assay. Before oxymetry, the cells were conditioned for 48 h at 5% or 21% O2, and 1.0 or 4.5 g/L glucose in the medium.
3.5. Cell culture in alginate beads
Fig. 6 represents the cell growth kinetics of equine articular chondrocytes cultured in alginate beads for 11 days (n = 5). At the end of the culture period the cell number was the highest for cells cultured at 5% oxygen tension with 1 g/L or 4.5 g/L glucose. First the excess of glucose favored (day 5 or 8) the cell survival, but became deleterious at the end of the culture period. The medium containing 0 g/L glucose was harmful to the cells under

Published in : Cell Biology International (2007), vol. 31, pp. 878-886. Status : Postprint (Author’s version)
all oxygen tensions, too. The chondrocytes survived an O2 tension of 1%, but show more stable cell numbers with 1 g/L glucose than with an excess of 4.5 g/L.
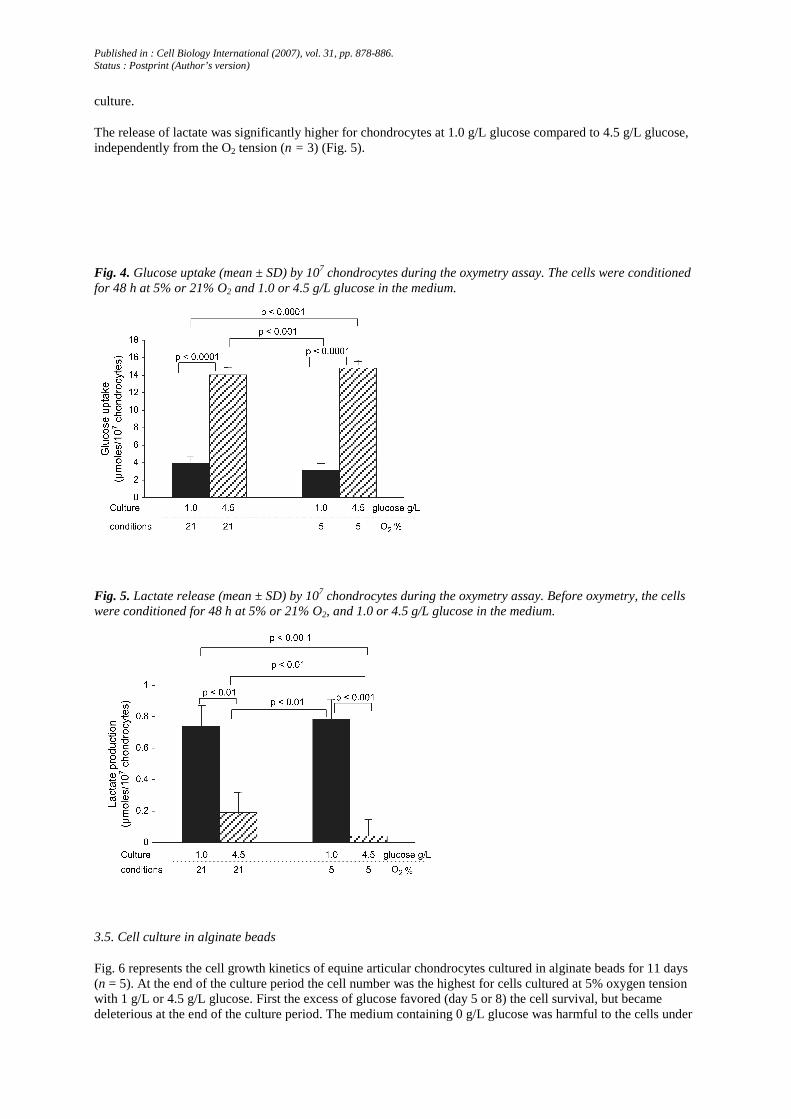
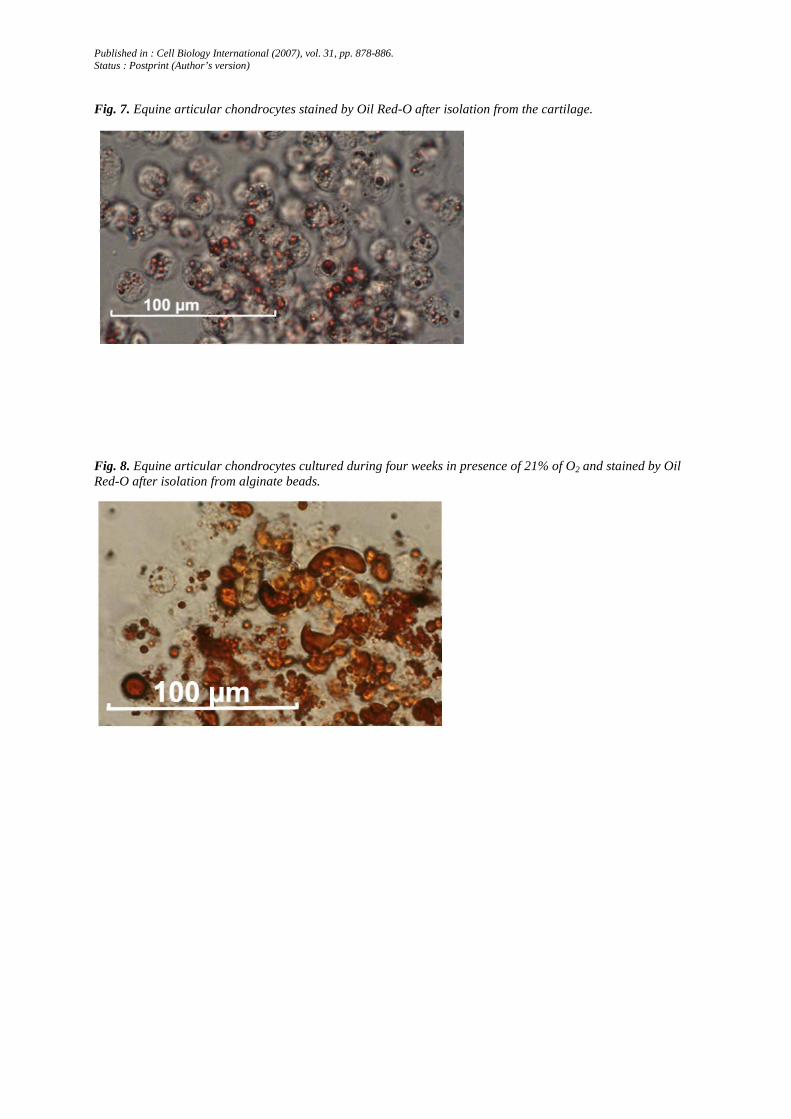
The microscopic pictures of the chondrocytes showed an increased accumulation of lipid material in the cytoplasm of chondrocytes in culture at 21% O2 compared to freshly isolated cells (Figs. 7-9).
Fig. 6. Evolution of equine chondrocytes number from day 2 to day 11 of culture in alginate beads at different O2 tensions (1%, 5% and 21%) and different glucose concentrations in the culture medium (0, 1.0 and 4.5 g/L) from day 2. The number of chondrocytes cultured at 5% O2 and 1 g/L glucose is set as 100% value as these conditions approach mostly the physiologic ones (n = 5). 1p < 0.005 versus 21% O2;
2p < 0.0005 versus 21 and 5% O2;
3p < 0.0001 versus 1% O2; 4p < 0.001 versus 1% O2;
5p < 0.005 versus 1% O2; and 6p < 0.005 versus 1% O2. There also existed the statistical differences mentioned below, but they were not introduced in order to preserve the legibility of the figure • at the 8th day of culture between: 21% O2 and 0 g of glucose versus 21% o2 and 4.5 g of glucose (p < 0.001); 21% O2 and Og of glucose versus 5% O2 and 1 g of glucose (p < 0.0001); 21% O2 and 4.5 g of glucose versus 1% O2 and 0 g of glucose (p < 0.0001); 5% O2 and 1 g of glucose versus 1% O2 and 0 g of glucose (p < 0.0005); 5% O2 and 4.5 g of glucose versus 1% O2 and 0 g of glucose (p < 0.0001); 5% O2 and 1 g of glucose versus 1% O2 and 4.5 g of glucose (p < 0.0005). • at the 11th day of culture between: 5% O2 and 1 g of glucose versus 1% O2 and 4.5 g of glucose (p = 0.0001).
Published in : Cell Biology International (2007), vol. 31, pp. 878-886. Status : Postprint (Author’s version)
Fig. 7. Equine articular chondrocytes stained by Oil Red-O after isolation from the cartilage.
Fig. 8. Equine articular chondrocytes cultured during four weeks in presence of 21% of O2 and stained by Oil Red-O after isolation from alginate beads.

Published in : Cell Biology International (2007), vol. 31, pp. 878-886. Status : Postprint (Author’s version)
Fig. 9. Equine articular chondrocytes cultured during four weeks in presence of 21% of O2: double staining by Oil Red-O and trypan blue after isolation from alginate beads.
4. Discussion
We designed a model of short duration anoxia/re-oxy-genation of equine chondrocytes, combined to the kinetic measurement of O2 consumption. This model was applied to chondrocytes that were cultured for 48 h under variable O2 tensions in the gaseous phase and with variable glucose concentrations in the culture medium (conditioning culture). During the conditioning culture period, the cell number remained stable at 1.0 g/L glucose indicating quiescent chondrocytes, a state considered as normal in vivo. The culture conditions corresponding nearly to the physiological conditions were as follows: 5% O2 and 1.0 g/L of glucose (Fig. 1). At 0 g/L glucose, the number of cells decreased whatever the O2 tension was, but the decrease reached statistical significance only for 21% O2 tension. These observations confirmed our previous results demonstrating the capacity of the chondrocytes cultured in alginate beads to survive at different O2 tensions until at least eight days of culture (Schneider et al., 2004) and the results of the new study of the mature equine articular chondrocytes in alginate beads during 11 days with different O2 and glucose concentrations (Fig. 6).
Because prolonged culture duration permits to the chondrocytes to rebuild their matrix and includes the risk of dedifferentiation (Murphy and Sambanis, 2001a; Murphy and Sambanis, 2001b), we choose a short period of suspension culture, as employed by other authors (Mathy-Hartert et al., 2005), to avoid the risk of dedifferentiation. The slight, but significant increase in oxygen uptake by chondrocytes cultured at 21 % O2 observed after the anoxia might already indicate a modified energy metabolism of cells. Indeed the very interesting observation of this study was the minimal O2 consumption of equine articular chondrocytes. For the chondrocytes, a very low respiration rate was calculated, 26-fold lower than that of human promonocytes in our experience. The THP-1 cells permitted us to verify if the low values we obtained for the chondrocytes could be due to a technical problem. But this was not the case, as the THP-1 cells showed a normal respiration pattern. Zhou et al. (2004) found an oxygen uptake rate for chondrocytes of maximum 10.81 nmol/106 cells/h, corresponding to 180.16 pmol/min/ 106, thus corresponding to aerobic cells like the thymic cells which consumed about 200 pmol 02/min/106 cells (Verlaet et al., 2002).
Many studies treating the oxygen uptake of chondrocytes (Marcus, 1973; Haselgrove et al., 1993; Moulton et al., 1997) with a diversity of results can be partially explained by the different origin of the cells or the immaturity of the cartilage. But Zhou et al. (2004) worked on bovine articular cartilage from 18 to 24 months old steers without preliminary culture period at 5% O2 tension and exposed the chondrocytes to 3 g/L glucose in the medium during oxymetry. Some authors used chondrocytes cell lines (Moulton et al., 1997), chondrocytes isolated from the ribs,

Published in : Cell Biology International (2007), vol. 31, pp. 878-886. Status : Postprint (Author’s version)
the nasal septum (covered throughout the lifetime by the perichondrium), the growth plate or the intervertebral disc [known to have a PO2 of only 2-8 mmHg in its deepest layers (Grimshaw and Mason, 2000)]. The mature hyalin articular cartilage is neither covered by a perichondrium nor contains vessels, and the articular cartilage depends on the synovial liquid to be fed. Only the immature articular cartilage contains blood vessels and its metabolism can hardly be compared to the mature cartilage because the chondrocytes are exposed to higher oxygen tensions diffusing from the vessels within the cartilage until the age of 7 months in thoroughbred horses (Fortier et al., 2005).
The first signs of the tide mark, typical for the adult equine articular cartilage appear only at the age of 15 months, and the tide mark is finally established at the age of 24 months — at this time the equine articular cartilage can be considered as mature. Domm et al. (2002) cultured mature articular chondrocytes on monolayer at 21% O2 and confirmed that the monolayer culture induced dedifferentiation of chondrocytes. The cells were then cultured in alginate beads for re-differentiation at either 21% or 5% O2; the authors observed that more chondrocyte-typical parameters were expressed by the cells cultured at 5% O2 compared to the cells at 21% O2 tension. The slow respiration rate of the chondrocytes indicated that mitochondrial oxidative phosphorylation contributed only for a limited amount to the energy supply in these cells and confirmed an anaerobic glycolysis as the principal source of ATP, independently from the culture conditions.
It has been reported that the chondrocyte mitochondria lack certain cytochromes and that the stimulation of glycolysis in articular cartilage is obtained by exogenous oxidants, which can be O2 in physiological conditions or other oxidant agents in the absence of O2 (Lee and Urban, 2002). We decided to measure the Cytochrome c oxidase activity and demonstrated that the isolated Cytochrome c oxidase activity level of chondrocytes was only three times lower than that of THP-1 (compared to the 26-fold inferior oxygen uptake). An incomplete mitochondrial chain at the level of the Cytochrome c oxidase is thus not an explanation for the low respiration rate of the equine chondrocytes. A question that merits further investigation is whether the post-anoxia increase in O2 uptake by articular chondrocytes conditioned at 21% O2 arose from an increased mitochondrial activity or from the triggering of cellular oxygenases or oxidases such as the NADPH-oxidase (Moulton et al., 1997). The cyclo-oxygenase 1 is only active at very basal levels hardly measurable in whole cells and the cyclo-oxygenase 2 (COX-2), again, is active after stimulation, but not in chondrocytes cultured at 5% O2 tension (Mathy-Hartert et al., 2005).
The normal rate of two lactate molecules produced for one glucose molecule consumed was not observed in our study; this favors the point of view that the chondrocytes have a very slow aerobic respiration which can be explained by the increased needs to build the glycosaminoglycans for the extracellular matrix, by an increased glycogen storage or, as shown by the Figs. 7-9, by an increased lipid storage. From the fact that the glucose disappeared from the medium, it cannot be concluded that it entered glycolysis automatically. Lane et al. (1977) examined cartilage slices cultured for seven days; their chondrocytes did not need to reconstitute an entire matrix and had more time to adapt to various oxygen tensions. Otherwise, their values of lactate production and glucose uptake can hardly be compared to ours as they refer to mg of dry weight (cartilage). Interestingly they mention that a group of researchers did not find the Pasteur effect (increase in glycolysis when decreasing oxygen concentration) in cartilage slices cultured directly after sacrifice.
Our chondrocytes conditioned at 21% did not show a significantly higher O2 uptake compared to the chondrocytes conditioned at 5% O2 prior to anoxia, what indicated that the cells did not adapt their respiration rate to the 21 % O2. It can be hypothesized that the conditioning culture period was not long enough to permit to the cells to become more responsive (consecutively to dedifferentiation) to the 21% O2 compared to the study by Grimshaw and Mason (2000) who kept their chondrocytes for seven days in culture. Heywood et al. (2006) found an increase of oxygen uptake by bovine articular chondrocytes at low glucose concentrations. Again, our results are different, probably because we worked with a lower number of cells and in other culture conditions.
After the anoxia period, the chondrocytes still showed a linear O2 consumption curve, with no change in the shape of the curve and only little modifications of the O2 consumption rate. A significant acceleration of the respiration rate was observed for the cells which were conditioned at 21% O2, independently from the glucose concentration of the medium, but this increase remained modest compared to the increase of the O2 consumption rate and the parabolic shape of the O2 consumption curve observed for the THP-1 cells submitted to anoxia/ re-oxygenation.
Equine articular chondrocytes thus consumed remarkably little O2, and survived to a deprivation of glucose during at least 48 h. This observation confirmed that, like chondrocytes of other animal species, equine chondrocytes must dispose of important lipid reserves and we hypothesize that chondrocytes can use these lipids

Published in : Cell Biology International (2007), vol. 31, pp. 878-886. Status : Postprint (Author’s version)
as energy source for survival under drastic conditions. Lee and Urban (2002) talked about oxidant compounds derived from glycolysis as adequate replacement instead of O2 as electron acceptors. From our results it can also be concluded that equine chondrocytes are quite insensitive to deep hypoxia (near anoxia), even in the absence of glucose. They are therefore relatively independent from a continuous nutrition by the synovial fluid and less sensible to transient lacks of glucose or O2. For this reason, a production of reactive oxygen species by this kind of cells consecutively to anoxia seems little probable. Indeed, we found out (Schneider et al., 2005) that the chondrocytes did not produce reactive oxygen species after repetitive cycles of anoxia/ re-oxygenation.
In vitro, the 21% O2 condition, currently used for chondrocytes culture and metabolism assays, represent hyperoxic conditions from a chondrocytes point of view (Mathy-Hartert et al., 2005). And hyperoxia is supposed to disturb the redox status of the cells (Schneider et al., 2004).
A surprising observation of the study was that the glucose consumption and lactate release by the cells were dependent on the glucose concentration of the medium and not on the O2 tension applied during the conditioning period. The glucose uptake ranged between 22% and 35% of the available glucose, was thus more important for the cells cultured with 4.5 g/L glucose, and did not significantly influence the respiration rate. A hypothesis can be presented to explain these observations. The presence of a high extracellular glucose concentration could activate glucose transporters and lead to, for example, a glucose storage, a hardly increased glycolysis, and a production of proteoglycans (Lee and Urban, 2002) and lipids. Otte described a glucose-induced decrease in O2
consumption (Crabtree effect) and observed that the glycolytic activity of the chondrocytes was limited (Otte, 1991), suggesting therefore that an excess of glucose could "poison" the cells. In cells exposed to 21% O2 tension we found more intracellular lipids compared to freshly isolated cells (Figs. 7-9).
This lipid accumulation suggests that pathways other than glycolysis, such as β-oxidation, could be implicated, because the glucose uptake was higher than the lactate release under all conditions. Lapadula et al. (1995) evaluated ultrastructural changes of chondrocytes in a model of osteoarthritis and they observed hypertrophic cells including increased lipid droplets. We must keep in mind that lactate storage was possible, but an excess of lactate would decrease the intracellular pH and lead to cell damage. Thus, the low O2 consumption rate excluded an increased respiration. Consecutively, we hypothesize again that the decrease of the lactate efflux that we observed for equine chondrocytes conditioned at 4.5 g/L glucose could be the result of an altered regulation of lactate or glucose pathway, by a nonphysiological extracellular glucose concentration. The high glucose uptake at 5% O2, associated to the lowest lactate level with a stable to growing cell numbers (Figs. 1 and 6), could partially be attributed to an increased need by cells, as more chondrocytes had to maintain their metabolism and cell division also requiring elevated levels of substrate to satisfy the energetic and structural needs.
Taken together, our results demonstrated clearly that, when we want to work reliably on equine articular chondrocytes, the easiest way to avoid metabolic changes of the cells should be to use a physiological glucose level in the culture medium. The changes in O2 tension and glucose concentration seem to already alter cellular metabolism for cells precultured for 48 h.
Acknowledgements
This study has been established with the support of the "Ministère de l'Agriculture et de la Ruralité de la Région Wallonne" as a part of a project led by the "Centre Européen du Cheval de Mont le Soie".
References
Dimock AN, Siciliano PD, McIlwraith CW. Evidence supporting an increased presence of reactive oxygen species in the diseased equine joint. Equine Vet J 2000;32:439-43.
Domm C, Schunke M, Christesen K, Kurz B. Redifferentiation of dedifferentiated bovine articular chondrocytes in alginate culture under low oxygen tension. Osteoarthritis Cartilage 2002;10:13-22.
Du G, Willet K, Mouithys-Mickalad A, Sluse-Goffart CM, Droy-Lefaix M-T, Sluse FE. EGb 761 protects liver mitochondria against injury induced by in vitro anoxia/reoxygenation. Free Radic Res Commun 1999;27: 596-604.
Ferell WR, Najafipour H. Changes in synovial PO2 and blood flow in the rabbit knee joint due to stimulation of the posterior articular nerve. J Physiol 1992;449:607-17.
Fortier LA, Kornatowski MA, Mohammed HO, Jordan MT, O'Cain LC, Stevens WB. Age-related changes in serum insulin-like growth factor-I, insulin-like growth factor-I binding protein-3 and articular cartilage structure in Thoroughbred horses. Equine Vet J 2005;37: 37-42.

Published in : Cell Biology International (2007), vol. 31, pp. 878-886. Status : Postprint (Author’s version)
Gonsalves M, Barker AL, Macpherson JV, Unwin PR, O'Hare D, Winlove CP. Scanning electrochemical microscopy as a local probe of oxygen permeability in cartilage. Biophys J 2000;78:1578-88.
Grimshaw MJ, Mason RM. Bovine articular chondrocyte function in vitro depends upon oxygen tension. Osteoarthritis Cartilage 2000;8:386-92.
Haselgrove JC, Shapiro IM, Silverton SF. Computer modeling of the oxygen supply and demand of cells of the avian growth cartilage. Am J Physiol 1993;265:C497-506.
Heywood HK, Bader DL, Lee DA. Rate of oxygen consumption by isolated articular chondrocytes is sensitive to medium glucose concentration. J Cell Physiol 2006;206:402-10.
James MJ, Cleland LG, Rofe AM, Leslie AL. Intraarticular pressure and the relationship between synovial perfusion and metabolic demand. J Rheumatol 1990;17:521-7.
Lane JM, Brighton CT, Menkowitz BJ. Anaerobic and aerobic metabolism in articular cartilage. J Rheumatol 1977;4:334-42.
Lapadula G, Nico B, Cantatore FP, La Canna R, Roncali L, Pipitone V. Early ultrastructural changes of articular cartilage and synovial membrane in experimental vitamin A-induced osteoarthritis. J Rheumatol 1995;22: 1913-21.
Lee MC, Kawai Y, Soji H, Yoshino F, Miyazaki H, Kato H, et al. Evidence of reactive oxygen species generation in synovial fluid from patients with temporomandibular disease by electron spin resonance spectroscopy. Redox Rep 2004;9:331-6.
Lee RB, Urban JP. Functional replacement of oxygen by other oxidants in articular cartilage. Arthritis Rheum 2002;46:3190-200.
Liberg P, Magnusson LE, Schougaard H. Studies on the synovia in healthy horse with particular reference to the protein composition. Equine Vet J 1977;9:87-91.
Malda J, Van Den Brink P, Meeuwse P, Grojec M, Martens DE, Tramper J, et al. The effect of oxygen tension on adult articular chondrocytes in microcarrier bioreactor culture. Tissue Eng 2004;10:987-94.
Marcus R. The effect of low oxygen concentration on growth, glycolysis, and sulfate incorporation by articular chondrocytes in monolayer culture. Arthritis Rheum 1973;16:646-56.
Mathy-Hartert M, Burton S, Deby-Dupont G, Devel P, Reginster JY, Henrotin Y. Influence of oxygen tension on nitric oxide and prostaglandin E2 synthesis by bovine chondrocytes. Osteoarthritis Cartilage 2005;13: 74-9.
McIlwraith CW. General pathophysiology of the joint and response to injury. In: McIlwraith CW, Wayne GW, editors. Joint disease in the horse. Philadelphia: W.B. Saunders Company; 1996. p. 40-70.
Mouithys-Mickalad A, Deby-Dupont G, Nys M, Lamy M, Deby C. Oxidative processes in Human Promonocytic Cells (THP-1) after differentiation into macrophages by incubation with Chlamydia pneumoniae extracts. Biochem Biophys Res Commun 2001;287:781-8.
Mouithys-Mickalad A, Mathy-Hartert M, Du G, Sluse F, Deby C, Lamy M, et al. Oxygen consumption and electron spin resonance studies of free radical production by alveolar cells exposed to anoxia: inhibiting effects of the antibiotic ceftazidime. Redox Rep 2002;7: 85-94.
Moulton PJ, Hiran TS, Goldring MB, Hancock JT. Detection of protein and mRNA of various components of the NADPH oxidase complex in an immortalized human chondrocyte line. Br J Rheumatol 1997; 36:522-9.
Murphy CL, Sambanis A. Effect of oxygen tension on chondrocyte extracellular matrix accumulation. Connect Tissue Res 2001a;42:87-96.
Murphy CL, Sambanis A. Effect of oxygen tension and alginate encapsulation on restoration of the differentiated phenotype of passaged chondrocytes. Tissue Eng 2001b;7:791-803.
Nehring D, Adamietz P, Meenen NM, Pörtner R. Perfusion cultures and modelling of oxygen uptake with three-dimensional chondrocyte pellets. Biotechnol Tech 1999;13:701-6.
Obradovic B, Meldon J. Glycosaminoglycan deposition in engineered cartilage: experiments and mathematical model. AlChE J 2000;46: 1860-71.
Otte P. Basic cell metabolism of articular cartilage. Manometric studies. Z Rheumatol 1991;50:304-12.
Sanchez C, Mateus MM, Defresne MP, Crielaard JM, Reginster JY, Henrotin YE. Metabolism of human articular chondrocytes cultured in alginate beads. Long term effects of interleukin 1beta and nonsteroidal anti-inflammatory drugs. J Rheumatol 2002;29:772-82.
Schneider N, Lejeune JP, Deby C, Deby-Dupont GP, Serteyn DA. Viability of equine articular chondrocytes in alginate beads exposed to different oxygen tensions. Vet J 2004;168:167-73.

Published in : Cell Biology International (2007), vol. 31, pp. 878-886. Status : Postprint (Author’s version)
Schneider N, Mouithys-Mickalad AL, Lejeune JP, Deby-Dupont GP, Hoebeke M, Serteyn DA. Synoviocytes, not chondrocytes, release free radicals after cycles of anoxia/re-oxygenation. Biochem Biophys Res Commun 2005;334:669-73.
Todhunter RJ, Lust G. Synovial joint anatomy, biology and pathobiology. In: Auer JA, editor. Equine surgery. Philadelphia: W.B. Saunders Company; 1992. p. 844-67.
Verlaet M, Duyckaerts C, Rahmouni S, Denis G, Humblet C, Greimers R, et al. Transient modifications of respiratory capacity in thymic cells during murine radioleukemogenesis. Free Radic Biol Med 2002;33: 76-82.
Zhou S, Cui Z, Urban JPG. Factors influencing the oxygen concentration gradient from the synovial surface of articular cartilage to the cartilage—bone interface. Arthritis Rheum 2004;50:3915-24.