oxy permian tour - occidental petroleum investordaymarch2… · 4 • 2.5 million net acres in the...
TRANSCRIPT

Oxy Permian TourDriving Value in the PermianMarch 10, 2017

2
Forward-Looking StatementsPortions of this presentation contain forward-looking statements and involve risks and uncertainties that could materially affect expected results of operations, liquidity, cash flows and business prospects. Actual results may differ from anticipated results, sometimes materially, and reported results should not be considered an indication of future performance. Factors that could cause results to differ include, but are not limited to: global commodity pricing fluctuations; supply and demand considerations for Occidental's products; higher-than-expected costs; the regulatory approval environment; reorganization or restructuring of Occidental's operations, not successfully completing, or any material delay of, field developments, expansion projects, capital expenditures, efficiency projects, acquisitions or dispositions; uncertainties about the estimated quantities of oil and natural gas reserves; lower-than-expected production from development projects or acquisitions; exploration risks; general economic slowdowns domestically or internationally; political conditions and events; liability under environmental regulations including remedial actions; litigation; disruption or interruption of production or manufacturing or facility damage due to accidents, chemical releases, labor unrest, weather, natural disasters, cyber attacks or insurgent activity; failure of risk management; changes in law or regulations; or changes in tax rates. Words such as “estimate,” “project,” “predict,” “will,” “would,” “should,” “could,” “may,” “might,” “anticipate,” “plan,” “intend,” “believe,” “expect,” “aim,” “goal,” “target,” “objective,” “likely” or similar expressions that convey the prospective nature of events or outcomes generally indicate forward-looking statements. You should not place undue reliance on these forward-looking statements, which speak only as of the date of this presentation. Unless legally required, Occidental does not undertake any obligation to update any forward looking statements, as a result of new information, future events or otherwise. Material risks that may affect Occidental’s results of operations and financial position appear in Part I, Item 1A “Risk Factors” of the 2016 Form 10-K.
Use of non-GAAP Financial InformationThis presentation includes non-GAAP financial measures. You can find the reconciliations to comparable GAAP financial measures on the“Investors” section of our website.
Cautionary Statements

3
$9.8
$1.3
$6.4
$1.0
$0
$2
$4
$6
$8
$10
Resources EOR
Wel
l Cos
t ($
MM
)
2014 2016
2016 Performance Exceeded Expectations
• Overall Permian CAGR 10%
> Base management
> Well productivity improvement
• Improved F&D 25%
> Increasing EURs
> Focused development synergies
• Reduced operating expense 27%
> Water management
> Reducing well failures
• Improved well costs by 33%
> Oxy Drilling Dynamics
> Integrated section development
Program F&D Cost*
Operating Expense Drilling & Completion
Production
222
269
0
50
100
150
200
250
300
2014 2016
mbo
e/d
Total Permian
$13
$21
$8
$17
$0
$5
$10
$15
$20
$25
Resources EOR$
/boe
2014 2016
$12
$9
$0
$2
$4
$6
$8
$10
$12
$14
2014 2016
$/b
oe
Total Permian
*Includes improved recovery, extensions, and discoveries related to capital program, no revisions or acquisitions
4
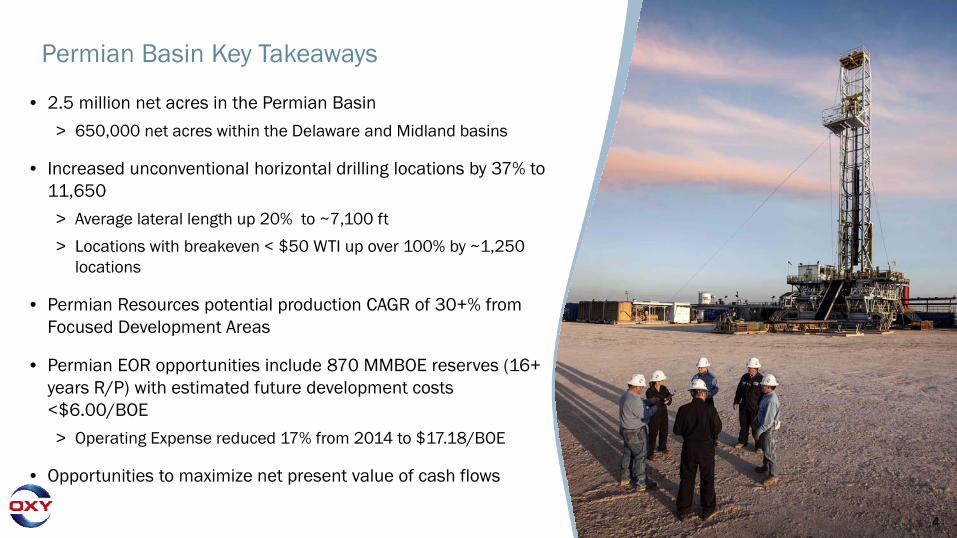
• 2.5 million net acres in the Permian Basin
> 650,000 net acres within the Delaware and Midland basins
• Increased unconventional horizontal drilling locations by 37% to 11,650
> Average lateral length up 20% to ~7,100 ft
> Locations with breakeven < $50 WTI up over 100% by ~1,250 locations
• Permian Resources potential production CAGR of 30+% from Focused Development Areas
• Permian EOR opportunities include 870 MMBOE reserves (16+years R/P) with estimated future development costs <$6.00/BOE
> Operating Expense reduced 17% from 2014 to $17.18/BOE
• Opportunities to maximize net present value of cash flows
Permian Basin Key Takeaways

5
-
50
100
150
200
250
300
350
400
OXY
CVX
PXD
APA
CXO
XOM
XEC
EOG
DVN EC
AEG
NFA
NG
COP PE LPI
APC
KM
ISH
ERID
ANSH
ELL
RSP
PSI
NO
CHEM BH
PW
PXPE
RM
RES
.EN
DEA
VOR
QEP
MTD
RSM NB
LLI
NN
CPE
LGCY EP
EAR
EXSS
UM
YH
ESS
CWEI
REN
CRZO
PER
MIA
N B
ASIN
NET
MB
OEP
D O
PER
ATED
PR
OD
UCT
ION
**
Liquids Gas
Oxy Permian
5
• Largest operated position in the Permian
• Exceptional subsurface characterization
• Proven value based development approach
• Improving through unique technology advancements
• 68% 4Q16 oil production
• Resources – Unconventional Areas 1.4 5,150 124 • Enhanced Oil Recovery Areas 1.1 19,310 145
Oxy Permian Total 2.5MM 24,460 269
Net Operated 2016 NetAcres Wells* ProductionOxy Permian Business Overview
*Gross Oxy operated wells including producers and injectors, and idle wells.**Source: Wood Mackenzie 2016 production, 3/2/17, company NWI% production rates, operators shown represent ~85% of Permian Basin daily production
Permian Basin Industry Production

6
The Permian Drives Oxy’s Value Proposition
DevelopmentCost
Opex G&A ProductionTaxes
Cash Costs
$16 - $19/BOE
Note: Estimated future project costs.
Improving top tier margins with recent operational and technical breakthroughs.
$6 - $12/BOE
DevelopmentCost
Opex G&A ProductionTaxes
Cash Costs
$6 - $10/BOE
$18 - $25/BOE
Permian EOR provides stable, free cash flow with minimal base decline.
~11,650 Undeveloped Drilling Locations ~2B Bbls Identified Undeveloped Resource
Permian Resources Permian EOR

7
Shaping Competitive AdvantageFull Cycle Value
• Unmatched acreage + infrastructure
• Resources – Dynamic Development
• EOR – Reservoir Management
• Subsurface excellence
• People, innovation & entrepreneurial culture
Reservoir Management
Operational Efficiency & Speed
Subsurface Technical Excellence
Field Development Planning + Execution
Enhanced Recovery

8
Permian Resources• Acreage and Inventory Update
• Problems Solved
• Problem Solving Now

9
Permian Resources
Significant acreage& growth potential in all development areas
~650,000 net acres within the Delaware and Midland Basin boundaries
~300,000 net acres associated with 11,650 wells in unconventional development inventory
• NM Delaware Basin 290,000
• TX Delaware Basin 150,000
• Midland Basin 210,000
Total ~650,000
NetAcres*Resources Basin Development Areas
• Central Basin Platform 215,000
• New Mexico NW Shelf 150,000
• Emerging Unconventional 50,000
• Continuing Evaluation 335,000
Total ~750,000
NetAcres*
Other Resources Unconventional Areas
• Resources – Unconventional Areas 1.4• Enhanced Oil Recovery Areas 1.1
Oxy Permian Total 2.5MM
NetAcres*Business Area Acreage
*Includes surface and minerals
NM Delaware Basin
TX Delaware Basin
Midland Basin
Central BasinPlatform
Permian Resources Acreage Permian EOR Acreage
New Mexico NW Shelf

10
Diversified Portfolio Provides High-Return and Significant Flexibility
Asset Portfolio Role Upside Potential
Southeast New Mexico
High return, low capital intensity for near-term growth and cash recycle
Acreage improvement for longer laterals and facilities optimization for multi-bench bench development
Greater Barilla Draw
High return, deep inventory of drill locations, complete infrastructure position
Continued full cycle cost improvement through operational and subsurface synergies from large acreage position
North New Mexico High confidence step-out development areas, replenishment source for high quality inventory
Acreage improvement for longer laterals and development scale. Appraise and delineate additional benches
East Midland Basin
De-risked multi-bench play with mature infrastructure for flexibleshort-cycle growth
Continued acreage improvement to create synergies of large development area
West Midland Basin
Long-term growth potential on large contiguous acreage position with significant flexibility
Technology applications and OBO intelligence to lower project breakeven price
Central BasinPlatform
Conventional low-decline development for long-term growth
Apply unconventional operationalcapabilities and EOR expertise to maximize recovery
North New Mexico
Greater Sand Dunes
East Midland Basin
Central Basin Platform
West Midland Basin
Greater Barilla Draw
2017 – 2019 Focused Resource Development Areas
Permian Resources Acreage Permian EOR Acreage

11
Improved Permian Resources Horizontal Inventory from 4Q2015
• Added 1,250 locations BE < $50
• Added 3,150 total locations
• Increased average length from 5,950’ to 7,100’
• Traded 10,000 net acres to enable longer lateral and consolidated facilities
• 14 years of inventory <$50 breakeven at a 10 rig development pace
0
2,000
4,000
6,000
8,000
10,000
12,000
BE <$50 BE<$60 BE <$70 AdditionalInventory
Total
~5,300
2015 Locations8,500
~11,650~11,650
~2,500
~4,100
2016 Added3,150
Texas Delaware
Basin
Midland Basin
New Mexico Delaware
Basin
Increased Total Horizontal Drilling Locations ~37%
*Breakeven values based on NPV10.
Locations within 300,000 of 650,000 net acres in Basin Development Areas

12*Wells where Oxy is a non-op working interest partner which provides access to all technical data.
New Mexico Acreage is Being De-Risked by the Industry
GOBBLER 5 B2PM STATE COM 1HMEWBOURNEBONE SPRINGLateral Length: 3,98630-day IP: 2,336 BOE/d (80% Oil)
1 5
IRRITABLE 22 STATE COM – 2HDEVONBONE SPRINGLateral Length: 4,17530-day IP: 1,401 BOE/d (74% Oil)
KLEIN 33 FEDERAL COME – 5HCIMAREXBONE SPRINGLateral Length: 6,74130-day IP: 3,351 BOE/d (69% Oil)
NOOSE FEDERAL COM – 9HCONCHOYESOLateral Length: 4,18030-day IP: 848 BOE/d (86% Oil)
STOVE PIPE FEDERAL COM – 2H*CONCHOBONE SPRINGLateral Length: 6,74530-day IP: 2,258 BOE/d (83% Oil)
GEM 36 STATE COM – 1H*EOGBONE SPRINGLateral Length: 4,47130-day IP: 2,314 BOE/d (58% Oil)
THRISTLE UNIT – 30HDEVONBONE SPRINGLateral Length: 9,39330-day IP: 2,199 BOE/d (85% Oil)
2
3
4
6
7
8
1
2
3
45
BLUE JAY FEDERAL 1-HCONCHOBONE SPRINGLateral Length: 4,15830-day IP: 2,258 BOE/d (82% Oil)
6
7
8
Greater Sand Dunes
Permian Resources Acreage Permian EOR Acreage
Source: IHS Enerdeq

13
Permian Resources 2017 Focused Development
• Contiguous Acreage
• Multi-bench
• Capable Infrastructure
• Valuable Growth Greater Barilla Draw – 5,000+ Locations
Greater Sand Dunes – 2,000+ Locations
Permian Resources Acreage Permian EOR Acreage
NM Delaware Basin
TX Delaware Basin
Midland Basin
Central BasinPlatform
New Mexico NW Shelf
14
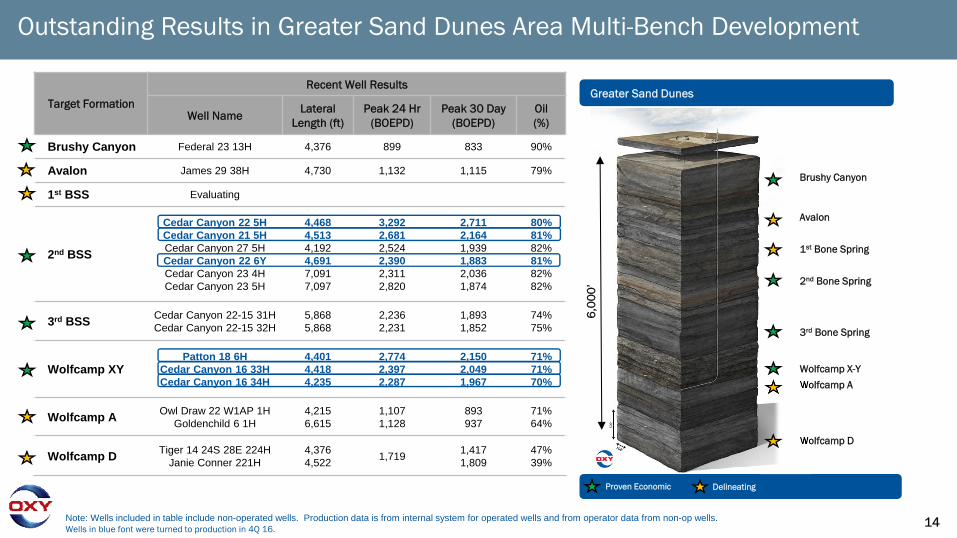
Target Formation
Recent Well Results
Well NameLateral
Length (ft)Peak 24 Hr
(BOEPD)Peak 30 Day
(BOEPD)Oil (%)
Brushy Canyon Federal 23 13H 4,376 899 833 90%
Avalon James 29 38H 4,730 1,132 1,115 79%
1st BSS Evaluating
2nd BSS
Cedar Canyon 22 5HCedar Canyon 21 5HCedar Canyon 27 5HCedar Canyon 22 6YCedar Canyon 23 4HCedar Canyon 23 5H
4,4684,5134,1924,6917,0917,097
3,2922,6812,5242,3902,3112,820
2,7112,1641,9391,8832,0361,874
80%81%82%81%82%82%
3rd BSS Cedar Canyon 22-15 31HCedar Canyon 22-15 32H
5,8685,868
2,2362,231
1,8931,852
74%75%
Wolfcamp XYPatton 18 6H
Cedar Canyon 16 33HCedar Canyon 16 34H
4,4014,4184,235
2,7742,3972,287
2,1502,0491,967
71%71%70%
Wolfcamp A Owl Draw 22 W1AP 1HGoldenchild 6 1H
4,2156,615
1,1071,128
893937
71%64%
Wolfcamp D Tiger 14 24S 28E 224HJanie Conner 221H
4,3764,522 1,719 1,417
1,80947%39%
Note: Wells included in table include non-operated wells. Production data is from internal system for operated wells and from operator data from non-op wells.Wells in blue font were turned to production in 4Q 16.
Barilla Draw Type LogGreater Sand Dunes
Proven Economic Delineating
Outstanding Results in Greater Sand Dunes Area Multi-Bench Development
Brushy Canyon
Avalon
1st Bone Spring
2nd Bone Spring
3rd Bone Spring
Wolfcamp X-Y
Wolfcamp A
Wolfcamp D
6,0
00’

15
Target Formation
Recent Well Results
Well NameLateral
Length (ft)Peak 24 Hr
(BOEPD)Peak 30 Day
(BOEPD)Oil (%)
Avalon Evaluating
1st Bone Spring Evaluating
2nd Bone Spring Roan State 24 #51HAardvark State 6 2H
4,5144,947
9931,254
762821
83%87%
3rd Bone Spring Big George 180 SW 3H 7,576 759 571 57%
Wolfcamp A
Buzzard State Unit #16HPeck State 258 #6H
Buzzard State Unit #15HLenox 2 #5H
Eagle State 28 #13H
7,7004,2127,5984,7214,250
2,0502,2442,0192,4251,958
1,8221,7911,7641,5061,505
74%82%73%71%69%
Wolfcamp DFOppenheimer 188 1H
Nyala Unit 9B #3HOppenheimer 188 2H
Teller 186 1H
4,5006,5754,7764,681
2,4511,5351,5471,707
1,9071,2471,3401,263
82%83%82%81%
Wolfcamp B
Manhattan 183W 1HDaytona Unit 1B 2H
Black Bear State 11 NE #3H
Iron Mike 40 SE 2H
7,0446,9476,935
7,376
1,9541,8971,215
1,703
NA15441,124
1,416
73%79%85%
76%
Wolfcamp C Lemur 24 1H 4,251 1,125 937 81%
Note: Wells included in table include non-operated wells. Production data is from internal system for operated wells and from operator data for non-op wells. Well highlighted in blue is most recent well put online by Oxy from newly acquired acquisition area.
Barilla Draw Type LogGreater Barilla Draw – Drilled 228 Wells Across 8 Benches
Proven Economic Delineating
Improving Results in Greater Barilla Draw Area Multi-Bench Development
Avalon
1st Bone Spring
2nd Bone Spring
3rd Bone Spring
Wolfcamp A
Wolfcamp DF
Wolfcamp C
4,5
00’
Wolfcamp B

16
0
2
4
6
8
10
12
14
16
18
-
50
100
150
200
250
300
2017 2018 2019
Growth Potential of 30+% from Focused Development Areas
• Top-tier well performance
• Deep inventory for range of activity
• Infrastructure to support growth
• Core development areas drive capital efficient growth
• 2017 Capital of $1.0 to $1.4 Bn
Prod
uctio
n (m
boed
)
Multi-Year Permian Resources Growth Potential
Rig
Cou
nt
20% CAGR
30% CAGR
Base rig count* Upside rig count*
6
8
9
*Includes estimated net non-operated rigs
9
1415

17
Permian Resources• Acreage and Inventory Update
• Problems Solved
• Problem Solving Now

18
2014 2017E
2014 2017E
DevelopmentCost
Operating Cost
$7 - $9
Infrastructure
DevelopmentPlanning
SurveillanceBase Management
SubsurfaceCharacterization Stimulation
Design
CustomizedTechnology
Permian Resources Development Costs Per BOE
Permian Resources Operating Costs Per BOE
Problems Solved in the Permian – Adding It All Up
• Cost structure dramatically driven lower since 2014
• Value Drivers:
> Subsurface Characterization
> Stimulation Design
> Customized Technology
> Development Planning
> Infrastructure
> Oxy Drilling Dynamics
> Integrated Planning
> Base Management
DevelopmentPlanning
Infrastructure
$6 - $12

Planning19
Subsurface Characterization Adds Value• Problem: Subsurface uncertainties &
unknowns to predict resource potential
> Sweet spots
> Frac barriers
> Landing zones
• Solutions: Customized subsurface characterization & expertise
> Seismic integration
> Data acquisition
> Models
• Maximize and capture resource potential
Schematic Representation of 2nd Bone Spring Sand Well Placement
2nd Bone Spring Net Sand Thickness and Middle Carbonate Outline
Seismic Interpretation of Middle Carbonate Inside 2nd Bone Spring Sand
A
A A’
Landing + Stimulation + Spacing Optimization
A A’
A’Middle Carb. Outline

Planning20
Subsurface Characterization Adds Value• Problem: Subsurface discontinuity
differentiates stimulation impacts
> Oil left behind
> Frac interference
> Landing zones
• Solutions: Customized subsurface stimulation modeling
> Calibrated stimulation design
> Maximized stimulated rock volume
> Technical type curves
• Maximize economic recovery
Customized Stimulation Design and Landing Selection
2nd Bone Landing and Frac OptimizationA A’
Scenario A B C D

Results21
2nd Bone Spring Optimization ResultsCustomized Technical Excellence Adds Value
0
50
100
150
200
250
300
0 30 60 90 120 150 180
Cum
ulat
ive
MB
OE
4,5
00
ftLa
tera
ls
Days Online
4Q 2016 Wells 1H 2016
Old Design -2014
3Q 2016
2nd Bone Spring Improvements
~150% 6 month cumulative production improvement from old design
• 150% Improved productivity
• Best Bone Spring wells in Eddy Co, NM
• Results continue to improve
1,479
1,227
400
800
1,200
1,600
BO
D
Average normalized 30-day oil peak rate2016 Bone Spring wells, Eddy Co., New Mexico
Peers2016
OXY2016
OXY4Q16
Play Leading Bone Spring Oil Results
Source: IHS Enerdeq and Oxy Internal. Peers listed alphabetically: Bopco, CVX, Cimarex, CXO, DVN, EOG, Mewbourne, WPX. Data normalized to 5,000 ft equivalent.

Planning22
Technology Staircase - Setting The Bar HigherCustomized Technical Excellence Adds Value
Integrated Subsurface Analysis
Stim Design
Drilling Dynamics
+10K Laterals
Single Location Sequenced Laterals –SL2
Play-Leading Wells
Other custom solutions:
• Drilling wellbore design
• Facilities
• Flowback process
• Artificial lift
• Operating maintenance
Planning23
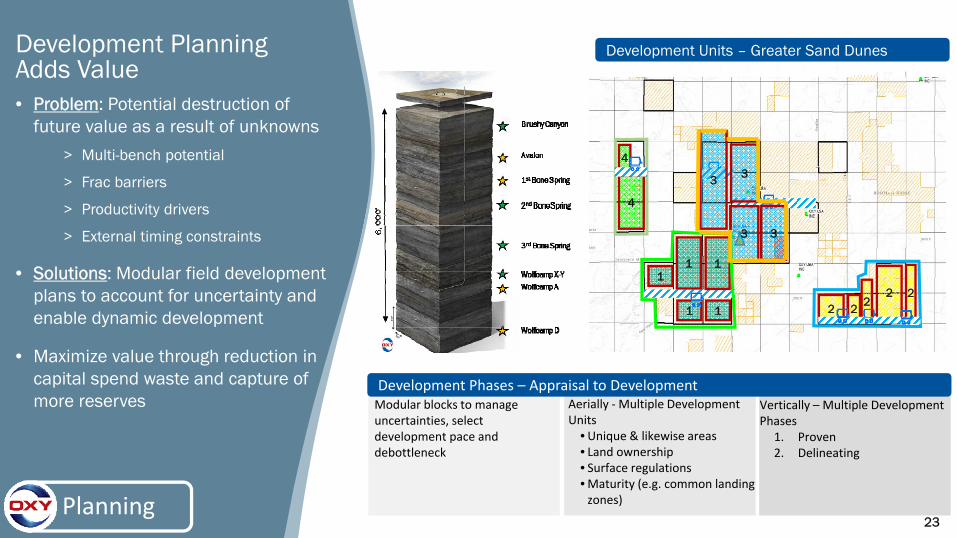
4
4
1
1 1
11
2 22
22
Development Units – Greater Sand DunesDevelopment Planning Adds Value• Problem: Potential destruction of
future value as a result of unknowns
> Multi-bench potential
> Frac barriers
> Productivity drivers
> External timing constraints
• Solutions: Modular field development plans to account for uncertainty and enable dynamic development
• Maximize value through reduction in capital spend waste and capture of more reserves
Development Phases – Appraisal to DevelopmentModular blocks to manage uncertainties, select development pace and debottleneck
Aerially ‐Multiple Development Units
•Unique & likewise areas• Land ownership• Surface regulations•Maturity (e.g. common landing zones)
Vertically – Multiple Development Phases
1. Proven2. Delineating
3
3 3
3

Execution24*BHA = bottom hole assembly
Oxy Drilling Dynamics Adds Value• Problem: Inefficient use of rig
energy resulting in slow and higher cost drilling
> Downhole tool failures
> Wellbore quality
• Solutions: Oxy Drilling Dynamics
> Proprietary Oxy MSE equation
> Reduced drilling days
> Fewer tool failures
> Precision landing
• Maximize value through better time to market and precision landing
Step Changing Performance
Identify Understand Engineer Implement
Bit Vibration
Increase BHA* St i ffness
Pump Pressure
Alternative Dr i l l P ipe
Directional Control
Weight Transfer
Redesign Bi t
Re-Engineer BHA*
Weight on Bit
Rat
e of
Pen
etra
tion
(ft/
hr)
31
22
1612
30%
28%
25%
Drilling Days 7,500’ Lateral(Rig Release to Rig Release)
Real Time Monitoring from Anywhere

Execution25
0
20
40
60
80
100
120
140
Jan Mar May Jul Sep Nov Jan Mar Sep Nov Jan Jul Sep Nov
2014 2015 2016
Expected 2017 range with normalized rig-to-frac ratio
Rig Release to Well Online
Day
s• Implementation resulted in 5,000
production days above the baseline plan.
Integrated Planning Adds Value• Problem: Delay in production and
cash flows due to complex operations and planning
> Multiple unaligned schedules
• Solutions: Implemented Integrated Master Schedule
> Optimized sequence of events reducing “flat time”
• Maximize Value through better time to market and securing pricing and supply of services
• 2017 additions to process
> Increased granularity of well prep, clean-out, and pre-spud activities
> Focus on efficient resources utilization

Execution26
Surveillance and Base Management Adds Value
• Oxy operates 24,460 wells in the Permian Basin
• Company operated production of 235 MboepdNet (EOR and Unconventional)
• Long-term operability is critical
> Well design
> Drilling quality wells
> Artificial lift optimization
> Mechanical integrity
• Oxy finds significant value upside in base optimization
• Oxy can operate large base at low opex
> Offset fixed costs of high well count with operational expertise
-
2.0
4.0
6.0
8.0
10.0
1Q 16 2Q 16 3Q 16 4Q 16
Cum
ulat
ive
Net
MB
OEP
D
2016 Permian Resources Base Optimization
Total Operated Wells
OXY 1 2 3 4 5 6 7 8 9 10 11 12 13
Major and Large Cap Peers
Permian Pure-Play PeersPeers (alphabetical) include: APA, COP, CPR, CVX, CXO, EOG, FANG, LPI, MPI, MTD, PE, RSP, XOM. Source : IHS Enerdeq

27
2014 2017E
2014 2017E
DevelopmentCost
Operating Cost
$7 - $9
Infrastructure
DevelopmentPlanning
SurveillanceBase Management
SubsurfaceCharacterization Stimulation
Design
CustomizedTechnology
Permian Resources Development Costs Per BOE
Permian Resources Operating Costs Per BOE
Problems Solved in the Permian – Adding It All Up
• Cost structure dramatically driven lower since 2014
• Value Drivers:
> Subsurface Characterization
> Stimulation Design
> Customized Technology
> Development Planning
> Infrastructure
> Oxy Drilling Dynamics
> Integrated Planning
> Base Management
DevelopmentPlanning
Infrastructure
$6 - $12
28
Permian Resources• Acreage and Inventory Update
• Problems Solved
• Problem Solving Now

29
0
2,000
4,000
6,000
8,000
10,000
12,000
BE <$50 BE<$60 BE <$70 AdditionalInventory
Total
~5,300
2015 Locations8,500
~11,650~11,650
~2,500
~4,100
2016 Added3,150
Texas Delaware
Basin
Midland Basin
New Mexico Delaware
Basin
Lower Breakeven Cost Through Innovative Problem Solving
*Breakeven values based on NPV10Locations within 300,000 of 650,000 net acres in Basin Development Areas
SS Characterization +Dev. Plans + Technology
Innovation expected to offset cost inflation and move more locations to lower breakevens

30
• Single Location Sequenced Laterals - SL2> Single vertical well bore producing from multiple zones
> Reduce section development cost
> Initial studies and development began mid-2015 with pilot currently underway
> Potential cost impact per well of $0.5 - $1.0 mm
• Subsurface characterization update with data analytics> Identify production drivers
> High-grade inventory and improve field development plans
• Oxy Drilling Dynamics update with analytics > Better wells faster
• Logistics Hubs> Integrated partnerships with service contractors
> Protect margins
Solving Permian Problems NowSL2

Appendix

32
Key Messages
33
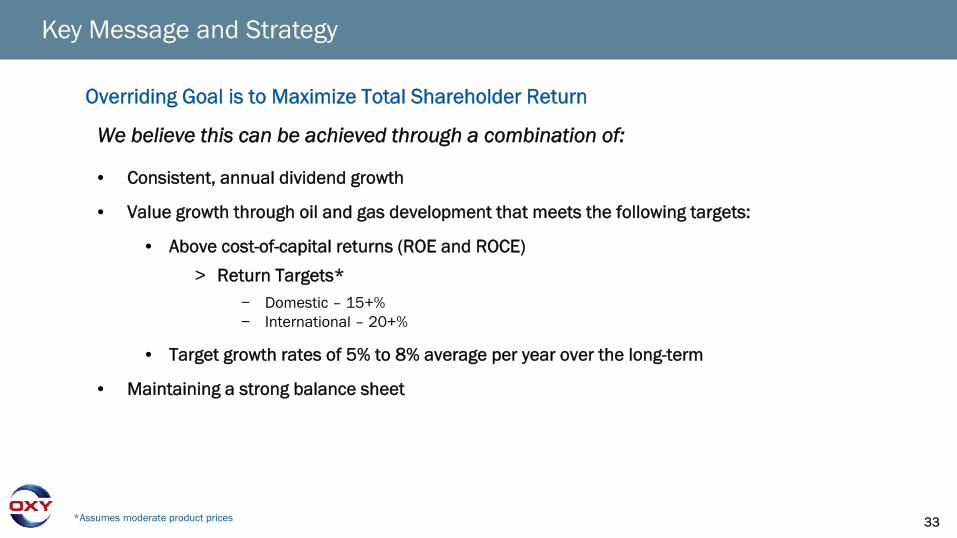
Overriding Goal is to Maximize Total Shareholder Return
We believe this can be achieved through a combination of:
• Consistent, annual dividend growth
• Value growth through oil and gas development that meets the following targets:
• Above cost-of-capital returns (ROE and ROCE)
> Return Targets*− Domestic – 15+%− International – 20+%
• Target growth rates of 5% to 8% average per year over the long-term
• Maintaining a strong balance sheet
33*Assumes moderate product prices
Key Message and Strategy
34
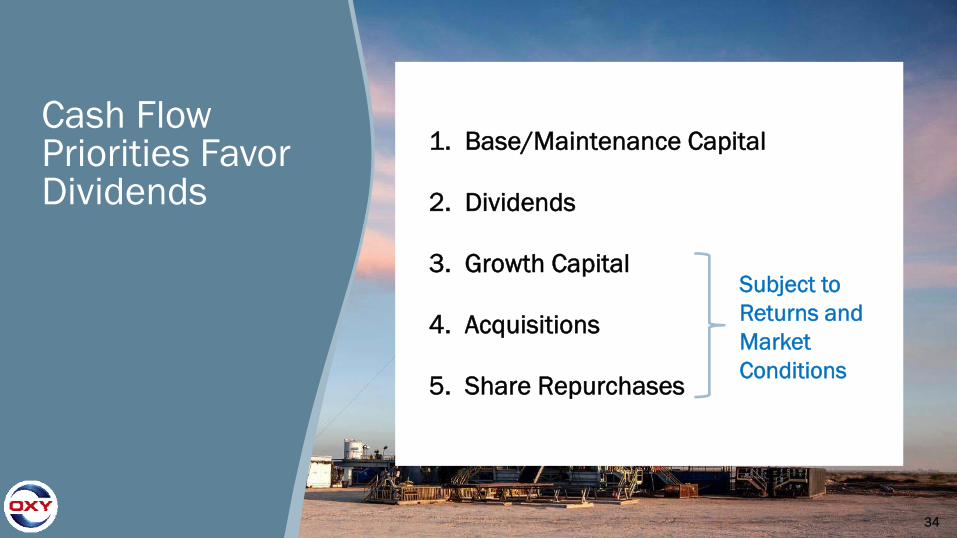
1. Base/Maintenance Capital
2. Dividends
3. Growth Capital
4. Acquisitions
5. Share Repurchases
Subject to Returns and Market Conditions
Cash Flow Priorities Favor Dividends

35
Production GrowthFY 2016
Total Company All-Sources F&D
Permian Resources Production Growth FY
2016
Total Company Reserve Replacement
Ratio
Permian Resources Reserve Replacement
Ratio
7%
290%
189% $9.65
13%$9.00
Permian Resources Program F&D
22%Permian Resources Well
Costs Reduction
25%Permian Resources
Operating Costs Reduction
2016 Highlights
Low-cost Production Growth Exceeds Target
Capital Program Under $3 billion Target
Strong Balance Sheet and Ample Liquidity
Permian Basin Acquisitions Adds Development Flexibility and Cost Synergies

36
Oil and Gas Core Areas
• Leading position in the Permian
• Permian Resources is a growth driver
United States
Latin America• Highest margin operations in Colombia
• Opportunities for moderate growth with partners
Middle East Region• Focus areas – Oman, Qatar, and UAE
• Opportunities for growth with partner countries
Focused Businesses
OxyChem
High FCF, moderate growth business
Midstream
Integratedinfrastructure and marketing business to maximize realizations

37
Oxy Operating adds over $600mm of expected future NPV10
to the Greater Barilla Draw Area
Increased working interest from 26% to 100%
Increased working interest from 26% to 63%
• Increased acreage position to 100,000 net acres & 5,000+ horizontal locations
• Capability to deploy 3 rigs in 2017 and 5+ rigs in 2018+ on acquisition acreage
• Scale allows for operational and subsurface synergies
• Operatorship adds immediate value
– Lower well costs
– Better productivity
– Operating capability
• Unconstrained high value growth capability
*Note: Assumes 5-6 wells per zone per section and future upside potential with downspacing**Note: NPV10 calculation assumes a modest 3 rig pace with $500K/well cost improvement, $0.50 / boe opex improvement and 10% well productivity improvement from the prior operator.
Q4 Acquisition Highlights
Growing the Greater Barilla Draw Area

38
Operating Highlights

39
Production Growth Exceeded Guidance
* Ongoing operations; excludes Piceance, Iraq and Bahrain production volumes* Ongoing operations; excludes Piceance, Iraq and Bahrain production volumes
Total Company Production*
(MBOED)
565
602
2015 2016
~7% Growth Y/Y
110
124
2015 2016
Permian Resources Production
(MBOED)
~13% Growth Y/Y

40
• Internal performance metric to focus on operational efficiency, especially in consideration of the sharp decline in commodity prices
• Significant portion of management and employees incentive compensation is directly aligned with this performance metric
• Focuses on efficiency, improved margins, and free cash flow generation
• Designed to help manage reduction in overall spending while rewarding production growth
Total Spend per BOE = Capital Spending* + G&A + All Operating Costs
Global Oil & Gas Sales Volumes
$40.00
2014 2015 2016
$28.37
~$62.00
2016 Accomplishments - Total Spend per BOE Achieved Target
*Excludes cost of acquisitions

41
2016 Reserve Additions Through Reservoir Performance
~505 MMBOE Reserve Additions prior to price revisionsTotal
Company Reserve
Replacement 2016
189% All In
150% Organic
YE 2015Reserves
Production* Additions Acquisitions& Sales
YE 2016Reserves
2,200 (231)
3462,40691
~77% Proved
Developed
~74% Liquids
All reserves are in Mmboe. *2016 production includes Bahrain and Iraq.

42
• Improved productivity and lower well costs in Permian Resources drive improved profitability
• Pre-tax margins > 50% at $50 / bbl oil prices
Improved Margins in Permian Resources Attracting Investment
DevelopmentCost
Opex G&A ProductionTaxes
Cash Costs
$16 - $19 / boe
Permian Resources Cost Structure

43
• Design and efficiency to secure well costs
• Improving well costs despite increasing stimulation designs> Total Permian Resources reduced cost / 1,000 ft of lateral by 30% from
2015 to $1.07 MM
Lower Well Costs Are Sustainable Through Design and Performance Gains
Oxy New Mexico 2nd Bone Spring Well Cost Improvement
1Q15 Design Performance Market Current Design AdditionalPerformance
Market 2017Target
$8.5+$0.5 -$1.9
-$0.5 $6.6 $0.0 -$0.9+$0.2 $5.9• 1,100 lbs/ft sand
• 16 frac stages• 75,000 bbl Hybrid
• 1,700 lbs/ft sand• 19 frac stages• 165,000 bbl SW
Note: Well cost analysis based on New Mexico 2nd Bone Spring 4,500 type well. Costs include drilling, completion, hookup, initial flow-back, artificial lift, and capitalized overhead.
2017 Focus Areas
• Reduction of drilling non productive time through focused development
• Improve execution of new stimulation designs
• Flowback management
• Produced water utilization for frac

44
Proven Leader in Maximizing Recovery Across the Permian
0
500
1,000
1,500
2,000
Future Development Cost <$6Future Development Cost <$10Additional Unconventional Inventory TotalAdditional Conventional Inventory
Total Identified Barrels
<$10 <$6
Permian EOR Net Resource Potential
MM
BO
E
CO2 Floods
TZ/ROZ*Water Floods +
Other Infill Drilling
Opportunities
High-gradable Inventory
*Note: TZ/ROZ – Transition Zone and Residual Oil Zone
Permian EOR
Significant inventory in 10-year plan
Geographically diverse
100 active CO2 + water floods covering multiple horizons
2 BBOE of identified net resource potential
870 net MMBOE at < $6.00 Future Development Cost
Future Development Cost ($/BOE)
Permian EOR Acreage
Delaware Basin
Midland Basin
Central BasinPlatform
45
0
500
1,000
1,500
2,000
2,500
3,000
3,500
Gro
ss B
OPD
South Hobbs Unit Production and CO2 Flood Forecast
SOUTH HOBBS TARGETS 5 per. Mov. Avg. (SOUTH HOBBS)
Waterflood
Phase 1 CO2Flood
Reservoir Management
$0
$5
$10
$15
$20
$25
2014 2015 2016
$/B
OE
0
100
200
300
400
500
600
2016 TargetCapex
2016 ActualCapex
$M
M
Opex Reduction Capital Efficiency
Downhole Maintenance InjectantSurface, Energy and Other Facilities and Well Work Drilling
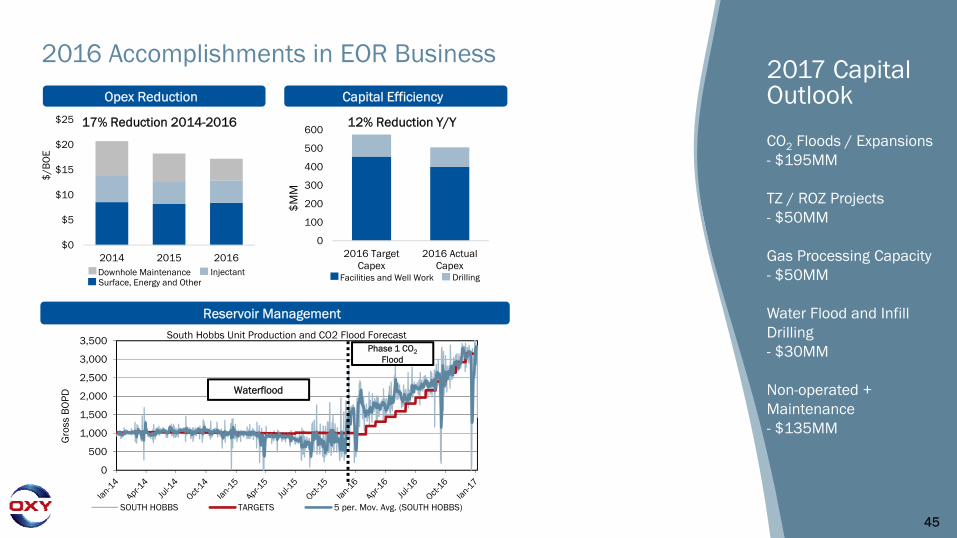
12% Reduction Y/Y17% Reduction 2014-2016
2016 Accomplishments in EOR Business2017 Capital Outlook
CO2 Floods / Expansions - $195MM
TZ / ROZ Projects - $50MM
Gas Processing Capacity - $50MM
Water Flood and Infill Drilling - $30MM
Non-operated + Maintenance - $135MM

46
Corpus Christi
Nederland
Mid‐Valley240 kb/d
McCamey
Crane
Midland
Houston
Wink
ColoradoCity
Ho‐Ho Pipeline
Oxy owned
Oxy is a major shipper
Cushing
HOFTCO Terminal
Ingleside Terminal
• Ample takeaway capacity to reach multiple markets and to drive improved price realizations
• Blending capabilities allow for optimization
Access to Multiple Markets Through Midstream Investments

Execution47
Produced Water FacilityWater Injection
Lea County
Eddy County
Oil Pipeline
2016+ Development Area11 Centralized Tank Batteries4 Disposal Wells2 Compressor Stations2 Frac Ponds
2017+ Development Area34 Centralized Tank Batteries15 Disposal Wells2 Compressor Stations2 Frac Ponds
2016 Highlights 2017 Highlights
• Oil Pipeline with expansion capability
– 30+ mi of pipeline– 90+ Mbopd capacity
• Produced Water Re-cycling Facility
– 36,000 bwpd treatment
• Frac Water Storage– 2 MMbw storage capacity
Infrastructure Adds Value – Greater Sand Dunes
• Integrated SWD System– 100+ mi. of pipeline– 90+ Mbwpd injection capacity
• Gas Compression add– 50+ MMcfpd
• Gas Processing Connections– 4 x 3rd party gas processing
connections in area

48
Shipments from Ingleside export facility
2017 Impact
• Free cash flow expected to improve $150 -$200+ MM due to better marketing economics and ramp up of Ingleside oil storage and export facility
• Ample takeaway capacity and new outlet for Permian oil production
Business Segments
• Gas Plants: Natural gas and CO2gathering, compression and processing systems to control upstream costs
• Pipelines - Domestic: Take-away capacity via common carrier oil pipeline and storage systems, including Centurion pipeline, CO2 source fields and pipeline systems
• Pipelines - Foreign: Stable free cash flow from Dolphin natural gas pipeline
• Power Generation: Lower cost electricity through power and steam generating facilities
• Marketing & Trading: market production at highest realizations; includes Ingleside export facility
Midstream: Improving Cash Flows and Market Access

49
• Ingleside Ethylene Cracker commercial operation in Q1 2017> All systems turned over for commissioning
• 50/50 JV with Mexichem in Corpus Christi, TX> $1.5 Billion for a 1.2 Billion lb/yr cracker, pipeline to
Markham, TX and storage
> 20-year supply agreement with Mexichem
• OxyChem capital spend will continue to decline in 2017> Capital spend for cracker will be reduced from $160 mm in
2016 to $35 mm in 2017
> Growth business spending in 2017 will also include capital for an expansion to a plant in Geismar, LA to produce climate-friendly refrigerants (4CPe)0
100
200
300
400
500
600
700
2011 2012 2013 2014 2015 2016 2017
Maintenance Other Capital Spending New Business Spending
Ingleside Ethylene Cracker – September 2016
$m
mChemicals Free Cash Flow to Significantly Increase

50
Spot Domestic Caustic Soda Price** Low end of price range as reported by IHS
• Caustic soda prices reversed their multi-yeartrend of steady decline in mid-2016
• Global caustic soda demand forecasted to outstrip capacity increases again in 2017
> European mercury technology conversion/closure deadline December 2017
• Higher energy prices will erode some of the impact of higher caustic soda prices
$200
$250
$300
$350
$400
$450
Olin35%
OxyChem24%
Westlake18%
Rest of Industry
23%
North American Chlor-Alkali Capacity Share
• Major industry consolidation iscomplete after several years of M&A activity
• Protracted poor financial performance in the industry is improving market discipline
Basic Chemical Market Dynamics Are Shifting

51
~79% Proved
Developed
~74% Liquids
• Improved Reservoir Surveillance
• Infill and shallow drilling
programs
• 2016 Total Spend per Barrel
reduced by 24%
• Next Generation Drilling Platforms
> Sustainable savings
> No lift barge needed
> Local Construction
> Flexibility of installation
115
120
125
130
135
140
Jun-
16
Jul-1
6
Aug-
16
Sep-
16
Oct
-16
Nov
-16
Dec
-16
Oman - Mukhaizna Gross Production (Mbopd)
ISND
Oman
Qatar
Oman Mukhaizna
Record Monthly Production
Qatar
Well Cost reduced by 30%
52
~79% Proved
Developed
~74% Liquids
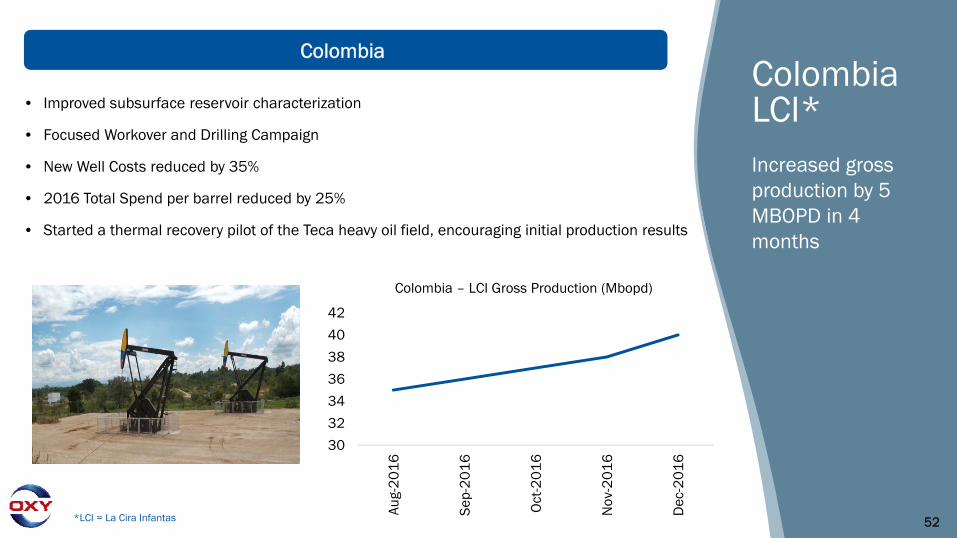
• Improved subsurface reservoir characterization
• Focused Workover and Drilling Campaign
• New Well Costs reduced by 35%
• 2016 Total Spend per barrel reduced by 25%
• Started a thermal recovery pilot of the Teca heavy oil field, encouraging initial production results
30
32
34
36
38
40
42
Aug-
20
16
Sep-
20
16
Oct
-20
16
Nov
-20
16
Dec
-20
16
Colombia – LCI Gross Production (Mbopd)
*LCI = La Cira Infantas
ColombiaColombia LCI*Increased gross production by 5 MBOPD in 4 months

5353
Al Hosn Gas
• Optimized plant to deliver more capacity
• Completed operational trials
• Minimal capital was required
Al Hosn Gas
Increased Plant Capacity to 110%
2017 production expected to be >70 MBOED net

54
2017 Outlook

55
• Domestic> Increased Permian Resources drilling in SE New
Mexico and Greater Barilla Draw> Short cycle development allows for flexibility to
respond to oil price volatility
• International> Spending levels in Middle East will be flat
• Chemicals > Includes project for manufacturing next-generation,
climate-friendly refrigerants; expected completion by YE 2017
• Midstream> Crude gathering system and intermediate
transportation to support SE New Mexico growth
2017 Capital Plan Will Deliver 4% to 7% Production Growth
$3.0 $3.6
Flexible Capital Program ($ in billions)
International Exploration & Other
Midstream Chemicals
Permian EOR Permian Resources

56
2017 vs 2016FCF Improvement
International O&G ~$400 MMMidstream $150 - $200 MMChemicals ~$400 MMTotal $950 - $1,000 MM
• Improved market conditions, project start-ups and lower capital should increase free cash flow generation in 2017
Free Cash Flow Improvement

57
• Improved product prices> Annualized cash flow changes ~$100 million for a ~$1.00 / barrel change in oil prices
> Annualized cash flow changes ~$45 million for a ~$0.50 / Mmbtu change in natural gas prices
• Improved chemicals performance> Annualized cash flow changes ~$30 million for a ~$10 / ton change in caustic soda prices
> Start-up of ethylene cracker
• Additional sources of liquidity in 2017 - 2018 of ~$2 billion including:> Anticipated tax refund of ~$700 million in 1H17
> Monetization of non-strategic corporate assets
> Portfolio management & optimization
Cash Flow Improvements Expected in 2017

58
Oil & Gas Segment • FY 2017E Total Production
> 625,000 – 645,000 BOED
> Permian Resources production of 140,000 – 150,000 BOED
• 1Q17E Production
> Total production of 590,000 – 595,000 BOED
> Permian EOR production flat
> Permian Resources production of 127,000 – 132,000 BOED
> International production impacted by ~15,000 BOED for turnarounds, PSCs and quota compliance
Production Costs – FY 2017E
• Domestic Oil & Gas: ~$13.00 / BOE
Exploration Expense
• ~$25 mm in 1Q17E
DD&A – FY 2017E
• Oil & Gas: ~$15.00 / BOE• Chemicals and Midstream: $685 mm
Midstream
• ($60) – ($70) mm pre-tax loss in 1Q17E
Chemical Segment
• ~$150 mm pre-tax income in 1Q17E
Corporate
• FY 2017E Domestic tax rate: 36% • FY 2017E Int'l tax rate: 55%• Interest expense of $80 mm in 1Q17E
1Q17 and FY 2017 Guidance Summary

59
• Total production grew 13% year-over-year to 124 MBOED
• Increased activity in 4Q 2016> 16 wells online in 4Q16 vs. 9 in 3Q16> Added 7 top tier performing wells in Greater Sand Dunes
• 1Q17 program: increase in activity expected in 1Q17> 2 rigs added in January 2017> 6 operated rigs drilling primarily development wells> Expect to drill 26 wells and put online 21 wells in 1Q17
• 2017 program: expect 117 wells online> Program will be focused in Greater Sand Dunes and
Greater Barilla Draw, with 2-3 rigs in each on average
Permian Resources Results and Guidance
43 71 77
75
110 124 127- 132
140 - 150
2014 2015 2016 1Q17 2017E
Production (MBOED)
Oil NGL Gas
E