oxidative clearing of polyester cotton blended fabric by ... · oxidative clearing of polyester...
TRANSCRIPT

Oxidative Clearing of Polyester Cotton Blended Fabric by Hydrogen Peroxide: An Alternative to
Reduction ClearingAbul Fazal Mohammad Fahad Halim1*, Ajoy Roy1, Mohammad Muzammel Hossen2 and Arpan Chakma2
1Department of Textile Engineering, Bangladesh2Department of Textile Engineering, China
Abstract
Reduction clearing is commonly carried out as an after-treatment to remove deposits of disperse dye and other residual impurities from the surface of dyed polyester. Because of certain environmental and economical disadvantages associated with traditional reduction clearing, there is industrial interest in alternative processes. In this study the P/C blended fabric was dyed with disperse dyes in grey state and then treated with H2O2 at different concentration for oxidation clearing. Another process was carried out conventionally where pre-treated P/C blended fabric was dyed with disperse dyes and reduction cleared. Fabrics from both processes were dyed with reactive dyes. The performance was evaluated through as-sessing the changes in absorbency, Kubelka-monk theory (K/S value), wash fastness, rubbing fastness, bursting strength test and by comparing the obtained results. The overall results showed that, the test results of oxidation clearing process were quite like reduction clearing process. But after reactive dyeing oxidation cleared samples showed better results than reduction cleared samples.
Keywords: Reduction clearing; Oxidative clearing; PC; Disperse dye; Reactive dye
Introduction
Polyester (polyethylene terephthalate, PET) fibres have emerged as having a leading share among natural and synthetic fibres when production and consumption of different fibres in the world is compared. It enjoys this dominant position due to its desirable properties, the most important of which are versatility and ease of use. It is also blended with natural fibres such as cotton and wool, mainly due to these characteristics, which are lacking in most natural fibres. Polyester and its blends find applications in a range of markets, such as apparel, upholstery and work wear as well as technical textiles, for example, non-woven. Polyester is dyed with disperse dyes. Disperse dyes are non-ionic molecules with limited solubility in water at room temperature. They are usually applied to polyester from a fine aqueous dispersion at relatively high temperatures where the solubility in water becomes enough to allow individual molecules in solution to come into contact with the fibres. Polyester fibres are relatively hydrophobic with a highly crystalline structure and are consequently difficult to dye at low temperatures.
Dyeing is generally carried out at high temperatures, often around 130 °C, above a temperature referred to as the dyeing transition temperature, which is closely aligned with the glass transition temperature and where higher segmental mobility of the polymer chains enables the dye molecules to penetrate the fibre. Because of the low solubility of disperse dyes in water and the tendency for particles in the dye dispersion to aggregate during dyeing, some residual dye commonly remains on the fibre surface at the end of the dyeing phase. These surface deposits may have an adverse effect on the colour fastness and properties of the dyed fabrics, if present, and an after treatment to remove them is generally introduced into the dyeing process. The washing process which is used traditionally to remove the deposits of disperse dye from the surface of the polyester after dyeing is referred to as reduction clearing. This process involves treatment of the dyed polyester with an aqueous solution of a reducing agent in alkaline conditions [1-4]. Because of the hydrophobic character of polyester and since the process is conducted below the glass transition temperature, the reducing agent and alkali,
Crimson PublishersWings to the Research
Research Article
*Corresponding author: Abul Fazal Mohammad Fahad Halim, Department of Textile Engineering, Bangladesh
Submission: May 07, 2019Published: June 11, 2019
Volume 5 - Issue 2
How to cite this article: Abul F M F H, Ajoy R, Mohammad M H, Arpan C. Oxidative Clearing of Polyester Cotton Blended Fabric by Hydrogen Peroxide: An Alternative to Reduction Clearing. Advancements Bioequiv Availab.5(2). TTEFT.000608.2019. DOI: 10.31031/TTEFT.2019.05.000608.
Copyright@ Abul Fazal Mohammad Fahad Halim, This article is distributed under the terms of the Creative Commons Attribution 4.0 International License, which permits unrestricted use and redistribution provided that the original author and source are credited.
ISSN: 2578-0271
615Trends in Textile Engineering & Fashion Technology

616
Advancements Bioequiv Availab Copyright © Abul Fazal Mohammad Fahad Halim
TTEFT.MS.ID.000608. 5(2).2019
both ionic species, cannot penetrate the interior of the polyester. Thus, only dye on the surface is removed while dye molecules that have diffused into the polymer during dyeing remain unaffected [5].
In addition to the dye, there may be surface deposits of oligomers, which are only soluble in water at the dyeing temperature and may crystallize as a white powder on the fabric and in dyeing machinery as the dyebath is cooled. These oligomers may also be removed by the clearing process. Reduction clearing is of technical importance in polyester dyeing in order to improve the brightness of the colour and the fastness properties of the dyed fabric, especially to wet treatments. There are, however, certain environmental, technological and economic disadvantages associated with the traditional reduction clearing process. The environmental disadvantage of the process is that it generates sulphur-containing degradation products derived from sodium dithionite which appear in the effluent with potentially toxic effects, notably sulphite, sulphate and thiosulphate. Wastewater containing sulphites and sulphates are corrosive and can cause severe damage in waste lines. The oxidation products of sodium dithionite may also cause oxygen depletion in water streams resulting in an increase in chemical oxygen demand. Another technical issue is the sensitivity of sodium dithionite to air oxidation in an alkaline medium at high temperatures, so that an excess is used to compensate for the loss. In addition, the after treatment requires pH adjustment from the acidic conditions during dyeing to the strongly alkaline clearing conditions for reduction clearing, followed by a final neutralization, and this increases the time and cost of the overall dyeing process. Nevertheless, reduction clearing currently retains industrial importance especially for medium to heavy depths of shade, for package dyeing and the dyeing of loose fibres. In addition, it is important in the dyeing of polyester microfibers which require more dye than regular denier fibres to achieve equivalent depth [6].
Experimental Equipment
In this project we used Datacolor Ahiba IR (James H Heal Co Ltd, UK), Datacolor SF650 Benchtop Spectrophotometer, Hydraulic Diaphragm Bursting Strength Tester (Mesdan, Italy), Gyro Wash Machine (James H Heal Co Ltd, UK), Crock Meter (James H Heal Co Ltd, UK), Grey Scale SDC, England).
Materials and Methods
The fabric was collected from Mymun Textiles Ltd. (DBL Group) Table 1 Chemicals used for pre-treatment NaOH 40g/mol (Merck, India), H2O2 34g/mol, stabilizer SOF (Switzerland), wetting agent (Archroma Bd Ltd.), EDTA (Archroma Bd Ltd.), Non-ionic detergent (Archroma Bd Ltd.), Disperse dye T/D: Red EFB (Dysin-Chem Ltd., china), Anionic Dispersing agent Setamol WS, Anionic levelling agent (Jintex, Taiwan), Acetic acid 60.05g/mol (Vosol), Sodium acetate anhydrate as buffer 82.03g/mol, Reactive red-D-2B bifunctional, mono-azo type (Dysin-Chem Ltd., china), Soda ash 106g/mol (Merck, India), Sodium sulphate anhydrous 142.04g/mol (Merck, India), Sodium hydrosulphate solid, Sulphuric acid (95-97%), Meta Cresol 108.14g/mol (Merck, India), Direct dye blue (Dysin-Chem Ltd., china)(Figure 1).
Figure 1: Research methodology.
Table 1: Specification of fabric.
Type 60/40 PC blend knitted fabric
Wales Per Inch (WPI) 34
Course Per Inch (CPI) 58
Yarn Count (Ne) 38
G.S.M 120
Results and Discussion
Data analysis of pretreated samples (Table 2; Figure 2-5)
The results show that, after combine Scouring and bleaching weight loss percentage was higher because more impurities removed in combined scouring and bleaching process which results in increased absorbency. After combined scouring and bleaching whiteness index increased and yellowness index decreased as natural color of fabric [7] destroyed during bleaching. After combined scouring and bleaching wicking height is increased to 80mm and immersion time is decreased to 3.2 second. After combined scouring and bleaching impurities had been removed that is why wicking height increased as well as immersion time decreased. After combined scouring and bleaching strength loss percentage was increased. This is because after combined scouring and bleaching the fabric strength is reduced due to treatment with hydrogen peroxide.

617
Trends Textile Eng Fashion Technol Copyright © Abul Fazal Mohammad Fahad Halim
TTEFT.MS.ID.000608. 5(2).2019
Table 2: Weight loss (%), Whiteness Index (WI), Yellowness Index (YI), Wicking Test, Immersion Test, Drop Test, Strength Loss (%) of Differently Treated Fabric
Fabric Type Weight Loss% WI YI
Wicking Test
(MM)
Immer-sion Test (sec)
Drop Test Strength Loss
Detergent washed fabric 0.36 70.13 4.88 71 4.2 Even and Complete 1.03
Combined scoured and bleached fabric 1.81 78.98 2.9 80 3.2 Even and Complete 3.17
Figure 2: Weight loss (%) of differently treated fabric.
Figure 3: Whiteness index (WI) and yellowness index (YI) of differently treated fabric.
Figure 4: Strength loss (%) of differently treated fabric.
Figure 5: Wicking test and immersion test of diff.
Analysis of conventionally treated samples
Data analysis of process-1 disperse dyed samples (Table 3, Figure 6): The results show that, the color strength is increased with shade percentage. It can be explained that, with the increasing of shade percentage, dye concentration increases that is why K/S value increased.
Figure 6: Color strength of disperse dyed process-1 samples.
Table 3: Color Strength of Disperse Dyed Process-1 Samples
Shade% K/S Value
1 3.759
1.5 4.389
2 4.991
2.5 5.709
618
Advancements Bioequiv Availab Copyright © Abul Fazal Mohammad Fahad Halim
TTEFT.MS.ID.000608. 5(2).2019
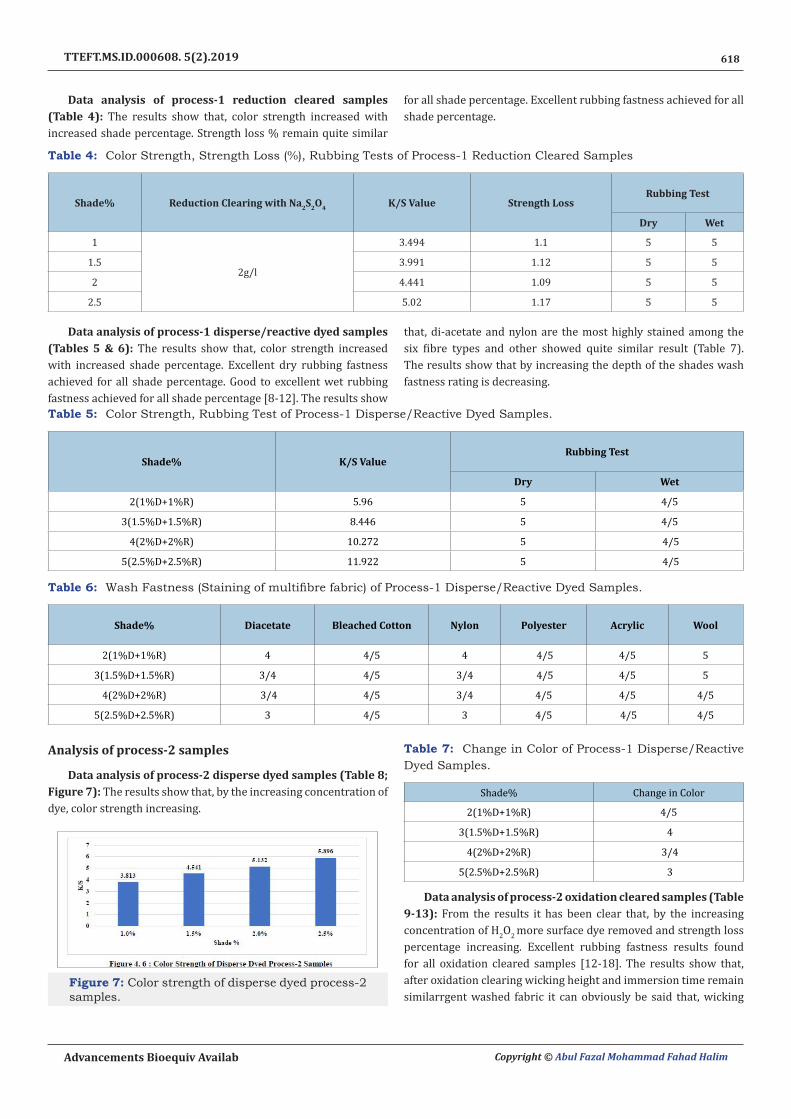
Data analysis of process-1 reduction cleared samples (Table 4): The results show that, color strength increased with increased shade percentage. Strength loss % remain quite similar
for all shade percentage. Excellent rubbing fastness achieved for all shade percentage.
Table 4: Color Strength, Strength Loss (%), Rubbing Tests of Process-1 Reduction Cleared Samples
Shade% Reduction Clearing with Na2S2O4 K/S Value Strength LossRubbing Test
Dry Wet
1
2g/l
3.494 1.1 5 5
1.5 3.991 1.12 5 5
2 4.441 1.09 5 5
2.5 5.02 1.17 5 5
Data analysis of process-1 disperse/reactive dyed samples (Tables 5 & 6): The results show that, color strength increased with increased shade percentage. Excellent dry rubbing fastness achieved for all shade percentage. Good to excellent wet rubbing fastness achieved for all shade percentage [8-12]. The results show
that, di-acetate and nylon are the most highly stained among the six fibre types and other showed quite similar result (Table 7). The results show that by increasing the depth of the shades wash fastness rating is decreasing.
Table 5: Color Strength, Rubbing Test of Process-1 Disperse/Reactive Dyed Samples.
Shade% K/S ValueRubbing Test
Dry Wet
2(1%D+1%R) 5.96 5 4/5
3(1.5%D+1.5%R) 8.446 5 4/5
4(2%D+2%R) 10.272 5 4/5
5(2.5%D+2.5%R) 11.922 5 4/5
Table 6: Wash Fastness (Staining of multifibre fabric) of Process-1 Disperse/Reactive Dyed Samples.
Shade% Diacetate Bleached Cotton Nylon Polyester Acrylic Wool
2(1%D+1%R) 4 4/5 4 4/5 4/5 5
3(1.5%D+1.5%R) 3/4 4/5 3/4 4/5 4/5 5
4(2%D+2%R) 3/4 4/5 3/4 4/5 4/5 4/5
5(2.5%D+2.5%R) 3 4/5 3 4/5 4/5 4/5
Analysis of process-2 samples
Data analysis of process-2 disperse dyed samples (Table 8; Figure 7): The results show that, by the increasing concentration of dye, color strength increasing.
Figure 7: Color strength of disperse dyed process-2 samples.
Table 7: Change in Color of Process-1 Disperse/Reactive Dyed Samples.
Shade% Change in Color
2(1%D+1%R) 4/5
3(1.5%D+1.5%R) 4
4(2%D+2%R) 3/4
5(2.5%D+2.5%R) 3
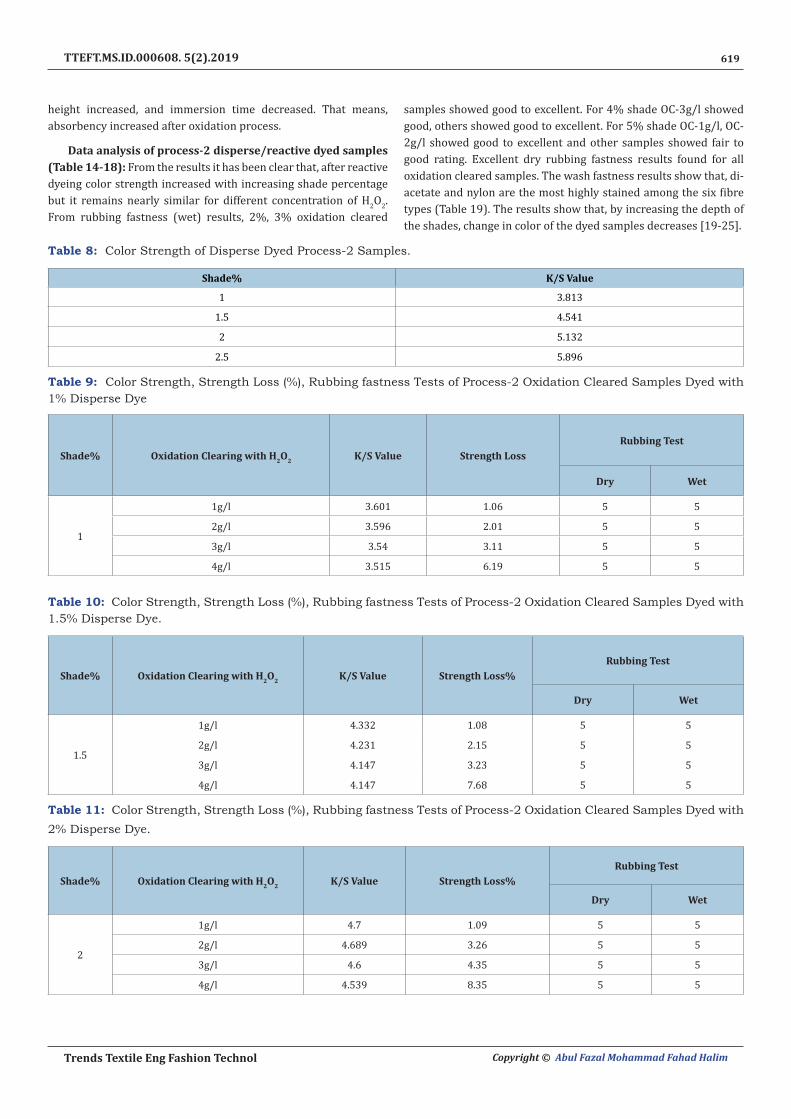
Data analysis of process-2 oxidation cleared samples (Table 9-13): From the results it has been clear that, by the increasing concentration of H2O2 more surface dye removed and strength loss percentage increasing. Excellent rubbing fastness results found for all oxidation cleared samples [12-18]. The results show that, after oxidation clearing wicking height and immersion time remain similarrgent washed fabric it can obviously be said that, wicking
619
Trends Textile Eng Fashion Technol Copyright © Abul Fazal Mohammad Fahad Halim
TTEFT.MS.ID.000608. 5(2).2019
height increased, and immersion time decreased. That means, absorbency increased after oxidation process.
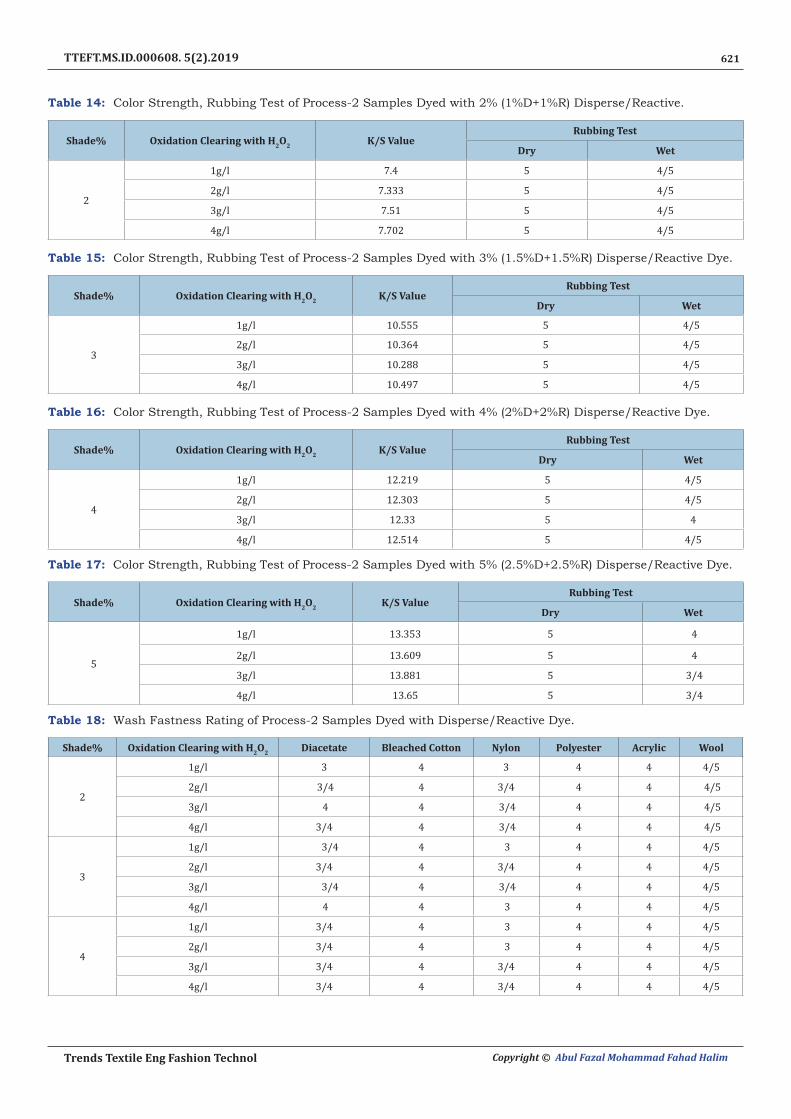
Data analysis of process-2 disperse/reactive dyed samples (Table 14-18): From the results it has been clear that, after reactive dyeing color strength increased with increasing shade percentage but it remains nearly similar for different concentration of H2O2. From rubbing fastness (wet) results, 2%, 3% oxidation cleared
samples showed good to excellent. For 4% shade OC-3g/l showed good, others showed good to excellent. For 5% shade OC-1g/l, OC-2g/l showed good to excellent and other samples showed fair to good rating. Excellent dry rubbing fastness results found for all oxidation cleared samples. The wash fastness results show that, di-acetate and nylon are the most highly stained among the six fibre types (Table 19). The results show that, by increasing the depth of the shades, change in color of the dyed samples decreases [19-25].
Table 8: Color Strength of Disperse Dyed Process-2 Samples.
Shade% K/S Value
1 3.813
1.5 4.541
2 5.132
2.5 5.896
Table 9: Color Strength, Strength Loss (%), Rubbing fastness Tests of Process-2 Oxidation Cleared Samples Dyed with 1% Disperse Dye
Shade% Oxidation Clearing with H2O2 K/S Value Strength LossRubbing Test
Dry Wet
1
1g/l 3.601 1.06 5 5
2g/l 3.596 2.01 5 5
3g/l 3.54 3.11 5 5
4g/l 3.515 6.19 5 5
Table 10: Color Strength, Strength Loss (%), Rubbing fastness Tests of Process-2 Oxidation Cleared Samples Dyed with 1.5% Disperse Dye.
Shade% Oxidation Clearing with H2O2 K/S Value Strength Loss%Rubbing Test
Dry Wet
1.5
1g/l 4.332 1.08 5 5
2g/l 4.231 2.15 5 5
3g/l 4.147 3.23 5 5
4g/l 4.147 7.68 5 5
Table 11: Color Strength, Strength Loss (%), Rubbing fastness Tests of Process-2 Oxidation Cleared Samples Dyed with 2% Disperse Dye.
Shade% Oxidation Clearing with H2O2 K/S Value Strength Loss%Rubbing Test
Dry Wet
2
1g/l 4.7 1.09 5 5
2g/l 4.689 3.26 5 5
3g/l 4.6 4.35 5 5
4g/l 4.539 8.35 5 5

620
Advancements Bioequiv Availab Copyright © Abul Fazal Mohammad Fahad Halim
TTEFT.MS.ID.000608. 5(2).2019
Table 12: Color Strength, Strength Loss (%), Rubbing fastness Tests of Process-2 Oxidation Cleared Samples Dyed with 2.5% Disperse Dye.
Shade% Oxidation Clearing with H2O2 K/S Value Strength Loss%Rubbing Test
Dry Wet
2.5
1g/l 5.4 1.26 5 5
2g/l 5.365 3.52 5 5
3g/l 5.225 5.02 5 5
4g/l 5.139 8.51 5 5
Table 13: Absorbency of oxidation cleared samples.
Shade% Oxidation Clearing with H2O2 Wicking Height (mm) Immersion Time (Sec) Drop Test
1
1g/l 90 2.38 Even and Complete
2g/l 89 2.45 Even and Complete
3g/l 90 2.35 Even and Complete
4g/l 91 2.19 Even and Complete
1.5
1g/l 92 2.11 Even and Complete
2g/l 89 2.43 Even and Complete
3g/l 88 2.56 Even and Complete
4g/l 90 2.37 Even and Complete
2
1g/l 86 2.75 Even and Complete
2g/l 88 2.61 Even and Complete
3g/l 89 2.43 Even and Complete
4g/l 91 2.23 Even and Complete
2.5
1g/l 90 2.33 Even and Complete
2g/l 91 2.2 Even and Complete
3g/l 93 2.03 Even and Complete
4g/l 91 2.29 Even and Complete
621
Trends Textile Eng Fashion Technol Copyright © Abul Fazal Mohammad Fahad Halim
TTEFT.MS.ID.000608. 5(2).2019
Table 14: Color Strength, Rubbing Test of Process-2 Samples Dyed with 2% (1%D+1%R) Disperse/Reactive.
Shade% Oxidation Clearing with H2O2 K/S ValueRubbing Test
Dry Wet
2
1g/l 7.4 5 4/5
2g/l 7.333 5 4/5
3g/l 7.51 5 4/5
4g/l 7.702 5 4/5
Table 15: Color Strength, Rubbing Test of Process-2 Samples Dyed with 3% (1.5%D+1.5%R) Disperse/Reactive Dye.
Shade% Oxidation Clearing with H2O2 K/S ValueRubbing Test
Dry Wet
3
1g/l 10.555 5 4/5
2g/l 10.364 5 4/5
3g/l 10.288 5 4/5
4g/l 10.497 5 4/5
Table 16: Color Strength, Rubbing Test of Process-2 Samples Dyed with 4% (2%D+2%R) Disperse/Reactive Dye.
Shade% Oxidation Clearing with H2O2 K/S ValueRubbing Test
Dry Wet
4
1g/l 12.219 5 4/5
2g/l 12.303 5 4/5
3g/l 12.33 5 4
4g/l 12.514 5 4/5
Table 17: Color Strength, Rubbing Test of Process-2 Samples Dyed with 5% (2.5%D+2.5%R) Disperse/Reactive Dye.
Shade% Oxidation Clearing with H2O2 K/S ValueRubbing Test
Dry Wet
5
1g/l 13.353 5 4
2g/l 13.609 5 4
3g/l 13.881 5 3/4
4g/l 13.65 5 3/4
Table 18: Wash Fastness Rating of Process-2 Samples Dyed with Disperse/Reactive Dye.
Shade% Oxidation Clearing with H2O2 Diacetate Bleached Cotton Nylon Polyester Acrylic Wool
2
1g/l 3 4 3 4 4 4/5
2g/l 3/4 4 3/4 4 4 4/5
3g/l 4 4 3/4 4 4 4/5
4g/l 3/4 4 3/4 4 4 4/5
3
1g/l 3/4 4 3 4 4 4/5
2g/l 3/4 4 3/4 4 4 4/5
3g/l 3/4 4 3/4 4 4 4/5
4g/l 4 4 3 4 4 4/5
4
1g/l 3/4 4 3 4 4 4/5
2g/l 3/4 4 3 4 4 4/5
3g/l 3/4 4 3/4 4 4 4/5
4g/l 3/4 4 3/4 4 4 4/5

622
Advancements Bioequiv Availab Copyright © Abul Fazal Mohammad Fahad Halim
TTEFT.MS.ID.000608. 5(2).2019
5
1g/l 3/4 4 3/4 4 4 4/5
2g/l 3/4 4 3/4 4 4 4/5
3g/l 3/4 4 3/4 4 4 4/5
4g/l 3/4 4 3/4 4 4 4
Table 19: Change in color of Process-2 Samples Dyed with Disperse/Reactive Dye.
Shade% Oxidation Clearing with H2O2 Change in color
2
1g/l 4
2g/l 4
3g/l 4/5
4g/l 4
3
1g/l 4
2g/l 4
3g/l 4
4g/l 4
4
1g/l 4
2g/l 3/4
3g/l 3/4
4g/l 4
5
1g/l 3/4
2g/l 3
3g/l 3/4
4g/l 3/4
Comparison of process-1 and process-2 samples
Comparison of disperse dyed samples (Table 20; Figure 8): From the results, it can be seen that K/S value is increasing with increasing shade percentage. It is also clear that K/S value of process-1 and process-2 samples remain quite similar.
Figure 8: Graphical representation of K/S of process-1 (P-1) and process-2(p-2) disperse dyed samples.
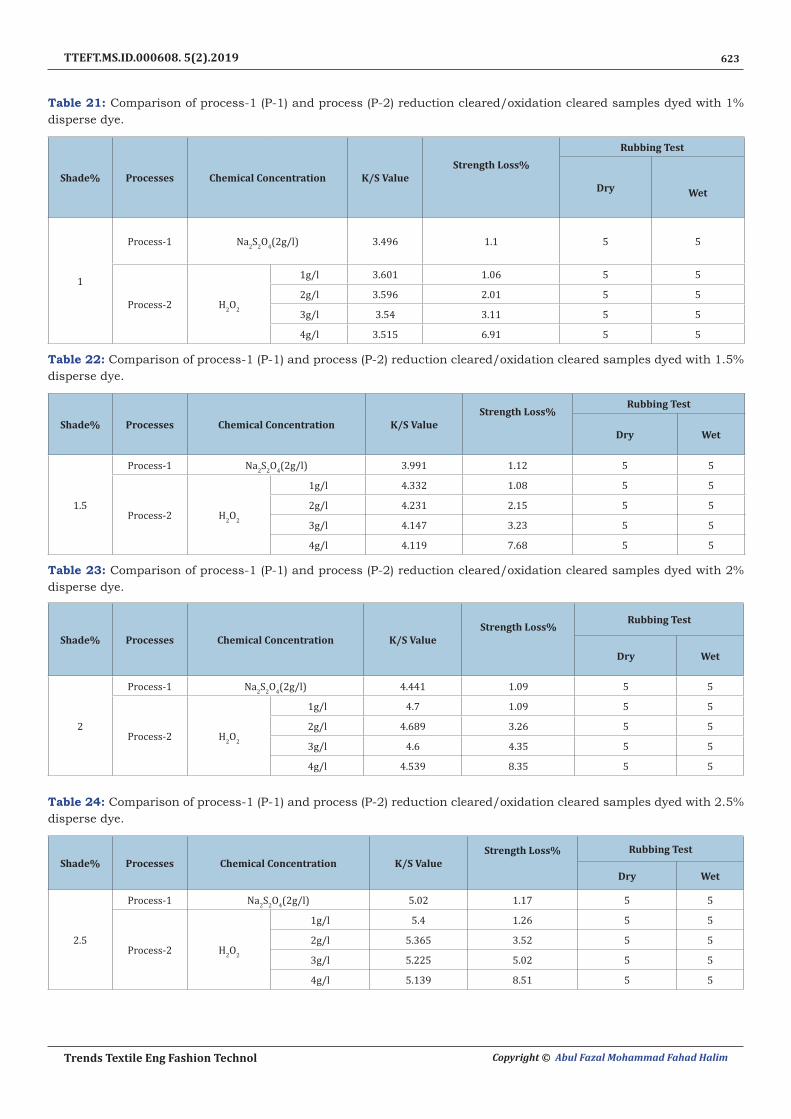
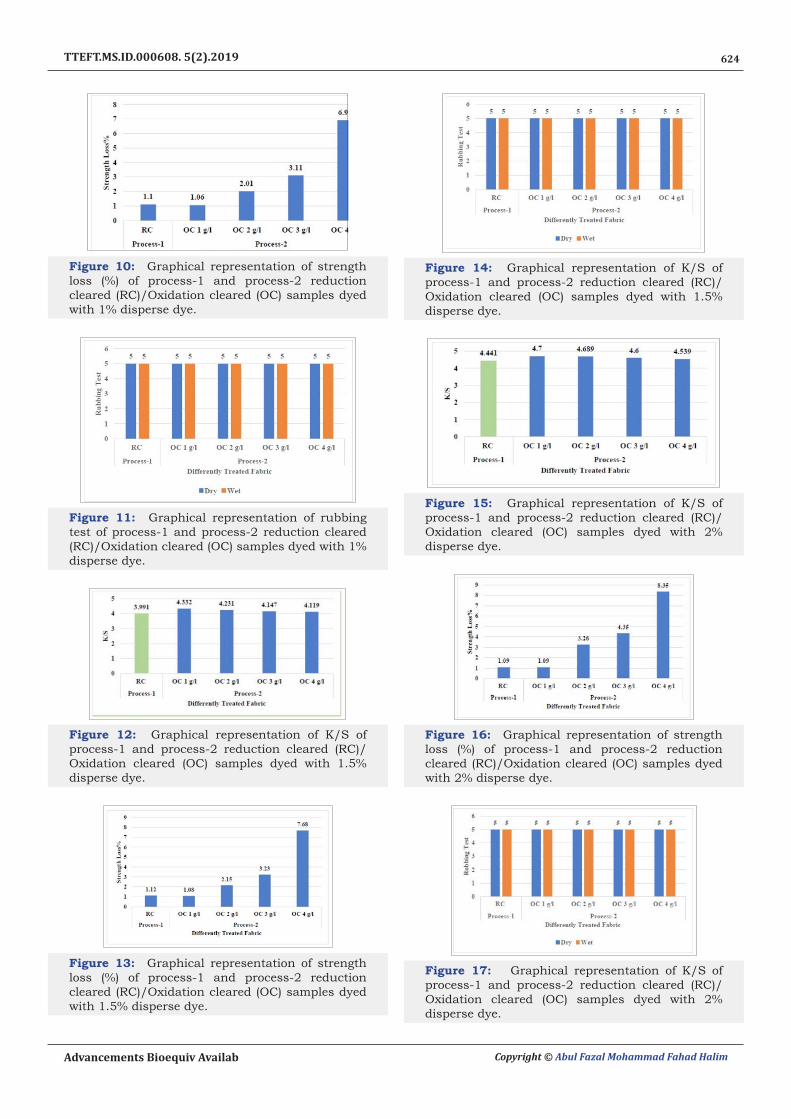
Comparison of reduction cleared/oxidation cleared samples (Table 21-24; Figure 9-20): From the results, it has been clear that by the increased concentration of H2O2 the K/S value decreased as well as strength loss (%) increased. It can be explained that as peroxide concentration increased more surface dye removed that is why K/S value decreased. On the other hand,
strength reduced due to using H2O2 as oxidizing agent which can damage fabric. Excellent dry and wet rubbing fastness rating found for all shade percentage [26-28].
Table 20: Comparison of process-1 (P-1) and process (P-2) disperse dyed samples.
Shade% K/S Value(P-1) K/S Value(P-2)
1 3.759 3.813
1.5 4.389 4.541
2 4.991 5.132
2.5 5.709 5.896
Figure 9: Graphical representation of K/S of process-1(P-1) and process-2(p-2) cleared(RC)/Oxidation cleared (OC) samples dyed with 1% disperse dye.
623
Trends Textile Eng Fashion Technol Copyright © Abul Fazal Mohammad Fahad Halim
TTEFT.MS.ID.000608. 5(2).2019
Table 21: Comparison of process-1 (P-1) and process (P-2) reduction cleared/oxidation cleared samples dyed with 1% disperse dye.
Shade% Processes Chemical Concentration K/S ValueStrength Loss%
Rubbing Test
Dry Wet
1
Process-1 Na2S2O4(2g/l) 3.496 1.1 5 5
Process-2 H2O2
1g/l 3.601 1.06 5 5
2g/l 3.596 2.01 5 5
3g/l 3.54 3.11 5 5
4g/l 3.515 6.91 5 5
Table 22: Comparison of process-1 (P-1) and process (P-2) reduction cleared/oxidation cleared samples dyed with 1.5% disperse dye.
Shade% Processes Chemical Concentration K/S ValueStrength Loss%
Rubbing Test
Dry Wet
1.5
Process-1 Na2S2O4(2g/l) 3.991 1.12 5 5
Process-2 H2O2
1g/l 4.332 1.08 5 5
2g/l 4.231 2.15 5 5
3g/l 4.147 3.23 5 5
4g/l 4.119 7.68 5 5
Table 23: Comparison of process-1 (P-1) and process (P-2) reduction cleared/oxidation cleared samples dyed with 2% disperse dye.
Shade% Processes Chemical Concentration K/S ValueStrength Loss%
Rubbing Test
Dry Wet
2
Process-1 Na2S2O4(2g/l) 4.441 1.09 5 5
Process-2 H2O2
1g/l 4.7 1.09 5 5
2g/l 4.689 3.26 5 5
3g/l 4.6 4.35 5 5
4g/l 4.539 8.35 5 5
Table 24: Comparison of process-1 (P-1) and process (P-2) reduction cleared/oxidation cleared samples dyed with 2.5% disperse dye.
Shade% Processes Chemical Concentration K/S ValueStrength Loss% Rubbing Test
Dry Wet
2.5
Process-1 Na2S2O4(2g/l) 5.02 1.17 5 5
Process-2 H2O2
1g/l 5.4 1.26 5 5
2g/l 5.365 3.52 5 5
3g/l 5.225 5.02 5 5
4g/l 5.139 8.51 5 5
624
Advancements Bioequiv Availab Copyright © Abul Fazal Mohammad Fahad Halim
TTEFT.MS.ID.000608. 5(2).2019
Figure 10: Graphical representation of strength loss (%) of process-1 and process-2 reduction cleared (RC)/Oxidation cleared (OC) samples dyed with 1% disperse dye.
Figure 11: Graphical representation of rubbing test of process-1 and process-2 reduction cleared (RC)/Oxidation cleared (OC) samples dyed with 1% disperse dye.
Figure 12: Graphical representation of K/S of process-1 and process-2 reduction cleared (RC)/Oxidation cleared (OC) samples dyed with 1.5% disperse dye.
Figure 13: Graphical representation of strength loss (%) of process-1 and process-2 reduction cleared (RC)/Oxidation cleared (OC) samples dyed with 1.5% disperse dye.
Figure 14: Graphical representation of K/S of process-1 and process-2 reduction cleared (RC)/Oxidation cleared (OC) samples dyed with 1.5% disperse dye.
Figure 15: Graphical representation of K/S of process-1 and process-2 reduction cleared (RC)/Oxidation cleared (OC) samples dyed with 2% disperse dye.
Figure 16: Graphical representation of strength loss (%) of process-1 and process-2 reduction cleared (RC)/Oxidation cleared (OC) samples dyed with 2% disperse dye.
Figure 17: Graphical representation of K/S of process-1 and process-2 reduction cleared (RC)/Oxidation cleared (OC) samples dyed with 2% disperse dye.

625
Trends Textile Eng Fashion Technol Copyright © Abul Fazal Mohammad Fahad Halim
TTEFT.MS.ID.000608. 5(2).2019
Figure 18: Graphical representation of K/S of process-1 and process-2 reduction cleared (RC)/Oxidation cleared (OC) samples dyed with 2.5% disperse dye.
Figure 19: Graphical representation of strength loss (%) of process-1 and process-2 reduction cleared (RC)/Oxidation cleared (OC) samples dyed with 2.5% disperse dye.
Figure 20: Graphical representation of K/S of process-1 and process-2 reduction cleared (RC)/Oxidation cleared (OC) samples dyed with 2.5% disperse dye.
Comparison of disperse/reactive dyed samples (Table 25-28; Figure 21-28): The results show that, K/S value increased with the increased shade percentage and also color strength is higher in process-2 samples comparing to process-1 samples. This is because in process-2 absorbency increased as a result color strength got higher. From the results of wet rubbing fastness, it was found that, for 2%, 3% shade process-1 and process-2 samples showed good to excellent result. For 4% shade OC-3 g/l showed good rating and others showed good to excellent result but process-1 sample
showed good to excellent result. For 5% shade, OC-1 g/l, OC-2g/l showed good rating, but others showed fair to good rating and process-1 sample showed good to excellent rating (Table 29) The results show that acetate and nylon are the most highly stained among the six fibre types. This can be explained on the basis that acetate; nylon was stained for using disperse dyes in polyester dyeing and cotton and wool stained for using reactive dye in cotton part dyeing (Table 30). The results show that, by increasing the shade percentage, fastness rating is decreasing [29-42].
Figure 21: Graphical representation of K/S of process-1 and process-2 reduction cleared (RC)/Oxidation cleared (OC) samples dyed with 2%(1%D+1%R) disperse/reactive dye.
Figure 22: Graphical representation of rubbing test of process-1 and process-2 reduction cleared (RC)/Oxidation cleared (OC) samples dyed with 2%(1%D+1%R) disperse/reactive dye.
Figure 23: Graphical representation of K/S of process-1 and process-2 reduction cleared (RC)/Oxidation cleared (OC) samples dyed with 3%(1.5%D+1.5%R) disperse/reactive dye.

626
Advancements Bioequiv Availab Copyright © Abul Fazal Mohammad Fahad Halim
TTEFT.MS.ID.000608. 5(2).2019
Figure 24: Graphical representation of rubbing test rating of process-1 and process-2 reduction cleared (RC)/oxidation cleared (OC) samples dyed with 3%(1.5%D+1.5%R) disperse/reactive dye.
Figure 25: Graphical representation of K/S of process-1 and process-2 reduction cleared (RC)/oxidation cleared (OC) samples dyed with 4%(2%D+2%R) disperse/reactive dye.
Figure 26: Graphical representation of rubbing test rating of process-1 and process-2 reduction cleared (RC)/oxidation cleared (OC) samples dyed with 4%(2%D+2%R) disperse/reactive dye.
Figure 27: Graphical representation of K/S of process-1 and process-2 reduction cleared (RC)/oxidation cleared (OC) samples dyed with 5%(2.5%D+2.5%R) disperse/reactive dye.
Table 25: Comparison of process-1 (P-1) and process (P-2) samples dyed with 2%(1%D+1%R) disperse/Reactive dye.
Shade% Processes Chemical Concentration K/S Value
Rubbing Test
Dry Wet
2
Process-1 Na2S2O4(2g/l) 5.96 5 4/5
Process-2 H2O2
1g/l 7.4 5 4/5
2g/l 7.333 5 4/5
3g/l 7.51 5 4/5
4g/l 7.702 5 4/5
Table 26: Comparison of process-1 (P-1) and process (P-2) samples dyed with 3%(1.5%D+1.5%R) disperse/Reactive dye.
Shade% Processes Chemical ConcentrationK/S Value Rubbing Test
Dry Wet
3
Process-1 Na2S2O4(2g/l) 8.446 5 4/5
Process-2 H2O2
1g/l 10.555 5 4/5
2g/l 10.364 5 4/5
3g/l 10.288 5 4/5
4g/l 10.497 5 4/5

627
Trends Textile Eng Fashion Technol Copyright © Abul Fazal Mohammad Fahad Halim
TTEFT.MS.ID.000608. 5(2).2019
Table 27: Comparison of process-1 (P-1) and process (P-2) samples dyed with 4%(2%D+2%R) disperse/Reactive dye.
Shade% Processes Chemical Concentration K/S ValueRubbing Test
Dry Wet
4
Process-1 Na2S2O4(2g/l) 10.272 5 4/5
Process-2 H2O2
1g/l 12.219 5 4/5
2g/l 12.303 5 4/5
3g/l 12.33 5 4/5
4g/l 12.514 5 4/5
Table 28: Comparison of process-1 (P-1) and process (P-2) samples dyed with 5%(2.5%D+2.5%R) disperse/Reactive dye.
Shade% Processes Chemical ConcentrationK/S Value Rubbing Test
Dry Wet
5
Process-1 Na2S2O4 (2g/l) 11.922 5 4/5
Process-2 H2O2
1g/l 13.353 5 4
2g/l 13.609 5 4
3g/l 13.881 5 3/5
4g/l 13.65 5 3/5
Table 29: Comparison of wash fastness rating of process-1 and process-2 samples.
Process-1
Shade% Diacetate Bleached Cotton Nylon Polyester Acrylic Wool
2 4 4/5 4 4/5 4/5 5
3 4-Mar 4/5 3/4 4/5 4/5 5
4 3/4 4/5 3/4 4/5 4/5 4/5
5 3 4/5 3 4/5 4/5 4/5
Process-2
Shade% Oxidation Clearing with H2O2 Diacetate Bleached
Cotton Nylon Polyester Acrylic Wool
2
1g/l 3 4 3 4 4 4/5
2g/l 3/4 4 3/4 4 4 4/5
3g/l 4 4 3/4 4 4 4/5
4g/l 3/4 4 3/4 4 4 4/5
3
1g/l 3/4 4 3 4 4 4/5
2g/l 3/4 4 3/4 4 4 4/5
3g/l 3/4 4 ¾ 4 4 4/5
4g/l 3 4 3 4 4 4/5
4
1g/l 3/4 4 3 4 4 4/5
2g/l 3/4 4 3 4 4 4/5
3g/l 3/4 4 3/4 4 4 4/5
4g/l 3/4 4 3/4 4 4 4/5
5
1g/l 3/4 4 3/4 4 4 4/5
2g/l 3/4 4 3/4 4 4 4/5
3g/l 3/4 4 3/4 4 4 4
4g/l 3/4 4 3/4 4 4 4

628
Advancements Bioequiv Availab Copyright © Abul Fazal Mohammad Fahad Halim
TTEFT.MS.ID.000608. 5(2).2019
Table 30: Comparison of change in color of process-1 and process-2 samples.
Process-1
Shade% Change in color
2 4/5
3 4
4 3/4
5 3
Process-2
Shade% Oxidation Clearing with H2O2 Change in color
2
1 4
2 4
3 4/5
4 4
3
1 4
2 4
3 4
4 4
4
1 4
2 3/4
3 3/4
4 4
5
1 3/4
2 3
3 3/4
4 3/4
Figure 28: Graphical representation of rubbing test rating of process-1 and process-2 reduction cleared (RC)/oxidation cleared (OC) samples dyed with 5%(2.5%D+2.5%R) disperse/reactive dye.
Conclusion
In traditional process, the surface deposits of disperse dye is removed by reduction clearing. Reduction clearing has adverse effect on environment. Sodium dithionate is an inorganic compound and not biodegradable. As, sodium dithionate is not bio-degradable,
its presence in the effluent increases the COD of water. In this study, oxidation clearing with H2O2 was done as an alternative to reduction clearing. From different research work it has been found that, in oxidation process, ecological advantages were significant and further advantage is that pre-treatment can be eliminated.
References1. Nunn DM (1979) The dyeing of synthetic-polymer and acetate fibres.
Dyers Company Publications Trust Australia.
2. Broadbent AD (2001) Basic principles of textile coloration. Society of Dyers and Colourists, Bradford, UK.
3. Hawkyard C (2004) Synthetic fibre dyeing. Society of Dyers and Colourists, Bradford, UK.
4. Park J, Shore J (2004) Practical dyeing. Society of Dyers & Colourists, Bradford, UK.
5. Aspland J (1992) Disperse dyes and their application to polyester. Textile Chemist and Colorist 24: 18-19.
6. Aleem ULA (2013) An investigation of alternatives to reductive clearing in the dyeing of polyester. Heriot Watt University, Edinburgh, Scotland, UK.
7. Gomes JRC, Lima, Almeida J (2007) Oxidative clearing of polyester and post-bleaching of cotton: a novel shorter process with better fastness. Colourage: Annual Edition 47: 49-52.
8. Anis P, Eren HA (2004) Examining the effectiveness of oxidative clearing in one-step dyeing of polyester/cotton fabrics. University of Uludag, Bursa, Turkey.
9. McIntyre JE (2005) Synthetic fibres: nylon, polyester, acrylic, polyolefin. Taylor & Francis, UK.
10. Deopura B, R Alagirusamy M Joshi B Gupta (2008) Polyesters and polyamides. Elsevier, US.
11. Perepelkin K (2001) Polyester fibres abroad in the third millennium. Fibre Chemistry 33(5): 333-339.
12. Krichevskii G (2001) Textile materials made from polyester fibres: A most difficult material to color. Fibre chemistry 33(5): 364-367.
13. Needles HL (1986) Textile fibres, dyes, finishes, and processes: a concise guide. Noyes Publications, New Jersey, USA.
14. Moncrieff RW (1975) Man-made fibres. Newnes-Butterworths US.
15. Bendak A, Marsafi S (1991) Effects of chemical modifications on polyester fibres. Journal of Islamic Academy of Sciences 4(4): 275-284.
16. Shore J (1995) Cellulosics dyeing. Society of Dyers and Colourists, Bradford, UK.
17. Choudhury AR (2006) Textile preparation and dyeing. Science Publishers, USA.
18. Canal J, G Caballero, Vega B, Canal C, Paul R, et al. (2004) Effect of various bio scouring systems on the accessibility of dyes into cotton. Coloration Technology 120(6): 311-315.
19. Hearle J (2007) Physical structure and properties of cotton, cotton: science and technology. Woodhead Publishing Limited, Cambridge, USA, pp. 35-67.
20. Gordon S, Hsieh YL (2006) Cotton: science and technology. Woodhead Publishing Limited, Cambridge, USA.
21. Cook JG (1984) Handbook of textile fibres: natural fibres. Woodhead Publishing Limited, Cambridge, USA.
22. Chao NPC (1963) Blending cotton and polyester fibres: effects of processing methods on fibre distribution and yarn properties. Georgia Institute of Technology, Georgia.

629
Trends Textile Eng Fashion Technol Copyright © Abul Fazal Mohammad Fahad Halim
TTEFT.MS.ID.000608. 5(2).2019
23. Baykal PD, Babaarslan O, Erol R (2006) Prediction of strength and elongation properties of cotton polyester-blended OE rotor yarns. Fibres and Textiles in Eastern Europe 14(1): 18.
24. Cyniak DJ, Czekalski, Jackowski T (2006) Quality analysis of cotton/polyester yarn blends spun with the use of a rotor spinning frame. Fibres & Textiles in Eastern Europe 3(57): 33-37.
25. Sevkan A,Kadoglu H (2012) An investigation on ring and open-end spinning of flax/cotton blends. Journal of Textile & Apparel 22(3): 18-19.
26. Hegde RR (2011) Cotton fibres. USA.
27. Wardman RH (1998) An introduction to textile coloration: principles and practice. Society of Dyers and Colourists, Bradford, UK.
28. (2012) Disperse dyes/properties of disperse dye Textile Fashion Study, World Press, Netherlands, UK.
29. Avinc O (2011) Clearing of dyed poly (lactic acid) fabrics under acidic and alkaline conditions. Textile Research Journal 81(10): 1049-1074.
30. Shore J (2002) Colorants and auxiliaries’ organic chemistry and application properties. Society of Dyers and Colourists, Bradford, UK.
31. Naresh M, Saraf (2008) Save natural resources: adopt acid reduction clearing. USA.
32. Roessler A, Jin X (2003) State of the art technologies and new electrochemical methods for the reduction of vat dyes. Dyes and Pigments 59(3): 223-235.
33. Baumgarte U (1987) Developments in vat dyes and in their application. Coloration Technology 17(1): 29-38.
34. Tiedemann W, Schad J (1998) Reduction clearing of polyester dyeings from its ecological and economic aspects. Melliand Textilberichte International Textile Reports 79: 852-855.
35. Clarke E, Steinle D (1995) Health and environmental safety aspects of organic colorants. Coloration Technology 25(1): 1-5.
36. Bhaskar M (2000) Analyses of carcinogenic aromatic amines released from harmful azo colorants by streptomyces sp SS07. Journal of Chromatography 1018(1): 117-123.
37. Chung KT (2000) Mutagenicity and carcinogenicity of aromatic amines metabolically produced from azo dyes. Journal of Environmental Science & Health 18(1): 51-74.
38. Zee F (2002) Anaerobic azo dye reduction. Wegeningen University, Netherlands, UK.
39. Pandey A, Singh P, Iyengar L (2007) Bacterial decolorization and degradation of azo dyes. International Biodeterioration & Biodegradation 59(2): 73-84.
40. Eren HA (2006) After clearing by ozonation: a novel approach for disperse dyeing of polyester. Coloration Technology 122(6): 329-333.
41. Chinta S, VijayKumar S (2013) Technical facts & figures of reactive dyes used in textiles. International Journal of Engineering and Management Sciences 4(3): 308-312.
42. Clark M (2011) Handbook of textile and industrial dyeing. Woodhead Publishing Limited, Cambridge, USA.
For possible submissions Click below:
Submit Article