oxidation reactions of 1- and 2-naphthols; experimental...
TRANSCRIPT

Chapter 3
Oxidation reactions of 1- and 2-naphthols; experimental
and theoretical study
Oxidation reactions of 1- and 2-naphthols; experimental and theoretical study 67
Abstract
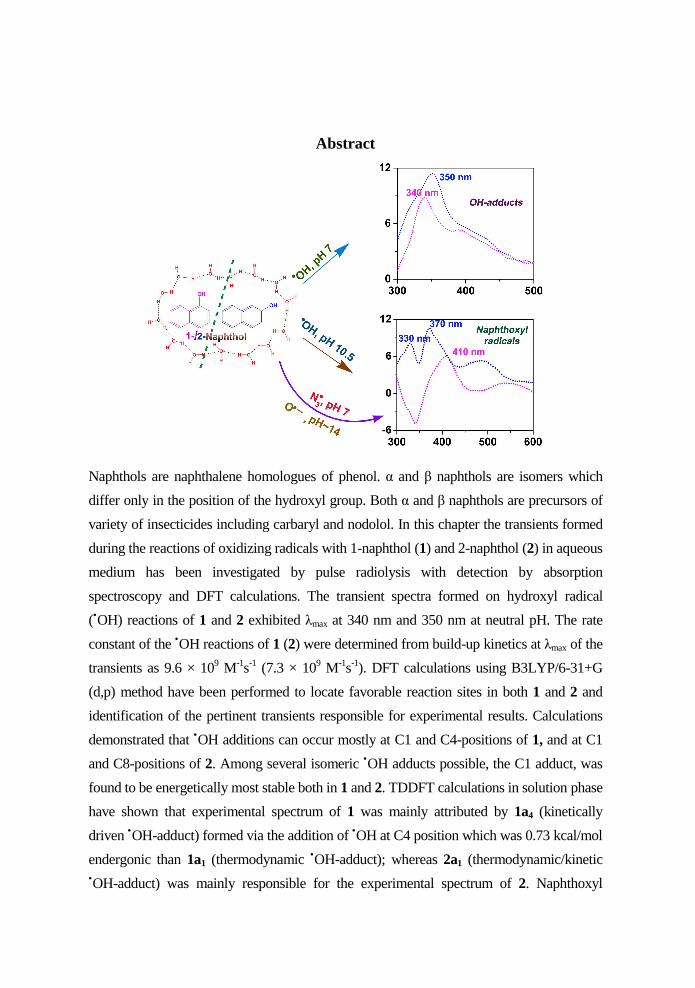
Naphthols are naphthalene homologues of phenol. α and β naphthols are isomers which
differ only in the position of the hydroxyl group. Both α and β naphthols are precursors of
variety of insecticides including carbaryl and nodolol. In this chapter the transients formed
during the reactions of oxidizing radicals with 1-naphthol (1) and 2-naphthol (2) in aqueous
medium has been investigated by pulse radiolysis with detection by absorption
spectroscopy and DFT calculations. The transient spectra formed on hydroxyl radical
(•OH) reactions of 1 and 2 exhibited λmax at 340 nm and 350 nm at neutral pH. The rate
constant of the •OH reactions of 1 (2) were determined from build-up kinetics at λmax of the
transients as 9.6 × 10⁹ M-1s-1 (7.3 × 10⁹ M-1s-1). DFT calculations using B3LYP/6-31+G
(d,p) method have been performed to locate favorable reaction sites in both 1 and 2 and
identification of the pertinent transients responsible for experimental results. Calculations
demonstrated that •OH additions can occur mostly at C1 and C4-positions of 1, and at C1
and C8-positions of 2. Among several isomeric •OH adducts possible, the C1 adduct, was
found to be energetically most stable both in 1 and 2. TDDFT calculations in solution phase
have shown that experimental spectrum of 1 was mainly attributed by 1a4 (kinetically
driven •OH-adduct) formed via the addition of •OH at C4 position which was 0.73 kcal/mol
endergonic than 1a1 (thermodynamic •OH-adduct); whereas 2a1 (thermodynamic/kinetic •OH-adduct) was mainly responsible for the experimental spectrum of 2. Naphthoxyl
68 Chapter III
radicals of 1 and 2 have been predicted as the transient formed in the reaction of •OH at
basic pH. In addition, the same transient species resulted from the reactions of oxide radical
ion (O•–) at pH~13 and azide radical (N3•) at pH 7 with 1 and 2. Further, UV photolysis of
aqueous solutions of 1 and 2 containing H2O2 (UV/H2O2) were used for the •OH induced
oxidation product formations up on 60% degradations of 1 and 2; profiling of the oxidation
products were performed by using an ultra-performance liquid chromatography quadrupole
time of flight mass spectrometry (UPLC–Q-TOF) method. According to the UPLC–Q-
TOF analyses, the preliminary oxidation products are limited to di-hydroxy naphthalenes
and naphthoquinones with N2-saturation while some more additional products (mainly
isomeric mono hydroxy naphthoquinones) have been observed in the degradations of 1 and
2 in presence of O2. We postulate that, di-hydroxy naphthalenes are derived explicitly from
the most favorable •OH-adducts speculated (preference is in terms of kinetic/
thermodynamic dominancy of transients) by using theoretical calculations which in turn
substantiate the proposed reaction mechanisms. The observations of •OH-adducts for an
aromatic phenol (herein for both 1 and 2 at pH 7) rather than phenoxyl type radical in the
pulse radiolysis experiments is a distinct and unique illustration. The present study provides
a meaningful basis for the early stages associated with the •OH initiated advanced oxidation
processes of 1- and 2-naphthols.
Publications from this chapter:
i) Sreekanth, R.; Prasanthkumar, K. P..; Sunil Paul, M. M.; Aravind, U. K.;
Aravindakumar, C. T; Pulse radiolysis and theoretical studies of oxidation reactions
of 1- and 2-naphthols. J. Phys. Chem. A 2013, 117, 11261–11270
ii) Sreekanth, R.; Sunil Paul M. M.; Aravind U. K.; Aravindakumar C. T, Hydroxyl
Radical Mediated Oxidation of 1- and 2-Naphthols: A Mass Spectrometric Study,
Proceedings of the International Conference on Frontiers of Mass Spectrometry
(ICMS 2013)(September 6-9, 2013), Kottayam
iii) Sreekanth, R.; Aravindakumar, C. T; Pulse radiolysis studies of 1- and 2-Naphthols,
Proceedings of the Trombay symposium on radiation and Photochemistry (TSRP
2009) Mumbai, 2009
Oxidation reactions of 1- and 2-naphthols; experimental and theoretical study 69
3.1. Introduction
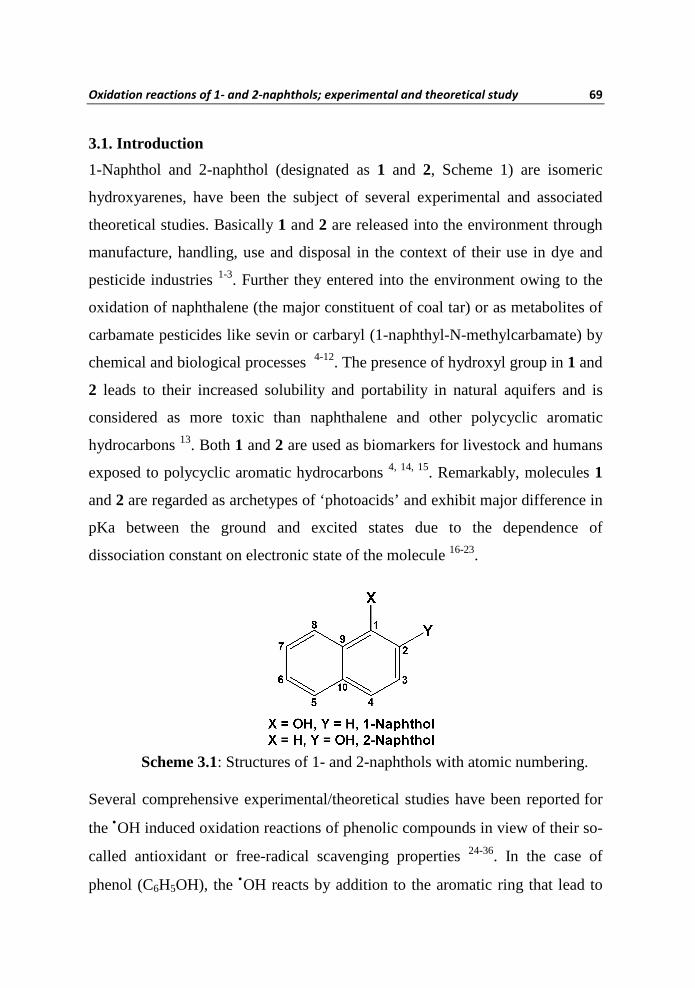
1-Naphthol and 2-naphthol (designated as 1 and 2, Scheme 1) are isomeric
hydroxyarenes, have been the subject of several experimental and associated
theoretical studies. Basically 1 and 2 are released into the environment through
manufacture, handling, use and disposal in the context of their use in dye and
pesticide industries 1-3. Further they entered into the environment owing to the
oxidation of naphthalene (the major constituent of coal tar) or as metabolites of
carbamate pesticides like sevin or carbaryl (1-naphthyl-N-methylcarbamate) by
chemical and biological processes 4-12. The presence of hydroxyl group in 1 and
2 leads to their increased solubility and portability in natural aquifers and is
considered as more toxic than naphthalene and other polycyclic aromatic
hydrocarbons 13. Both 1 and 2 are used as biomarkers for livestock and humans
exposed to polycyclic aromatic hydrocarbons 4, 14, 15. Remarkably, molecules 1
and 2 are regarded as archetypes of ‘photoacids’ and exhibit major difference in
pKa between the ground and excited states due to the dependence of
dissociation constant on electronic state of the molecule 16-23.
Several comprehensive experimental/theoretical studies have been reported for
the •OH induced oxidation reactions of phenolic compounds in view of their so-
called antioxidant or free-radical scavenging properties 24-36. In the case of
phenol (C6H5OH), the •OH reacts by addition to the aromatic ring that lead to
Scheme 3.1: Structures of 1- and 2-naphthols with atomic numbering.
70 Chapter III
the formation of the •OH-adduct as the preferred transient at neutral pH as
demonstrated by ESR and pulse radiolysis studies 25, 26. However, the •OH
addition essentially leads to the formation of isomeric adduct species. Acids and
bases catalyze the dehydration of the primary •OH-adduct(s) to the formation of
phenoxyl radical26-28, 31. Furthermore, the base catalyzed dehydration is reported
to be faster than the acid catalyzed dehydration27. Indeed, it was recognized that
thermodynamically the formation of phenoxyl radical is more favorable than •OH additions 37. Moreover, in substituted phenols the substituent have marked
influence on directing the incoming •OH 30, 32, 38. A number of techniques which
essentially comprise of chemical, biological, catalytic, and electrochemical
procedures were reported for the •OH induced degradation of naphthols in
waste water 39-51. Also, the free electron transfer phenomena of naphthols, their
analogues and derivatives has been extensively studied by fluorescence, laser
flash as well as pulse radiolysis techniques in organic solvents 52-59.
The main interest of the present study is accordingly to understand the
mechanism of primary oxidation reactions of isomeric naphthol molecules with •OH. In order to further understand the oxidations of naphthols, two other
oxidizing inorganic radicals (O•– and N3•) were also selected and their reactions
were compared with •OH reactions. We used pulse radiolysis technique with
optical absorption detection as direct, convenient and reliable method to portrait
the reactions of oxidizing radicals produced in aqueous medium with naphthols.
The advantage of pulse radiolysis method is that, it offers a clean source for the
selective generation of a particular radical like •OH under suitable experimental
conditions to probe its reactions with a substrate. DFT calculations were carried
out to locate the most probable reaction sites and to evaluate the preferred
kinetic/thermodynamic transient(s) that would be formed in the pulse radiolysis
experiments. Additionally, analysis of the oxidation products resulting from the

Oxidation reactions of 1- and 2-naphthols; experimental and theoretical study 71
reactions of •OH (generated via UV/H2O2 method) with 1 and 2 has been
carried out using UPLC-Q-TOF-MS technique to elucidate the primary radical
intermediates in the pulse radiolysis studies.
3.2. Results and Discussion
3.2.1. Pulse radiolysis studies
(A) Reactions with ••••OH with 1- and 2-naphthols
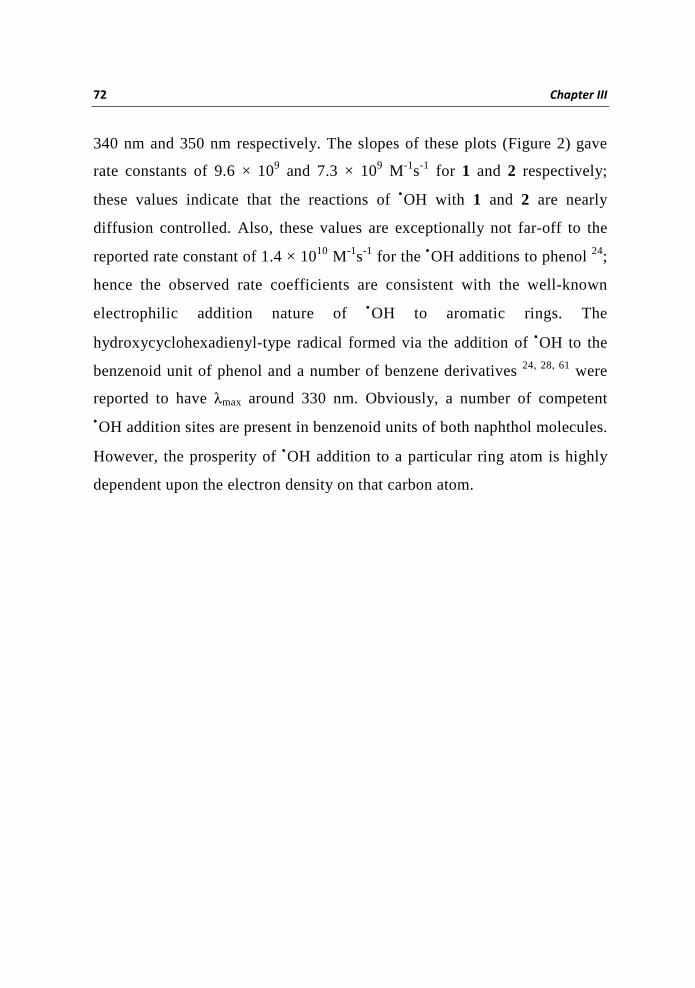
The transient absorption spectra formed on the reactions of •OH with 1 and 2
at pH 7 and 10.5 are presented in Figure 3.1. The ordinate in all these plots
represents the product of G-value 72 and absorption coefficient (ε) of the
transient at a particular wavelength. It should be noted that, the ground state
pKa values of 1 and 2 are respectively 9.3 and 9.6 60, therefore their anionic
forms are reacting at higher pHs. The spectrum measured after 5 µs shows
λmax 340 nm for 1 at pH 7 (Figure 3.1A), whereas at pH 10.5 the transient
absorption shows λmax 410 nm and a broad but minor absorption centered
around 540 nm (Figure 3.1B). The transient spectrum produced in the
reaction of •OH with 2 (Figure 3.1C) showed λmax 350 nm at pH 7, whereas
the same reaction at pH 10.5 is characterized by three absorptions with λmax
330 nm, 370 nm and 480 nm (Figure 3.1D). In all these cases we have
observed no change in the spectral maxima with time except the decrease in
signal intensities. Subsequently, from time resolved spectral studies we
postulate the formations of relatively long-lived transient(s) in the reactions
of •OH with 1 and 2 in neutral and alkaline solutions. Further, it has been
found that, the transient with absorptions at either 340 or 350 nm in the
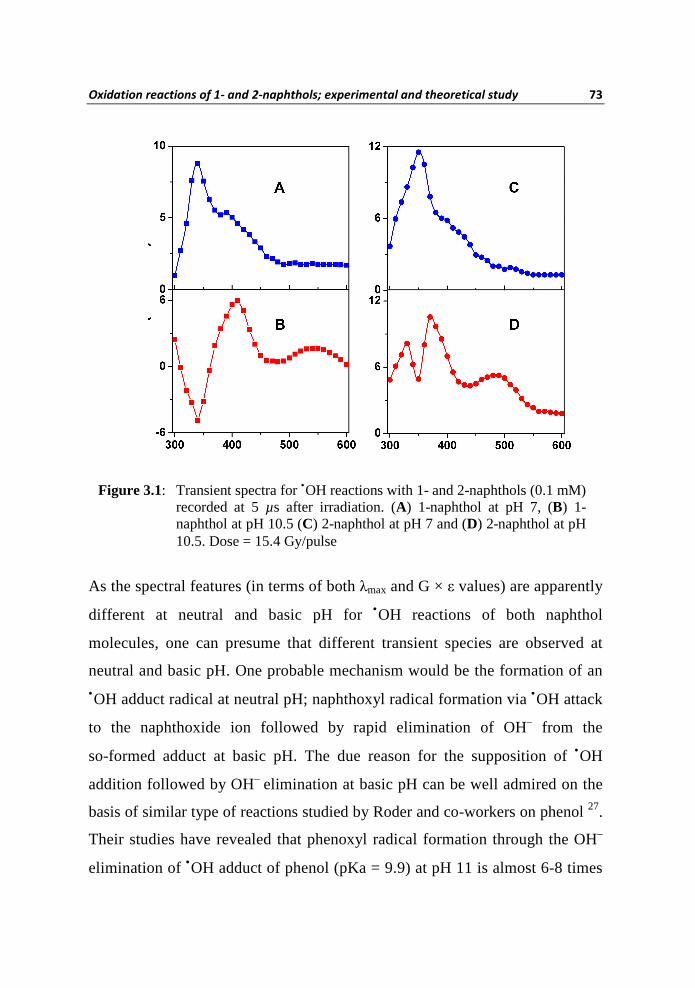
reactions •OH with 1 or 2 at pH 7 decayed via second order kinetics. The
second order rate constants for the reactions of •OH with 1 and 2 were
determined from the slope of the plot of observed rate constant (kobs) as a
function of concentrations of naphthols measured at their transient λmax at
72 Chapter III
340 nm and 350 nm respectively. The slopes of these plots (Figure 2) gave
rate constants of 9.6 × 10⁹ and 7.3 × 10⁹ M-1s-1 for 1 and 2 respectively;
these values indicate that the reactions of •OH with 1 and 2 are nearly
diffusion controlled. Also, these values are exceptionally not far-off to the
reported rate constant of 1.4 × 10¹⁰ M-1s-1 for the •OH additions to phenol 24;
hence the observed rate coefficients are consistent with the well-known
electrophilic addition nature of •OH to aromatic rings. The
hydroxycyclohexadienyl-type radical formed via the addition of •OH to the
benzenoid unit of phenol and a number of benzene derivatives 24, 28, 61 were
reported to have λmax around 330 nm. Obviously, a number of competent •OH addition sites are present in benzenoid units of both naphthol molecules.
However, the prosperity of •OH addition to a particular ring atom is highly
dependent upon the electron density on that carbon atom.
Oxidation reactions of 1- and 2-naphthols; experimental and theoretical study 73
As the spectral features (in terms of both λmax and G × ε values) are apparently
different at neutral and basic pH for •OH reactions of both naphthol
molecules, one can presume that different transient species are observed at
neutral and basic pH. One probable mechanism would be the formation of an •OH adduct radical at neutral pH; naphthoxyl radical formation via •OH attack
to the naphthoxide ion followed by rapid elimination of OH– from the
so-formed adduct at basic pH. The due reason for the supposition of •OH
addition followed by OH– elimination at basic pH can be well admired on the
basis of similar type of reactions studied by Roder and co-workers on phenol 27.
Their studies have revealed that phenoxyl radical formation through the OH–
elimination of •OH adduct of phenol (pKa = 9.9) at pH 11 is almost 6-8 times
Figure 3.1: Transient spectra for •OH reactions with 1- and 2-naphthols (0.1 mM) recorded at 5 µs after irradiation. (A) 1-naphthol at pH 7, (B) 1-naphthol at pH 10.5 (C) 2-naphthol at pH 7 and (D) 2-naphthol at pH 10.5. Dose = 15.4 Gy/pulse
74 Chapter III
faster than the H2O-elimination of the •OH adduct in highly acidic medium.
Therefore in the present case (at basic pH), the initial reaction is expected to be
an addition of •OH to naphthoxide ion followed by a rapid elimination of OH–
to give naphthoxyl radical. Demonstration of naphthoxyl radical formation will
be more obvious when we look at the O•– and N3• reactions of naphthols.
It can be noted that, under the pulse radiolysis time scale, the naphthols at
neutral pH can react with •OH according to three possible pathways as depicted
in Scheme 3.2. In one mechanistic pathway, the electrophilic additions of •OH
can occur to either benzenoid units of naphthol molecules which lead to the
formations of so-called •OH-adducts. There could be two types of •OH addition
to hydroxyl group bearing (i.e. phenolic) benzenoid unit, one is addition to ipso-
position and the other being addition at un-substituted carbon atoms. The
quantification of isomeric •OH-adducts formed in the case of phenol has been
reported on the basis of product analysis and pulse radiolysis data26. The ipso- as
well as meta- additions accounts 8% each, whereas 48% and 36% accounts for
Figure 3.2: Plots of kobs as a function of concentrations of 1- and 2-naphthols at the λmax of the transients formed on their reactions with •OH at pH 7.

Oxidation reactions of 1- and 2-naphthols; experimental and theoretical study 75
the •OH additions at ortho- and para- positions of phenol 26. The relative yields
for addition of •OH to ipso-, meta-, ortho-, and para- positions of phenol reported
recently by Albarran and Schuler are 8%, 25%, 4% and 34% respectively 34. The
direct outer-sphere electron transfer reactions can lead to the formations of radical
cations of 1 and 2. The third possibility is the H-abstractions from the phenolic
OH units leading to naphthoxyl radicals. The differentiation of these three
competing mechanistic pathways (viz. •OH-adducts formations, direct electron
transfer and H-abstraction) is rather very difficult; however, the reactions of
specific one-electron oxidants such as O•– and N3• would rather eliminate the
possibility of one or two pathways.
Scheme 3.2: Possible reaction channels for •OH interaction with 1- and 2-naphthols.
76 Chapter III
(B) Reactions with O••••– and N3••••
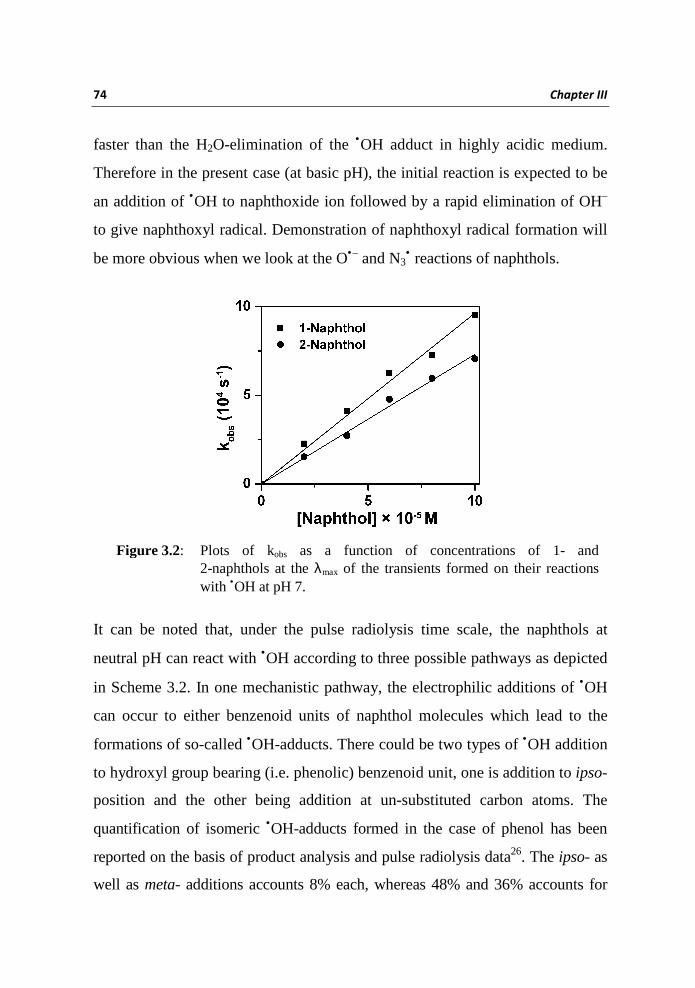
The transient spectra (Figure 3.3) obtained for O•– reactions with anionic forms of
1 and 2 are identical to that generated from their •OH reactions at pH 10.5.
Moreover, it was found that spectra shown in Figure 3.3 are in good agreement
with the spectra reported for the naphthoxyl radicals in the reactions of 1 and 2
with N3• in aqueous solutions 53, 60. Apparently, we could also reproduce identical
spectra (not shown herein) for N3• reactions with 1 and 2 in aqueous solutions at
pH 7 and 10.5. As N3• reacts with aromatic compounds mainly via direct electron
transfer pathway, the results presented above clearly establish identical transient
(i.e. naphthoxyl radical) formations in the reactions of •OH at pH 10.5 and of O•–
at pH~13. Concomitantly, the possibility of electron transfer and thereby the
formations of radical cations of 1 and 2 can also be ruled out. Therefore, the
spectral data presented herein infer the operation of two different mechanisms
under the experimental conditions used (neutral and basic pH) for •OH reactions
of 1 and 2. If one considers an addition of •OH at neutral pH (for both 1 and 2) as
in the case of phenol, then the chances of H-abstraction from phenolic OH
(thereby naphthoxide radical) of naphthols can easily be precluded.
Figure 3.3: Transient spectra for O•– reactions with 1- and 2-naphthols (0.1 mM) recorded at 5 µs after irradiation at pH~13. (A) 1-naphthol and (B) 2-naphthol. Dose = 15.4 Gy/pulse.
Oxidation reactions of 1- and 2-naphthols; experimental and theoretical study 77
The reactions of O•– and N3• with 1 and 2 underlined our previous hypothesis of
naphthoxyl radical formations in the reaction of •OH at basic pH. Therefore, the
observed experimental data in combination with the results of O•– and N3•
reactions unequivocally establish the formation of •OH-adduct(s) at pH 7.
However, there are many possible •OH addition sites in naphthol skeleton and
hence the experimental observations alone are unable to resolve the question of
the most probable adduct(s) and is the rationale for DFT studies. DFT
calculations have unfailingly supported us in previous studies by resolving the
otherwise complicated pulse radiolysis experimental results and serves well in
assigning the exact transient(s) formed therein 63-69.
3.2.2. Theoretical studies
We have carried out theoretical modeling mainly to find the reactive sites in
naphthol molecules for •OH additions and as an alternate tool to predict the
most probable experimental transient(s) by exploring the formation energies and
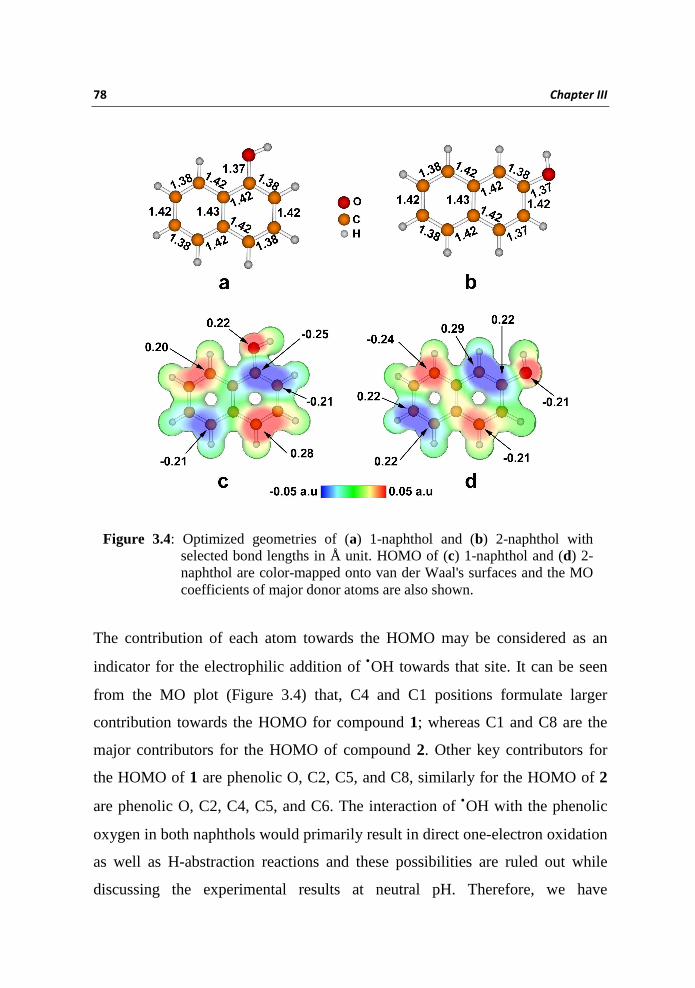
predictions of λmax of •OH-adducts. The gas phase optimized geometries of the
isomeric naphthols are depicted in Figure 3.4 along with selected bond lengths.
Essentially several orientations of phenolic hydrogens are possible for both
naphthols and we have presented the most stable conformations. It was found
that both benzenoid rings of 1 and 2 are in the same plane and also phenolic
hydroxyl units are positioned in the same molecular plane. Calculations showed
that, the interaction takes place between the LUMO of •OH, located at -5.05 eV,
and the HOMOs of 1 located at -5.77 eV and of 2 located at −5.92 eV. HOMOs
of both naphthol molecules color mapped onto van der Waal's surfaces are
presented in Figure 3.4.
78 Chapter III
The contribution of each atom towards the HOMO may be considered as an
indicator for the electrophilic addition of •OH towards that site. It can be seen
from the MO plot (Figure 3.4) that, C4 and C1 positions formulate larger
contribution towards the HOMO for compound 1; whereas C1 and C8 are the
major contributors for the HOMO of compound 2. Other key contributors for
the HOMO of 1 are phenolic O, C2, C5, and C8, similarly for the HOMO of 2
are phenolic O, C2, C4, C5, and C6. The interaction of •OH with the phenolic
oxygen in both naphthols would primarily result in direct one-electron oxidation
as well as H-abstraction reactions and these possibilities are ruled out while
discussing the experimental results at neutral pH. Therefore, we have
Figure 3.4: Optimized geometries of (a) 1-naphthol and (b) 2-naphthol with selected bond lengths in Å unit. HOMO of (c) 1-naphthol and (d) 2-naphthol are color-mapped onto van der Waal's surfaces and the MO coefficients of major donor atoms are also shown.
Oxidation reactions of 1- and 2-naphthols; experimental and theoretical study 79
theoretically modeled the •OH additions at vulnerable sites C1, C2, C4, C5 and
C8 of 1 and the corresponding adducts are represented as 1a1, 1a2, 1a4, 1a5, and
1a8. Similarly, the •OH additions at C1, C2, C4, C5, C6 and C8 of 2 lead to
adduct molecules represented as 2a1, 2a2, 2a4, 2a5, 2a6, and 2a8. Attempts to
find pre-complexes for the •OH-adduct formations lead product-like (i.e.
adduct) structures for both 1 and 2. Therefore, it seems that •OH-additions are
very fast and occurs via energy free or they are barrier-less processes.
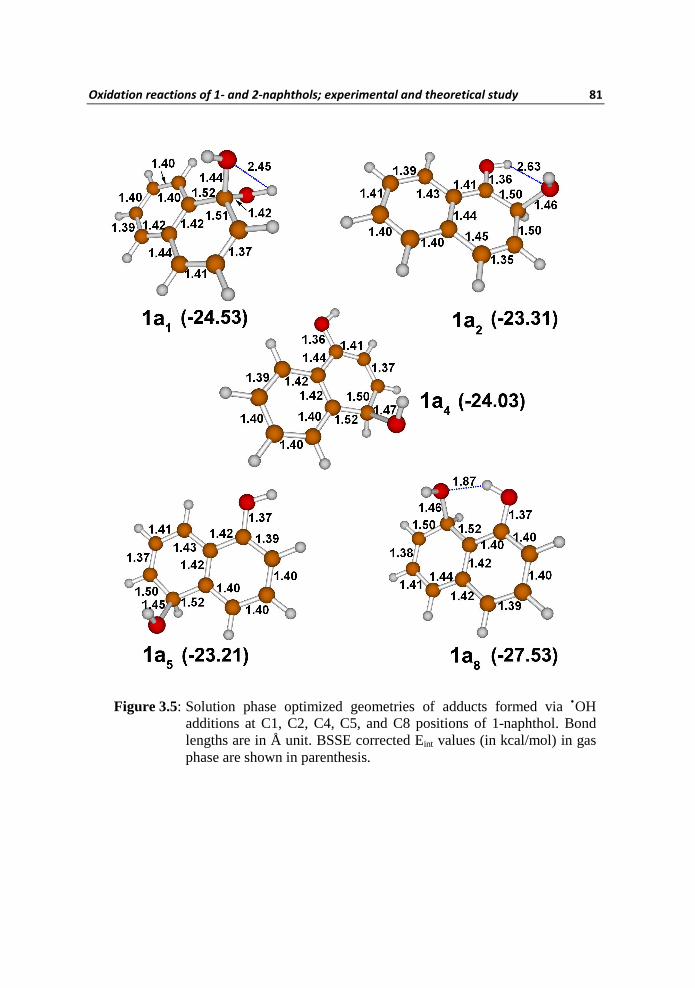
The optimized geometries of adduct molecules 1a1, 1a2, 1a4, 1a5, and 1a8 in
solution phase are illustrated in Figure 3.5 with selected bond lengths. The
BSSE corrected Eint values of the adduct systems in gas phase are also depicted
in Figure 3.5. The Eint values illustrate that the adduct systems are much more
stable than the separate entities viz., 1 and •OH. Also, the 1a8 is more stable
than other available adduct molecules. However, the solution phase studies
point at the influence of solvation on the stabilities of the radicals. The relative
electronic energies (∆E0), enthalpies (∆H), and free energies (∆G) of •OH
adduct molecules of 1 in solution phase are listed in Table 3.1. It can be found
that, formations of all adducts systems are likely due to negative values of
enthalpy and free energy of formations. The difference in free energy between
the most stable 1a1 and the least stable 1a2 accounts for 3.92 kcal/mol.
However, the formations of 1a1 and 1a4 (via additions at C1 and C4) are
thermodynamically more feasible than other adduct molecules. Interestingly,
the high electron density reserves at C1 and C4 positions are also in favor of the
formations of 1a1 and 1a4 as obvious from the HOMO picture (Figure 3.4).
Therefore, adducts 1a1 and 1a4 arises by the kinetic/thermodynamic harmony of •OH reaction with 1. It can also be noted from Table 1 that, except in 1a2 the
unpaired electron spin is confined to the same benzenoid ring to which •OH gets
added. The fewer stability associated with 1a2 can be attributed as a result of
80 Chapter III
unpaired electron spin delocalization onto both benzenoid units which renders
the reduction of inherent aromaticity of both the •OH added and spectator
benzenoid ring.
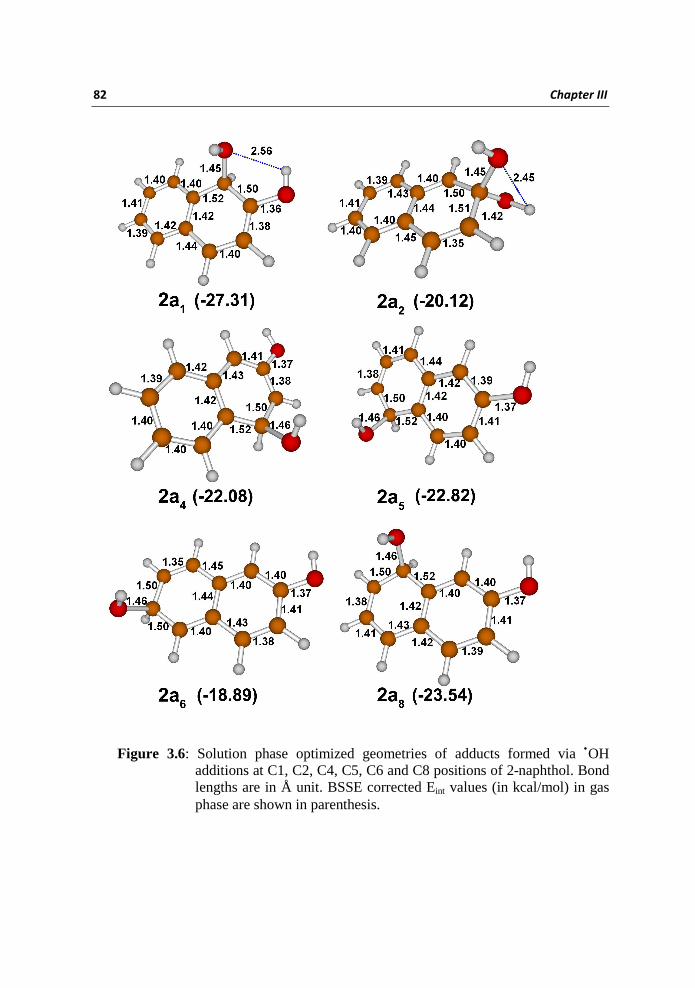
The solution phase optimized geometries of adduct molecules 2a1, 2a2, 2a4, 2a5,
2a6, and 2a8 are presented in Figure 3.6 with selected bond lengths. The
calculated Eint values (with BSSE correction) showed that 2a1 is the most stable
adduct molecule in gas phase. The Eint values of 2a2, 2a4, 2a5, and 2a8 are found
to be lower than that of 1a2, 1a4, 1a5, and 1a8. The solution phase ∆E0, ∆H, and
∆G value of •OH adducts of 2 are presented in Table 3.1 and the
thermodynamic parameters (in a. u.) of •OH, 1-naphthol, 2-naphthol and
various •OH adducts of 1-naphthol & 2-naphthol are given in table 3.2. The
addition of •OH at C1-position of 2 results in the formation of most stable
radical 2a1 followed by the addition at C8-position leading to 2a8. The
stabilities of the •OH adducts follows the order 2a1 > 2a8 > 2a5 > 2a4 > 2a2 >
2a6. The difference in free energy between the most stable 2a1 and the least
stable 2a6 accounts for 5.37 kcal/mol. Interestingly, the ipso-addition of •OH
leads to the thermodynamically most stable adduct (i.e. 1a1) in 1 in contrast to 2
where the ipso-addition causes the formation of one of the least stable adduct
(i.e. 2a2). Also it can be noted from Table 3.1 that, for all •OH-adducts of 2 the
odd electron spin density is mainly dispersed onto the carbon atom adjacent to
the •OH added carbon. As noted in the case of 1a2, there is marked odd electron
spin delocalization into both benzenoid units of 2a2 and 2a6 and which accounts
for the fewer stabilities associated with these two species. Also it seems that the
stabilities of the •OH adducts of 2 in solution are lower than that of 1. Albeit,
the stabilities of 2a1 and 2a8 are consistent with the intuitive reactivity of C1
and C8 positions and therefore we can conclude that formations of 2a1 and 2a8
occur via the kinetic/thermodynamic control of •OH reaction with 2.
Oxidation reactions of 1- and 2-naphthols; experimental and theoretical study 81
Figure 3.5: Solution phase optimized geometries of adducts formed via •OH additions at C1, C2, C4, C5, and C8 positions of 1-naphthol. Bond lengths are in Å unit. BSSE corrected Eint values (in kcal/mol) in gas phase are shown in parenthesis.
82 Chapter III
Figure 3.6: Solution phase optimized geometries of adducts formed via •OH additions at C1, C2, C4, C5, C6 and C8 positions of 2-naphthol. Bond lengths are in Å unit. BSSE corrected Eint values (in kcal/mol) in gas phase are shown in parenthesis.
Oxidation reactions of 1- and 2-naphthols; experimental and theoretical study 83
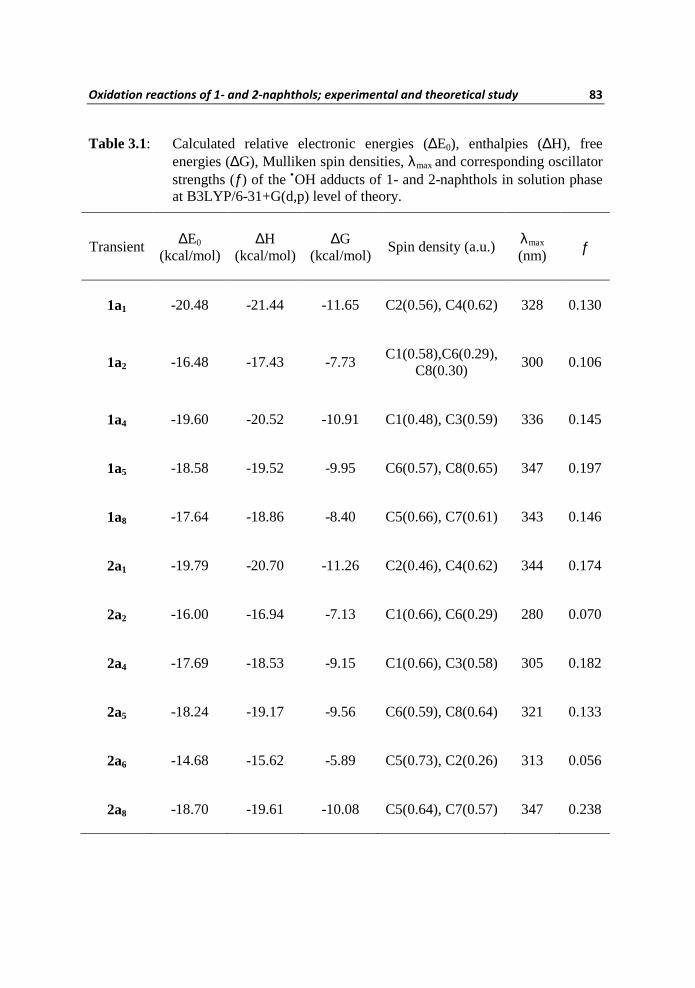
Table 3.1: Calculated relative electronic energies (∆E0), enthalpies (∆H), free energies (∆G), Mulliken spin densities, λmax and corresponding oscillator strengths (ƒ) of the •OH adducts of 1- and 2-naphthols in solution phase at B3LYP/6-31+G(d,p) level of theory.
Transient ∆E0 (kcal/mol)
∆H (kcal/mol)
∆G (kcal/mol)
Spin density (a.u.) λmax
(nm) ƒ
1a1 -20.48 -21.44 -11.65 C2(0.56), C4(0.62) 328 0.130
1a2 -16.48 -17.43 -7.73 C1(0.58),C6(0.29),
C8(0.30) 300 0.106
1a4 -19.60 -20.52 -10.91 C1(0.48), C3(0.59) 336 0.145
1a5 -18.58 -19.52 -9.95 C6(0.57), C8(0.65) 347 0.197
1a8 -17.64 -18.86 -8.40 C5(0.66), C7(0.61) 343 0.146
2a1 -19.79 -20.70 -11.26 C2(0.46), C4(0.62) 344 0.174
2a2 -16.00 -16.94 -7.13 C1(0.66), C6(0.29) 280 0.070
2a4 -17.69 -18.53 -9.15 C1(0.66), C3(0.58) 305 0.182
2a5 -18.24 -19.17 -9.56 C6(0.59), C8(0.64) 321 0.133
2a6 -14.68 -15.62 -5.89 C5(0.73), C2(0.26) 313 0.056
2a8 -18.70 -19.61 -10.08 C5(0.64), C7(0.57) 347 0.238
84 Chapter III
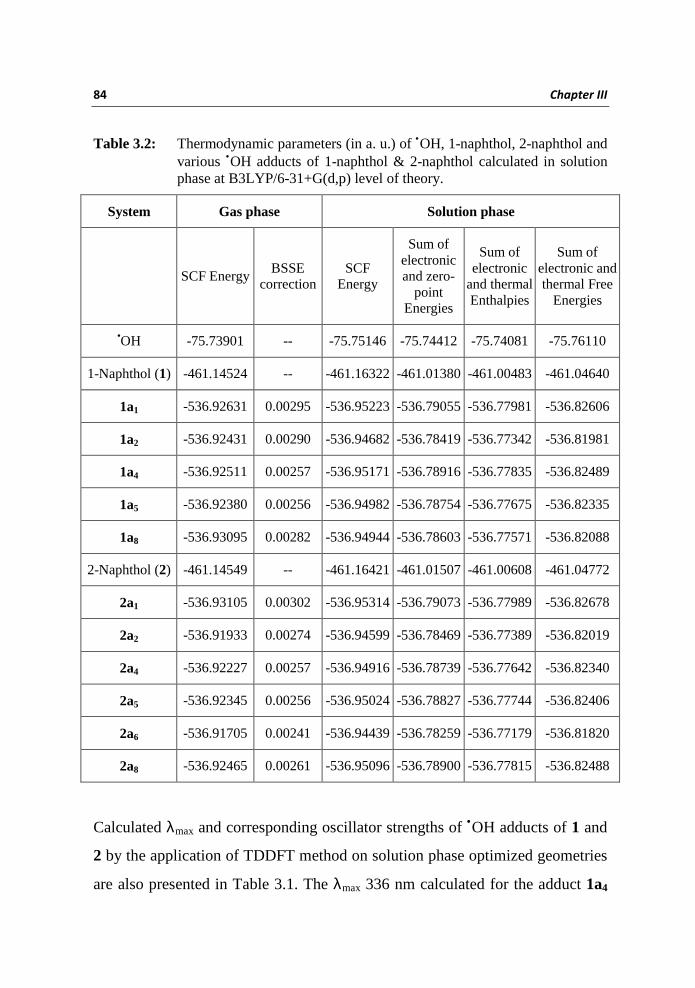
Table 3.2: Thermodynamic parameters (in a. u.) of •OH, 1-naphthol, 2-naphthol and various •OH adducts of 1-naphthol & 2-naphthol calculated in solution phase at B3LYP/6-31+G(d,p) level of theory.
System Gas phase Solution phase
SCF Energy
BSSE correction
SCF Energy
Sum of electronic and zero-
point Energies
Sum of electronic
and thermal Enthalpies
Sum of electronic and thermal Free
Energies
•OH -75.73901 -- -75.75146 -75.74412 -75.74081 -75.76110
1-Naphthol (1) -461.14524 -- -461.16322 -461.01380 -461.00483 -461.04640
1a1 -536.92631 0.00295 -536.95223 -536.79055 -536.77981 -536.82606
1a2 -536.92431 0.00290 -536.94682 -536.78419 -536.77342 -536.81981
1a4 -536.92511 0.00257 -536.95171 -536.78916 -536.77835 -536.82489
1a5 -536.92380 0.00256 -536.94982 -536.78754 -536.77675 -536.82335
1a8 -536.93095 0.00282 -536.94944 -536.78603 -536.77571 -536.82088
2-Naphthol (2) -461.14549 -- -461.16421 -461.01507 -461.00608 -461.04772
2a1 -536.93105 0.00302 -536.95314 -536.79073 -536.77989 -536.82678
2a2 -536.91933 0.00274 -536.94599 -536.78469 -536.77389 -536.82019
2a4 -536.92227 0.00257 -536.94916 -536.78739 -536.77642 -536.82340
2a5 -536.92345 0.00256 -536.95024 -536.78827 -536.77744 -536.82406
2a6 -536.91705 0.00241 -536.94439 -536.78259 -536.77179 -536.81820
2a8 -536.92465 0.00261 -536.95096 -536.78900 -536.77815 -536.82488
Calculated λmax and corresponding oscillator strengths of •OH adducts of 1 and
2 by the application of TDDFT method on solution phase optimized geometries
are also presented in Table 3.1. The λmax 336 nm calculated for the adduct 1a4
Oxidation reactions of 1- and 2-naphthols; experimental and theoretical study 85
agrees well with the experimentally observed transient λmax 340 nm in the
reaction of •OH with 1 at neutral pH. Obviously, in terms of free energy, the
stability of this kinetic adduct is only 0.74 kcal/mol less than the
thermodynamic adduct 1a1. The thermodynamic adduct 1a1 can also contribute
towards the experimental spectrum even though the calculated λmax 328 nm
differs by 12 nm (blue shift) with respect to the experimental λmax; a difference
(12 nm) which is in the acceptable limit by considering the uncertainty in the
experimental transient absorption spectroscopy and the TDDFT theoretical
calculations. Although, the calculated λmax values of 1a5 and 1a8 are coinciding
with the experimental λmax, the feasibility of the formations of these adducts are
less in accordance with their enthalpy and free energy formations as compared
to 1a1 or 1a4. Therefore, with the aid of the prevailing theoretical results, the
experimental spectrum in the reaction of •OH with 1 at neutral pH is assigned as
a result of adducts 1a1 and 1a4.
The optical absorptions calculated for the most stable thermodynamic adduct
2a1 with λmax 343 nm and the next stable thermodynamic adduct 2a8 (λmax 347
nm) agrees well with the experimental λmax of 350 nm observed in the reaction
of •OH with 2 at neutral pH. Moreover, 2a1 and 2a8 are produced as a result of •OH additions to the leading contributors of the HOMO of 2 (Figure 3.4). Thus,
the λmax calculations are also in favor of the formations of
kinetic/thermodynamic driven products (viz., 2a1 and 2a8) of •OH reaction with
2. Accordingly, on the basis of theoretical calculations it can be perceived that
the experimental spectrum for •OH reactions of 2 at neutral pH is attributed due
to 2a1 and 2a8 formations.
86 Chapter III
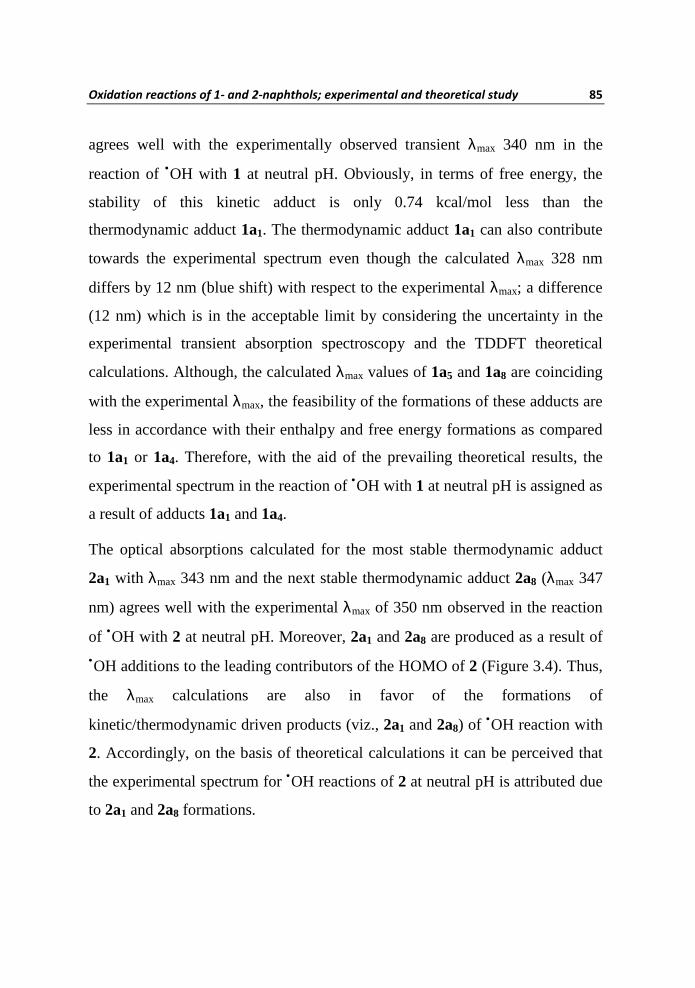
3.2.3. Oxidation product analyses
Further insights to •OH reaction mechanisms of 1 and 2 were obtained by the
evaluation of preliminary oxidation products derived from UV/H2O2 method.
Table 3.3 summarizes the results (the retention time and m/z values of the major
products) of the analyses by using UPLC–Q-TOF-MS technique performed on
degraded samples solutions of 1 and 2 via the UV/H2O2 method. Three major
products were identified in the •OH reactions of 1 with N2-saturation; two of
them have an [M-H]– value of 159.04 with retention time (RT) at 2.5 and 2.9
min while the third one possess an [M+H]+ value of 159.04 with RT at 2.1 min.
First stage ESI-MS spectra of the oxidation products of 1-naphthol & 2-
naphthol (with and without N2 -saturation) analyzed by using UPLC-Q-TOF-
MS technique is given in figure 3.7 to 3.10.
Figure 3.7: First stage ESI-MS spectra of oxidation products of 1-naphthol (with N2-
saturation)
Oxidation reactions of 1- and 2-naphthols; experimental and theoretical study 87
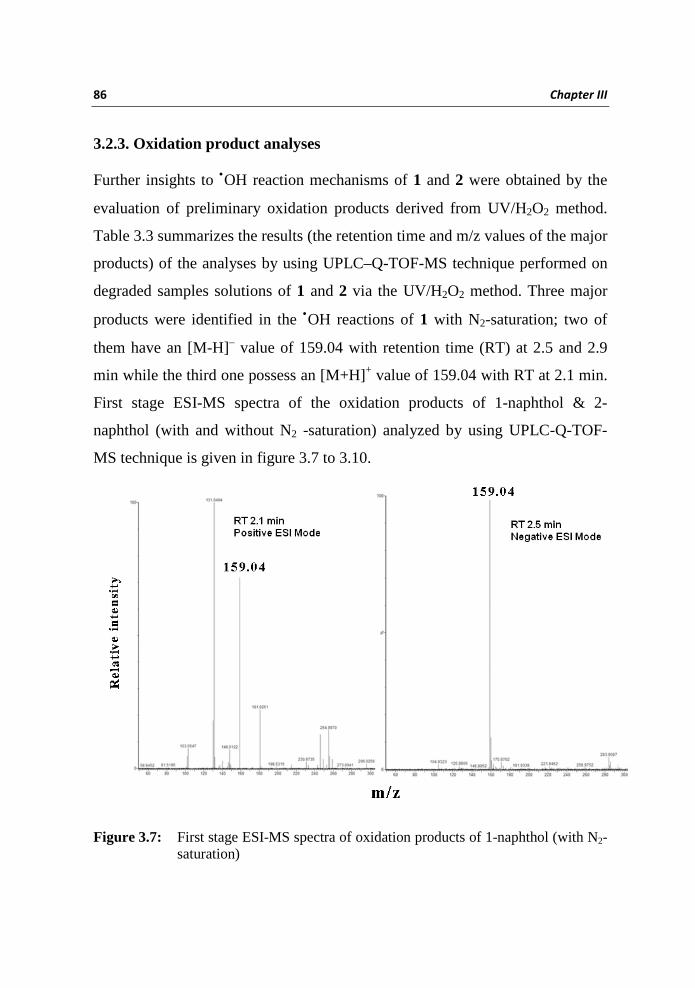
Figure 3.8: Additional peaks observed for 1-naphthol (without N2-saturation)
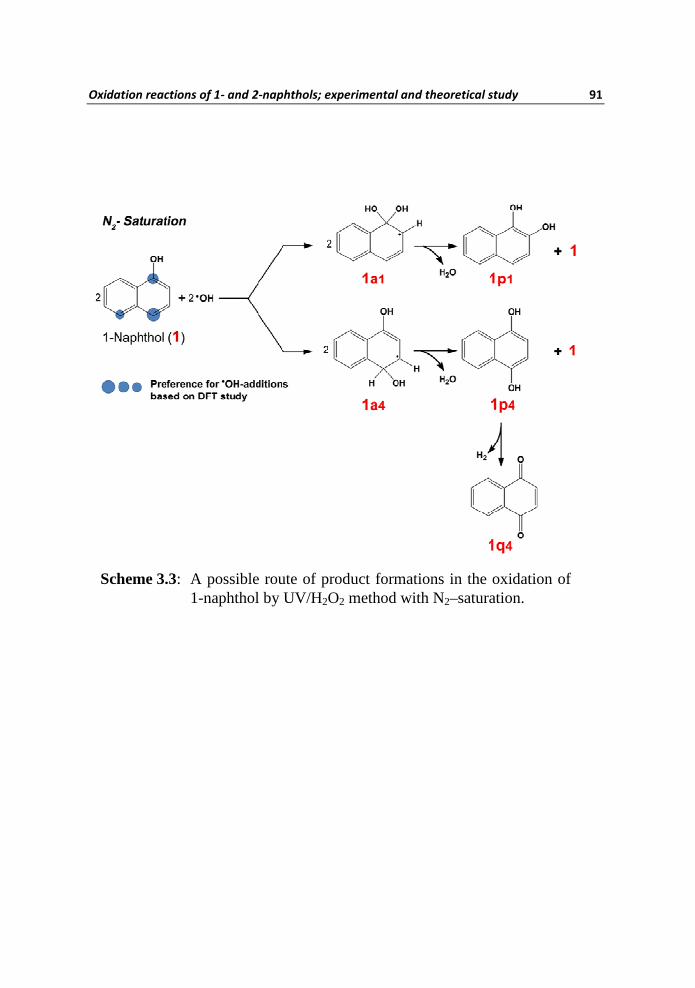
Based on the analyses of MS/MS fragmentation patterns and also taking
account of the feasibilities of initial •OH attack to the ring of 1 (based on our
theoretical studies as shown above), we have deduced the structures of the
degradation products as the di-hydroxy naphthalenes 1p1 and 1p4 and the
naphthoquinone 1q4 (Scheme 3.3). The product 1p1 results from the ipso-
addition of •OH (most stable thermodynamic transient) while 1p4 results from
the initial •OH attack at C4 (next stable thermodynamic but the most feasible
kinetic transient). Obviously, Scheme 3.3 represents one of the possible
mechanistic pathways for product formations. However, in the presence of
oxygen (O2) additional peaks have been observed in the total ion chromatogram

88 Chapter III
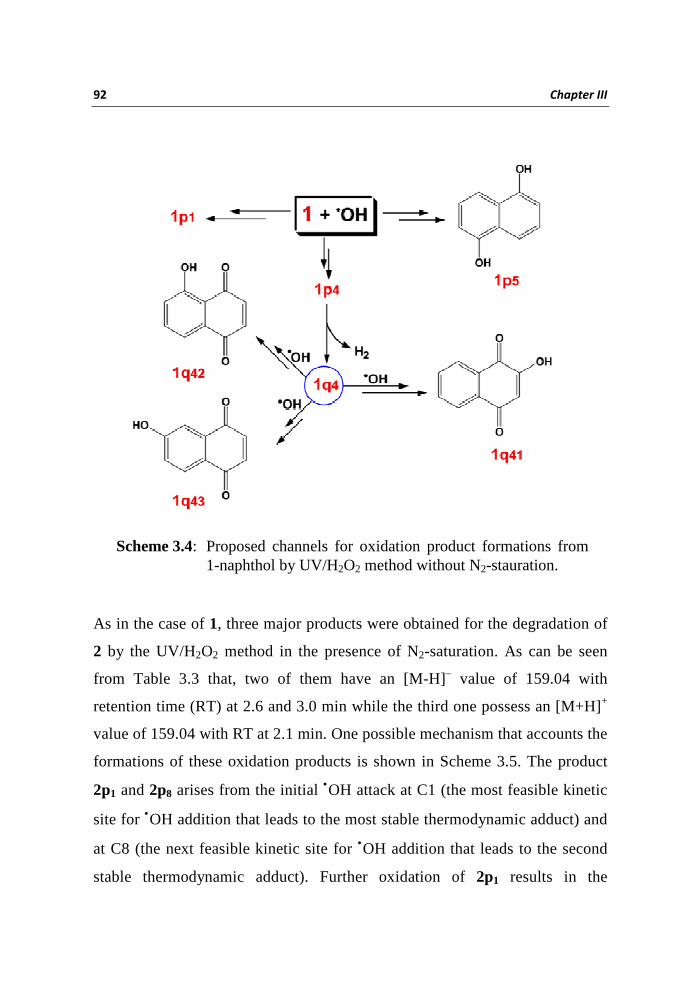
(TIC) besides 1p1, 1p4 and 1q1. The TIC in the presence of oxygen in the
negative ionization mode have species with identical [M-H] – mass of 159.04
observed at RT 1.9, 2.5, and 2.9 min; these peaks were assigned as due to the
formations of isomeric di-hydroxy naphthalenes 1p5, 1p4 and 1p1. The TIC in
the positive ionization mode has a peak with an [M+H]+ value of 159.04 at RT
2.1 min and the product is identified as 1q4. Products with identical [M-H]–
mass of 173.02 were observed at RT 1.0, 1.5 and 2.0 min; which is consistent
with hydroxylation of 1q4 and the isomeric products were assigned as 1q41, 1q42
and 1q43 (Scheme 3.4).
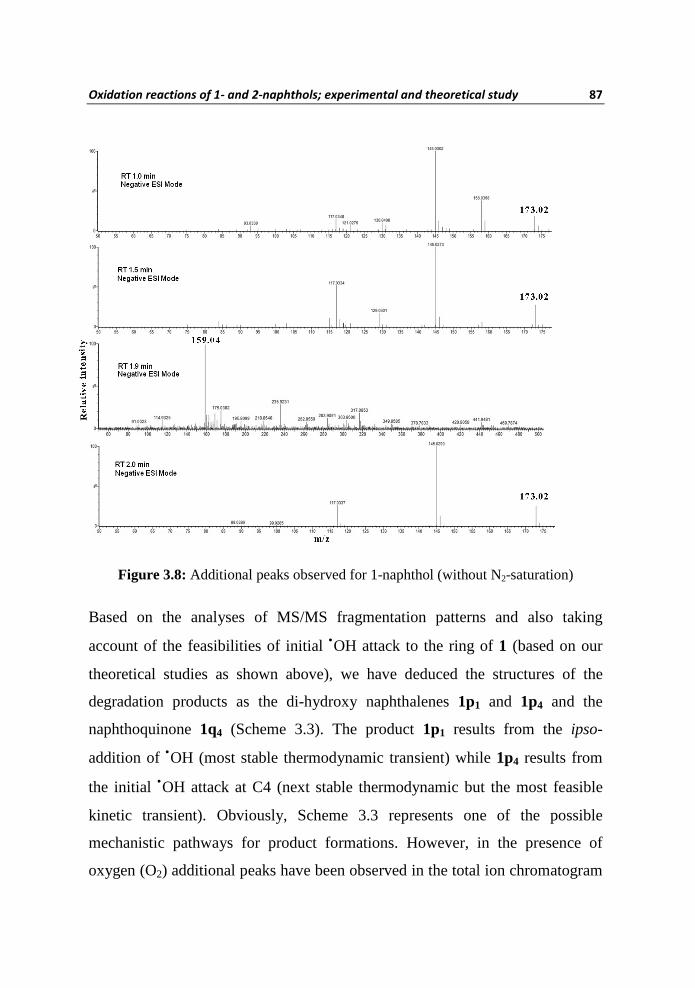
Figure 3.9: First stage ESI-MS spectra of oxidation products of 2-naphthol (with N2-saturation)
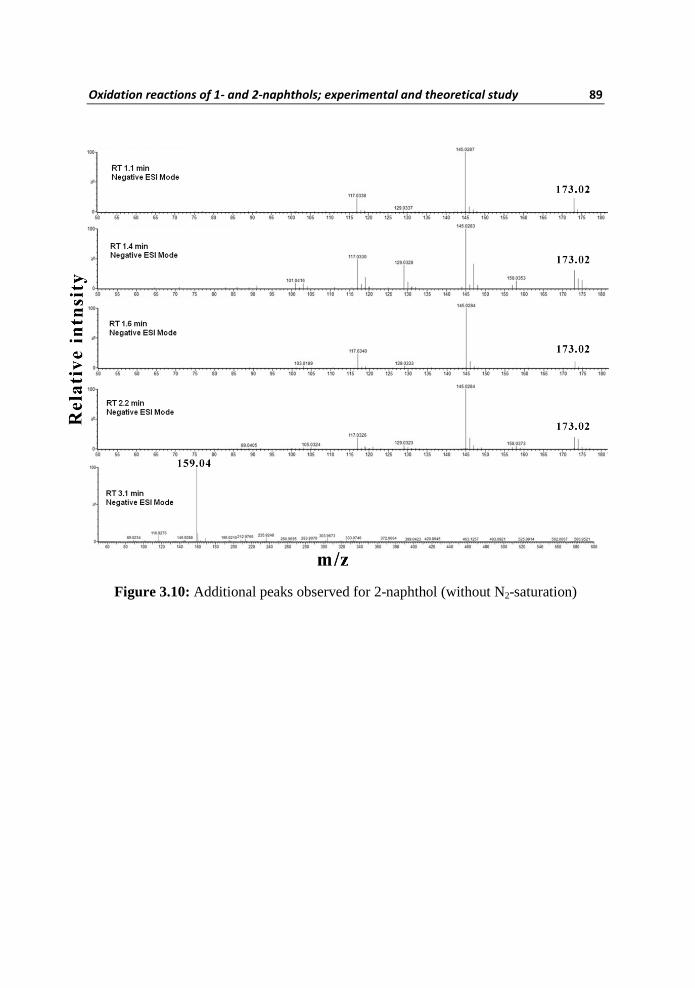
Oxidation reactions of 1- and 2-naphthols; experimental and theoretical study 89
Figure 3.10: Additional peaks observed for 2-naphthol (without N2-saturation)
90 Chapter III
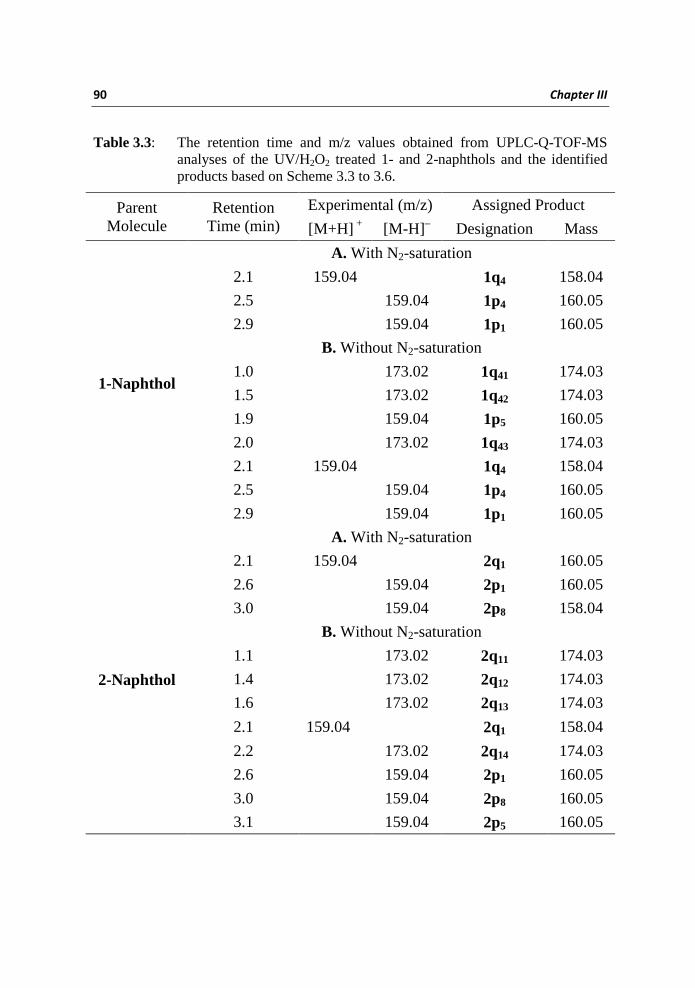
Table 3.3: The retention time and m/z values obtained from UPLC-Q-TOF-MS analyses of the UV/H2O2 treated 1- and 2-naphthols and the identified products based on Scheme 3.3 to 3.6.
Parent Molecule
Retention Time (min)
Experimental (m/z) Assigned Product
[M+H] + [M-H] – Designation Mass
1-Naphthol
A. With N2-saturation
2.1 159.04 1q4 158.04
2.5 159.04 1p4 160.05
2.9 159.04 1p1 160.05
B. Without N2-saturation
1.0 173.02 1q41 174.03
1.5 173.02 1q42 174.03
1.9 159.04 1p5 160.05
2.0 173.02 1q43 174.03
2.1 159.04 1q4 158.04
2.5 159.04 1p4 160.05
2.9 159.04 1p1 160.05
2-Naphthol
A. With N2-saturation
2.1 159.04 2q1 160.05
2.6 159.04 2p1 160.05
3.0 159.04 2p8 158.04
B. Without N2-saturation
1.1 173.02 2q11 174.03
1.4 173.02 2q12 174.03
1.6 173.02 2q13 174.03
2.1 159.04 2q1 158.04
2.2 173.02 2q14 174.03
2.6 159.04 2p1 160.05
3.0 159.04 2p8 160.05
3.1 159.04 2p5 160.05
Oxidation reactions of 1- and 2-naphthols; experimental and theoretical study 91
Scheme 3.3: A possible route of product formations in the oxidation of 1-naphthol by UV/H2O2 method with N2–saturation.
92 Chapter III
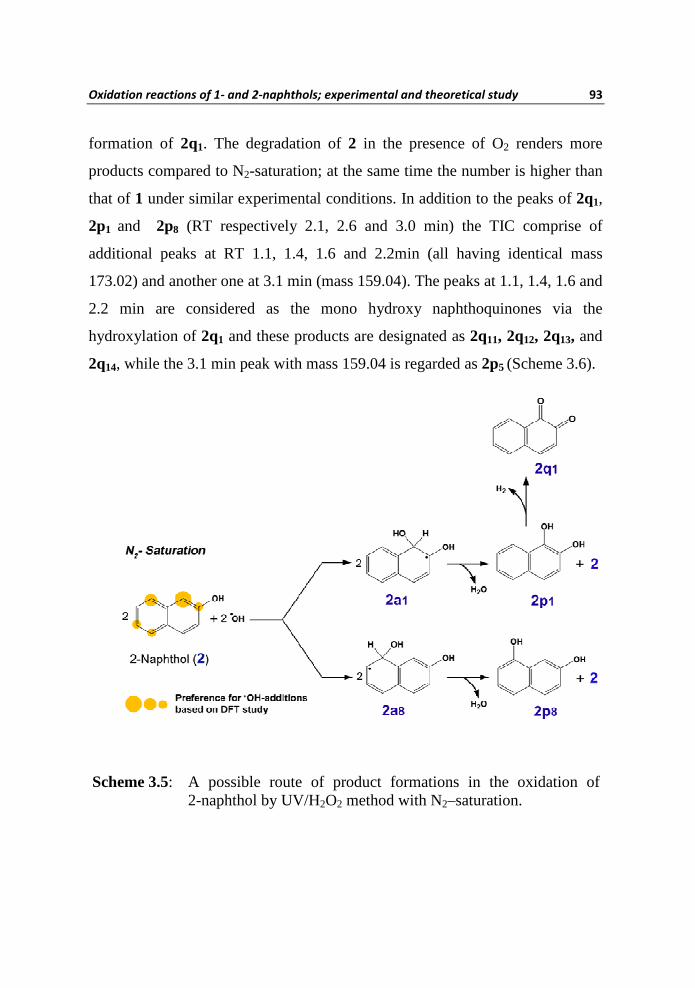
As in the case of 1, three major products were obtained for the degradation of
2 by the UV/H2O2 method in the presence of N2-saturation. As can be seen
from Table 3.3 that, two of them have an [M-H]– value of 159.04 with
retention time (RT) at 2.6 and 3.0 min while the third one possess an [M+H]+
value of 159.04 with RT at 2.1 min. One possible mechanism that accounts the
formations of these oxidation products is shown in Scheme 3.5. The product
2p1 and 2p8 arises from the initial •OH attack at C1 (the most feasible kinetic
site for •OH addition that leads to the most stable thermodynamic adduct) and
at C8 (the next feasible kinetic site for •OH addition that leads to the second
stable thermodynamic adduct). Further oxidation of 2p1 results in the
Scheme 3.4: Proposed channels for oxidation product formations from 1-naphthol by UV/H2O2 method without N2-stauration.
Oxidation reactions of 1- and 2-naphthols; experimental and theoretical study 93
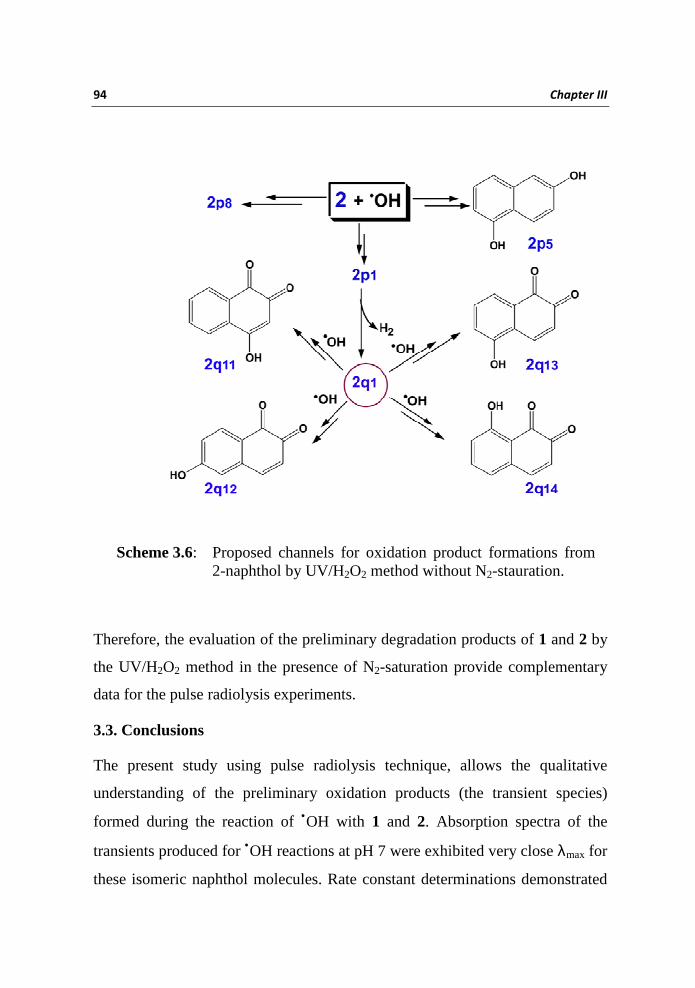
formation of 2q1. The degradation of 2 in the presence of O2 renders more
products compared to N2-saturation; at the same time the number is higher than
that of 1 under similar experimental conditions. In addition to the peaks of 2q1,
2p1 and 2p8 (RT respectively 2.1, 2.6 and 3.0 min) the TIC comprise of
additional peaks at RT 1.1, 1.4, 1.6 and 2.2min (all having identical mass
173.02) and another one at 3.1 min (mass 159.04). The peaks at 1.1, 1.4, 1.6 and
2.2 min are considered as the mono hydroxy naphthoquinones via the
hydroxylation of 2q1 and these products are designated as 2q11, 2q12, 2q13, and
2q14, while the 3.1 min peak with mass 159.04 is regarded as 2p5 (Scheme 3.6).
Scheme 3.5: A possible route of product formations in the oxidation of 2-naphthol by UV/H2O2 method with N2–saturation.
94 Chapter III
Therefore, the evaluation of the preliminary degradation products of 1 and 2 by
the UV/H2O2 method in the presence of N2-saturation provide complementary
data for the pulse radiolysis experiments.
3.3. Conclusions
The present study using pulse radiolysis technique, allows the qualitative
understanding of the preliminary oxidation products (the transient species)
formed during the reaction of •OH with 1 and 2. Absorption spectra of the
transients produced for •OH reactions at pH 7 were exhibited very close λmax for
these isomeric naphthol molecules. Rate constant determinations demonstrated
Scheme 3.6: Proposed channels for oxidation product formations from 2-naphthol by UV/H2O2 method without N2-stauration.
Oxidation reactions of 1- and 2-naphthols; experimental and theoretical study 95
the diffusion controlled nature of •OH reactions of 1 and 2. Results of DFT
calculations for •OH reactions of both naphthols provide a conceptual
framework of the most applicable reaction mechanism. The preferential attack
of •OH at C4 site of 1 is mainly responsible for the experimental spectrum,
whereas addition at C1 is dictated in the case of 2; agreement between
experimental and theoretical λmax max of the kinetic transients in both 1 and 2
validate this possibility again. However, naphthoxyl radical was proposed as the
transient observed at pH 10.5 via the •OH induced oxidation of 1(2). Moreover,
the reactions of 1 and 2 with specific one-electron oxidants O•– (at pH~13) and
N3• (at pH 7) also point at naphthoxyl radical formations. We suggest that, in
addition to •OH, the other radicals viz. O•– and N3• used in the present study are
also effective for the degradation of naphthols, but comprehensive experimental
studies are required to determine their effectiveness in advanced oxidation
processes. The formations of isomeric dihydroxy naphthalenes as products in
the oxidation via UV/H2O2 treatment clearly demonstrate the selective addition
of •OH at C1, C4 & C5 of 1 and at C1, C5 & C8 of 2. Our present experimental
and theoretical results along with UPLC-Q-TOF data should serve as useful
guides to the understanding of •OH induced oxidation of naphthols.
96 Chapter III
References
1 Zollinger, H., Color Chemistry: 2E. Wiley-VCH 1991.
2. H. S. Freeman, G. N. M., Kent and Riegel’s Handbook of Industrial
Chemistry and Biotechnology, James A. Kent., Ed. Springer 2007.
3. Kuhr, R. J. D., H. W., Toxicology Biochemistry and Chemistry, Kuhr,
R. J., Ed. . CRC Press: Cleveland, Ohio, USA, 1976.
4. Preuss, R.; Angerer, J.; Drexler, H., Int. Arch. Occup. Environ. Health
2003, 76, 556-576.
5. Roger. Atkinson.; J. A., Barbara. Zielinska.; Sara M. Aschmann.,
Environ. Sci. Technol. 1987, 21, 1014-1022.
6. Crosby, D. G.; Leitis, E.; Winterlin, W. L., J. Agri. Food Chem 1965,
13, 204-207.
7. Karinen, J. F.; Lamberton, J. G.; Stewart, N. E.; Terriere, L. C., Agri.
Food Chem 1967, 15, 148-156.
8. Bollag, J. M.; Czaplicki, E. J.; Minard, R. D., Agri. Food Chem 1975,
23, 85-90.
9. Wolfe, N. L.; Zepp, R. G.; Paris, D. F., Water Research 1978, 12, 565-
571.
10. Cerniglia, C.; Freeman, J. P.; Evans, F., Arch. Microbiol. 1984, 138,
283-286.
11. Boyd, C.; Reid, K .A.; Sharma, N .D.; Wilson, K., Appl. Environ.
Microbiol. 1997, 63, 151-155.
Oxidation reactions of 1- and 2-naphthols; experimental and theoretical study 97
12. Cho, T. M.; Rose, R. L.; Hodgson, E., Drug Metabolism and Disposition
2006, 34, 176-183.
13. Croera, C.; Ferrario, D.; Gribaldo, L., Toxicology in Vitro 2008, 22,
1555-1561.
14. Smith, C. J.; Walcott, C. J.; Huang, W.; Maggio, V.; Grainger, J.;
Patterson Jr, D. G., J. Chromatogr. B 2002, 778,157-164.
15. Yang, H.; Wang, Y.; Wang, Y.; Li, J.; Xiao, X.; Tan, X., Spectrochim.
Acta, Part A: Mol.Biomolecular. Spectroscopy 2008, 71, 1290-1295.
16. Weller, A., Progress In Reaction Kinetics And Mechanism 1961, 1, 187-
214.
17. Ireland, J. F.; Wyatt, P. A. H., Advances in Phys. Org. Chem, Gold, V.,
Ed. Academic Press 1976, 12, 131-221.
18. Arnaut, L. G.; Formosinho, S. J., J. Photochem. Photobiol., A:
Chemistry 1993, 75, 1-20.
19. Barroso, M.; Arnaut, L. G.; Formosinho, S. J., J. Photochem. Photobiol.,
A: Chemistry 2002, 154, 13-21.
20. Tolbert, L. M.; Solntsev, K. M., Acc. Chem. Res. 2001, 35, 19-27.
21. Magnes, B. Z.; Pines, D.; Strashnikova, N.; Pines, E., Solid State Ionics
2004, 168, 225-233.
22. Agmon, N., J. Phys. Chem. A 2004, 109, 13-35.
23. Prémont-Schwarz, M.; Xiao, D.; Batista, V. S.; Nibbering, E. T. J., J.
Phys. Chem. A 2011, 115 , 10511-10516.
98 Chapter III
24. Land, E. J.; Ebert, M., Trans. Faraday Society 1967, 63, 1181-1190.
25. Klein, G. W.; Bhatia, K.; Madhavan, V.; Schuler, R. H., J. Phys. Chem.
1975, 79, 1767-1774.
26. Raghavan, N. V.; Steenken, S., J. Am. Chem. Soc 1980, 102, 3495-3499.
27. Roder, M.; Wojnárovits, L.; Földiák, G.; Emmi, S. S.; Beggiato, G.;
D’Angelantonio, M., Radiat. Phys. Chem 1999, 54, 475-479.
28. Mvula, E.; Schuchmann, M. N.; von Sonntag, C., J. Chem. Soc., Perkin
Trans. 2 2001, 3, 264-268.
29. Albarrán, G.; Schuler, R. H., Radiat. Phys. Chem 2002, 63, 661-663.
30. Tripathi, G. N. R., J. Chem. Phys 2003, 118, 1378-1391.
31. Tripathi, G. N. R.; Su, Y., J. Phys. Chem. A 2004, 108, 3478-3484.
32. Albarran, G.; Schuler, R. H., J. Phys. Chem. A 2005, 109, 9363-9370.
33. Bonin, J.; Janik, I.; Janik, D.; Bartels, D. M., J. Phys. Chem. A 2007,
111, 1869-1878.
34. Albarran, G.; Schuler, R. H., J. Phys. Chem. A 2007, 111, 2507-2510.
35. Singh, U.; Barik, A.; Priyadarsini, K. I., Bioorg. Med. Chem 2009, 17,
6008-6014.
36. Das, T. N., J. Phys. Org. Chem 2009, 22, 872-88234.
37. Lundqvist, M. J.; Eriksson, L. A., J. Phys. Chem. B 2000, 104, 848-855.
38. Peller, J.; Kamat, P. V., J. Phys. Chem. A 2005, 109 , 9528-9535.
Oxidation reactions of 1- and 2-naphthols; experimental and theoretical study 99
39. Matthews, R. W., Water Res 1986, 20, 569-578.
40. Mihelcic, J. R.; Luthy, R. G., Appl. Environ. Microbiol. 1988, 54, 1182-
1187.
41. Armbrust, K. L.; Crosby, D. G., Pac Sci 1991, 45, 314-320.
42. Karthikeyan, K. G.; Chorover, J.; Bortiatynski, J. M.; Hatcher, P. G.,
Environmental Science & Technology 1999, 33, 4009-4015.
43. Karthikeyan, K. G.; Chorover, J., Environ. Sci. Technol 2000, 34, 2939-
2946.
44. Panizza, M.; Cerisola, G., Electrochimica Acta 2003, 48, 1515-1519.
45. Qourzal, S.; Tamimi, M.; Assabbane, A.; Ait-Ichou, Y., J. Colloid
Interface Sci 2005, 286, 621-626.
46. He, Y.; Lv, Y.; Hu, J.; Qi, L.; Hou, X., Luminescence 2007, 22, 309-
316.
47. Qourzal, S.; Barka, N.; Tamimi, M.; Assabbane, A.; Ait-Ichou, Y., Appl.
Catal., A: General 2008, 334, 386-393.
48. Qourzal, S.; Barka, N.; Tamimi, M.; Assabbane, A.; Nounah, A.; Ihlal,
A.; Ait-Ichou, Y., Mater. Sci. Eng: C 2009, 29, 1616-1620.
49. Qourzal, S.; Tamimi, M.; Assabbane, A.; Ait-Ichou, Y., M. J.
Condensed Mater. 2009, 11, 55-59.
50. Karunakaran, C.; Narayanan, S.; Gomathisankar, P., J. Hazard. Mater
2010, 181, 708-715.
100 Chapter III
51. Zang, S.; Lian, B.; Wang, J.; Yang, Y., J. Environ. Sci 2010, 22, 669-
674.
52. Sinha, S.; De, R.; Ganguly, T.; De, A. K.; Nandy, S. K., J. Lumin 1997,
75, 99-116.
53. Mohan, H.; Hermann, R.; Naumov, S.; Mittal, J. P.; Brede, O., J. Phys.
Chem. A 1998, 102, 5754-5762.
54. Hermann, R.; Dey, G. R.; Naumov, S.; Brede, O., Phys. Chem. Chem.
Phys 2000, 2, 1213-1220.
55. Hermann, R.; Naumov, S.; Brede, O., THEOCHEM 2000, 532, 69-80.
56. Mohan, H.; Brede, O.; Mittal, J. P., J. Photochem. Photobiol., A:
Chemistry 2001, 140 , 191-197.
57. Baidak, A.; Naumov, S.; Hermann, R.; Brede, O., J. Phys. Chem. A
2008, 112, 11036-11043.
58. Riyad, Y. M.; Naumov, S.; Hermann, R.; Brede, O.; Abel, B., Chem.
Phys. Lett 2009, 477, 290-297.
59. Riyad, Y. M.; Naumov, S.; Hermann, R.; Abel, B., J. Phys. Chem. A
2010, 115, 718-725.
60. Das, T. N.; Neta, P., J. Phys. Chem. A 1998, 102 (35), 7081-7085.
61. Fang, X.; Pan, X.; Rahmann, A.; Schuchmann, H.-P.; von Sonntag, C.,
Chemistry – A European Journal 1995, 1 (7), 423-429.
Oxidation reactions of 1- and 2-naphthols; experimental and theoretical study 101
62. Pramod, G.; Prasanthkumar, K. P.; Mohan, H.; Manoj, V. M.; Manoj, P.;
Suresh, C. H.; Aravindakumar, C. T., J. Phys. Chem. A 2006, 110 (40),
11517-11526.
63. Prasanthkumar, K. P.; Mohan, H.; Pramod, G.; Suresh, C. H.;
Aravindakumar, C. T., Chem. Phys. Lett 2009, 467 (4-6), 381-386.
64. Prasanthkumar, K. P.; Suresh, C. H.; Aravindakumar, C. T., Radiat.
Phys. Chem 2012, 81 (3), 267-272.
65. Prasanthkumar, K. P.; Suresh, C. H.; Aravindakumar, C. T., J. Phys.
Chem. A 2012, 116 (44), 10712-1072