oxford zero emission zone feasibility and implementation study · oxford zero emission zone...
TRANSCRIPT
Oxford Zero Emission Zone Feasibility and Implementation Study
Final report ___________________________________________________
Report for Oxford City Council and Oxfordshire County Council
ED 10000 | Issue Number 1 | Date 31/07/2017
Ricardo in Confidence
Oxford Zero Emission Zone Feasibility and Implementation Study | i
Ricardo in Confidence Ref: Ricardo/ED10000/Issue Number 1
Ricardo Energy & Environment
Customer: Contact:
Oxford City Council and Oxfordshire County Council
David Birchby
Ricardo Energy & Environment
Gemini Building, Harwell, Didcot, OX11 0QR, United Kingdom
t: +44 (0) 1235 75 3555
Ricardo-AEA Ltd is certificated to ISO9001 and ISO14001
Customer reference:
.
Confidentiality, copyright & reproduction:
This report is the Copyright of Oxford City Council and Oxfordshire County Council. It has been prepared by Ricardo Energy & Environment, a trading name of Ricardo-AEA Ltd, under contract to Oxford City Council dated 07/12/2016. The contents of this report may not be reproduced in whole or in part, nor passed to any organisation or person without the specific prior written permission of Oxford City Council. Ricardo Energy & Environment accepts no liability whatsoever to any third party for any loss or damage arising from any interpretation or use of the information contained in this report, or reliance on any views expressed therein.
Author:
Guy Hitchcock, David Birchby, Celine Bouvet, Dan Clarke
Approved By:
Guy Hitchcock
Date:
31 July 2017
Ricardo Energy & Environment reference:
Ref: ED10000- Issue Number 1
Oxford Zero Emission Zone Feasibility and Implementation Study | ii
Ricardo in Confidence Ref: Ricardo/ED10000/Issue Number 1
Ricardo Energy & Environment
Table of contents
1 Introduction ................................................................................................................ 1
2 Stakeholder engagement .......................................................................................... 3
2.1 Internal stakeholder workshop .......................................................................................... 3
2.2 External stakeholder workshop ......................................................................................... 4
3 Understanding the vehicle fleet and technology ..................................................... 7
3.1 Zero emission vehicle technology ..................................................................................... 7
3.2 Characteristics of the current fleet................................................................................... 10
3.3 Refuelling technology ...................................................................................................... 11
3.4 Implications for the ZEZ .................................................................................................. 14
4 Developing scheme options .................................................................................... 15
4.1 Objectives and scope of a ZEZ ....................................................................................... 15
4.2 Scheme boundaries ........................................................................................................ 15
4.3 Outline options................................................................................................................. 22
4.4 Short listing the options ................................................................................................... 25
5 Emissions and air quality assessment of preferred options ................................ 26
5.1 Outline methodology ....................................................................................................... 26
5.2 Summary emissions results ............................................................................................ 27
5.3 Pollution concentration results ........................................................................................ 37
6 Economic assessment ............................................................................................ 40
6.1 Introduction and over-arching approach ......................................................................... 40
6.2 Costs of replacing vehicles .............................................................................................. 41
6.3 Infrastructure costs .......................................................................................................... 42
6.4 Implementation costs ...................................................................................................... 43
6.5 Assessments of benefits associated with emissions savings ......................................... 44
6.6 Assessment of GHG impacts .......................................................................................... 45
6.7 Wider impacts .................................................................................................................. 46
6.8 Summary assessment and CBA results .......................................................................... 47
7 Implementation aspects .......................................................................................... 51
7.1 Legal basis and enforcement .......................................................................................... 51
7.2 Supporting measures and incentives .............................................................................. 52
8 Conclusions and recommendations ....................................................................... 55
8.1 Overall approach to developing the ZEZ ......................................................................... 55
8.2 Emissions and air quality results ..................................................................................... 56
Oxford Zero Emission Zone Feasibility and Implementation Study | iii
Ricardo in Confidence Ref: Ricardo/ED10000/Issue Number 1
Ricardo Energy & Environment
8.3 Economic assessment .................................................................................................... 56
8.4 Implementation issues ..................................................................................................... 57
8.5 Conclusions and further work .......................................................................................... 58
Appendices
Appendix 1: Further details on emissions and air quality modelling methodology
Appendix 2: Further details on cost benefit analysis methodology
Appendix 3: Relationship between original option names and new names used in this report
Appendix 4: Supporting tables for vkm and NOx emissions
Appendix 5: Glossary
Oxford Zero Emission Zone Feasibility and Implementation Study | 1
Ricardo in Confidence Ref: Ricardo/ED10000/Issue Number 1
Ricardo Energy & Environment
1 Introduction
Oxford, like many cities across the UK, is suffering from poor air quality and is failing to meet air quality limit values in relation to nitrogen dioxide (NO2). The worst affected areas are around busy and congested roads, with transport being the main source of nitrogen oxide (NOx) emissions that are responsible for NO2 pollution. In response to these challenges, Oxford City Council (referred to from here as ‘the City Council’) declared the whole city an Air Quality Management Area (AQMA) in 2010 and drew up an Air Quality Action Plan (AQAP) to tackle the problem in 20131.
One of the key measures in the AQAP was the implementation of a bus-based low emission zone (LEZ) for the city centre which came into force in 2014. This was developed jointly with Oxfordshire County Council who are the responsible transport authority. Building on the success of the LEZ, and seeking to improve air quality further, the City and County Councils made a commitment to developing a Zero Emission Zone (ZEZ) in the city centre as part of the Oxford Transport Strategy (OTS)2. The ambition is set out in the OTS as follows:
“to start a city centre zero-emission zone for all vehicles by 2020, with the zone being gradually expanded over time as the required infrastructure and technology develops. This will support objectives to improve air quality and targets to reduce emissions from vehicles. Further private sector investment from operators on all routes will be required, not just the short to medium range services, and be achieved through the deployment of electric buses, advanced electric-diesel hybrid vehicles with an electric drive mode for emission-free operation in built up areas, and routeing changes as outlined above.
As battery and induction charging technology improves, vehicles will be able to cross the whole city whilst on full electric power, enabling the creation of a city-wide zero-emission zone by 2035. Vehicles which cannot comply with specific emission standards will be required to terminate at Park & Ride sites outside of the city.”
The key aspects of this commitment are the desire for a ZEZ (of some form) introduced by 2020, expanding to a more comprehensive scheme by 2035 as technology develops. This commitment is in line with Governments latest proposals in its Air Quality plan to ban new petrol and diesel cars by 2040 and support the uptake of zero emission vehicles3.
The aims of this current study are to carry out an initial feasibility assessment of a ZEZ for Oxford and to support the City and County Councils to take the idea further. The key objectives are to:
• Identify the scope of the scheme in terms of geography and vehicle types from 2020 to 2035 as the scheme develops
• Carry out an emission, air quality and cost-benefit assessment of the main scheme options
• Consider implementation aspects such as the legal basis for implementation
• Carry out initial stakeholder engagement.
This is the final report of this study presenting the findings of the work carried out. It is structured as follows:
• Section 2 provides a summary of the stakeholder engagement carried out and how this influenced the choice of options to assess.
• Section 3 provides an overview of zero emission vehicle (ZEV) technology, the current vehicle fleet in Oxford and the implications for developing a ZEZ.
1 https://www.oxford.gov.uk/info/20216/air_quality_management/206/air_quality_management_in_oxford/2 2 ‘Oxford Transport Strategy - Connecting Oxfordshire: Volume 2 Section I’, Oxfordshire County Council, 2015 3 ‘UK plan for tackling roadside nitrogen dioxide concentrations’, DEFRA/DfT, July 2017: https://www.gov.uk/government/publications/air-quality-plan-for-nitrogen-dioxide-no2-in-uk-2017

Oxford Zero Emission Zone Feasibility and Implementation Study | 2
Ricardo in Confidence Ref: Ricardo/ED10000/Issue Number 1
Ricardo Energy & Environment
• Section 4 presents considerations around options for scheme boundaries and vehicles covered.
• Section 5 sets out the emissions and air quality analysis.
• Section 6 presents the economic analysis considering the impacts of the proposals.
• Section 7 describes the considerations in relation to implementing and enforcing the ZEZ.
• Finally, recommendations for taking the ZEZ forward are provided in section 8.
Oxford Zero Emission Zone Feasibility and Implementation Study | 3
Ricardo in Confidence Ref: Ricardo/ED10000/Issue Number 1
Ricardo Energy & Environment
2 Stakeholder engagement
Two main stakeholder engagement activities were carried out during the project: an early internal stakeholder workshop and an external engagement workshop which came later in the project. In addition, a project steering group consisting of key officers from the City and County Councils convened on a regular basis throughout the project to guide its development and several unilateral meetings with the bus companies were held to facilitate more in-depth discussion and canvassing of their views. Below is a summary of the two workshops.
2.1 Internal stakeholder workshop
This initial workshop was held early in the project and its key objectives were to:
• Present the objectives of the study and the work to a wide range of relevant internal stakeholders
• Generate early views on potential scheme options from internal stakeholders.
The participants that attended the workshop are listed below in Table 1. Attendees included Councillors, environment officers, transport planners, development planners and fleet managers.
There was a wide-ranging discussion in relation to the overall ZEZ concept and specific scheme options. In terms of the overall scheme concept, the main points that arose were:
• The key aims of the scheme should be to tackle both air quality and climate change issues, but also contribute to the quality of place and the improvement of public health
• The focus of the scheme should be the city centre with the geographic scope expanding over time
• Although there was a desire to drive forward an innovative scheme, the ZEZ would need to balance environmental benefit, innovation, practicality and impacts on business. It should not be a ‘ZEZ at any cost’
• A ZEZ must be seen as part of the wider transport strategy in the city in relation to promoting walking and cycling, and use of public transport.
The discussion of scheme options generated a lot of ideas for the scheme itself and related measures. The key points that were taken away from the discussion were:
• A ZEZ of any form in 2020 will be very challenging in terms of timescale to implement and for fleets to update and adjust
• The focus in 2020 should primarily be on incentives to encourage the uptake of ZEVs, with small ZEZ if practical
• There was strong support for considering other emission based restrictions in the centre of Oxford to complement the ZEZ as it developed
• By 2025 it was felt that a ZEZ would be more practical but still not easy, so there should be a focus on key routes or services such as the Park and Ride, as a stepping stone to a more comprehensive ZEZ
• Complementary measures in 2025 such as adjustments to bus routes or termini and a freight consolidation centre would help the implementation of the scheme
• A much more comprehensive scheme should be possible by 2030/2035 and could cover most vehicles across the city centre.
The phased approach and complementary emission standards suggested in this workshop provided the basis for the overall development of options as described in Section 4.

Oxford Zero Emission Zone Feasibility and Implementation Study | 4
Ricardo in Confidence Ref: Ricardo/ED10000/Issue Number 1
Ricardo Energy & Environment
Table 1 Internal stakeholder workshop participants
Participant Role
Oxford City Council
Cllr John Tanner
Jo Colwell
Mai Jarvis
David Stevens
Elizabeth Bohun
Jill Cramer
Owain Pearce
Pedro Abreu
Rachel Williams
Sarah Harrison
Tom Morris
Robert Fowler
Juliet Evans
Portfolio Holder Clean and Green Oxford
Environmental Sustainability Manager
Environmental Quality Team Manager
Principal Environmental Health Officer
Environmental Sustainability Projects Officer
Licensing Officer
Fleet Technical Officer
Air Quality Officer
Planning Policy Team Leader
Principal Planner -Local Plan
Principal Planner
Senior Planner
Planner Apprentice Technician
Oxfordshire County Council
Cllr David Nimmo Smith
Amanda Jacobs
Claire Chappell
David Tole
James Golding-Graham
Martin Kraftl
Owen South
Paul Fermer
Rebecca Crowe
Cabinet Member for Environment
Senior Planning Officer
Assistant Transport Planner
Traffic Safety Area Steward Manager
Transport Strategy Officer
Principal Infrastructure Planner
Senior Transport Planner
Service Manager Major Infrastructure Delivery
Assistant Transport Planner
2.2 External stakeholder workshop
A second workshop was held with a mixture of internal and external stakeholders later in the study. This was timed to be held when more detailed consideration of the scheme options had been carried out. This consideration was presented and discussed with the group for their views.
The participants in this workshop are listed in Table 2 and include the bus companies, the Freight Transport Association, the Universities, taxi trade association and local interest groups, as well as representatives from the City and County Councils.
Oxford Zero Emission Zone Feasibility and Implementation Study | 5
Ricardo in Confidence Ref: Ricardo/ED10000/Issue Number 1
Ricardo Energy & Environment
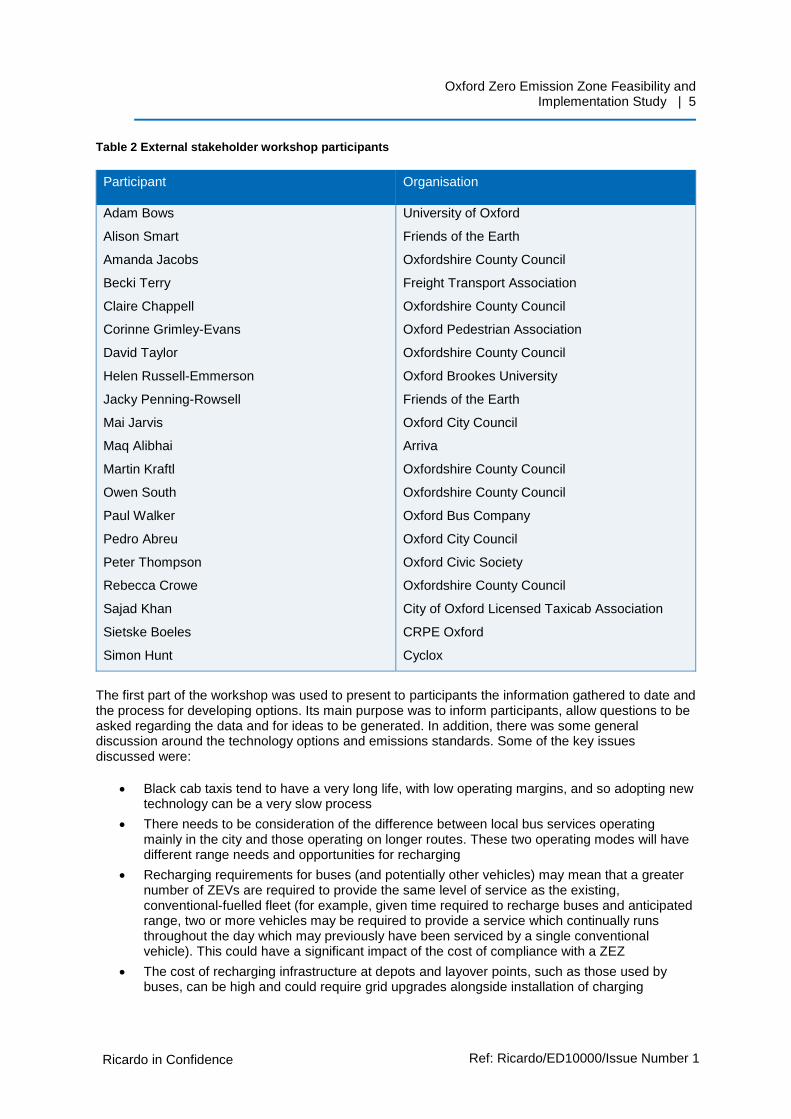
Table 2 External stakeholder workshop participants
Participant Organisation
Adam Bows
Alison Smart
Amanda Jacobs
Becki Terry
Claire Chappell
Corinne Grimley-Evans
David Taylor
Helen Russell-Emmerson
Jacky Penning-Rowsell
Mai Jarvis
Maq Alibhai
Martin Kraftl
Owen South
Paul Walker
Pedro Abreu
Peter Thompson
Rebecca Crowe
Sajad Khan
Sietske Boeles
Simon Hunt
University of Oxford
Friends of the Earth
Oxfordshire County Council
Freight Transport Association
Oxfordshire County Council
Oxford Pedestrian Association
Oxfordshire County Council
Oxford Brookes University
Friends of the Earth
Oxford City Council
Arriva
Oxfordshire County Council
Oxfordshire County Council
Oxford Bus Company
Oxford City Council
Oxford Civic Society
Oxfordshire County Council
City of Oxford Licensed Taxicab Association
CRPE Oxford
Cyclox
The first part of the workshop was used to present to participants the information gathered to date and the process for developing options. Its main purpose was to inform participants, allow questions to be asked regarding the data and for ideas to be generated. In addition, there was some general discussion around the technology options and emissions standards. Some of the key issues discussed were:
• Black cab taxis tend to have a very long life, with low operating margins, and so adopting new technology can be a very slow process
• There needs to be consideration of the difference between local bus services operating mainly in the city and those operating on longer routes. These two operating modes will have different range needs and opportunities for recharging
• Recharging requirements for buses (and potentially other vehicles) may mean that a greater number of ZEVs are required to provide the same level of service as the existing, conventional-fuelled fleet (for example, given time required to recharge buses and anticipated range, two or more vehicles may be required to provide a service which continually runs throughout the day which may previously have been serviced by a single conventional vehicle). This could have a significant impact of the cost of compliance with a ZEZ
• The cost of recharging infrastructure at depots and layover points, such as those used by buses, can be high and could require grid upgrades alongside installation of charging

Oxford Zero Emission Zone Feasibility and Implementation Study | 6
Ricardo in Confidence Ref: Ricardo/ED10000/Issue Number 1
Ricardo Energy & Environment
technology. There are outstanding questions as to where the burden of any associated cost will fall
• A question was also raised regarding whether there will be sufficient electricity generation capacity to handle increases in demand for electricity. However, this issue is beyond the scope of this study.
Following this initial discussion, the long list options (as described in Section 4) were presented. Feedback was sought on the options, including a discussion of any proposed changes, and whether there were one or more preferred options to take forward for more detailed consideration. Each option was discussed by a group of participants within the framework of a simple multi criteria assessment. Some of the key messages taken away from this exercise were:
• There were concerns that it would be difficult to implement a ZEZ by 2020 and that a small scheme may have little benefit and be purely tokenistic
• There is a potential tension between promoting better Euro standards and a direct move to ZEVs
• There is potential for the ZEZ to operate only at certain times of the day (e.g. from 7am to 7pm) to provide some flexibility
• There is a need to balance generating maximum environmental benefit against developing a scheme too quickly such that it becomes a very serious burden to business to comply
• Any scheme needs to be clear and easy to understand for users
• Support and incentives for residents and business to comply with the scheme should be provided.
The outcome of the workshop supported the overall multi-criteria assessment and selection of the final short listed options, along with some adjustment to these options as described in section 4.4.

Oxford Zero Emission Zone Feasibility and Implementation Study | 7
Ricardo in Confidence Ref: Ricardo/ED10000/Issue Number 1
Ricardo Energy & Environment
3 Understanding the vehicle fleet and technology
The feasibility of a ZEZ (and connected to this, the speed and cost of upgrading vehicles to zero-emission technologies) will depend on three factors:
1. The availability of zero-emission alternatives
2. The characteristics of the existing fleet and vehicle turnover
3. The availability of zero-emission supporting infrastructure.
Each is considered in turn in this section.
3.1 Zero emission vehicle technology
3.1.1 Overview of vehicle technology
A key question when considering a ZEZ is the definition of zero emission vehicles (ZEVs) which are considered compliant with such a zone. The simple definition adopted in this study is that a ZEV is any vehicle that produces no emissions at point of use when operating in the ZEZ.
The core group of ZEVs are electric vehicles or what is often described as plug-in vehicles: these technologies are illustrated in Figure 1 in comparison to conventional vehicles. This group of vehicles includes:
• Battery electric vehicles (BEV) – pure electric vehicles storing energy in a main traction battery
• Plug-in hybrid electric vehicles (PHEV) – hybrid vehicles with both an electric and combustion engine, but which have a larger battery capacity than a conventional hybrid and can be charged directly
• Extended-range electric vehicle (E-REV) – like BEVs but with an on-board generator that can provide electric power once the battery is depleted to extend the range of the vehicle.
The PHEV and E-REVs are often described as ‘zero emission capable’ as they can run for significant distances on electric only mode. Most importantly this technology should allow a vehicle to operate with zero emissions in a ZEZ. In most cases the combustion engine will use petrol but could consume diesel or gas.
Although this may be the main group of zero emission technologies available, there are others that could be considered feasible options over the timeframe of this study (out to 2035). The main alternative options are:
• Hydrogen fuel cell electric vehicles (FCEV) – like PHEVs or E-REVs, but have a hydrogen fuel cell providing power rather than a combustion engine. In this respect, they will be zero emission during all operations. Hybrid system architecture is used for efficiency gains such as regenerative braking, since power can be put back into batteries but not the fuel cell
• Trolley electric vehicles – vehicles that do not store energy on-board but draw power from overhead cables continuously. These vehicles would mainly be trolley buses or trams. They are used for mass transit on high volume corridors and require integration of the overhead cables (on in some cases guideways) in the urban landscape.

Oxford Zero Emission Zone Feasibility and Implementation Study | 8
Ricardo in Confidence Ref: Ricardo/ED10000/Issue Number 1
Ricardo Energy & Environment
Figure 1 Plug-in vehicle technologies
Source: Office of Low Emission Vehicles
Figure 2 Urban cargo bikes in Sweden
Source: Velove Bikes AB (www.velove.se)
Technologies that would not be considered zero emission are natural gas or biomethane vehicles, and hydrogen combustion vehicles4. They are generally low emission technologies but will still produce emission at point of use and hence are unsuitable for a ZEZ. These technologies could be
4 These are vehicles that burn hydrogen in a combustion engine. These can be either spark ignition or dual-fuel compression ignition. Any combustion process will produce NOx emissions.
Oxford Zero Emission Zone Feasibility and Implementation Study | 9
Ricardo in Confidence Ref: Ricardo/ED10000/Issue Number 1
Ricardo Energy & Environment
suitable if they were combined with PHEV or E-REV drive train architecture and so were zero emission capable (as described under the FCEV technology above).
Another ‘technology’ that should not be forgotten is the shift of trips to active travel modes, such as cycling and walking. This is mainly an element that would be seen as part of the wider transport strategy within the city but is also a potential response to the ZEZ. In addition, electric bikes or pedelecs (electric bicycles) are a feasible option that increase the potential for shifting to cycling, especially for urban cargo deliveries (as illustrated by the four-wheeled, electric and pedal powered vehicle being used in Sweden, see Figure 2).
3.1.2 Technology availability
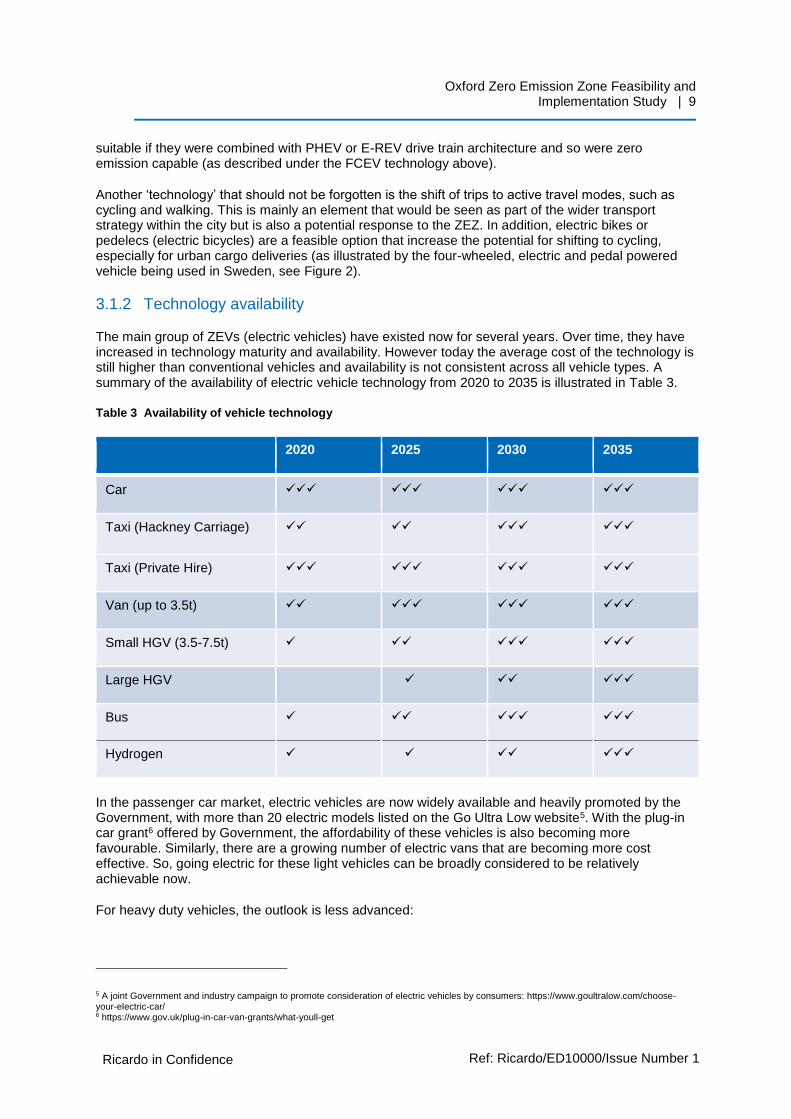
The main group of ZEVs (electric vehicles) have existed now for several years. Over time, they have increased in technology maturity and availability. However today the average cost of the technology is still higher than conventional vehicles and availability is not consistent across all vehicle types. A summary of the availability of electric vehicle technology from 2020 to 2035 is illustrated in Table 3.
Table 3 Availability of vehicle technology
2020 2025 2030 2035
Car ✓✓✓ ✓✓✓ ✓✓✓ ✓✓✓
Taxi (Hackney Carriage) ✓✓
✓✓
✓✓✓
✓✓✓
Taxi (Private Hire) ✓✓✓ ✓✓✓ ✓✓✓ ✓✓✓
Van (up to 3.5t) ✓✓ ✓✓✓ ✓✓✓ ✓✓✓
Small HGV (3.5-7.5t) ✓ ✓✓ ✓✓✓ ✓✓✓
Large HGV
✓ ✓✓ ✓✓✓
Bus ✓ ✓✓ ✓✓✓ ✓✓✓
Hydrogen ✓ ✓ ✓✓ ✓✓✓
In the passenger car market, electric vehicles are now widely available and heavily promoted by the Government, with more than 20 electric models listed on the Go Ultra Low website5. With the plug-in car grant6 offered by Government, the affordability of these vehicles is also becoming more favourable. Similarly, there are a growing number of electric vans that are becoming more cost effective. So, going electric for these light vehicles can be broadly considered to be relatively achievable now.
For heavy duty vehicles, the outlook is less advanced:
5 A joint Government and industry campaign to promote consideration of electric vehicles by consumers: https://www.goultralow.com/choose-your-electric-car/ 6 https://www.gov.uk/plug-in-car-van-grants/what-youll-get

Oxford Zero Emission Zone Feasibility and Implementation Study | 10
Ricardo in Confidence Ref: Ricardo/ED10000/Issue Number 1
Ricardo Energy & Environment
• The bus market is beginning to grow with several manufactures offering electric options however these vehicles are relatively costly. That said, with the drive to improve urban air quality around the world this market is expected to develop quickly from 2020 onwards. There is also the option of trolley buses or trams for larger transport corridors, but these options require significant development time and infrastructure investment.
• In terms of goods vehicles, there are a limited number of battery electric options for small HGV’s but no real option for large HGV’s given the weight and range requirements. For larger HGV’s, hydrogen may be a more viable option in the longer term. Alternatively, some form of urban trans-shipment centre with final delivery by small HGV’s that can be electric or zero emission capable could also be considered.
With respect to ‘black cabs’ (which is a specialist taxi used in London, Oxford and elsewhere), electric versions are under development and are anticipated to start to become viable options over the next few years: for example, TfL have proposed that from the start of 2018, all black cabs licenced for the first time must be zero emissions capable7.
In summary, viable alternatives to conventional fuels exist for light duty cars and vans today. The cost and availability for buses and small HGV’s make these categories more challenging until at least 2025. For HGV’s, realistic zero emission options will not be available until 2030 or beyond.
3.2 Characteristics of the current fleet
In terms of the practicality of adopting electric vehicles within a given timeframe, it is not just the availability of the technology that needs to be considered but also the state of the current vehicle fleet, its age profile and its pattern of renewal. These factors will together influence the costs of upgrading vehicles to be compliant with a ZEZ, and hence the viability and acceptability of such a scheme.
The most appropriate opportunity to upgrade vehicles to zero emission alternatives will be when owners naturally start to look to replace or retire their existing vehicle. Where owners are forced to replace vehicles earlier than they otherwise would have done, this increases the costs of upgrading for vehicle owners8. Therefore, the typical lifetime of different vehicle types and the current age profile of the existing fleet in Oxford will determine when these upgrade opportunities will arise.
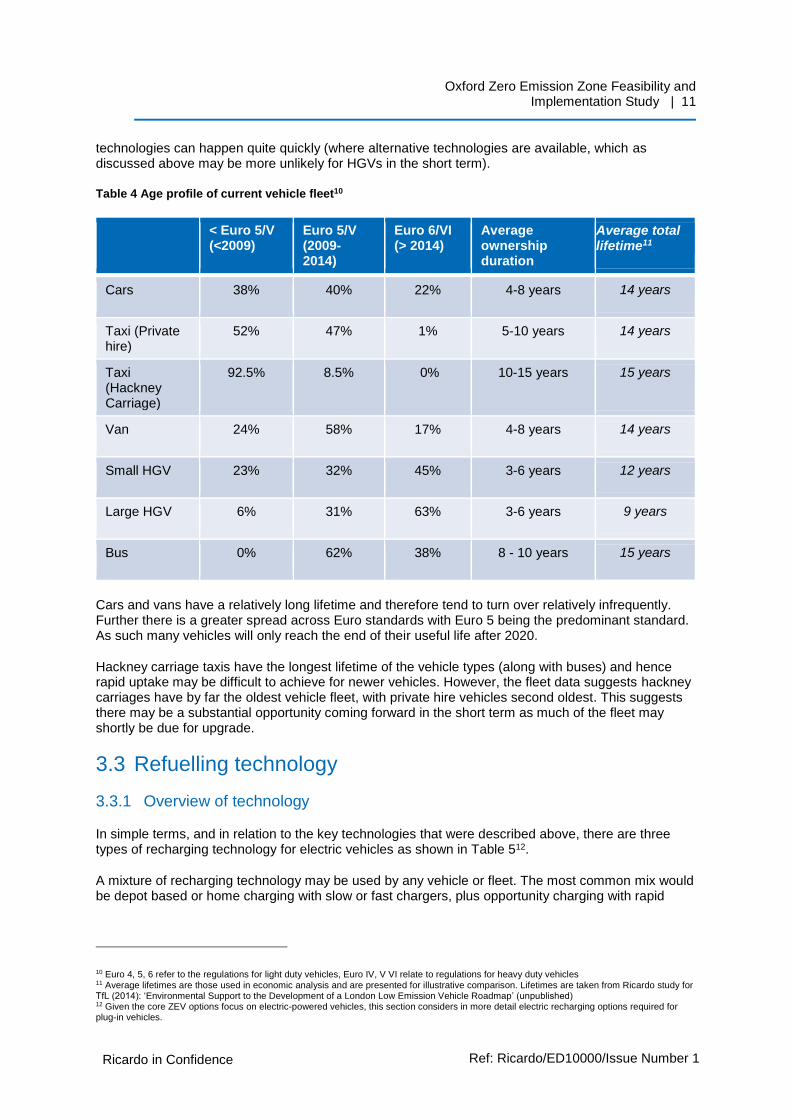
Table 4 illustrates the current age profile of the vehicle fleet in Oxford in relation to the current Euro emission standards that the vehicles meet and the likely average ownership lifetime of the vehicles. The information for cars, vans and HGV’s is based on the national average, the information for the taxi fleet is derived from a report on Oxford’s taxi fleet prepared by EST9 and the information on the bus fleet was provided by the main bus operators Oxford City Bus and Stagecoach.
The bus fleet is relatively modern: no vehicles are older than about 7 years and the whole fleet meets the Euro V standard or better. This has been driven by the current Euro V based LEZ for buses in the city, and has also encouraged a significant number of Euro V hybrids to be purchased. However, the relative youth of the fleet and the long-life time of buses does mean it will be challenging to update the fleets with either new Euro VI vehicles or electrics very quickly.
The HGV fleet typically turns over the most rapidly of all vehicle fleets. For example, over 60% of the large HGV fleet is already Euro VI. This suggests that renewing to new emission standards or
7 https://tfl.gov.uk/info-for/media/press-releases/2015/october/mayor-and-tfl-finalise-ulez-requirements-for-taxi-and-minicab-trades 8 This brings forward the cost of purchasing a new vehicle which otherwise would have been later, and the owner will not have got all the use out of the existing vehicle that they first might have expected. 9 ‘ULEV Taxi Scheme – feasibility study for Oxford City Council’, Energy Saving Trust, March 2016
Oxford Zero Emission Zone Feasibility and Implementation Study | 11
Ricardo in Confidence Ref: Ricardo/ED10000/Issue Number 1
Ricardo Energy & Environment
technologies can happen quite quickly (where alternative technologies are available, which as discussed above may be more unlikely for HGVs in the short term).
Table 4 Age profile of current vehicle fleet10
< Euro 5/V (<2009)
Euro 5/V (2009-2014)
Euro 6/VI (> 2014)
Average ownership duration
Average total lifetime11
Cars 38% 40% 22% 4-8 years 14 years
Taxi (Private hire)
52% 47% 1% 5-10 years 14 years
Taxi (Hackney Carriage)
92.5% 8.5% 0% 10-15 years 15 years
Van 24% 58% 17% 4-8 years 14 years
Small HGV 23% 32% 45% 3-6 years 12 years
Large HGV 6% 31% 63% 3-6 years 9 years
Bus 0% 62% 38% 8 - 10 years 15 years
Cars and vans have a relatively long lifetime and therefore tend to turn over relatively infrequently. Further there is a greater spread across Euro standards with Euro 5 being the predominant standard. As such many vehicles will only reach the end of their useful life after 2020.
Hackney carriage taxis have the longest lifetime of the vehicle types (along with buses) and hence rapid uptake may be difficult to achieve for newer vehicles. However, the fleet data suggests hackney carriages have by far the oldest vehicle fleet, with private hire vehicles second oldest. This suggests there may be a substantial opportunity coming forward in the short term as much of the fleet may shortly be due for upgrade.
3.3 Refuelling technology
3.3.1 Overview of technology
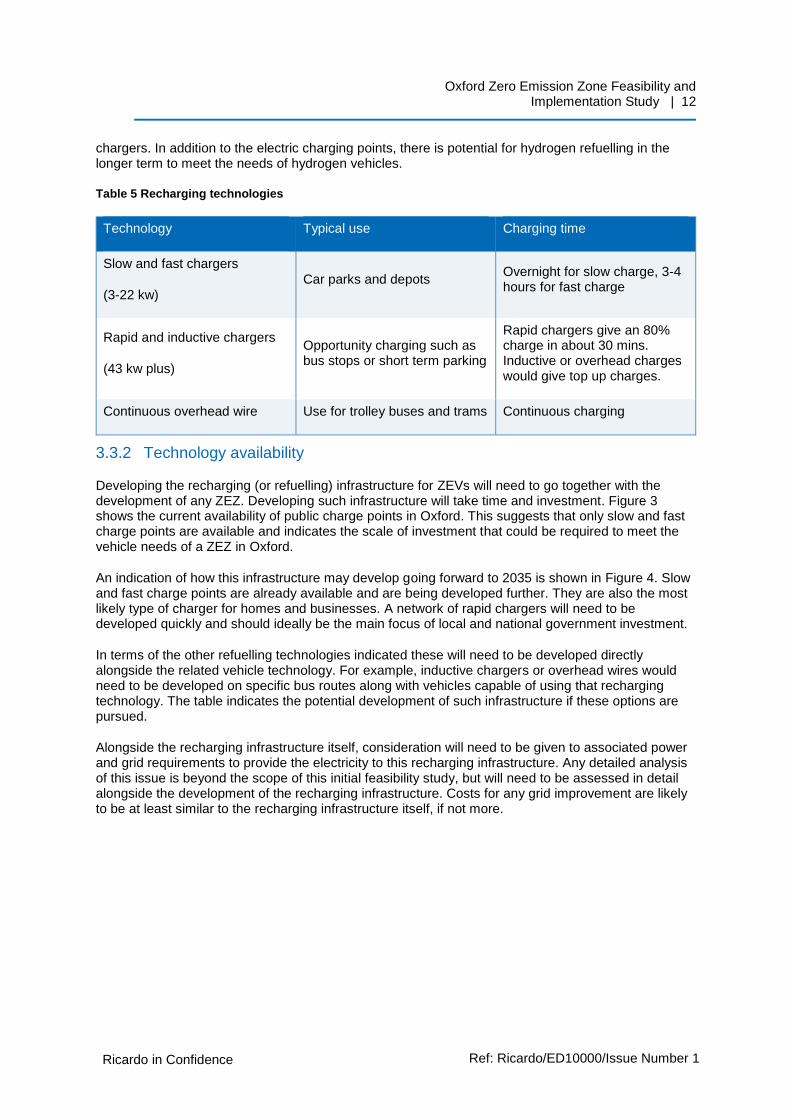
In simple terms, and in relation to the key technologies that were described above, there are three types of recharging technology for electric vehicles as shown in Table 512.
A mixture of recharging technology may be used by any vehicle or fleet. The most common mix would be depot based or home charging with slow or fast chargers, plus opportunity charging with rapid
10 Euro 4, 5, 6 refer to the regulations for light duty vehicles, Euro IV, V VI relate to regulations for heavy duty vehicles 11 Average lifetimes are those used in economic analysis and are presented for illustrative comparison. Lifetimes are taken from Ricardo study for TfL (2014): ‘Environmental Support to the Development of a London Low Emission Vehicle Roadmap’ (unpublished) 12 Given the core ZEV options focus on electric-powered vehicles, this section considers in more detail electric recharging options required for plug-in vehicles.
Oxford Zero Emission Zone Feasibility and Implementation Study | 12
Ricardo in Confidence Ref: Ricardo/ED10000/Issue Number 1
Ricardo Energy & Environment
chargers. In addition to the electric charging points, there is potential for hydrogen refuelling in the longer term to meet the needs of hydrogen vehicles.
Table 5 Recharging technologies
Technology Typical use Charging time
Slow and fast chargers
(3-22 kw)
Car parks and depots Overnight for slow charge, 3-4 hours for fast charge
Rapid and inductive chargers
(43 kw plus)
Opportunity charging such as bus stops or short term parking
Rapid chargers give an 80% charge in about 30 mins. Inductive or overhead charges would give top up charges.
Continuous overhead wire Use for trolley buses and trams Continuous charging
3.3.2 Technology availability
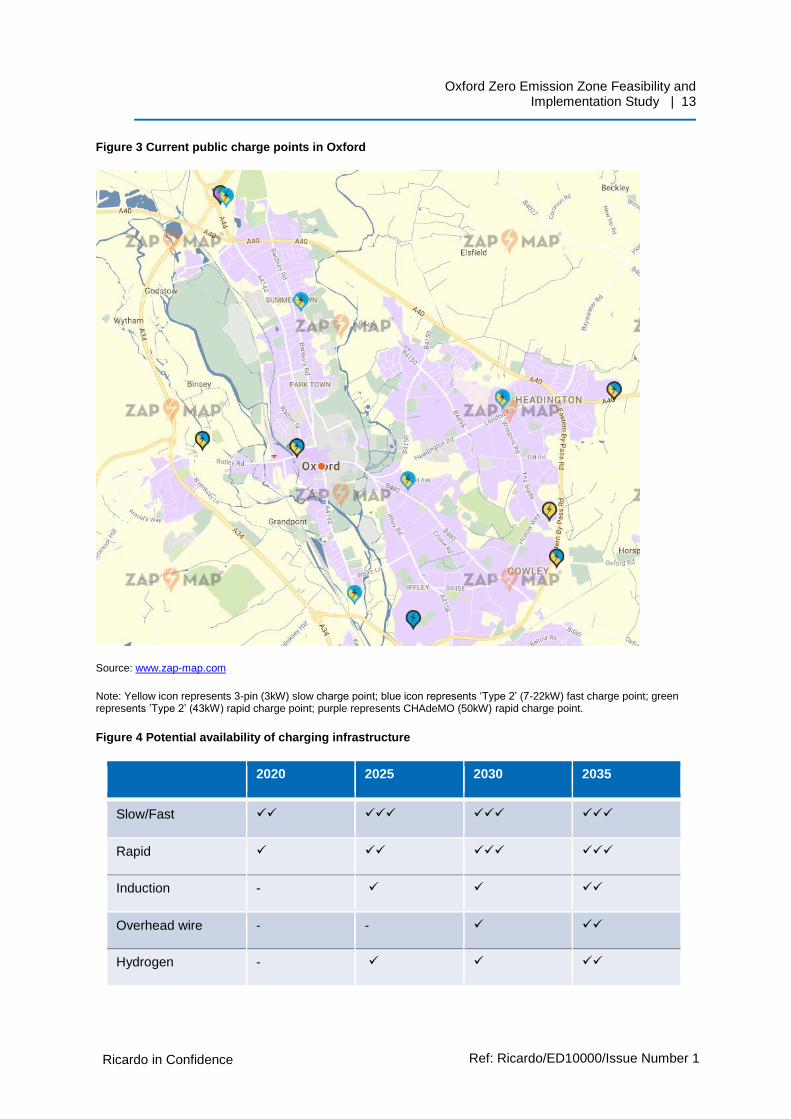
Developing the recharging (or refuelling) infrastructure for ZEVs will need to go together with the development of any ZEZ. Developing such infrastructure will take time and investment. Figure 3 shows the current availability of public charge points in Oxford. This suggests that only slow and fast charge points are available and indicates the scale of investment that could be required to meet the vehicle needs of a ZEZ in Oxford.
An indication of how this infrastructure may develop going forward to 2035 is shown in Figure 4. Slow and fast charge points are already available and are being developed further. They are also the most likely type of charger for homes and businesses. A network of rapid chargers will need to be developed quickly and should ideally be the main focus of local and national government investment.
In terms of the other refuelling technologies indicated these will need to be developed directly alongside the related vehicle technology. For example, inductive chargers or overhead wires would need to be developed on specific bus routes along with vehicles capable of using that recharging technology. The table indicates the potential development of such infrastructure if these options are pursued.
Alongside the recharging infrastructure itself, consideration will need to be given to associated power and grid requirements to provide the electricity to this recharging infrastructure. Any detailed analysis of this issue is beyond the scope of this initial feasibility study, but will need to be assessed in detail alongside the development of the recharging infrastructure. Costs for any grid improvement are likely to be at least similar to the recharging infrastructure itself, if not more.
Oxford Zero Emission Zone Feasibility and Implementation Study | 13
Ricardo in Confidence Ref: Ricardo/ED10000/Issue Number 1
Ricardo Energy & Environment
Figure 3 Current public charge points in Oxford
Source: www.zap-map.com
Note: Yellow icon represents 3-pin (3kW) slow charge point; blue icon represents ‘Type 2’ (7-22kW) fast charge point; green represents ’Type 2’ (43kW) rapid charge point; purple represents CHAdeMO (50kW) rapid charge point.
Figure 4 Potential availability of charging infrastructure
2020 2025 2030 2035
Slow/Fast ✓✓ ✓✓✓ ✓✓✓ ✓✓✓
Rapid ✓ ✓✓ ✓✓✓ ✓✓✓
Induction - ✓ ✓ ✓✓
Overhead wire - - ✓ ✓✓
Hydrogen - ✓ ✓ ✓✓
Oxford Zero Emission Zone Feasibility and Implementation Study | 14
Ricardo in Confidence Ref: Ricardo/ED10000/Issue Number 1
Ricardo Energy & Environment
3.4 Implications for the ZEZ
Given this understanding of the vehicle and recharging technology, and the potential development over the timeframe from 2020 to 2035, the implications for developing a ZEZ can be summarised as follows:
• The potential for adopting ZEVs by 2020 is very limited, with only cars, vans and potentially black cabs (recognising the ambitions of the London ULEZ) having practically available options and allowing for vehicles to be replaced. This means that any ZEZ in 2020 would have to be of limited scope.
• By 2025 there should be wider scope for more vehicles to become zero emission including some buses and potentially small HGV’s. This would allow for the expansion of any ZEZ.
• By 2030 and 2035 the availability of vehicles and the potential to develop infrastructure is much greater and so a much more comprehensive ZEZ could be developed.
The limited scope for the ZEZ in 2020 also supports the idea raised through the early stakeholder engagement to complement the ZEZ with wider initiatives to control emissions. The main option proposed is to consider a Clean Air Zone (CAZ) to reduce emissions from vehicles that do not have viable zero emission alternatives, at least initially, alongside a ZEZ. This could potentially help to maximise the air quality benefit of any scheme developed.
Oxford Zero Emission Zone Feasibility and Implementation Study | 15
Ricardo in Confidence Ref: Ricardo/ED10000/Issue Number 1
Ricardo Energy & Environment
4 Developing scheme options
4.1 Objectives and scope of a ZEZ
The overall objective of a ZEZ would be to improve air quality in the city by reducing emissions from vehicles. The target of the zone is the city centre with an initial scheme in 2020 which would expand in scope and become more comprehensive by 2035. So, a long-term vision for 2035 could be set as:
“Oxford is a vibrant and pollution free world-renowned heritage city, seen as an exemplar for Zero Emission Vehicle policies, with a Zero Emission Zone in the city centre and wide spread use of Zero Emission Vehicles across the city."
The ZEZ would be at the core of this vision but supported by a range of other measures to promote the uptake of low and zero emission vehicles.
In defining options for the ZEZ the study has built on discussions with key stakeholders (as set out in section 2 above) and the practical considerations in relation to zero emission technology (described in section 3). The options have been defined in terms of:
• The boundary of the scheme
• The vehicle classes affected by the scheme
• How the scheme could progress from 2020 to 2035.
In the following section, we first discuss the options for scheme boundaries and then how these combine with specific vehicle classes to provide a range of overall scheme options. These are then reviewed and four scheme options are taken forward for emissions, air quality and cost benefit assessments.
4.2 Scheme boundaries
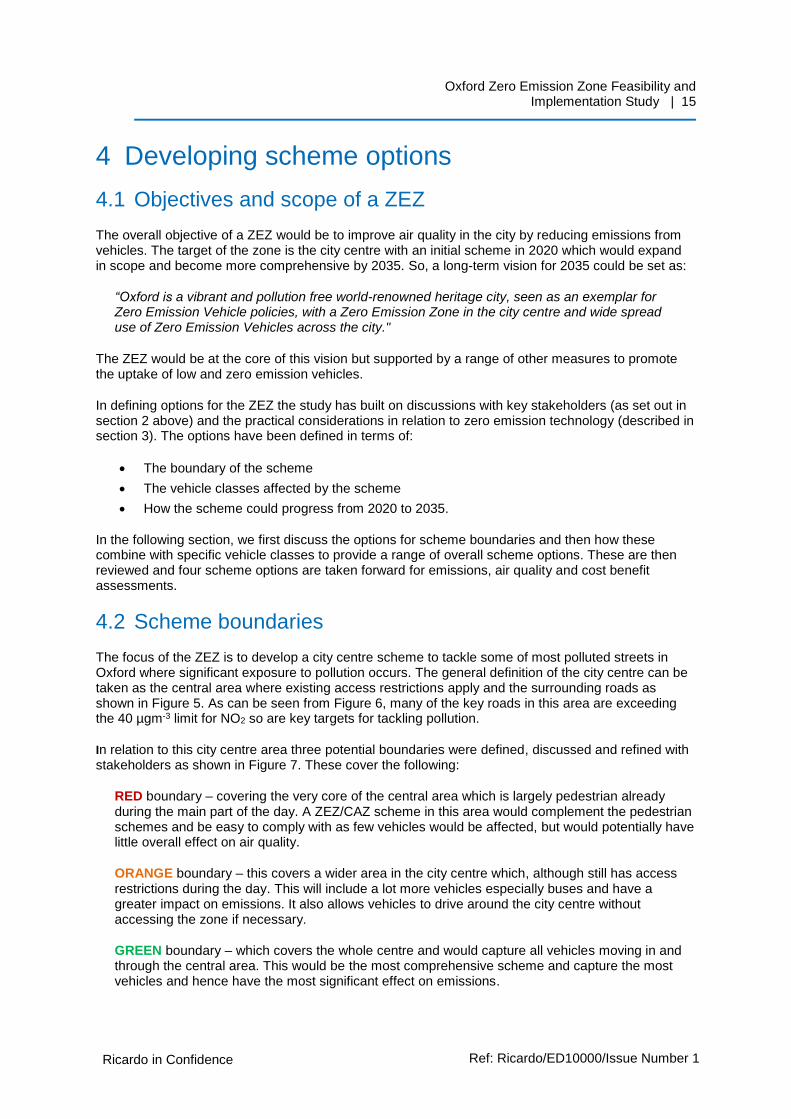
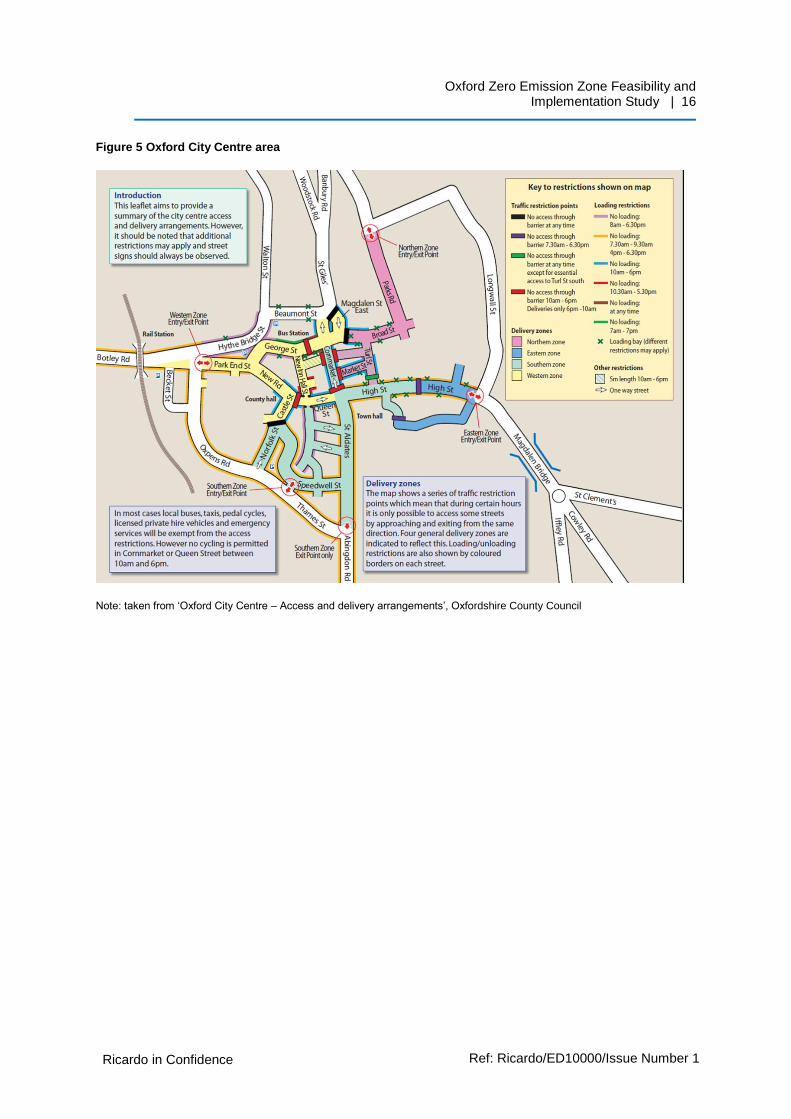
The focus of the ZEZ is to develop a city centre scheme to tackle some of most polluted streets in Oxford where significant exposure to pollution occurs. The general definition of the city centre can be taken as the central area where existing access restrictions apply and the surrounding roads as shown in Figure 5. As can be seen from Figure 6, many of the key roads in this area are exceeding the 40 µgm-3 limit for NO2 so are key targets for tackling pollution.
In relation to this city centre area three potential boundaries were defined, discussed and refined with stakeholders as shown in Figure 7. These cover the following:
RED boundary – covering the very core of the central area which is largely pedestrian already during the main part of the day. A ZEZ/CAZ scheme in this area would complement the pedestrian schemes and be easy to comply with as few vehicles would be affected, but would potentially have little overall effect on air quality.
ORANGE boundary – this covers a wider area in the city centre which, although still has access restrictions during the day. This will include a lot more vehicles especially buses and have a greater impact on emissions. It also allows vehicles to drive around the city centre without accessing the zone if necessary.
GREEN boundary – which covers the whole centre and would capture all vehicles moving in and through the central area. This would be the most comprehensive scheme and capture the most vehicles and hence have the most significant effect on emissions.
Oxford Zero Emission Zone Feasibility and Implementation Study | 16
Ricardo in Confidence Ref: Ricardo/ED10000/Issue Number 1
Ricardo Energy & Environment
Figure 5 Oxford City Centre area
Note: taken from ‘Oxford City Centre – Access and delivery arrangements’, Oxfordshire County Council
Oxford Zero Emission Zone Feasibility and Implementation Study | 17
Ricardo in Confidence Ref: Ricardo/ED10000/Issue Number 1
Ricardo Energy & Environment
Figure 6 Monitored and modelled NO2 for 2015

Oxford Zero Emission Zone Feasibility and Implementation Study | 18
Ricardo in Confidence Ref: Ricardo/ED10000/Issue Number 1
Ricardo Energy & Environment
Figure 7 Centre scheme boundary options

Oxford Zero Emission Zone Feasibility and Implementation Study | 19
Ricardo in Confidence Ref: Ricardo/ED10000/Issue Number 1
Ricardo Energy & Environment
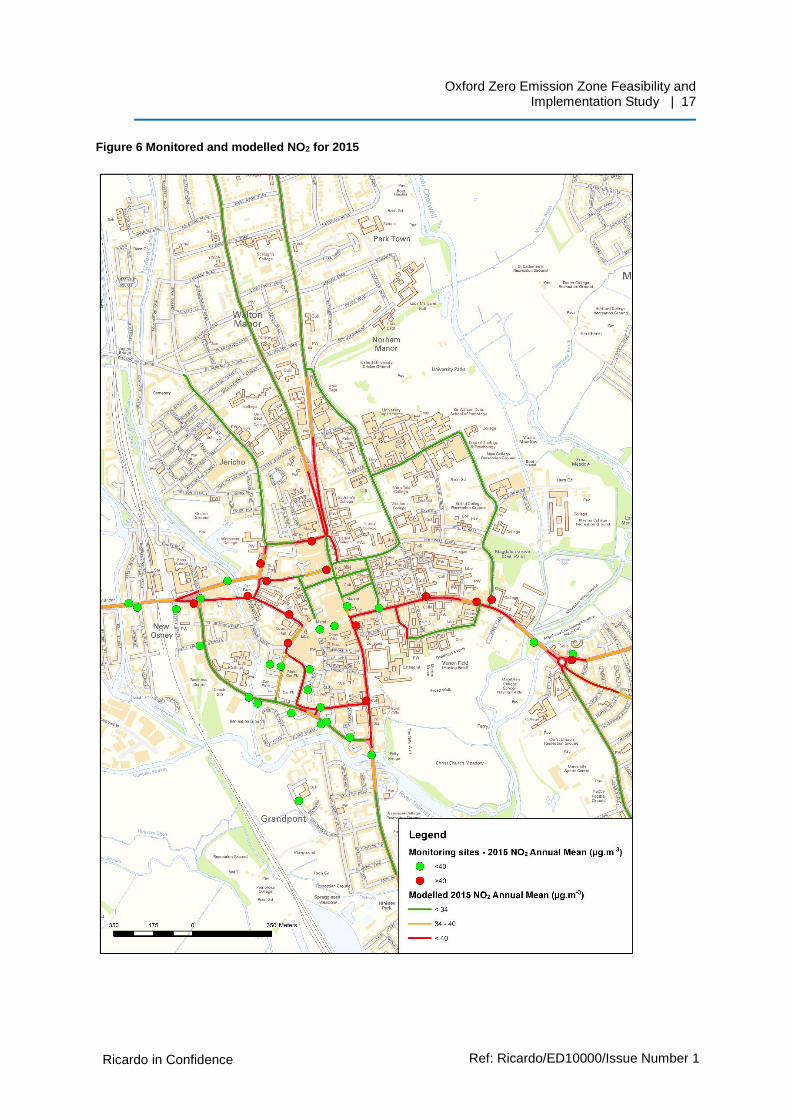
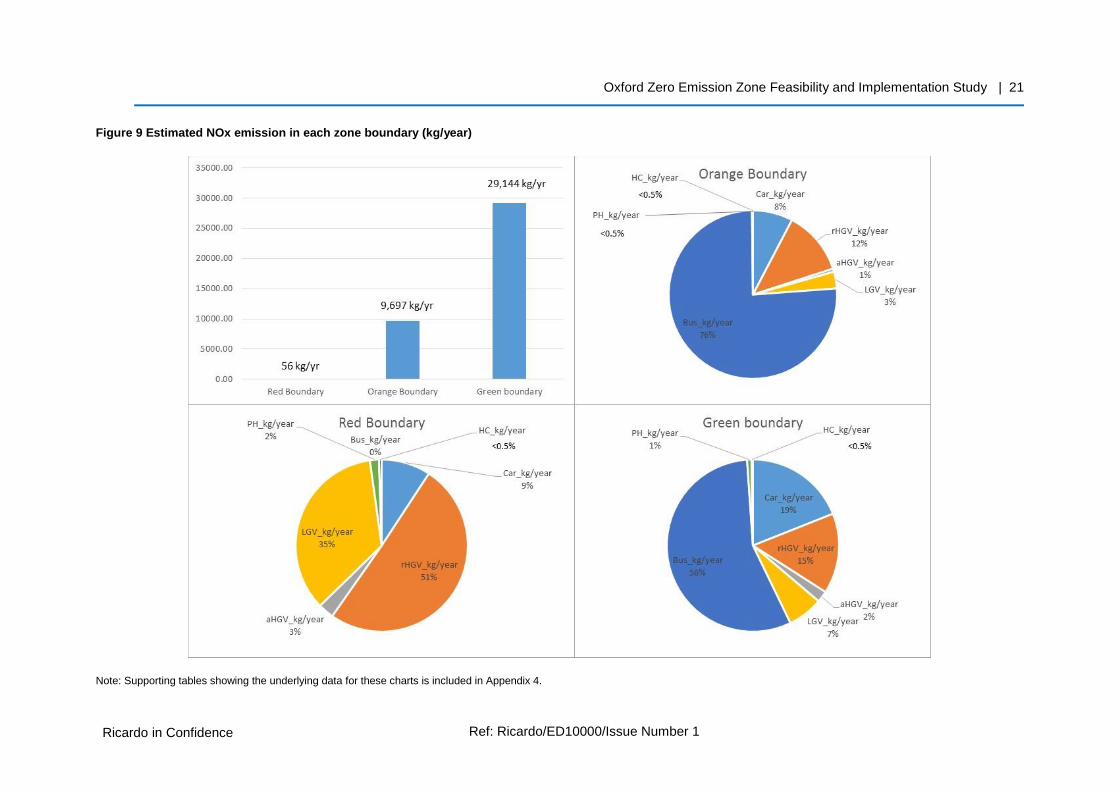
To understand the potential impact of the scheme for each boundary, an estimate of the vehicle activity (in vkm/day) and related emissions of NOx (in kg/year) are shown in Figure 8 and Figure 9 for each boundary (detailed supporting tables presenting the underlying data for these charts is included in Appendix 4). These figures show quite clearly the following:
RED boundary – there is very little traffic in this area, due to the existing access restrictions. Traffic is mainly likely to comprise a small number of delivery vehicles servicing the shops. There are also very few emissions associated with these vehicles.
ORANGE boundary – the amount of traffic and emissions significantly increase moving out to this boundary. Also, although buses only account for 33% of vehicle movements they account for 76% of NOx emissions (as they are large slow moving vehicles). HGV’s are the other main source of emissions in this area. Cars account for over half the traffic but a much smaller proportion of the emissions.
GREEN boundary – the amount of emissions double again moving from the orange to green boundary. Buses are still the dominant emission source accounting for over 50% of emissions. Cars are now the next largest source accounting for around 70% of traffic and 20% of emissions, and then HGVs. It should also be noted that nearly all HGV’s are the smaller rigid HGV’s used for urban deliveries.
The implied average emission by vehicle type in g/km are also shown in Figure 10 to illustrate the difference between vehicle types on a per vehicle basis.

Oxford Zero Emission Zone Feasibility and Implementation Study | 20
Ricardo in Confidence Ref: Ricardo/ED10000/Issue Number 1
Ricardo Energy & Environment
Figure 8 Estimated traffic levels in each zone boundary (vkm/day)
Note: Supporting tables showing the underlying data for these charts is included in Appendix 4.
Oxford Zero Emission Zone Feasibility and Implementation Study | 21
Ricardo in Confidence Ref: Ricardo/ED10000/Issue Number 1
Ricardo Energy & Environment
Figure 9 Estimated NOx emission in each zone boundary (kg/year)
Note: Supporting tables showing the underlying data for these charts is included in Appendix 4.
Oxford Zero Emission Zone Feasibility and Implementation Study | 22
Ricardo in Confidence Ref: Ricardo/ED10000/Issue Number 1
Ricardo Energy & Environment
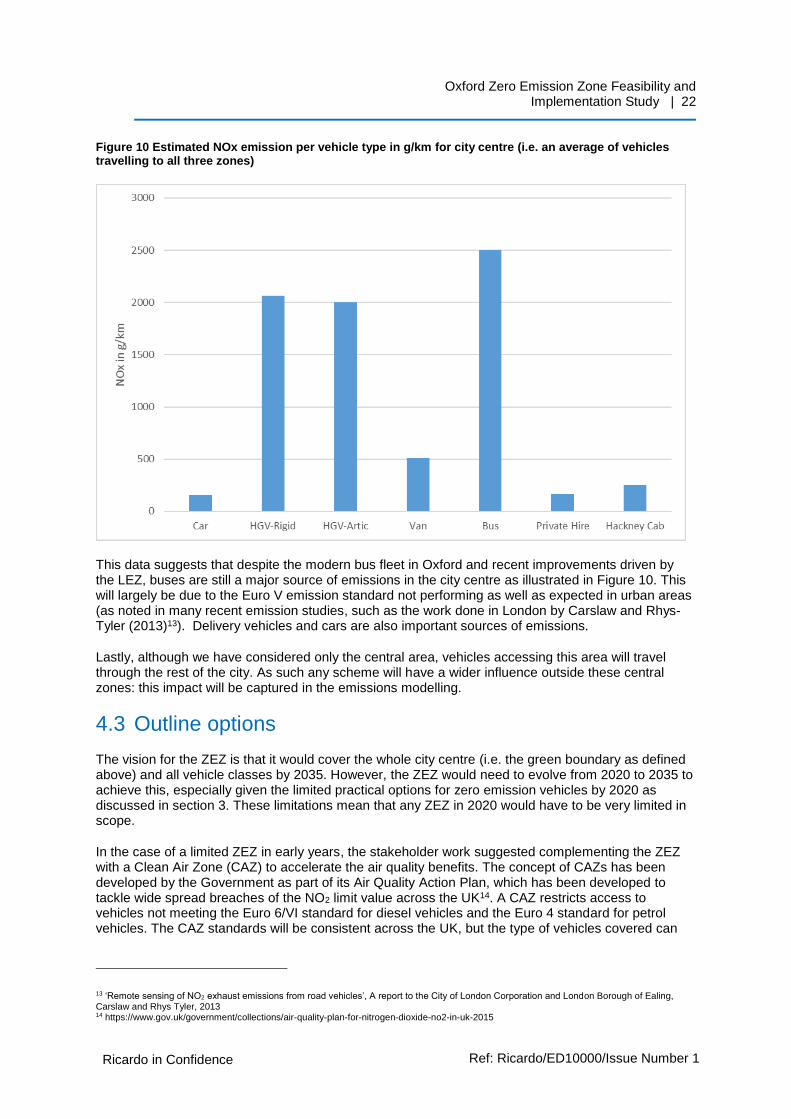
Figure 10 Estimated NOx emission per vehicle type in g/km for city centre (i.e. an average of vehicles travelling to all three zones)
This data suggests that despite the modern bus fleet in Oxford and recent improvements driven by the LEZ, buses are still a major source of emissions in the city centre as illustrated in Figure 10. This will largely be due to the Euro V emission standard not performing as well as expected in urban areas (as noted in many recent emission studies, such as the work done in London by Carslaw and Rhys-Tyler (2013)13). Delivery vehicles and cars are also important sources of emissions.
Lastly, although we have considered only the central area, vehicles accessing this area will travel through the rest of the city. As such any scheme will have a wider influence outside these central zones: this impact will be captured in the emissions modelling.
4.3 Outline options
The vision for the ZEZ is that it would cover the whole city centre (i.e. the green boundary as defined above) and all vehicle classes by 2035. However, the ZEZ would need to evolve from 2020 to 2035 to achieve this, especially given the limited practical options for zero emission vehicles by 2020 as discussed in section 3. These limitations mean that any ZEZ in 2020 would have to be very limited in scope.
In the case of a limited ZEZ in early years, the stakeholder work suggested complementing the ZEZ with a Clean Air Zone (CAZ) to accelerate the air quality benefits. The concept of CAZs has been developed by the Government as part of its Air Quality Action Plan, which has been developed to tackle wide spread breaches of the NO2 limit value across the UK14. A CAZ restricts access to vehicles not meeting the Euro 6/VI standard for diesel vehicles and the Euro 4 standard for petrol vehicles. The CAZ standards will be consistent across the UK, but the type of vehicles covered can
13 ‘Remote sensing of NO2 exhaust emissions from road vehicles’, A report to the City of London Corporation and London Borough of Ealing, Carslaw and Rhys Tyler, 2013 14 https://www.gov.uk/government/collections/air-quality-plan-for-nitrogen-dioxide-no2-in-uk-2015
Oxford Zero Emission Zone Feasibility and Implementation Study | 23
Ricardo in Confidence Ref: Ricardo/ED10000/Issue Number 1
Ricardo Energy & Environment
vary depending on the local requirement and the Government has defined different ‘classes’ of CAZ depending on what vehicle types they cover.
However, in this context the introduction of a CAZ alongside a ZEZ may cause some conflict with the ultimate goal of a ZEZ: a CAZ will encourage people to renew their vehicles to low emission conventional technology and delay the adoption of zero emission technology. Hence early communication of a proposed scheme is imperative.
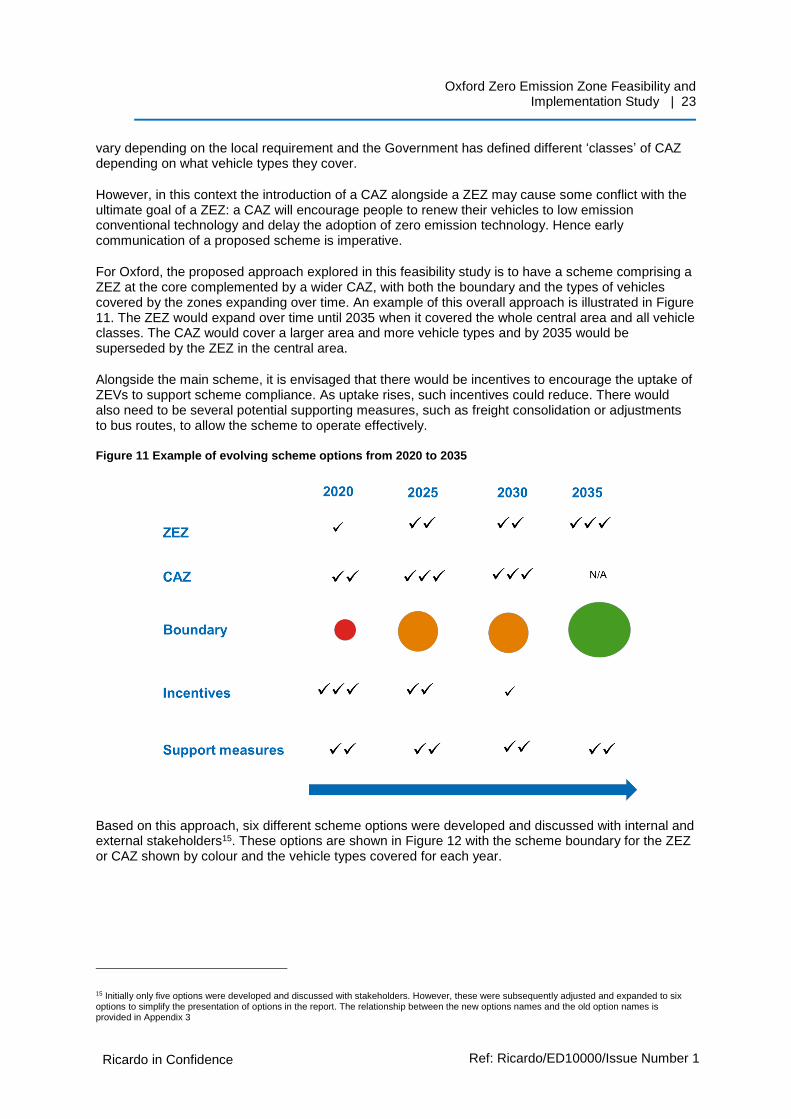
For Oxford, the proposed approach explored in this feasibility study is to have a scheme comprising a ZEZ at the core complemented by a wider CAZ, with both the boundary and the types of vehicles covered by the zones expanding over time. An example of this overall approach is illustrated in Figure 11. The ZEZ would expand over time until 2035 when it covered the whole central area and all vehicle classes. The CAZ would cover a larger area and more vehicle types and by 2035 would be superseded by the ZEZ in the central area.
Alongside the main scheme, it is envisaged that there would be incentives to encourage the uptake of ZEVs to support scheme compliance. As uptake rises, such incentives could reduce. There would also need to be several potential supporting measures, such as freight consolidation or adjustments to bus routes, to allow the scheme to operate effectively.
Figure 11 Example of evolving scheme options from 2020 to 2035
Based on this approach, six different scheme options were developed and discussed with internal and external stakeholders15. These options are shown in Figure 12 with the scheme boundary for the ZEZ or CAZ shown by colour and the vehicle types covered for each year.
15 Initially only five options were developed and discussed with stakeholders. However, these were subsequently adjusted and expanded to six options to simplify the presentation of options in the report. The relationship between the new options names and the old option names is provided in Appendix 3
Oxford Zero Emission Zone Feasibility and Implementation Study | 24
Ricardo in Confidence Ref: Ricardo/ED10000/Issue Number 1
Ricardo Energy & Environment
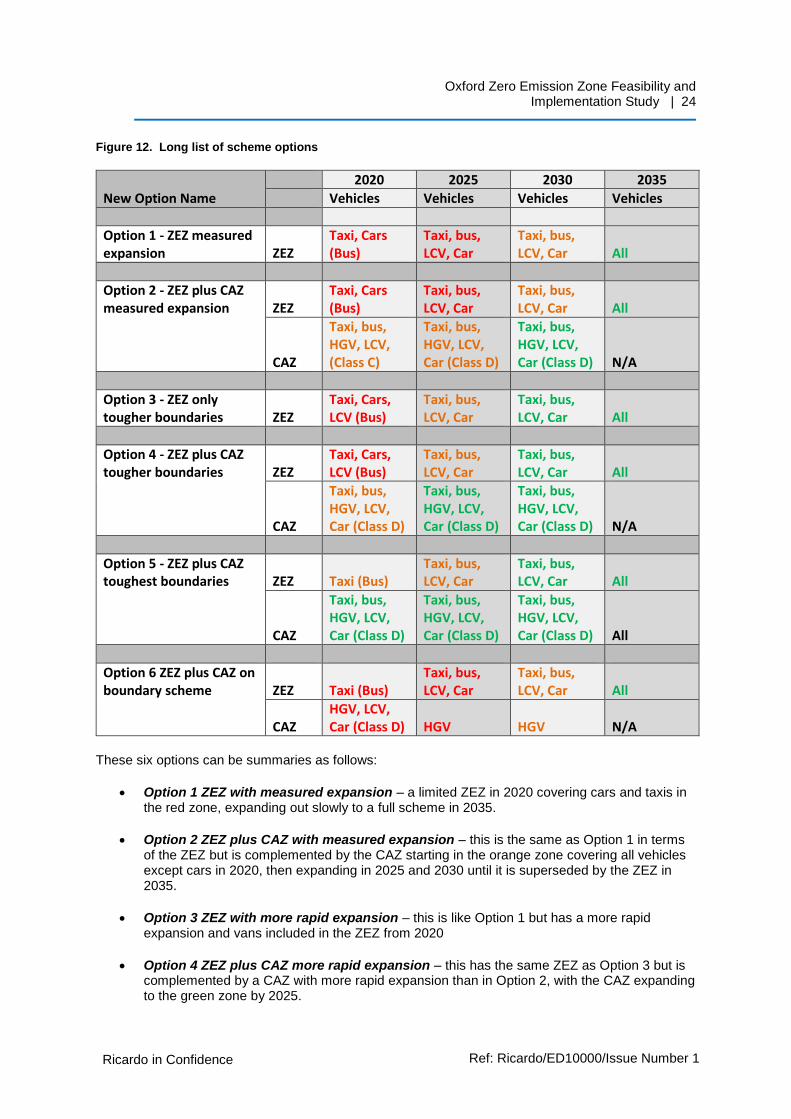
Figure 12. Long list of scheme options
New Option Name
2020 2025 2030 2035
Vehicles Vehicles Vehicles Vehicles
Option 1 - ZEZ measured expansion ZEZ
Taxi, Cars (Bus)
Taxi, bus, LCV, Car
Taxi, bus, LCV, Car All
Option 2 - ZEZ plus CAZ measured expansion ZEZ
Taxi, Cars (Bus)
Taxi, bus, LCV, Car
Taxi, bus, LCV, Car All
CAZ
Taxi, bus, HGV, LCV, (Class C)
Taxi, bus, HGV, LCV, Car (Class D)
Taxi, bus, HGV, LCV, Car (Class D) N/A
Option 3 - ZEZ only tougher boundaries ZEZ
Taxi, Cars, LCV (Bus)
Taxi, bus, LCV, Car
Taxi, bus, LCV, Car All
Option 4 - ZEZ plus CAZ tougher boundaries ZEZ
Taxi, Cars, LCV (Bus)
Taxi, bus, LCV, Car
Taxi, bus, LCV, Car All
CAZ
Taxi, bus, HGV, LCV, Car (Class D)
Taxi, bus, HGV, LCV, Car (Class D)
Taxi, bus, HGV, LCV, Car (Class D) N/A
Option 5 - ZEZ plus CAZ toughest boundaries ZEZ Taxi (Bus)
Taxi, bus, LCV, Car
Taxi, bus, LCV, Car All
CAZ
Taxi, bus, HGV, LCV, Car (Class D)
Taxi, bus, HGV, LCV, Car (Class D)
Taxi, bus, HGV, LCV, Car (Class D) All
Option 6 ZEZ plus CAZ on boundary scheme ZEZ Taxi (Bus)
Taxi, bus, LCV, Car
Taxi, bus, LCV, Car All
CAZ HGV, LCV, Car (Class D) HGV HGV N/A
These six options can be summaries as follows:
• Option 1 ZEZ with measured expansion – a limited ZEZ in 2020 covering cars and taxis in the red zone, expanding out slowly to a full scheme in 2035.
• Option 2 ZEZ plus CAZ with measured expansion – this is the same as Option 1 in terms of the ZEZ but is complemented by the CAZ starting in the orange zone covering all vehicles except cars in 2020, then expanding in 2025 and 2030 until it is superseded by the ZEZ in 2035.
• Option 3 ZEZ with more rapid expansion – this is like Option 1 but has a more rapid expansion and vans included in the ZEZ from 2020
• Option 4 ZEZ plus CAZ more rapid expansion – this has the same ZEZ as Option 3 but is complemented by a CAZ with more rapid expansion than in Option 2, with the CAZ expanding to the green zone by 2025.
Oxford Zero Emission Zone Feasibility and Implementation Study | 25
Ricardo in Confidence Ref: Ricardo/ED10000/Issue Number 1
Ricardo Energy & Environment
• Option 5 ZEZ plus CAZ with most rapid expansion – is the most rapid development of the scheme with the ZEZ starting in the orange zone and the CAZ in the green zone.
• Option 6 one boundary scheme – a ‘one boundary’ scheme was explored given it was considered to be potentially easier to understand by user. So, the boundary is the same in each year but the standard the vehicles must meet varies.
4.4 Short listing the options
These six options were discussed with the project steering group and wider stakeholder group to narrow the options down to a short-list that would be taken forward for the full emissions, air quality and cost benefits assessments. In short listing the options the following criteria were considered:
1. Impact on emissions – consider the number of vehicles affected and level of emissions in each zone
2. Potential for wider environmental benefits – covering noise, congestion, CO2 emission, etc.
3. Burden on residents – how difficult would it be for residents to comply and the costs they may face in doing so
4. Burden on businesses – how difficult and costly would it be for businesses such as bus and freight operators to comply
5. Implementation costs – how expensive would a scheme be to set up
6. Implementation risk – how difficult would it be to set up and enforce.
A multi criteria assessment (MCA) was carried out against these 6 criteria. A short list of four options to take forward was agreed by the project steering group based on the results of the MCA and views of the steering group members and external stakeholders.
The final options that were selected to take forward for further assessment were Options 1, 2, 3 and 4. These 4 options were felt to offer the best balance between environmental benefit and cost to users and the Council, and provide insight into the relative merits of implementing a ZEZ on its own in comparison to complementing a ZEZ with a CAZ. The other options were rejected for the following main reasons:
• Option 5 – although this was likely to have the greatest emissions and air quality benefits, it was deemed that it would be too difficult and costly for business and residents to comply with.
• Option 6 – although this might be easy for people to understand and comply with it was felt that the implementation path was too slow resulting in the emissions impacts being limited.
The remainder of the report therefore focuses on Options 1, 2, 3 and 4 and the more detailed assessment undertaken of these options.
Oxford Zero Emission Zone Feasibility and Implementation Study | 26
Ricardo in Confidence Ref: Ricardo/ED10000/Issue Number 1
Ricardo Energy & Environment
5 Emissions and air quality assessment of preferred options
5.1 Outline methodology
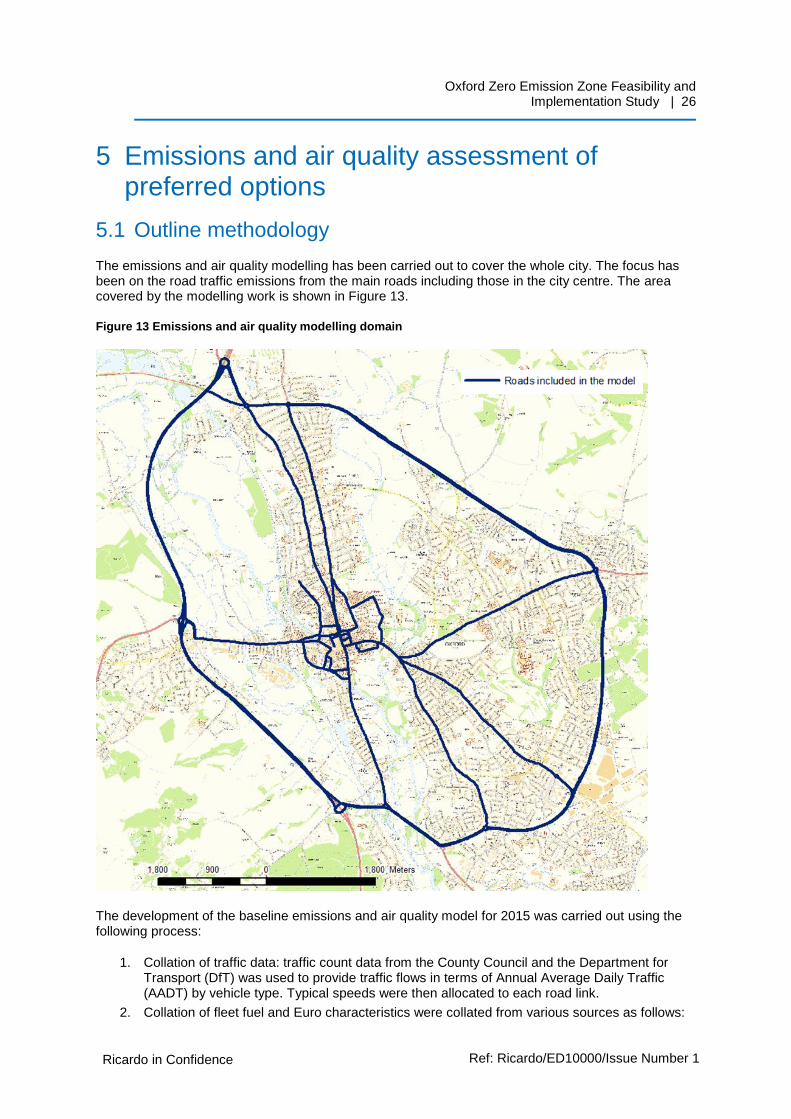
The emissions and air quality modelling has been carried out to cover the whole city. The focus has been on the road traffic emissions from the main roads including those in the city centre. The area covered by the modelling work is shown in Figure 13.
Figure 13 Emissions and air quality modelling domain
The development of the baseline emissions and air quality model for 2015 was carried out using the following process:
1. Collation of traffic data: traffic count data from the County Council and the Department for Transport (DfT) was used to provide traffic flows in terms of Annual Average Daily Traffic (AADT) by vehicle type. Typical speeds were then allocated to each road link.
2. Collation of fleet fuel and Euro characteristics were collated from various sources as follows:

Oxford Zero Emission Zone Feasibility and Implementation Study | 27
Ricardo in Confidence Ref: Ricardo/ED10000/Issue Number 1
Ricardo Energy & Environment
a. Bus fleet data was provided by the main bus operators Stagecoach and Oxford Bus Company
b. Taxi data was obtained from a report on the taxi fleet in Oxford carried out by EST16
c. Cars, vans and HGVs were assumed to reflect the national fleet mix taken from the National Atmospheric Emission Inventory (NAEI).
3. The traffic and fleet data were combined with the latest COPERT 5 emission factors to provide total annual emissions of NOx and PM for the modelled road links.
4. The emission data was then put through the RapidAir dispersion model to provide concentration results for the road traffic emissions. These were added to national background concentration maps to provide total concentrations.
5. The concentration results are then verified against actual measured data in 2015 to provide a model calibration factor.
For future years, model traffic flows have been projected using the standard growth factors from TEMPRO 7.1 and the fleet composition data was assumed to evolve in line with the fleet projections in the NAEI. This provided business as usual (BAU) results for 2020, 2025, 2030 and 2035.
The future options were modelled by adjusting the fleet composition to reflect the restriction applied by a ZEZ or CAZ. This was done by adjusting the fleet composition in the access restricted area and assumptions were made in terms of how this would affect fleet composition outside the access restricted area.
Further details of the emissions and air quality modelling approach, including model verification, are provided in Appendix 1.
5.2 Summary emissions results
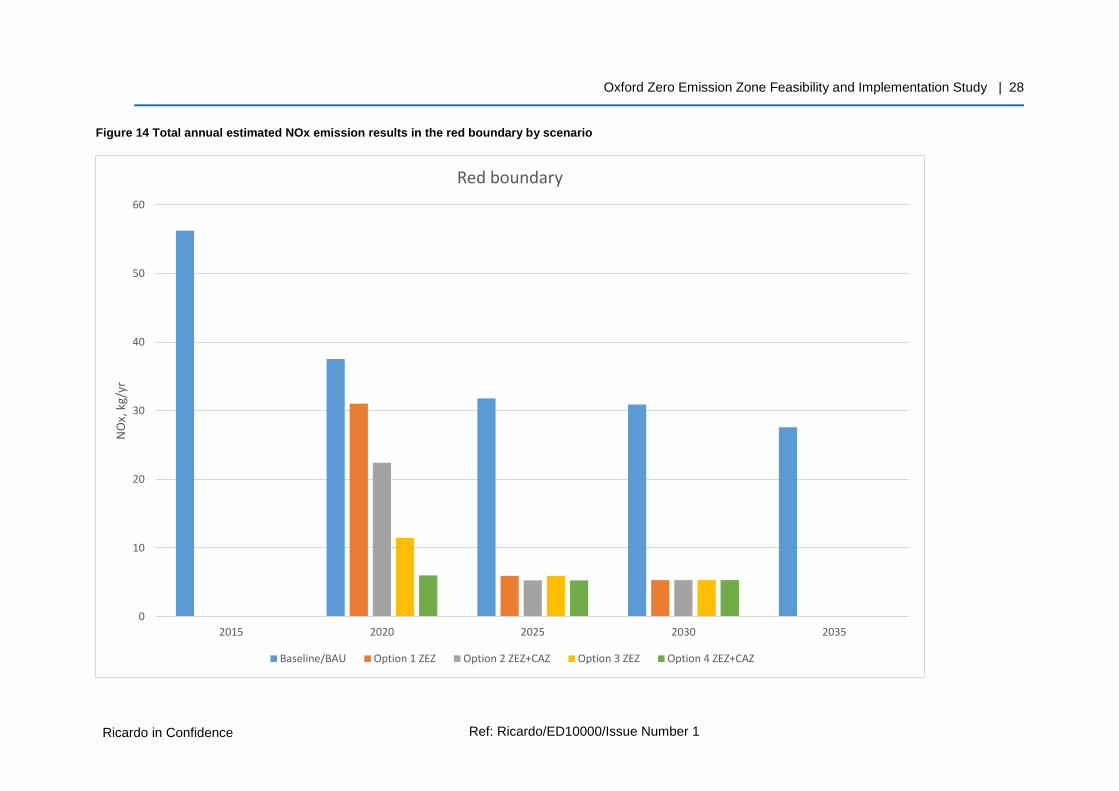
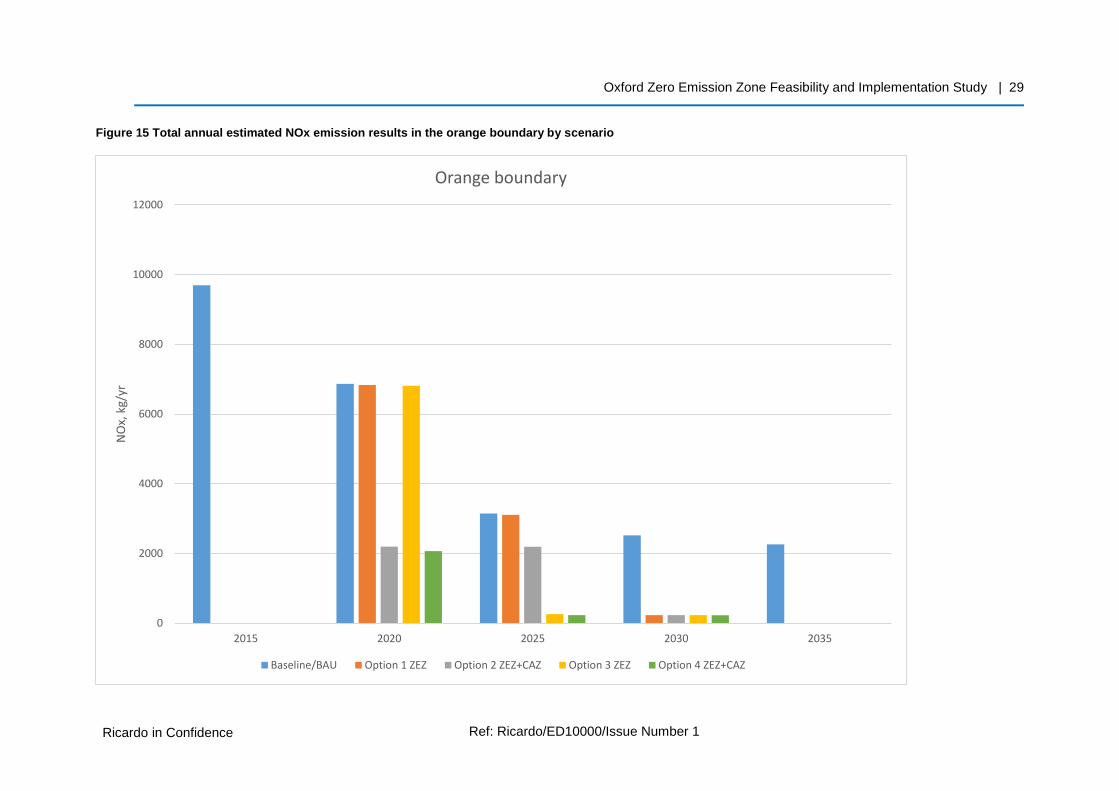
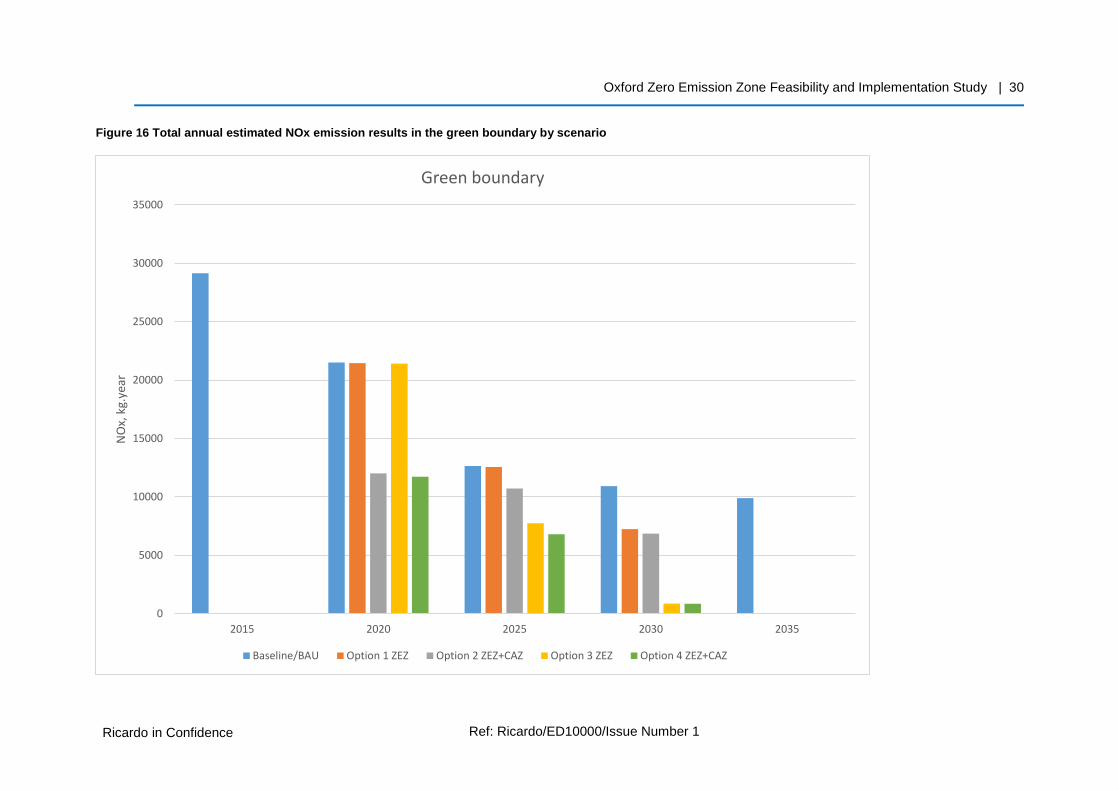
Emission results were calculated for the base year in 2015, and for the business as usual (BAU) scenario and each scheme options scenarios for future years. The results for NOx are shown in Figures 14 to 17 below. The key findings from these results are as follows:
• The BAU results (i.e. with no ZEZ or CAZ scheme in place) show a significant drop off in emissions by around 50% (depending on the boundary under consideration) from 2015 to 2035 through the natural evolution of the fleet.
• All schemes have the same end point in 2035 with a full ZEZ giving 100% reduction in emissions in the city centre (green boundary). The knock-on effect of this across the city as a whole is a 16% reduction in emissions compared to BAU in 2035.
• To have significant impact on NOx emissions and NO2 concentrations in 2020 a CAZ will be needed as the impact of the ZEZ-only options are limited due to the limited geographical scope in 2020.
• The benefit of the ZEZ becomes significant for Option 3 in 2025 but for Option 1 not until 2030 (when the ZEZ covers the orange boundary).
• For Option 4 the benefit of the additional CAZ rapidly reduces from 2025 as the ZEZ expands.
• Overall Option 4 with the ZEZ plus the CAZ provides the largest reduction in emissions over the period with the CAZ providing an early impact.
16 ‘ULEV Taxi Scheme – feasibility study for Oxford City Council’, Energy Saving Trust, March 2016
Oxford Zero Emission Zone Feasibility and Implementation Study | 28
Ricardo in Confidence Ref: Ricardo/ED10000/Issue Number 1
Ricardo Energy & Environment
Figure 14 Total annual estimated NOx emission results in the red boundary by scenario
0
10
20
30
40
50
60
2015 2020 2025 2030 2035
NO
x, k
g/yr
Red boundary
Baseline/BAU Option 1 ZEZ Option 2 ZEZ+CAZ Option 3 ZEZ Option 4 ZEZ+CAZ
Oxford Zero Emission Zone Feasibility and Implementation Study | 29
Ricardo in Confidence Ref: Ricardo/ED10000/Issue Number 1
Ricardo Energy & Environment
Figure 15 Total annual estimated NOx emission results in the orange boundary by scenario
0
2000
4000
6000
8000
10000
12000
2015 2020 2025 2030 2035
NO
x, k
g/yr
Orange boundary
Baseline/BAU Option 1 ZEZ Option 2 ZEZ+CAZ Option 3 ZEZ Option 4 ZEZ+CAZ
Oxford Zero Emission Zone Feasibility and Implementation Study | 30
Ricardo in Confidence Ref: Ricardo/ED10000/Issue Number 1
Ricardo Energy & Environment
Figure 16 Total annual estimated NOx emission results in the green boundary by scenario
0
5000
10000
15000
20000
25000
30000
35000
2015 2020 2025 2030 2035
NO
x, k
g.ye
ar
Green boundary
Baseline/BAU Option 1 ZEZ Option 2 ZEZ+CAZ Option 3 ZEZ Option 4 ZEZ+CAZ

Oxford Zero Emission Zone Feasibility and Implementation Study | 31
Ricardo in Confidence Ref: Ricardo/ED10000/Issue Number 1
Ricardo Energy & Environment
Figure 17 Total annual estimated NOx emission results for the whole city area (as modelled) by scenario
0
50000
100000
150000
200000
250000
300000
350000
400000
450000
500000
2015 2020 2025 2030 2035
NO
x, k
g.ye
ar
City wide
Baseline/BAU Option 1 ZEZ Option 2 ZEZ+CAZ Option 3 ZEZ Option 4 ZEZ+CAZ

Oxford Zero Emission Zone Feasibility and Implementation Study | 32
Ricardo in Confidence Ref: Ricardo/ED10000/Issue Number 1
Ricardo Energy & Environment
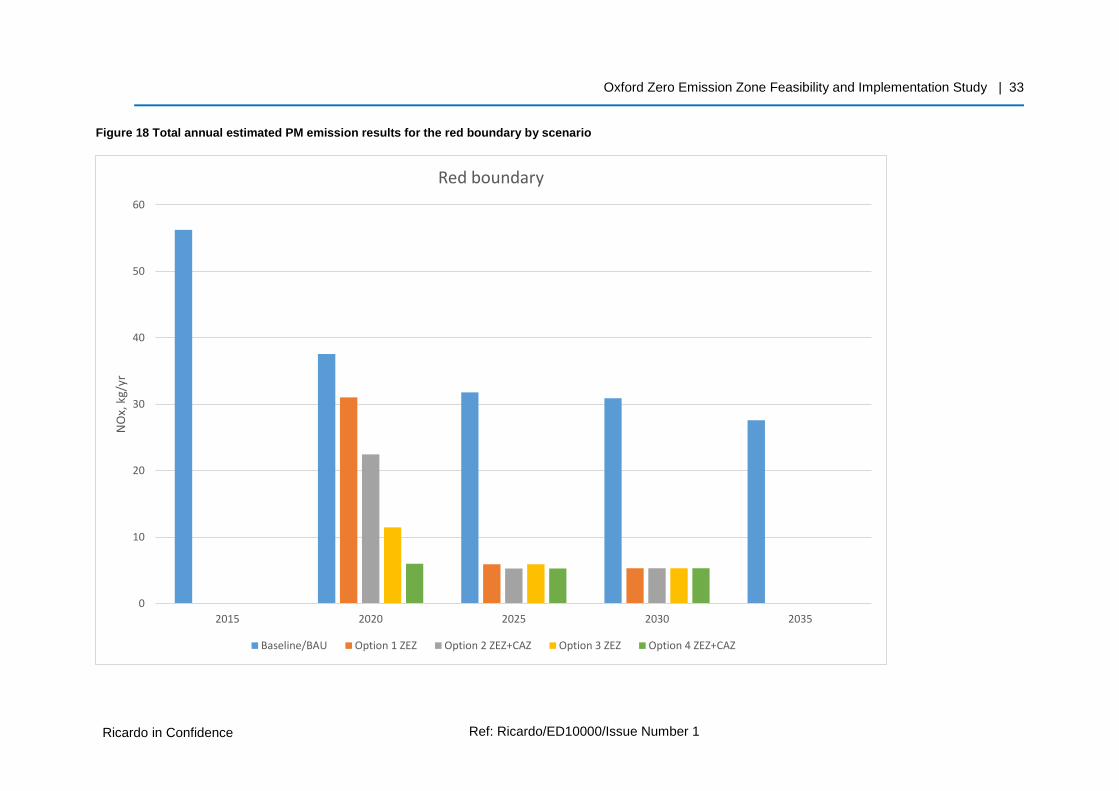
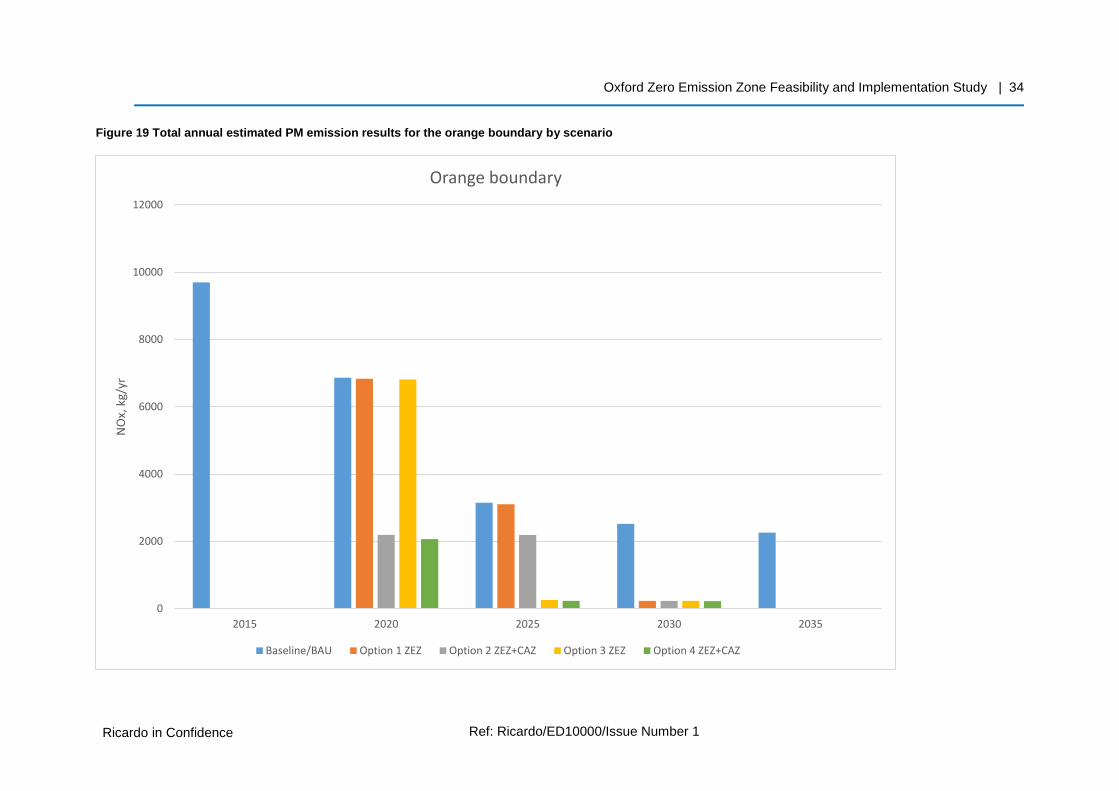
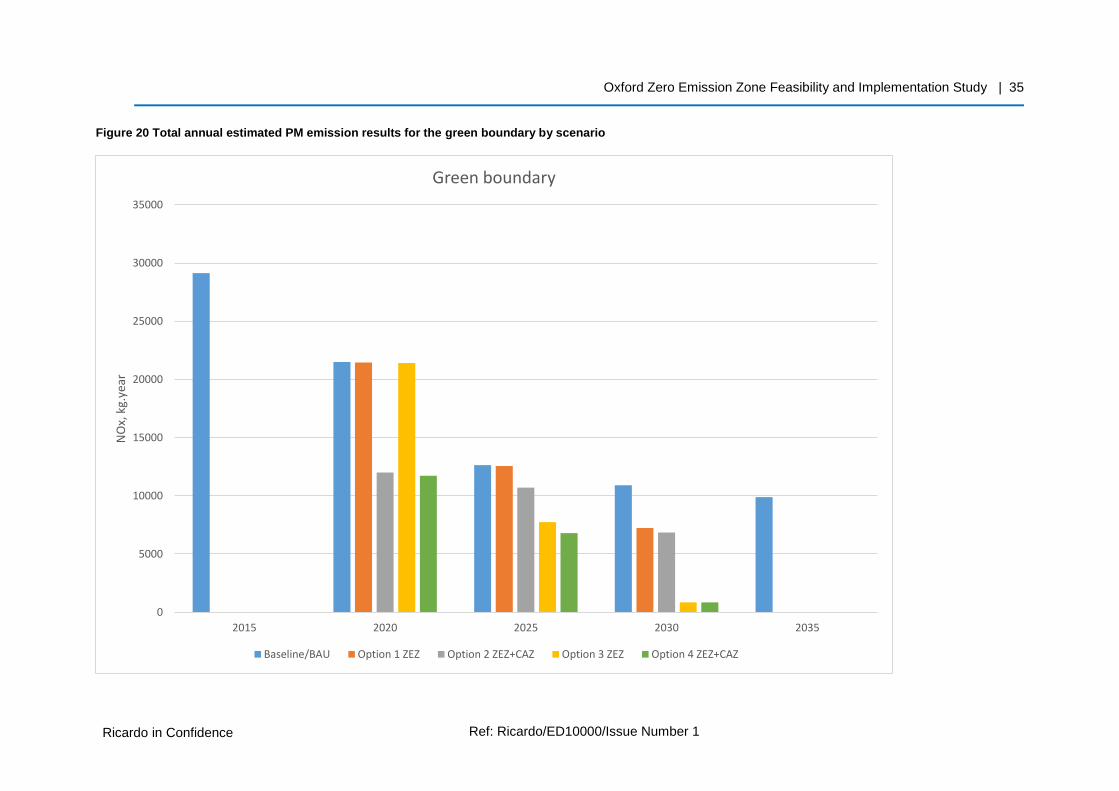
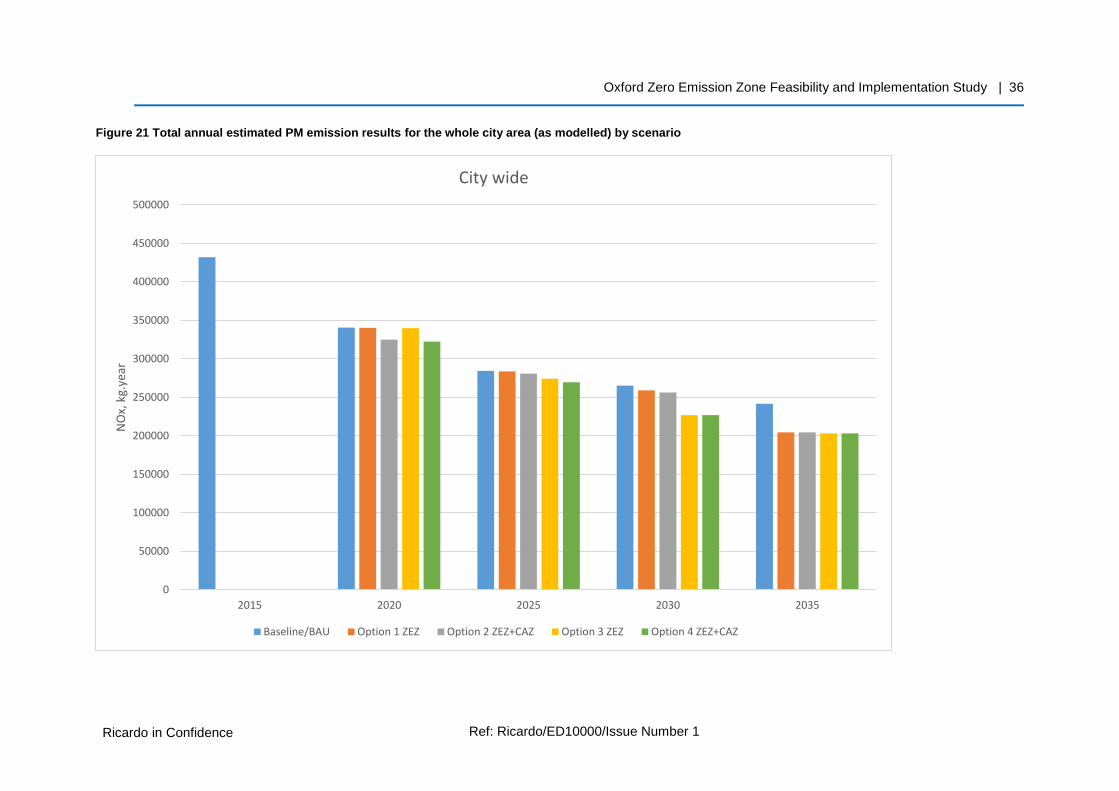
The results for particulate matter emissions (PM10) are presented in Figures 18 to 21. These results show quite a different pattern to those for NOx. In understanding these results there are two key points to note:
• The impact of improvements from earlier Euro standards on urban PM emissions have been much more significant to date than is the case for NOx emissions. The key benefit of improving standards for PM occurred before the Euro 5 and Euro V17 emission standards, with only relatively minor further improvements anticipated afterwards. As such, the reduction in PM which naturally occurs in the baseline has been starting to flatten out. Combine this with an increase in traffic over time and the result for the BAU scenario is a reduction to 2025 after which emissions begin to increase to 2035. Overall by 2035 there is only an 11% reduction in PM emissions for the baseline from 2015 to 2035 in the central area, which rises to 17% when the full ZEZ is in place.
• PM emissions has two components: one related to exhaust emissions and one related to non-exhaust emissions such as tyre wear and road dust. As the exhaust component reduces, the non-exhaust component becomes much more significant as a proportion of total emissions. Even though they will continue to reduce exhaust emissions, ZEVs will still have PM emissions from tyre wear and road dust, limiting the overall reductions that are achievable.
Due to these factors, the ZEZ scheme has much less impact on PM emissions than it does on NOx. In fact, even by 2035 the ZEZ scheme only reduces PM by 6% across the different zones compared to BAU.
17 Euro 4, 5, 6 refer to the regulations for light duty vehicles, Euro IV, V VI relate to regulations for heavy duty vehicles
Oxford Zero Emission Zone Feasibility and Implementation Study | 33
Ricardo in Confidence Ref: Ricardo/ED10000/Issue Number 1
Ricardo Energy & Environment
Figure 18 Total annual estimated PM emission results for the red boundary by scenario
0
10
20
30
40
50
60
2015 2020 2025 2030 2035
NO
x, k
g/yr
Red boundary
Baseline/BAU Option 1 ZEZ Option 2 ZEZ+CAZ Option 3 ZEZ Option 4 ZEZ+CAZ
Oxford Zero Emission Zone Feasibility and Implementation Study | 34
Ricardo in Confidence Ref: Ricardo/ED10000/Issue Number 1
Ricardo Energy & Environment
Figure 19 Total annual estimated PM emission results for the orange boundary by scenario
0
2000
4000
6000
8000
10000
12000
2015 2020 2025 2030 2035
NO
x, k
g/yr
Orange boundary
Baseline/BAU Option 1 ZEZ Option 2 ZEZ+CAZ Option 3 ZEZ Option 4 ZEZ+CAZ
Oxford Zero Emission Zone Feasibility and Implementation Study | 35
Ricardo in Confidence Ref: Ricardo/ED10000/Issue Number 1
Ricardo Energy & Environment
Figure 20 Total annual estimated PM emission results for the green boundary by scenario
0
5000
10000
15000
20000
25000
30000
35000
2015 2020 2025 2030 2035
NO
x, k
g.ye
ar
Green boundary
Baseline/BAU Option 1 ZEZ Option 2 ZEZ+CAZ Option 3 ZEZ Option 4 ZEZ+CAZ
Oxford Zero Emission Zone Feasibility and Implementation Study | 36
Ricardo in Confidence Ref: Ricardo/ED10000/Issue Number 1
Ricardo Energy & Environment
Figure 21 Total annual estimated PM emission results for the whole city area (as modelled) by scenario
0
50000
100000
150000
200000
250000
300000
350000
400000
450000
500000
2015 2020 2025 2030 2035
NO
x, k
g.ye
ar
City wide
Baseline/BAU Option 1 ZEZ Option 2 ZEZ+CAZ Option 3 ZEZ Option 4 ZEZ+CAZ
Oxford Zero Emission Zone Feasibility and Implementation Study | 37
Ricardo in Confidence Ref: Ricardo/ED10000/Issue Number 1
Ricardo Energy & Environment
5.3 Pollution concentration results
The pollutant concentration results have been produced using the RapidAir dispersion model. This takes the emissions data for the road network and the national background concentration maps to produce pollutant concentration maps for the city. This exercise has been carried out for NO2, which is the main pollutant of concern, for the BAU scenario and the four options.
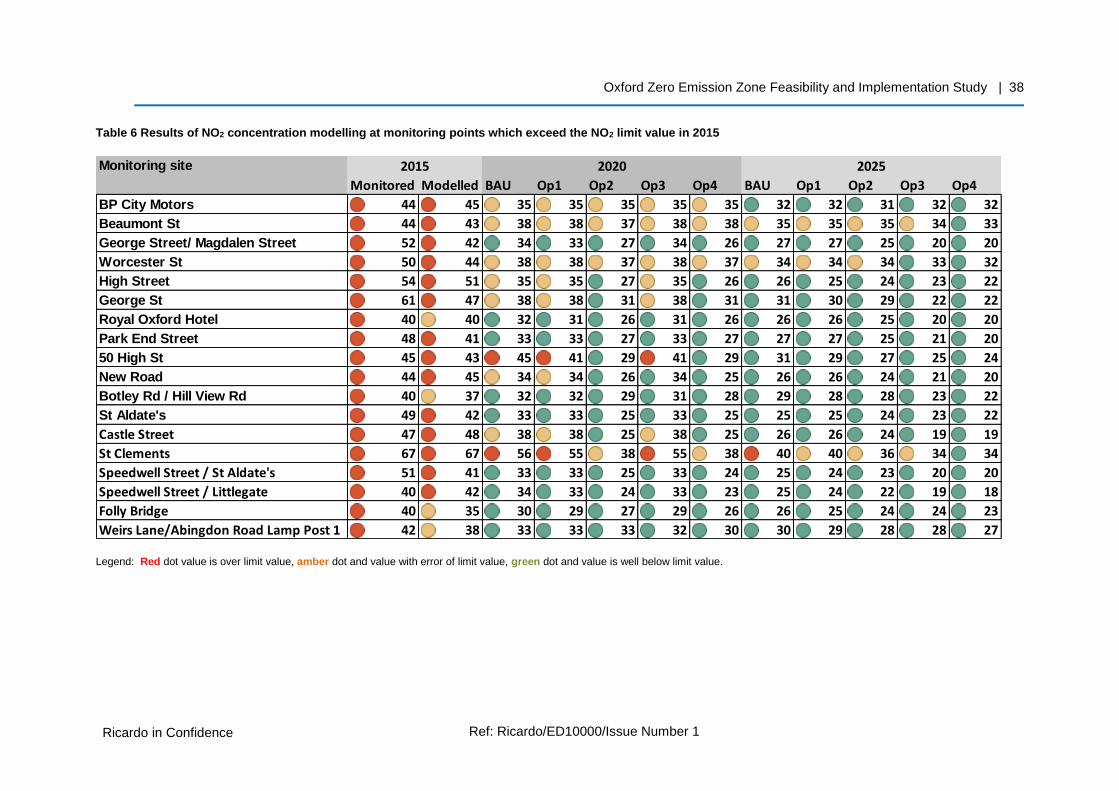
The health based limit value for NO2 is 40µgm-3 on an annual average basis. The results are shown below in Table 6 for all monitoring locations that exceeded this value in 2015. Forecast results are shown for 2020, 2025, 2030 and 2035. The results are colour coded with: red dots showing values over the limit value, amber dots showing values within the modelling boundary of error around the limit value (and so ‘at risk’ of exceeding) and green dots for values below the modelling boundary of error around the limit value (so well within compliance).
These results show that:
• Under the BAU scenario two sites are anticipated to remain above the limit value in 2020: High Street and St. Clements Street. Further several others are potentially at risk of being above the limit values, such as George Street and Beaumont Street.
• By 2025, only St. Clements Street is shown as an exceedance, with Beaumont and Worcester Streets at risk.
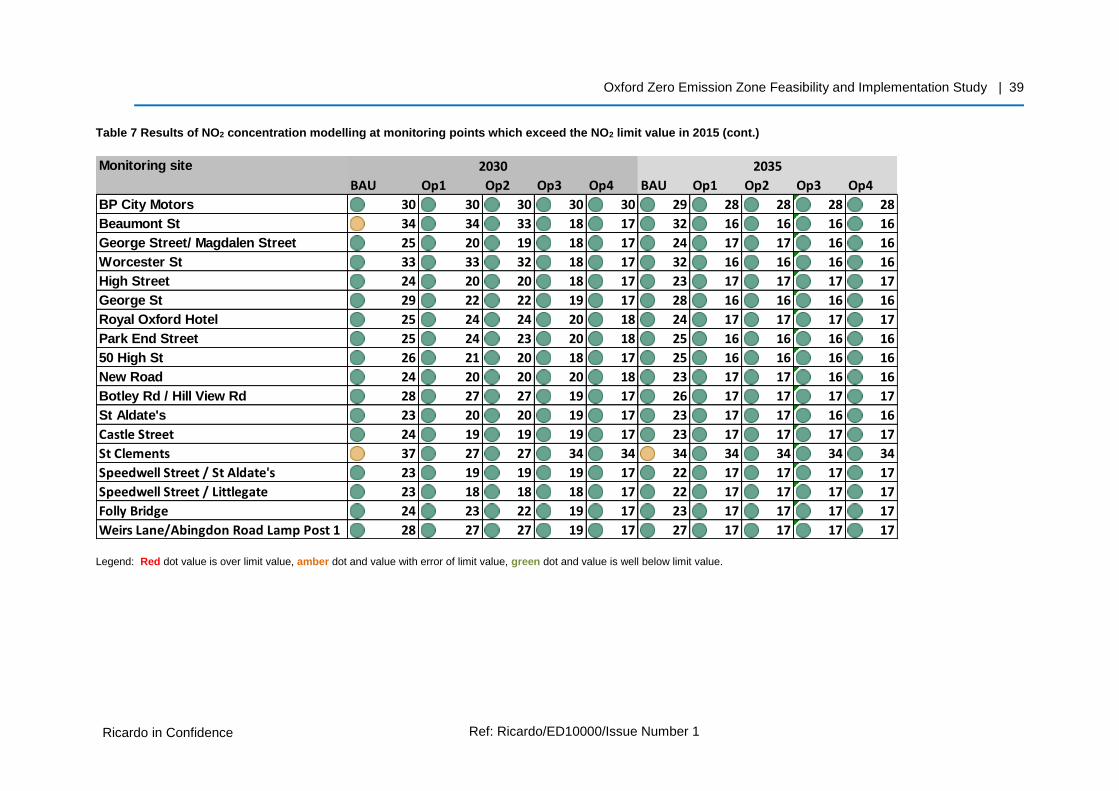
• By 2030 all sites are compliant with only St. Clements and Beaumont Street at risk.
The impact of the scenarios reflects the emission results above:
• The ZEZ-only options (Option 1 and 3) have little impact in 2020 with no real improvement to the estimated NO2 concentration levels.
• However, by adding a CAZ in both Options 2 and 4, all the NO2 exceedances are removed (though several sites are still potentially at risk).
• By 2025 all options are forecast to remove exceedances with Option 4 having no sites at risk at all.
• By 2030 all the options remove any risk of exceedance of the limit values.
Oxford Zero Emission Zone Feasibility and Implementation Study | 38
Ricardo in Confidence Ref: Ricardo/ED10000/Issue Number 1
Ricardo Energy & Environment
Table 6 Results of NO2 concentration modelling at monitoring points which exceed the NO2 limit value in 2015
Legend: Red dot value is over limit value, amber dot and value with error of limit value, green dot and value is well below limit value.
Monitored Modelled BAU Op1 Op2 Op3 Op4 BAU Op1 Op2 Op3 Op4
BP City Motors 44 45 35 35 35 35 35 32 32 31 32 32
Beaumont St 44 43 38 38 37 38 38 35 35 35 34 33
George Street/ Magdalen Street 52 42 34 33 27 34 26 27 27 25 20 20
Worcester St 50 44 38 38 37 38 37 34 34 34 33 32
High Street 54 51 35 35 27 35 26 26 25 24 23 22
George St 61 47 38 38 31 38 31 31 30 29 22 22
Royal Oxford Hotel 40 40 32 31 26 31 26 26 26 25 20 20
Park End Street 48 41 33 33 27 33 27 27 27 25 21 20
50 High St 45 43 45 41 29 41 29 31 29 27 25 24
New Road 44 45 34 34 26 34 25 26 26 24 21 20
Botley Rd / Hill View Rd 40 37 32 32 29 31 28 29 28 28 23 22
St Aldate's 49 42 33 33 25 33 25 25 25 24 23 22
Castle Street 47 48 38 38 25 38 25 26 26 24 19 19
St Clements 67 67 56 55 38 55 38 40 40 36 34 34
Speedwell Street / St Aldate's 51 41 33 33 25 33 24 25 24 23 20 20
Speedwell Street / Littlegate 40 42 34 33 24 33 23 25 24 22 19 18
Folly Bridge 40 35 30 29 27 29 26 26 25 24 24 23
Weirs Lane/Abingdon Road Lamp Post 1 42 38 33 33 33 32 30 30 29 28 28 27
Monitoring site 2020 20252015
Oxford Zero Emission Zone Feasibility and Implementation Study | 39
Ricardo in Confidence Ref: Ricardo/ED10000/Issue Number 1
Ricardo Energy & Environment
Table 7 Results of NO2 concentration modelling at monitoring points which exceed the NO2 limit value in 2015 (cont.)
Legend: Red dot value is over limit value, amber dot and value with error of limit value, green dot and value is well below limit value.
BAU Op1 Op2 Op3 Op4 BAU Op1 Op2 Op3 Op4
BP City Motors 30 30 30 30 30 29 28 28 28 28
Beaumont St 34 34 33 18 17 32 16 16 16 16
George Street/ Magdalen Street 25 20 19 18 17 24 17 17 16 16
Worcester St 33 33 32 18 17 32 16 16 16 16
High Street 24 20 20 18 17 23 17 17 17 17
George St 29 22 22 19 17 28 16 16 16 16
Royal Oxford Hotel 25 24 24 20 18 24 17 17 17 17
Park End Street 25 24 23 20 18 25 16 16 16 16
50 High St 26 21 20 18 17 25 16 16 16 16
New Road 24 20 20 20 18 23 17 17 16 16
Botley Rd / Hill View Rd 28 27 27 19 17 26 17 17 17 17
St Aldate's 23 20 20 19 17 23 17 17 16 16
Castle Street 24 19 19 19 17 23 17 17 17 17
St Clements 37 27 27 34 34 34 34 34 34 34
Speedwell Street / St Aldate's 23 19 19 19 17 22 17 17 17 17
Speedwell Street / Littlegate 23 18 18 18 17 22 17 17 17 17
Folly Bridge 24 23 22 19 17 23 17 17 17 17
Weirs Lane/Abingdon Road Lamp Post 1 28 27 27 19 17 27 17 17 17 17
Monitoring site 2030 2035
Oxford Zero Emission Zone Feasibility and Implementation Study | 40
Ricardo in Confidence Ref: Ricardo/ED10000/Issue Number 1
Ricardo Energy & Environment
6 Economic assessment
6.1 Introduction and over-arching approach
Cost-benefit analysis (CBA) is a process through which the impacts of a particular option or policy are identified, assessed and compared against each other. The aim is to try and determine the net balance of impacts: i.e. whether the positives (or benefits) of an option or policy outweigh the negatives (or costs), or vice versa. To facilitate this comparison, all impacts are expressed in monetary terms.
There will be a wide range of impacts associated with the implementation of a ZEZ/CAZ. The following key impacts have been quantified in the analysis:
• Costs of replacing vehicles: this is the upfront and ongoing (i.e. maintenance and fuel) costs associated with purchasing and running the ZEZ/CAZ compliant vehicle
• Infrastructure cost: this captures the cost of installing sufficient recharging infrastructure to support the uptake of ZEVs
• Implementation costs: this represents the cost of the technology and systems to monitor and enforce the zones to achieve compliance
• Air quality benefits: this captures the benefit of reductions in air pollutant emissions associated with the cleaner vehicles introduced in response to the ZEZ/CAZ
• Greenhouse gas (GHG) benefits: cleaner vehicles could also reduce the emissions of GHGs, which will provide an additional benefit to help the UK meet its climate change objectives.
The implementation of the ZEZ/CAZ could also have other impacts, such as on travel time and congestion. These impacts are considered to be less significant than those captured in the core analysis and have been appraised qualitatively.
This analysis is underpinned by several critical assumptions:
• A working assumption on the number of unique vehicles traveling to the different zones, and the subsequent number of non-compliant vehicles, has been compiled from a number of sources. This has been derived in the absence of actual data.
• Behavioural change assumptions governing the response to these types of zones have been adapted from those developed by Government’s Joint Air Quality Unit (JAQU) for use in the evaluation of CAZ schemes. These cover both the nature of vehicle owner’s response to the zones (e.g. upgrade vehicle, avoid the zone, etc.), and the compliant vehicles selected by those who upgrade.
• For the ZEZ, for simplicity it is assumed that battery electric is the technology of choice across all modes for upgraded vehicles.
• In the absence of more detailed fleet analysis, it is simply assumed that one conventional fuelled vehicle can be replaced directly by one ZEV. For light duty vehicles, this assumption might be more appropriate but for buses, and HGVs this assumption may be more stretching. This is discussed further in the sensitivity analysis around the core results.
• Lifetime of BEVs is assumed to be the same as a conventional fuelled equivalent.
Further information regarding the approach and underpinning assumptions can be found in Appendix 2.
Oxford Zero Emission Zone Feasibility and Implementation Study | 41
Ricardo in Confidence Ref: Ricardo/ED10000/Issue Number 1
Ricardo Energy & Environment
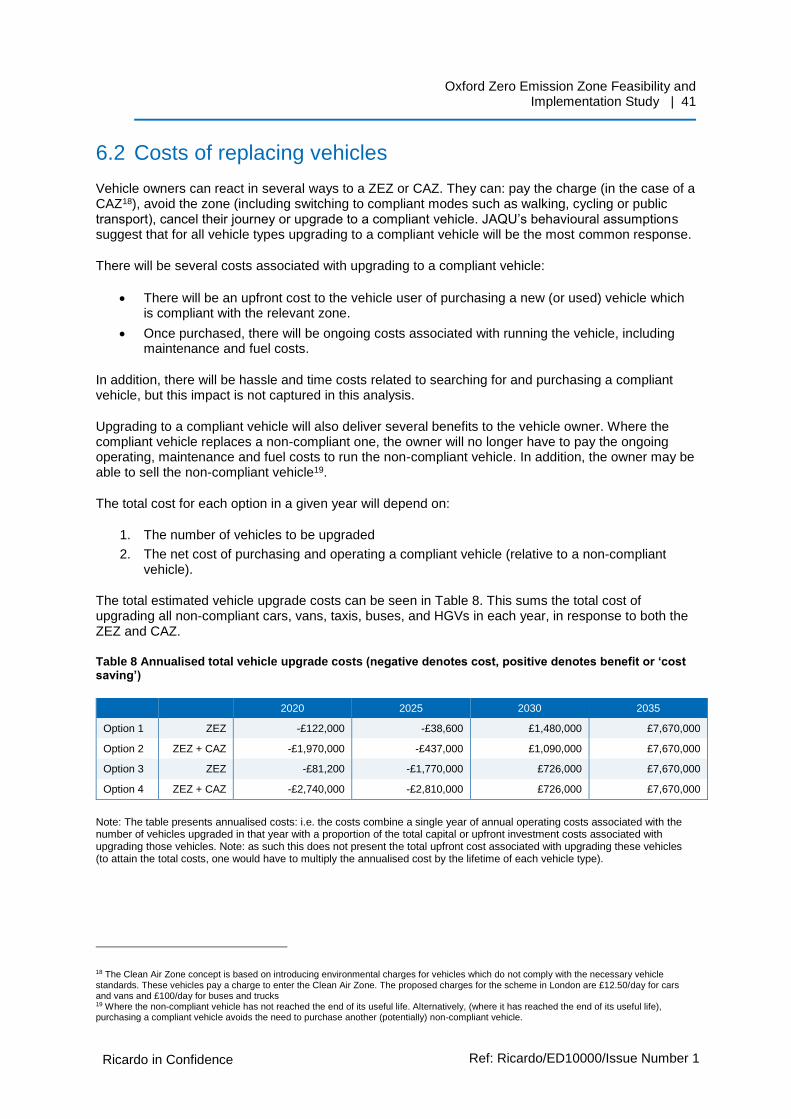
6.2 Costs of replacing vehicles
Vehicle owners can react in several ways to a ZEZ or CAZ. They can: pay the charge (in the case of a CAZ18), avoid the zone (including switching to compliant modes such as walking, cycling or public transport), cancel their journey or upgrade to a compliant vehicle. JAQU’s behavioural assumptions suggest that for all vehicle types upgrading to a compliant vehicle will be the most common response.
There will be several costs associated with upgrading to a compliant vehicle:
• There will be an upfront cost to the vehicle user of purchasing a new (or used) vehicle which is compliant with the relevant zone.
• Once purchased, there will be ongoing costs associated with running the vehicle, including maintenance and fuel costs.
In addition, there will be hassle and time costs related to searching for and purchasing a compliant vehicle, but this impact is not captured in this analysis.
Upgrading to a compliant vehicle will also deliver several benefits to the vehicle owner. Where the compliant vehicle replaces a non-compliant one, the owner will no longer have to pay the ongoing operating, maintenance and fuel costs to run the non-compliant vehicle. In addition, the owner may be able to sell the non-compliant vehicle19.
The total cost for each option in a given year will depend on:
1. The number of vehicles to be upgraded
2. The net cost of purchasing and operating a compliant vehicle (relative to a non-compliant vehicle).
The total estimated vehicle upgrade costs can be seen in Table 8. This sums the total cost of upgrading all non-compliant cars, vans, taxis, buses, and HGVs in each year, in response to both the ZEZ and CAZ.
Table 8 Annualised total vehicle upgrade costs (negative denotes cost, positive denotes benefit or ‘cost saving’)
2020 2025 2030 2035
Option 1 ZEZ -£122,000 -£38,600 £1,480,000 £7,670,000
Option 2 ZEZ + CAZ -£1,970,000 -£437,000 £1,090,000 £7,670,000
Option 3 ZEZ -£81,200 -£1,770,000 £726,000 £7,670,000
Option 4 ZEZ + CAZ -£2,740,000 -£2,810,000 £726,000 £7,670,000
Note: The table presents annualised costs: i.e. the costs combine a single year of annual operating costs associated with the number of vehicles upgraded in that year with a proportion of the total capital or upfront investment costs associated with upgrading those vehicles. Note: as such this does not present the total upfront cost associated with upgrading these vehicles (to attain the total costs, one would have to multiply the annualised cost by the lifetime of each vehicle type).
18 The Clean Air Zone concept is based on introducing environmental charges for vehicles which do not comply with the necessary vehicle standards. These vehicles pay a charge to enter the Clean Air Zone. The proposed charges for the scheme in London are £12.50/day for cars and vans and £100/day for buses and trucks 19 Where the non-compliant vehicle has not reached the end of its useful life. Alternatively, (where it has reached the end of its useful life), purchasing a compliant vehicle avoids the need to purchase another (potentially) non-compliant vehicle.

Oxford Zero Emission Zone Feasibility and Implementation Study | 42
Ricardo in Confidence Ref: Ricardo/ED10000/Issue Number 1
Ricardo Energy & Environment
In the early years of the assessment period, there is an overall cost associated with upgrading vehicles.
These costs are being predominantly driven by the CAZ (rather than the ZEZ). There is an overall cost of upgrading non-compliant diesel cars, LGVs, HGVs, and buses to compliant alternatives. In addition, the larger CAZ affects more vehicles at this stage, even though the compliance requirements are lower relative to the ZEZ.
That said, this net cost is fairly low in these early years as overall relatively few vehicles are non-compliant: this is because the size of the zones are at their smallest. In addition, the costs of Options 1 and 2 are seen to reduce from 2020 to 2025: this is because more vehicles become compliant in the baseline, resulting in less vehicles needing to be upgraded under the Options20.
By the later years of the analysis (2030 and 2035), there is an overall benefit associated with upgrading vehicles. This is a net effect. The CAZ is still driving some costs associated with upgrading to compliant conventional fuelled cars and the ZEZ is also delivering a cost associated with the upfront costs of purchasing ZEVs. But by 2030, the net cost of upgrading a taxi, van, HGV, and bus to a BEV alternative is negative: the fuel (and in some cases the maintenance) cost savings of operating a BEV relative to a conventional fuelled vehicle is greater than the additional (annualised) upfront costs. Hence switching to a ZEV will deliver a net benefit to the vehicle owner over its lifetime. This is driven by significant anticipated reductions in the cost of purchasing and maintaining BEVs over the study period and the higher efficiency of these zero emission alternatives. In addition, given the ZEZ is expanding in geographic scope and sets a higher standard than the CAZ, the ZEZ begins to affect more vehicles than the CAZ meaning this net benefit to upgrading certain vehicle types to BEV becomes the most prominent effect.
Exactly on whom these costs will fall has not been assessed in detail. However, in the first instance the costs of upgrading vehicles will likely fall directly on vehicle owners: i.e. households and businesses both in and outside (e.g. where HGVs are owned by national operators) Oxford. Where existing grants and subsidies are used to support uptake, this will transfer some of the cost to Government. In practice, this will also be affected by any further supporting measures put in place.
6.3 Infrastructure costs
Significant investment in supporting recharging infrastructure would be required across Oxford city centre and Oxfordshire County to facilitate the uptake of BEVs. A light-touch analysis of the costs of such infrastructure has been carried out using the following approach:
• This analysis has used typical ratios of required recharging facilities per vehicle and the cost of such facilities21. This analysis is not derived from a detailed strategic study of the overall requirement and strategic placement of recharging assets.
• The analysis includes the costs of the charging points and their installation. However, this does not include any additional civil engineering work or electricity network upgrade costs which may also be required.
• The analysis has taken account for the requirement for home or depot charging, and recharging infrastructure when ‘out and about’.
• The analysis has considered the different recharging requirements of different vehicle types.
20 This affect outweighs the expansion of the zones which would otherwise have increased the number of vehicles which require upgrading. 21 Charging point density ratios and costs are predominantly based on: Ricardo study for TfL (2014): ‘Environmental Support to the Development of a London Low Emission Vehicle Roadmap’ (unpublished). These are also informed by current Government support for installation of charging points (https://www.gov.uk/government/uploads/system/uploads/attachment_data/file/564537/evhs-guidance-for-customers-v-2.1.pdf) and information contained in bids for OLEV taxi scheme funding

Oxford Zero Emission Zone Feasibility and Implementation Study | 43
Ricardo in Confidence Ref: Ricardo/ED10000/Issue Number 1
Ricardo Energy & Environment
The estimated infrastructure costs are included in Table 9 below.
Table 9 Annualised infrastructure costs (negative denotes cost, positive denotes benefit)
2020 2025 2030 2035
Option 1 ZEZ -£52,400 -£146,000 -£2,060,000 -£7,230,000
Option 2 ZEZ + CAZ -£52,400 -£146,000 -£2,060,000 -£7,230,000
Option 3 ZEZ -£140,000 -£2,040,000 -£5,090,000 -£7,230,000
Option 4 ZEZ+CAZ -£140,000 -£2,040,000 -£5,090,000 -£7,230,000
The costs of installing supporting infrastructure may be significant. The total costs are highest for cars, vans and HGVs: for cars, this is due to the high number of vehicles that are upgraded to ZEVs and will require recharging points. For HGVs, the cost is more driven by the greater infrastructure requirements per vehicle (assumed to require a mix of fast and relatively expensive rapid chargers, rather than cheaper standard chargers suitable for smaller vehicles) which carry a greater cost. There will also be a reasonable cost for infrastructure to support ZEV bus operation driven by high costs per vehicle: buses, like HGVs, will require more powerful charge points. However, for the ZEZ overall the total costs for bus infrastructure are not as large as those for cars and HGVs given fewer buses are upgraded relative to vehicles in these other categories.
Infrastructure costs will increase over time as costs rise in line with the size of the ZEZ, and the number of non-compliant vehicles which are assumed to be upgraded which subsequently require charging points.
No detailed analysis has been made of where these costs will fall. In practice, the costs of home or depot charging will likely fall in the first instance on vehicle owners (i.e. households and businesses) but this balance could change depending on any supporting measures put in place. Charging points in public places are more likely to be funded by local or national Government given the public nature of this resource.
6.4 Implementation costs
To ensure that vehicle owners have sufficient incentive to comply with the requirements of the zones, monitoring and enforcement of the vehicles travelling into the zones is required. The exact costs of monitoring and enforcing the zones will depend on the detail of the framework surrounding their operation, and the legal powers used. Here the analysis has included a simple estimate of this cost adopting an illustrative framework of cameras, signage, information boards, and ‘back-office’ support.
It is assumed that illuminated signs and Automatic Number Plate Recognition (ANPR) cameras are installed at each entry point to each zone and 5 information boards would be placed on each of the arterial routes into the city. Costs of these items have been calculated using estimates provided by Oxfordshire County Council staff members. These do include the cost for servers and back office equipment but do not include the enforcement of unpaid fines. Further it is assumed where the boundaries shift over time, the signage and cameras can be shifted and re-used from where they are no longer required (although no additional cost has been included for shifting these assets).
The enforcement costs of the zones are presented in Table 10.
Overall, these implementation costs are small relative to the other impacts assessed. The CAZ+ZEZ options are more expensive than the ZEZ only options given these options have two zones which need to be enforced simultaneously, with twice the number of entry points and therefore requiring twice the number of cameras, signs, etc. Likewise, costs increase as the zones shift from the red to orange boundary as the size of the zone and number of entry points increases. But costs decrease shifting from amber to green boundaries as the number of entry points decreases. Implementation costs would likely fall on local public sector.

Oxford Zero Emission Zone Feasibility and Implementation Study | 44
Ricardo in Confidence Ref: Ricardo/ED10000/Issue Number 1
Ricardo Energy & Environment
Table 10 Annualised total implementation costs (negative denotes cost, positive denotes benefit)
2020 2025 2030 2035
Option 1 ZEZ -£41,600 -£41,600 -£99,900 -£90,200
Option 2 ZEZ + CAZ -£141,000 -£141,000 -£190,000 -£90,200
Option 3 ZEZ -£41,600 -£99,900 -£90,200 -£90,200
Option 4 ZEZ+CAZ -£141,000 -£190,000 -£90,200 -£90,200
Note: These costs have been annualised over an assumed lifecycle of 20 years.
6.5 Assessments of benefits associated with emissions savings
Air pollution has a range of detrimental effects on human and environmental health (e.g. mortality through chronic exposure, hospital admissions). As such reducing pollutant emissions will reduce these negative effects. A monetary value of reductions in air pollutants are calculated by combining changes in air pollutant emissions (taken from the preceding air pollutant modelling) with the Interdepartmental Group on Costs and Benefits’ (IGCB) damage costs22. IGCB’s damage costs capture a range of impacts associated with air pollutant emissions and aggregates them into a single impact value for each pollutant, expressed in terms of a ‘£’ impact per tonne of emission. The monetised estimate of impacts is presented in Table 11. Further information on the approach taken is included in Appendix 2.
Table 11 – Monetised benefit of reducing NOx air pollutant emissions (£2015 prices, negative denotes cost, positive denotes benefit)
2020 2025 2030 2035
Option 1 ZEZ £4,920 £23,700 £301,000 £2,030,000
Option 2 ZEZ + CAZ £628,000 £157,000 £430,000 £2,030,000
Option 3 ZEZ £21,500 £452,000 £1,890,000 £2,090,000
Option 4 ZEZ+CAZ £727,000 £659,000 £1,890,000 £2,090,000
Given the PM emissions reductions are very small, only NOx emission reductions under the different options have been monetised.
As can be seen from the table, each option will deliver emissions reductions and an associated benefit. These figures represent the monetary value of an environmental effect: as such this does not represent a tangible cash flow to and from economic agents. Rather this represents the value of the health and wider benefits captured by all those who are exposed to air pollution in Oxford, and the reduction of such pollution.
It should be noted that the emissions modelling did not capture two traffic movements which would have additional impacts on quantity of air pollutant emissions:
1. Only movements in Oxford city centre are captured in the modelling domain. Where ZEVs and cleaner vehicles are driven outside of this domain, this will deliver additional emissions savings not captured by the model. This will particularly be the case for HGVs which are likely to undertake a greater proportion of their mileage outside of the city.
22 https://www.gov.uk/government/uploads/system/uploads/attachment_data/file/460398/air-quality-econanalysis-damagecost.pdf
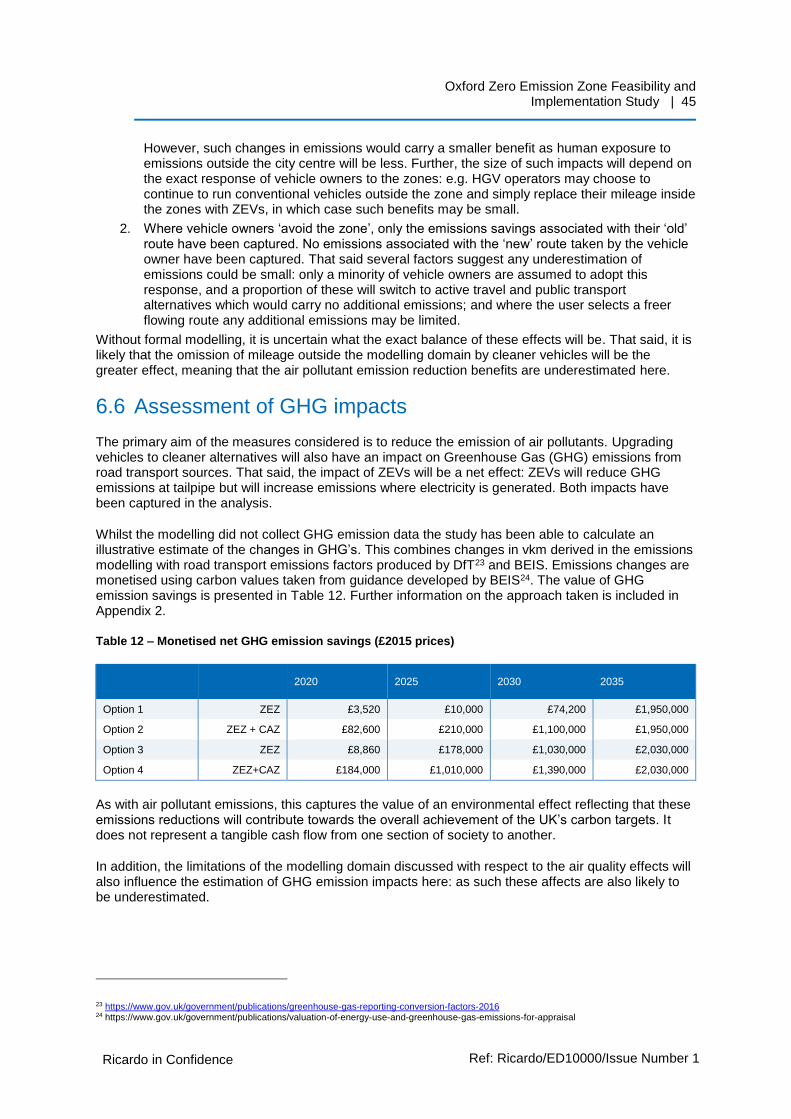
Oxford Zero Emission Zone Feasibility and Implementation Study | 45
Ricardo in Confidence Ref: Ricardo/ED10000/Issue Number 1
Ricardo Energy & Environment
However, such changes in emissions would carry a smaller benefit as human exposure to emissions outside the city centre will be less. Further, the size of such impacts will depend on the exact response of vehicle owners to the zones: e.g. HGV operators may choose to continue to run conventional vehicles outside the zone and simply replace their mileage inside the zones with ZEVs, in which case such benefits may be small.
2. Where vehicle owners ‘avoid the zone’, only the emissions savings associated with their ‘old’ route have been captured. No emissions associated with the ‘new’ route taken by the vehicle owner have been captured. That said several factors suggest any underestimation of emissions could be small: only a minority of vehicle owners are assumed to adopt this response, and a proportion of these will switch to active travel and public transport alternatives which would carry no additional emissions; and where the user selects a freer flowing route any additional emissions may be limited.
Without formal modelling, it is uncertain what the exact balance of these effects will be. That said, it is likely that the omission of mileage outside the modelling domain by cleaner vehicles will be the greater effect, meaning that the air pollutant emission reduction benefits are underestimated here.
6.6 Assessment of GHG impacts
The primary aim of the measures considered is to reduce the emission of air pollutants. Upgrading vehicles to cleaner alternatives will also have an impact on Greenhouse Gas (GHG) emissions from road transport sources. That said, the impact of ZEVs will be a net effect: ZEVs will reduce GHG emissions at tailpipe but will increase emissions where electricity is generated. Both impacts have been captured in the analysis.
Whilst the modelling did not collect GHG emission data the study has been able to calculate an illustrative estimate of the changes in GHG’s. This combines changes in vkm derived in the emissions modelling with road transport emissions factors produced by DfT23 and BEIS. Emissions changes are monetised using carbon values taken from guidance developed by BEIS24. The value of GHG emission savings is presented in Table 12. Further information on the approach taken is included in Appendix 2.
Table 12 – Monetised net GHG emission savings (£2015 prices)
2020 2025 2030 2035
Option 1 ZEZ £3,520 £10,000 £74,200 £1,950,000
Option 2 ZEZ + CAZ £82,600 £210,000 £1,100,000 £1,950,000
Option 3 ZEZ £8,860 £178,000 £1,030,000 £2,030,000
Option 4 ZEZ+CAZ £184,000 £1,010,000 £1,390,000 £2,030,000
As with air pollutant emissions, this captures the value of an environmental effect reflecting that these emissions reductions will contribute towards the overall achievement of the UK’s carbon targets. It does not represent a tangible cash flow from one section of society to another.
In addition, the limitations of the modelling domain discussed with respect to the air quality effects will also influence the estimation of GHG emission impacts here: as such these affects are also likely to be underestimated.
23 https://www.gov.uk/government/publications/greenhouse-gas-reporting-conversion-factors-2016 24 https://www.gov.uk/government/publications/valuation-of-energy-use-and-greenhouse-gas-emissions-for-appraisal
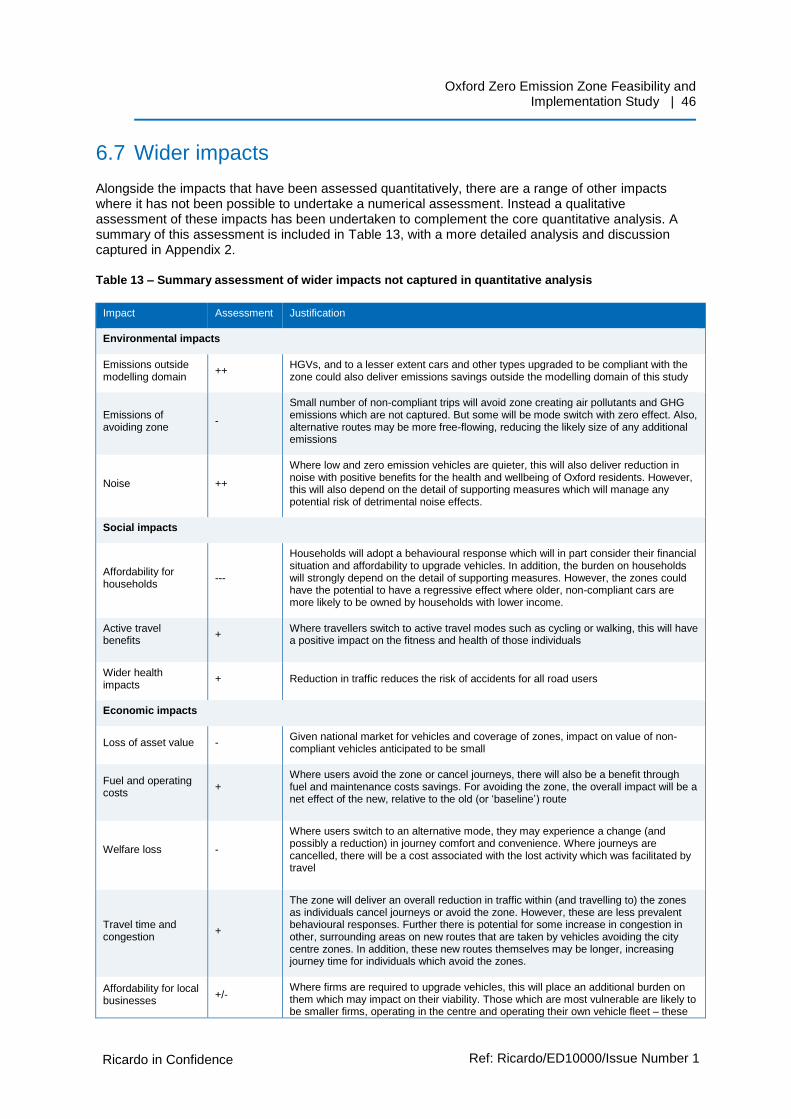
Oxford Zero Emission Zone Feasibility and Implementation Study | 46
Ricardo in Confidence Ref: Ricardo/ED10000/Issue Number 1
Ricardo Energy & Environment
6.7 Wider impacts
Alongside the impacts that have been assessed quantitatively, there are a range of other impacts where it has not been possible to undertake a numerical assessment. Instead a qualitative assessment of these impacts has been undertaken to complement the core quantitative analysis. A summary of this assessment is included in Table 13, with a more detailed analysis and discussion captured in Appendix 2.
Table 13 – Summary assessment of wider impacts not captured in quantitative analysis
Impact Assessment Justification
Environmental impacts
Emissions outside modelling domain
++ HGVs, and to a lesser extent cars and other types upgraded to be compliant with the zone could also deliver emissions savings outside the modelling domain of this study
Emissions of avoiding zone
-
Small number of non-compliant trips will avoid zone creating air pollutants and GHG emissions which are not captured. But some will be mode switch with zero effect. Also, alternative routes may be more free-flowing, reducing the likely size of any additional emissions
Noise ++
Where low and zero emission vehicles are quieter, this will also deliver reduction in noise with positive benefits for the health and wellbeing of Oxford residents. However, this will also depend on the detail of supporting measures which will manage any potential risk of detrimental noise effects.
Social impacts
Affordability for households
---
Households will adopt a behavioural response which will in part consider their financial situation and affordability to upgrade vehicles. In addition, the burden on households will strongly depend on the detail of supporting measures. However, the zones could have the potential to have a regressive effect where older, non-compliant cars are more likely to be owned by households with lower income.
Active travel benefits
+ Where travellers switch to active travel modes such as cycling or walking, this will have a positive impact on the fitness and health of those individuals
Wider health impacts
+ Reduction in traffic reduces the risk of accidents for all road users
Economic impacts
Loss of asset value - Given national market for vehicles and coverage of zones, impact on value of non-compliant vehicles anticipated to be small
Fuel and operating costs
+ Where users avoid the zone or cancel journeys, there will also be a benefit through fuel and maintenance costs savings. For avoiding the zone, the overall impact will be a net effect of the new, relative to the old (or ‘baseline’) route
Welfare loss -
Where users switch to an alternative mode, they may experience a change (and possibly a reduction) in journey comfort and convenience. Where journeys are cancelled, there will be a cost associated with the lost activity which was facilitated by travel
Travel time and congestion
+
The zone will deliver an overall reduction in traffic within (and travelling to) the zones as individuals cancel journeys or avoid the zone. However, these are less prevalent behavioural responses. Further there is potential for some increase in congestion in other, surrounding areas on new routes that are taken by vehicles avoiding the city centre zones. In addition, these new routes themselves may be longer, increasing journey time for individuals which avoid the zones.
Affordability for local businesses
+/- Where firms are required to upgrade vehicles, this will place an additional burden on them which may impact on their viability. Those which are most vulnerable are likely to be smaller firms, operating in the centre and operating their own vehicle fleet – these
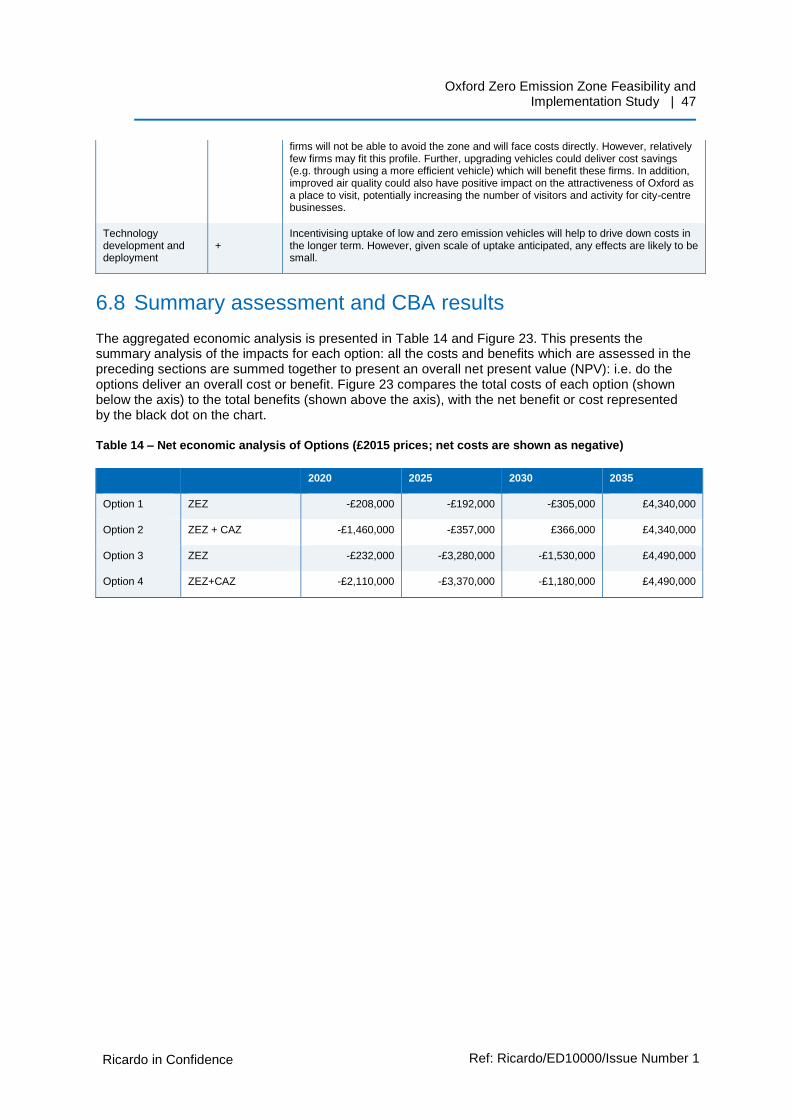
Oxford Zero Emission Zone Feasibility and Implementation Study | 47
Ricardo in Confidence Ref: Ricardo/ED10000/Issue Number 1
Ricardo Energy & Environment
firms will not be able to avoid the zone and will face costs directly. However, relatively few firms may fit this profile. Further, upgrading vehicles could deliver cost savings (e.g. through using a more efficient vehicle) which will benefit these firms. In addition, improved air quality could also have positive impact on the attractiveness of Oxford as a place to visit, potentially increasing the number of visitors and activity for city-centre businesses.
Technology development and deployment
+ Incentivising uptake of low and zero emission vehicles will help to drive down costs in the longer term. However, given scale of uptake anticipated, any effects are likely to be small.
6.8 Summary assessment and CBA results
The aggregated economic analysis is presented in Table 14 and Figure 23. This presents the summary analysis of the impacts for each option: all the costs and benefits which are assessed in the preceding sections are summed together to present an overall net present value (NPV): i.e. do the options deliver an overall cost or benefit. Figure 23 compares the total costs of each option (shown below the axis) to the total benefits (shown above the axis), with the net benefit or cost represented by the black dot on the chart.
Table 14 – Net economic analysis of Options (£2015 prices; net costs are shown as negative)
2020 2025 2030 2035
Option 1 ZEZ -£208,000 -£192,000 -£305,000 £4,340,000
Option 2 ZEZ + CAZ -£1,460,000 -£357,000 £366,000 £4,340,000
Option 3 ZEZ -£232,000 -£3,280,000 -£1,530,000 £4,490,000
Option 4 ZEZ+CAZ -£2,110,000 -£3,370,000 -£1,180,000 £4,490,000
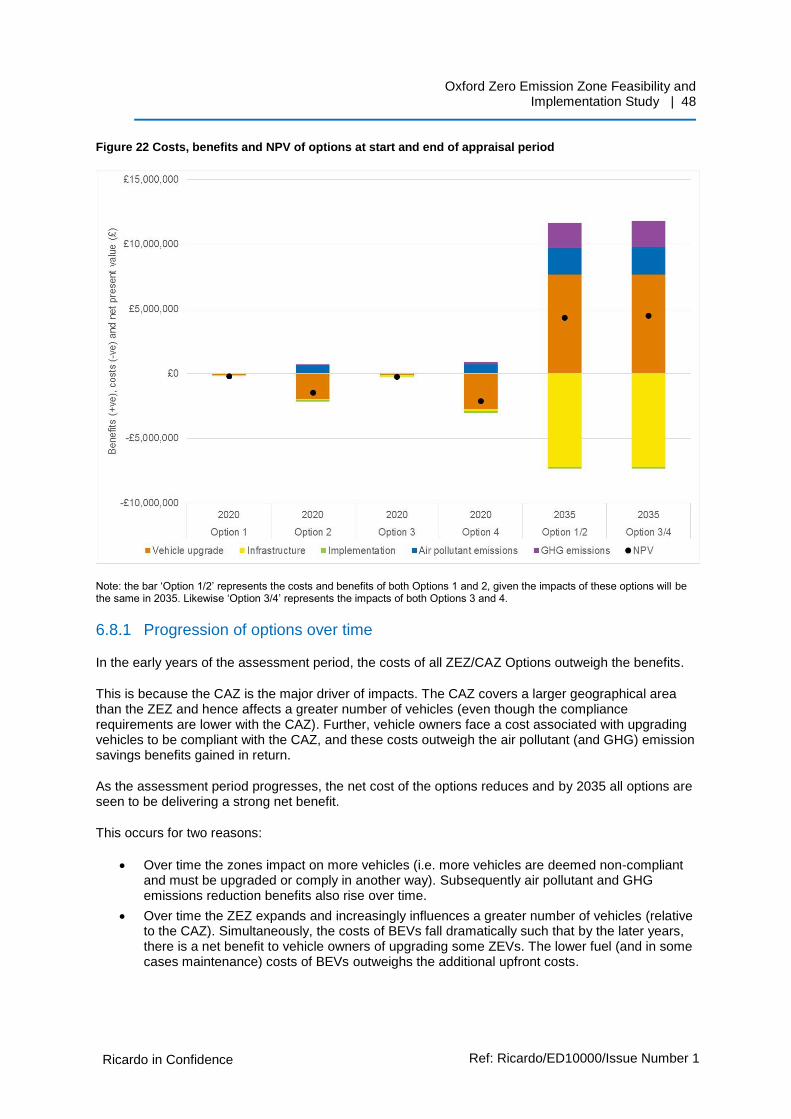
Oxford Zero Emission Zone Feasibility and Implementation Study | 48
Ricardo in Confidence Ref: Ricardo/ED10000/Issue Number 1
Ricardo Energy & Environment
Figure 22 Costs, benefits and NPV of options at start and end of appraisal period
Note: the bar ‘Option 1/2’ represents the costs and benefits of both Options 1 and 2, given the impacts of these options will be the same in 2035. Likewise ‘Option 3/4’ represents the impacts of both Options 3 and 4.
6.8.1 Progression of options over time
In the early years of the assessment period, the costs of all ZEZ/CAZ Options outweigh the benefits.
This is because the CAZ is the major driver of impacts. The CAZ covers a larger geographical area than the ZEZ and hence affects a greater number of vehicles (even though the compliance requirements are lower with the CAZ). Further, vehicle owners face a cost associated with upgrading vehicles to be compliant with the CAZ, and these costs outweigh the air pollutant (and GHG) emission savings benefits gained in return.
As the assessment period progresses, the net cost of the options reduces and by 2035 all options are seen to be delivering a strong net benefit.
This occurs for two reasons:
• Over time the zones impact on more vehicles (i.e. more vehicles are deemed non-compliant and must be upgraded or comply in another way). Subsequently air pollutant and GHG emissions reduction benefits also rise over time.
• Over time the ZEZ expands and increasingly influences a greater number of vehicles (relative to the CAZ). Simultaneously, the costs of BEVs fall dramatically such that by the later years, there is a net benefit to vehicle owners of upgrading some ZEVs. The lower fuel (and in some cases maintenance) costs of BEVs outweighs the additional upfront costs.
Oxford Zero Emission Zone Feasibility and Implementation Study | 49
Ricardo in Confidence Ref: Ricardo/ED10000/Issue Number 1
Ricardo Energy & Environment
Although the requirement for recharging infrastructure (and costs of such infrastructure) continues to rise as more vehicles upgrade to be zero emissions, the net benefits of upgrading vehicles themselves to vehicle owners, plus the emissions savings benefits outweigh these increasing costs.
Given the profile of costs and benefits over the time period assessed, all options are unlikely to deliver an overall net benefit in the short term (i.e. over the appraisal period or first 15 years of the options to 2035). However, the net benefits identified in 2035 will endure after the appraisal period25 and hence all options will eventually begin to deliver an overall net benefit over the longer term.
6.8.2 Measured expansion vs tougher boundaries
To consider the differences between a measured expansion of the zones and a more rapid expansion with tough boundaries we look here at Options 2 and 4, although considering options 1 and 3 would show a similar pattern.
Option 2 has a lower net cost in the early years relative to Option 4. The earlier geographical expansion of the ZEZ and CAZ under Option 4 results in more vehicles being affected under this option. But by 2025, the costs of ZEVs have not yet fallen sufficiently for the fuel savings to start outweighing the upfront costs of these vehicles. As such there is a net cost for vehicle owners of upgrading their vehicles to comply with both the CAZ and the ZEZ. This, combined with a greater number of vehicles requiring upgrade under Option 4 leads to higher costs, which are not outweighed by the additional emissions reductions.
As the appraisal period progresses, net costs appear to fall faster under Option 2 relative to Option 4 and Option 2 begins to deliver a net benefit in 2030, before Option 4 does in 2035.
Taking the profile of net impacts over the full-time period, both Option 2 and 4 are unlikely to deliver a cumulative net benefit until after 2035. However, given Option 4 displays a greater cost over the appraisal period, and Options 2 and 4 provide a similar net benefit in 2035: (a) Option 2 is likely to deliver a cumulative net benefit sooner post 2035 and (b) the cumulative net benefit of Option 4 will always be less than that of Option 2.
These results again reflect the timing and interaction of two trends over the appraisal period:
1. The declining costs of purchasing ZEVs over the appraisal period (and the switch from vehicle owners facing a net cost to a net benefit of upgrading to a ZEV)
2. The ramp up of the number of vehicles which need to be upgraded under each option (which is predominantly driven by their geographical scope).
A slower expansion of zones under Option 2 seems to fit better with allowing the costs of ZEVs to fall substantially first before the zones capture significant numbers of vehicles.
However, this aggregate view of costs and benefits masks a potentially important underlying trend: air pollution. Option 4 delivers greater reductions in air pollutants in the intervening years given its higher ambition and more rapid expansion. These earlier reductions may be important in the context of achieving compliance with legal limits for air pollution.
6.8.3 ZEZ options vs ZEZ+CAZ options
In the early years of the assessment (2020 and 2025) under both ‘measured expansion’ and ‘tougher boundary’ options, the CAZ seems to deliver a net cost on top of the ZEZ (comparing Option 2 with 1, and 4 with 3). The additional air pollutant and GHG emissions benefits delivered by compliance with
25 Until baseline uptake of ZEVs catches up with the scenario
Oxford Zero Emission Zone Feasibility and Implementation Study | 50
Ricardo in Confidence Ref: Ricardo/ED10000/Issue Number 1
Ricardo Energy & Environment
the CAZ do not outweigh the additional costs of upgrading vehicles (implementation costs are small and the CAZ does not have any associated infrastructure costs).
Although there will be some fuel efficiency savings associated with upgrading to a newer, conventional fuelled vehicle, (unlike with ZEVs) these savings do not outweigh the additional upfront costs of upgrading vehicles. As such compliance with the CAZ will imply a cost for vehicle owners.
By 2035, under all options the CAZ does not exist as the ZEZ has expanded to the green zone.
Given the profile of additional effects of the CAZ over the period from 2020 to 2035, it is likely that the net effect of the CAZ under Option 2 and 4 would be negative: i.e. the costs of additional compliance with the CAZ outweigh any additional benefits delivered26.
Further there is an overarching concern that introducing a CAZ may conflict with the messaging and ultimate goal of a ZEZ: a CAZ will encourage people to upgrade to low emission conventional technology, and delay the adoption of zero emission technology (and/or the vehicle owners will be incentivised to switch again shortly after upgrading to a cleaner conventional fuelled vehicle).
6.8.4 Key points from overall CBA results
• In 2035, all options deliver an overall benefit. The total benefit is equivalent to value of air pollutant and GHG emission savings as other costs/benefits cancel out
• The end point of all four options is the same, so it’s the journey that is different
• All options except Option 2 have a negative NPV till 2035
o Costs outweigh benefits in early years
o CAZ element generates significant compliance costs in early years which outweigh additional benefits
• Slower implementation generates less overall cost as vehicle market allowed time to ‘catch up’
26 This analysis is undertaken from the perspective of society as a whole: i.e. the analysis sums costs and benefits for households, businesses and public sector institutions together. As such this does not depict any distributional effects between different economic agents caused by transfer effects (e.g. the payment of CAZ charges which represent a cashflow from households and businesses to the public sector) nor any subsequent impacts of any secondary activity which may be facilitated by these transfers (e.g. reinvestment of CAZ charges in transport infrastructure).

Oxford Zero Emission Zone Feasibility and Implementation Study | 51
Ricardo in Confidence Ref: Ricardo/ED10000/Issue Number 1
Ricardo Energy & Environment
7 Implementation aspects
7.1 Legal basis and enforcement
There are two main approaches to the legal basis for a Clean Air or Zero Emission Zone:
• An access restricted zone based on vehicle standards using a traffic regulation order (TRO)
• An environmental charging scheme using road user charging powers.
In addition, there are powers that can be used to regulate buses (road traffic conditions) and taxis (taxi licencing) specifically.
7.1.1 Traffic regulations orders (TRO)
Road traffic regulation orders are typically used to regulate parking and general vehicle access restrictions such as lorry weight bans or pedestrian zones. They are the powers used to establish the current access restrictions in Oxford City Centre. The legal basis is the Road Traffic Regulations Act 1984 and this was broadened under the 1995 Environment Act to allow for access restrictions in respect to the management of air quality. The responsible transport authority is Oxfordshire County Council.
A TRO is a direct access restriction that could be used to ban vehicles not meeting specific criteria (in this case zero emission) from given streets. They can be set up like any other access restrictions to apply either 24 hours a day or at certain times of the day.
In most cases TROs are enforced as stationary vehicle offences (e.g. contraventions of parking restrictions) by the local authority.
For a small ZEZ (such as the red and orange boundaries) TROs would represent a simplified approach to enforcement which would take place only with respect to stationary vehicles, such as those which are parked, loading/unloading or waiting. However, as the zone boundary expands this strategy is likely to be less effective and enforcement against moving vehicles using ANPR is likely to be needed.
Current enforcement of TROs as a moving vehicle offence is only permissible by the police. However, there is provision in the Traffic Management Act 2004 (Part 6) for civil enforcement of traffic contraventions including moving vehicle offences. That said, it is not clear from initial investigation if these powers have been fully enacted allowing local authorities to enforce using ANPR. Therefore, further discussions with DfT would be needed to clarify the powers available to enforce a TRO based ZEZ.
7.1.2 Road use based (environmental) charging
Local authorities have the power in the Transport Act 2000 to introduce road use based charging schemes. Such schemes can have variable charges related to the environmental performance of the vehicle. This is the current approach being used for the London LEZ and proposed Ultra-Low Emission Zone. Furthermore, this is what is set out in the Government’s framework for Clean Air Zones as the basis of for a CAZ charging scheme.
In this case the legislation provides for the charging to be carried out via ANPR, and so the moving vehicle enforcement issue does not arise. The operation of the charging would be expected to be carried out with ANPR to identify and charge vehicles as appropriate. In respect to a charging scheme, enforcement is related to non-payment of charges rather than access to the zone itself, and
Oxford Zero Emission Zone Feasibility and Implementation Study | 52
Ricardo in Confidence Ref: Ricardo/ED10000/Issue Number 1
Ricardo Energy & Environment
the local authority has the powers to issue fixed penalty notices in this case. This removes the issue of moving vehicle enforcement which potentially arises with the use of a TRO.
If this approach is taken, the scheme is not a strict access restriction rather a charge for vehicles that do not comply with the standard set. In this regard, there could be some political sensitivities in relation to the scheme being a charging scheme. However, the County Council is looking at other charging schemes such as the Workplace Parking Levy and congestion charging under which the charging principle is already being considered.
Again, the transport authority, Oxfordshire County Council, would be the responsible body for implementing a charging scheme.
7.1.3 Alternative or complementary approaches
There are two potential alternatives that could be considered.
The first is the use of ‘traffic regulation conditions’ that can be used to specify conditions on local bus operations and are enforced through the Traffic Commissioner. This is the basis of the current bus LEZ in Oxford. An approach could be taken to strength the LEZ to a Euro VI standard and the ZEV standard to implement a ZEZ for buses. However, this strategy could not be used for other vehicles.
The second mechanism is the use of taxi licensing to set standards for taxis. This power sits with the City Council. This would cover all the taxis licensed by the City Council but would not cover all taxis operating in the city as they can be licensed by another authority and still operate in the city. As such this is more of a complementary measure in respect of using age standards to encourage more rapid renewal of the taxi fleet.
7.1.4 Recommendations
Further discussion with DfT would realistically be needed to clarify some of the issues above. However, a potential route to establishing the ZEZ and related CAZ is suggested as follows:
• The ZEZ – is implemented as part of the package of city centre access restrictions based on a TRO. Enforcement is carried out in line with the existing TRO based access restrictions initially and discussions are held with DfT about use of ANPR as the scheme expands to the green boundary under which more vehicles are covered.
• The CAZ – this can be implemented using road use based charging powers. Again, any CAZ scheme should be considered in relation to wider ongoing discussions on charging schemes (such as the Workplace Parking Levy) to ensure consistency and compatibility.
Since some 75% of emissions in the orange zone and over 50% of emissions in the green zone are bus related, a potentially simpler alternative approach to a CAZ with similar impact would be to strengthen the existing bus LEZ to a Euro VI standard.
7.2 Supporting measures and incentives
One of the key principles of a ZEZ is that it should not just be a ‘stick’ but there should be a range of incentives and supporting measures to assist compliance with the scheme. A wide range of such measures were generated and discussed through the stakeholder workshops and engagement activities. A summary of the key measures arising from this activity that should be considered alongside the ZEZ and CAZ are set out in Table 15 below.

Oxford Zero Emission Zone Feasibility and Implementation Study | 53
Ricardo in Confidence Ref: Ricardo/ED10000/Issue Number 1
Ricardo Energy & Environment
Table 15 - Supporting measures and incentives by vehicle type and year
2020 2025 2030/35
Bus
Supporting measures Queen Street closed to buses, so buses are removed from Red zone
Work with bus operator on implementation of ZEV buses and supporting infrastructure on key routes.
Potential adjustment of bus stops and routes to ensure ZEV buses in ZEZ
City centre ZEV bus loop service
Re-location of bus station outside ZEZ
Taxi
Supporting measures
Work on available charging infrastructure
Taxi age limit to 10 years, ZEV for new vehicle applications. Agree equal standards with neighbouring authorities.
Explore grants for ZEV taxis
All new taxi applications Zero emission capable. Agree equal standards with neighbouring authorities.
All taxi licenced taxis zero emission capable. Agree equal standards with neighbouring authorities.
Incentives ZEV only taxi ranks in city centre
Public sector taxi contracts for Zero emission capable taxis only.
Vans
Supporting measures
Delivery and Servicing Plans promoted to encourage ZEV van deliveries.
Develop charging infrastructure
Local parcel consolidation centre with ZEV final delivery
Integrated parcel and freight consolidation centre with ZEV final delivery.
Incentives ZEV only loading areas
HGVs
Supporting measures
Delivery and Servicing Plans to encourage ZEV deliveries.
Develop charging infrastructure
Integrated parcel and freight consolidation centre with ZEV final delivery.
Incentives ZEV only loading areas
Cars

Oxford Zero Emission Zone Feasibility and Implementation Study | 54
Ricardo in Confidence Ref: Ricardo/ED10000/Issue Number 1
Ricardo Energy & Environment
2020 2025 2030/35
Supporting measures
Develop charging infrastructure
EV car club
Incentives Free EV parking EV only parking in some city centre areas
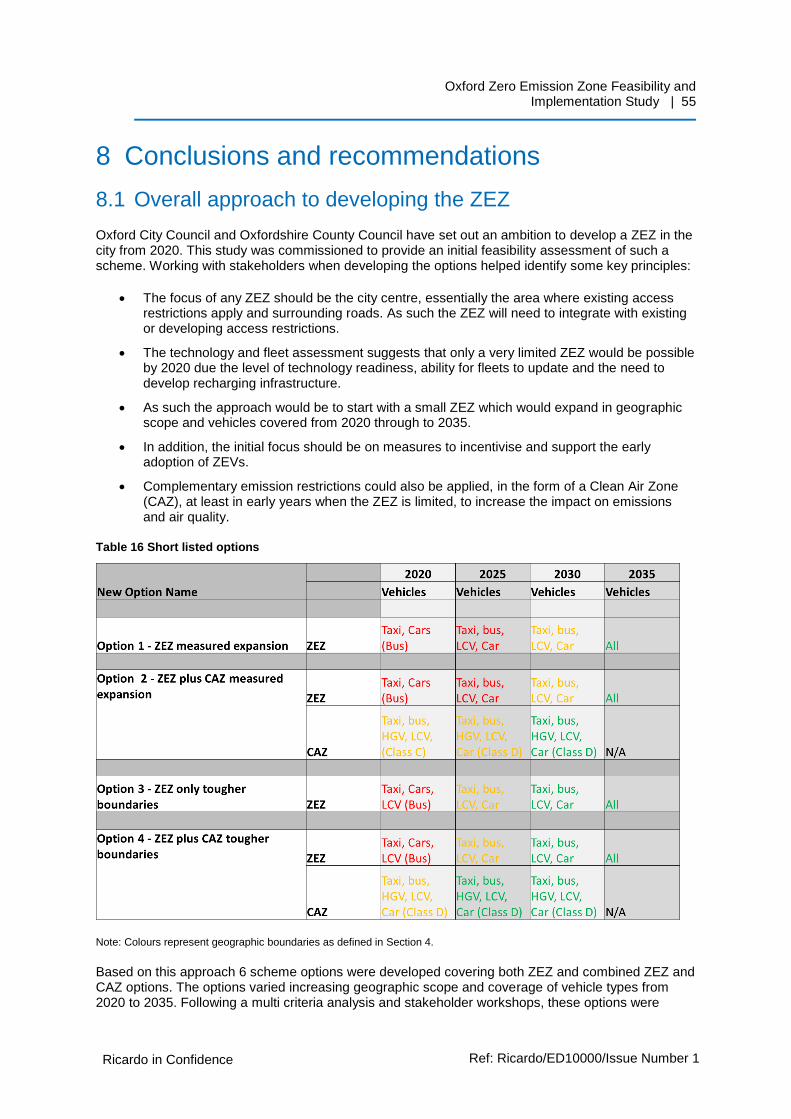
Oxford Zero Emission Zone Feasibility and Implementation Study | 55
Ricardo in Confidence Ref: Ricardo/ED10000/Issue Number 1
Ricardo Energy & Environment
8 Conclusions and recommendations
8.1 Overall approach to developing the ZEZ
Oxford City Council and Oxfordshire County Council have set out an ambition to develop a ZEZ in the city from 2020. This study was commissioned to provide an initial feasibility assessment of such a scheme. Working with stakeholders when developing the options helped identify some key principles:
• The focus of any ZEZ should be the city centre, essentially the area where existing access restrictions apply and surrounding roads. As such the ZEZ will need to integrate with existing or developing access restrictions.
• The technology and fleet assessment suggests that only a very limited ZEZ would be possible by 2020 due the level of technology readiness, ability for fleets to update and the need to develop recharging infrastructure.
• As such the approach would be to start with a small ZEZ which would expand in geographic scope and vehicles covered from 2020 through to 2035.
• In addition, the initial focus should be on measures to incentivise and support the early adoption of ZEVs.
• Complementary emission restrictions could also be applied, in the form of a Clean Air Zone (CAZ), at least in early years when the ZEZ is limited, to increase the impact on emissions and air quality.
Table 16 Short listed options
Note: Colours represent geographic boundaries as defined in Section 4.
Based on this approach 6 scheme options were developed covering both ZEZ and combined ZEZ and CAZ options. The options varied increasing geographic scope and coverage of vehicle types from 2020 to 2035. Following a multi criteria analysis and stakeholder workshops, these options were

Oxford Zero Emission Zone Feasibility and Implementation Study | 56
Ricardo in Confidence Ref: Ricardo/ED10000/Issue Number 1
Ricardo Energy & Environment
reduced to 4 shortlisted options, shown below, that were assessed in the emissions, air quality and economic assessments.
8.2 Emissions and air quality results
The end point for all proposed options is the same – a ZEZ for the whole city centre for all vehicle types – with the different options presenting different routes to achieving this.
Options 1 and 3 are ZEZ-only options, with Options 2 and 4 complementing a ZEZ with a CAZ. Further Options 3 and 4 offer more rapid geographical expansion of the zones than Options 1 and 2.
Overall the key benefit of the options compared to the business as usual (BAU) situation is in relation to NOx emissions, and consequently NO2 concentrations:
• The BAU results, with no scheme, show a significant drop of NOx emissions by around 50% (depending on the zone) by 2035 through the natural evolution of the fleet.
• All options assessed have the same end point in 2035 with a full ZEZ with 100% reduction in NOx emissions in the city centre. The knock-on effect of this across the city as a whole is a 16% reduction in emissions compared to BAU.
• To have any significant impact in 2020 a CAZ (or similar emission based restriction) will be needed to complement the ZEZ, as the impact of the ZEZ is limited due to its limited scope in 2020.
• The benefit of the ZEZ alone becomes significant for Options 3 and 4 in 2025 but not until 2030 for Options 1 and 2.
• For Option 4 the benefit of the additional CAZ rapidly reduces from 2025 as the ZEZ expands.
• Overall Option 4 with the ZEZ plus the CAZ provides the largest reduction in emissions over the period with the CAZ providing an early impact.
PM benefits are much more limited. This is due to PM exhaust emission benefits from vehicle technology having already been largely achieved and because EVs will still contribute to tyre, brake and road dust particulates which by 2025 will account for 95% of particulate emissions.
The NOx emission results feed through into the NO2 concentration results. In terms of NO2 compliance the follow key points can be made:
• The expected emission reductions under the BAU scenario suggest two locations, St Clements and High Street, will remain above the limit value in 2020 with a further 6 locations potentially at risk of exceeding the limit value.
• The St Clement site looks to remain at or above the limit value in 2025, but by 2030 all sites should be complaint.
• The ZEZ only options (1 and 3) will not improve compliance in 2020, due to these limited scale, but including a CAZ (Options 2 and 4) will largely remove these compliance issues.
• All options essentially remove any compliance issues from 2025 onwards.
8.3 Economic assessment
The four main findings from the economic analysis can be summarised as follows:
1. A ZEZ or a ZEZ+CAZ scheme will eventually yield an overall benefit, but will be costly in the short term
Oxford Zero Emission Zone Feasibility and Implementation Study | 57
Ricardo in Confidence Ref: Ricardo/ED10000/Issue Number 1
Ricardo Energy & Environment
In the early years of the assessment period, the costs of all ZEZ/CAZ options outweigh the benefits. But by 2035, all options begin to deliver a strong net benefit. This occurs as (a) the zones and the number of vehicles they affect expands, increasing the air pollutant and GHG emissions reduction benefits and (b) the costs of ZEVs falls dramatically (relative to the cost of conventional vehicles which continues to rise) such that in 2030/2035 there is a net benefit of upgrading some ZEV vehicles. With a longer-term perspective, a ZEZ scheme appears to be a good idea.
2. A slower, more measured expansion of the zones appears to be a better option
The end point of the options is the same, which means that the difference is in the transition to the end point. The more measured expansion options have a smaller net cost in the interim years. This reflects the timing and interaction of two trends: (a) The declining costs of purchasing ZEVs over the appraisal period and (b) The ramp up of the number of vehicles which need to be upgraded under each option (which is predominantly driven by the geographical coverage of the zones). A slower expansion seems to fit better with allowing the costs of ZEVs to fall substantially first before the zones capture significant numbers of vehicles.
3. The benefits of implementing a CAZ alongside a ZEZ do not appear to outweigh the costs
In the early years of the assessment (2020 and 2025), the CAZ delivers a net cost on top of the ZEZ. The additional air pollutant and GHG emissions benefits delivered do not outweigh the additional costs of upgrading vehicles. However, the emissions modelling summarised above underlines that only those options including a CAZ allow legal limits for air pollution to be met. Taking these two results together suggests that further action on top of a ZEZ is required to meet legal limits (given a ZEZ can only feasibly deliver emissions reductions in later years). But a CAZ may be a relatively blunt policy instrument and other policies may deliver more targeted, cost-effective achievement of legal limits, either by focusing on key vehicle types or the specific areas of concern.
E.g. an alternative to the full CAZ would be an extension of the existing bus LEZ from a Euro V scheme to a Euro VI scheme. Since bus emissions are 50% or more of total transport emissions in the city centre, this would generate a large part of the benefit of the CAZ, but could be seen as unfairly penalising public transport. At present, the bus fleet is relatively modern: no vehicles are older than about 7 years and the whole fleet meets the Euro V standard or better, with 38% at Euro VI. Discussions with the bus companies suggest that by 2020 more than 60% of the fleet would already meet the Euro VI standard.
4. The economic analysis is sensitive to the assumptions made
Several simplifying assumptions were required to facilitate the economic analysis to which the results will be sensitive:
• The working assumption on the number of unique vehicles travelling to each boundary zone
• Behavioural response assumptions to the implementation of the zones.
• Battery electric being the ZEV technology of choice across all vehicle types.
• Assumption that one conventional fuelled vehicle can be replaced directly by one ZEV.
• Lifetime of BEVs is assumed to be the same as a conventional fuelled equivalent.
8.4 Implementation issues
The suggested legal basis for the scheme is as follows:
• The ZEZ is likely to be best implemented as a TRO as part of a combined package with the existing access restriction in the city centre, although enforcement of the TRO as a moving vehicle offence would need to be explored further.

Oxford Zero Emission Zone Feasibility and Implementation Study | 58
Ricardo in Confidence Ref: Ricardo/ED10000/Issue Number 1
Ricardo Energy & Environment
• For consistency with national guidance, any CAZ should be implemented through road user charging powers and an environmental charging scheme. Such a charging scheme would also need to be assessed alongside other potential charging schemes that the council is considering.
In all cases the County Council, as the Transport authority, would need to take the lead role in implementing the scheme.
Alongside the formal ZEZ and CAZ scheme options a wide range of ideas for potential supporting measures and incentives were generated through the engagement work of the project. Supporting measures have not been assessed in any detail in this initial feasibility study. Putting together an integrated a package of incentives and supporting measures alongside the ZEZ could be presented as a ‘Zero Emission Strategy’ and are likely to be crucial to the acceptance and success of any scheme.
8.5 Conclusions and further work
The results of this study provide a complex picture in terms of the options assessed. However, the key findings can be summarised as follows:
• The end point of a comprehensive city centre ZEZ in 2035 generates both air quality and economic benefits, and so should be seen as the direction of travel. The question then remains which of the options provide the best route to this end point? Here the answer is less clear.
• Assessment of the emissions and air quality benefits of the scheme options suggest that a more rapid development of a ZEZ scheme and including the CAZ will ensure compliance of the NO2 limit values by 2020 and generate the greatest emissions benefit.
• However, the economic assessment suggests that the greater costs, particularly to business in terms of complying with a scheme, of rapid implementation and of combining a ZEZ with a CAZ outweigh the benefits. This promotes a more measured approach, potentially without a CAZ.
This then becomes a political and strategic decision as to which route to take: either generate maximum air quality benefit, despite the costs, or try to take a more balanced approach to the costs and benefits.
It also raises the question as to whether introducing a CAZ alongside the ZEZ is the most effective way of generating additional air quality benefits in the early years while the ZEZ is developing. Could there be other measures that would be less economically burdensome for road users? For example, expand the bus LEZ to a Euro VI standard as noted above or the wider access restrictions and charging schemes that are being consider by the council.
So, in terms of taking the idea for a ZEZ forward the following next steps and potential further work are recommended:
• Consider the concept of the ZEZ (and CAZ) in the light of other ongoing work in relation to:
o The review of access restrictions in the city centre;
o Options being considered for charging schemes in the city;
o The future of the bus LEZ;
o An update of the city centre strategy.
• Carry out more detailed consideration and assessment of the supporting measures and incentives both as part of a ZEZ/CAZ scheme and potentially independently as measures to promote low and zero emission vehicles to develop an overall all ‘Zero emission strategy’

Oxford Zero Emission Zone Feasibility and Implementation Study | 59
Ricardo in Confidence Ref: Ricardo/ED10000/Issue Number 1
Ricardo Energy & Environment
• Improvements to the evidence base and assessment work including:
o Updated traffic data such as count data or ANPR data to get a more accurate understanding of the movement of vehicles in the zones affected and the number of vehicles potentially affected.
o Further exploring the practical details and costs of implementing zero-emission alternatives of each mode working closely with key stakeholders, including consideration of aggregate infrastructure requirements across the city.

Oxford Zero Emission Zone Feasibility and Implementation Study
Ricardo in Confidence Ref: Ricardo/ED10000/Issue Number 1
Ricardo Energy & Environment
Appendices
Appendix 1: Further details on emissions and air quality modelling methodology
Appendix 2: Further details on cost benefit analysis methodology
Appendix 3: Relationship between original option names and new names used in this report
Appendix 4: Supporting tables for vkm and NOx emissions
Appendix 5: Glossary

Oxford Zero Emission Zone Feasibility and Implementation Study
Ricardo in Confidence Ref: Ricardo/ED10000/Issue Number 1
Ricardo Energy & Environment
A Appendix 1 – Further details on emissions and air quality modelling
A.1.1 Overview
The emissions and air quality modelling was carried out to cover the whole city area, but with a focus on road traffic on the main urban roads. The model has been set up to provide emission estimates for five spot years: 2015 as the base year; and 2020, 2025, 2030 and 2035 as forecast years. Estimates are provided for both the baseline business as usual scenario (BAU) and each of the modelled scheme options. All the geospatial modelling is done using the ArcGIS software.
The process of modelling can be group into three basic steps:
1. Collation of the relevant traffic data;
2. Estimation of the emissions from the traffic data;
3. Dispersion modelling to provide the actual pollutant concentration levels.
The emissions and dispersion modelling are carried out with tools developed by Ricardo Energy & Environment, namely the pyCOPERT emissions calculation system and the RapidAir dispersion modelling system. Further detail on each of these steps is provided below.
A.1.2 Traffic data
NOx emissions have been calculated in the baseline and mitigation scenarios using the best traffic activity data available at the city scale. This comprised local traffic counts provided by the Oxfordshire County Council and national traffic data from the Department of Transport. Data was collated for the key road links in the city as shown in figure A1.1 for a base year of 2015.
The model is set up to simulate five spot years: 2015, 2020, 2025, 2030 and 2035. To obtain the traffic data for the future baselines, the growth factors have been applied to convert 2015 traffic data to future years. The growth factors have been calculated using TEMPRO 7.1 and are shown in Table A1.1 below.
In addition to the traffic flow data information on the fleet fuel and Euro characteristics were collated from various sources as follows:
1. Bus fleet data was provided by the main bus operator Stagecoach and Oxford Bus Company
2. Taxi data was available from a report on the taxi fleet in Oxford carried out by EST27
3. Cars, vans and HGVs were assumed to reflect the national fleet mix taken from the National Atmospheric Emission Inventory (NAEI).
27 ‘ULEV Taxi Scheme – feasibility study for Oxford City Council’, Energy Saving Trust, March 2016
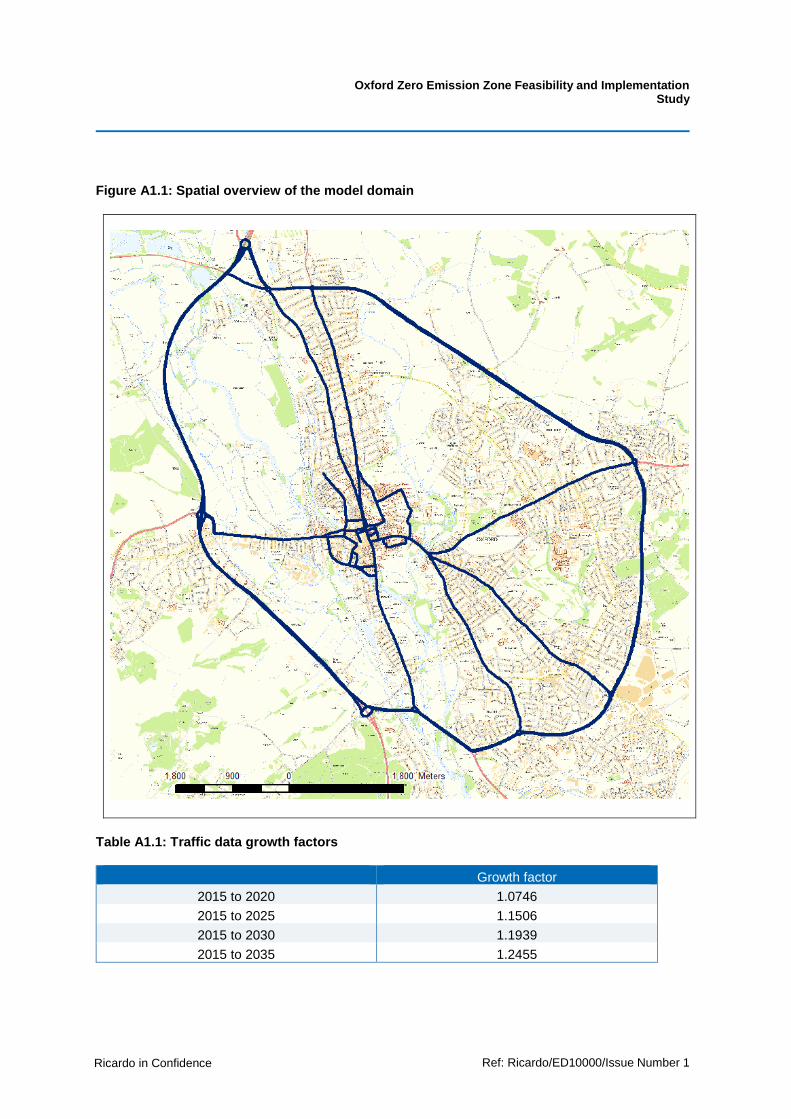
Oxford Zero Emission Zone Feasibility and Implementation Study
Ricardo in Confidence Ref: Ricardo/ED10000/Issue Number 1
Ricardo Energy & Environment
Figure A1.1: Spatial overview of the model domain
Table A1.1: Traffic data growth factors
Growth factor
2015 to 2020 1.0746
2015 to 2025 1.1506
2015 to 2030 1.1939
2015 to 2035 1.2455
Oxford Zero Emission Zone Feasibility and Implementation Study
Ricardo in Confidence Ref: Ricardo/ED10000/Issue Number 1
Ricardo Energy & Environment
A.1.3 Emissions modelling
The traffic and fleet data provides the basis of the road transport emissions modelling. This data is combined with the latest COPERT 5 emissions factors in the pyCOPERT tool. COPERT is a European database of emission factors which is recommended for the quantification of road-transport emissions and is the basis of DEFRA’s Emission Factor Tool Kit.
The emission factors also require an estimate of vehicle speed for each road link which we are modelling. This has been estimated by categorising the roads according to their type and setting (urban, rural etc.) and assigning default speeds to broad vehicle classes using local traffic master speed data.
The pyCOPERT model then uses these data to create a spatially disaggregated road traffic emissions inventory which was then used to feed our city-wide dispersion model.
A.1.4 Dispersion modelling
The dispersion modelling is carried out in the RapidAir dispersion modelling system using the emissions inventory developed as described above and national background concentration maps.
A.1.4.1 RapidAir
RapidAir is an urban air quality dispersion model developed by Ricardo Energy & Environment focusing on road traffic emissions. It is based on a GIS platform that we can adapt to any urban environment in order to evaluate the ground level concentrations of air pollutants arising from road traffic emissions.
RapidAir has been developed to provide graphic and numerical outputs which are comparable with other models used widely in the United Kingdom. In recent years, RapidAir has been used to model road traffic pollution in UK studies (e.g. London City, Southampton, Brent Council, Pert and Kinross) and internationally at the mega city scale in Riyadh, Saudi Arabia and Jinan in China. The model has hence been applied at scales ranging from a few tens to a few hundred km.
Whilst the dispersion model has been developed as a proprietary solution by Ricardo, RapidAir is based on the USEPA AERMOD model. The advantage of our approach is the coupling of a tried and tested pollution model with a novel GIS method which significantly speeds up the analysis.
The approach we have developed is based on loose-coupling of three elements:
• Road traffic emissions model conducted using fleet specific COPERT V algorithms to prepare grams/kilometre/second emission rates of NOx in the pyCOPERT model as described above;
• AERMOD dispersion model for development of “kernels” at resolutions ranging from 1m to 125m
• The kernel based RapidAir model running in ArcGIS to prepare dispersion fields of concentration for further analysis with a set of decision support tools coded by us in Python/arcpy.
A.1.4.2 Modelled NOx to NO2 conversion method
NOx chemistry is treated as a post processing step in the RapidAir model. Total NOx (i.e. modelled road NOx plus representative background) has been converted to Total NO2 using the polynomial function in Equation 1 below.

Oxford Zero Emission Zone Feasibility and Implementation Study
Ricardo in Confidence Ref: Ricardo/ED10000/Issue Number 1
Ricardo Energy & Environment
The conversion equation was derived by passing Oxford Council’s 2015 NO2 measurements through the Defra NOx:NO2 calculator commonly used for LAQM purposes28. We derived a simple function by expressing Total NO2 as a function of Total NOx. The relationship between the two is almost linear though we have used the polynomial fit as this is still reasonably easy to represent in the modelling code while having an excellent R2 value of 1.
Equation 1:
𝑇𝑜𝑡𝑎𝑙 𝑁𝑂2 = −0.00087 ×𝑇𝑜𝑡𝑎𝑙 𝑁𝑂𝑥2 + 0.551323 ×𝑇𝑜𝑡𝑎𝑙 𝑁𝑂𝑥 + 5.376196
The plot in Figure A1.2 shows the resulting NOx:NO2 conversion curve derived by applying Equation 1 to total NOx predicted by the model.
Figure A1.2: NOx to NO2 conversion curve (both axes in µg.m-3)
A.1.4.3 Background concentrations
Background pollutant concentrations are provided by Defra on their website29. The background mapping data provides estimates of annual mean background concentrations of key pollutants at a resolution of 1 x 1 km for the UK projected from a base year of 2013. Below is a map of NOx background concentrations.
28 https://laqm.defra.gov.uk/review-and-assessment/tools/background-maps.html#NOxNO2calc 29 https://laqm.defra.gov.uk/review-and-assessment/tools/background-maps.html

Oxford Zero Emission Zone Feasibility and Implementation Study
Ricardo in Confidence Ref: Ricardo/ED10000/Issue Number 1
Ricardo Energy & Environment
Figure A1.3: Background map for NOx
A.1.5 Model verification and uncertainty
Once the base year model has been developed it is then verified against monitoring data and adjusted to ensure best fit. Any adjustment factors are then applied to all future modelled years. Model verification is carried out by comparing the modelled road NOx concentrations against the monitored road NOx concentrations. The monitored road NOx concentrations are calculated using the monitored NO2, converting this to NOx using the Defra’s NOx to NO2 convertor and taking away the background NOx to provide an estimate of monitored road NOx. The comparison between measured and modelled road NOx for the initial unadjusted model is shown below in Figure A1.4.

Oxford Zero Emission Zone Feasibility and Implementation Study
Ricardo in Confidence Ref: Ricardo/ED10000/Issue Number 1
Ricardo Energy & Environment
Figure A1.4: Initial comparison of measured and modelled road NOx
The comparison showed that the model was generally under predicting road NOx by about 50% and had an R2 of 0.49. A review of the worst performing locations led to updating some of the model parameter’s such as canyon characteristics, vehicles speeds and so on to try and improve model performance at monitoring locations. The updated model results are shown in Figure A.1.5 below. The updated model still showed under prediction of NOx but this had reduced to about 40% and the R2 had improved to 0.63.
The verification results are then used to adjust the updated model to give a final model for the base year and future years. The adjustment is done by fitting line through the data of the form Y = mX (as shown by the dotted blue line in the plot) where m is then the adjustment factor applied to modelled NOx data to provide a best fit model with the monitoring locations. The results from the adjusted NOx model and conversion to NO2 are shown in Figure A.1.6 and A1.7.
The results now provide a more 1 to 1 relationship with the monitored data although with some spread. The root mean squared error (RMSE) on the NO2 data is 6.2 and is a measure of the average error in the model, i.e. the results are + or – 6.2 µgm-3. This allows us to put an uncertainty range on future results when comparing with the compliance limit values. This is illustrated in Figure A.1.8 which shows the BAU results for 2020. From this we can see that two locations are exceeding the limit value with a further 5 locations at risk of exceeding within the model uncertainty.
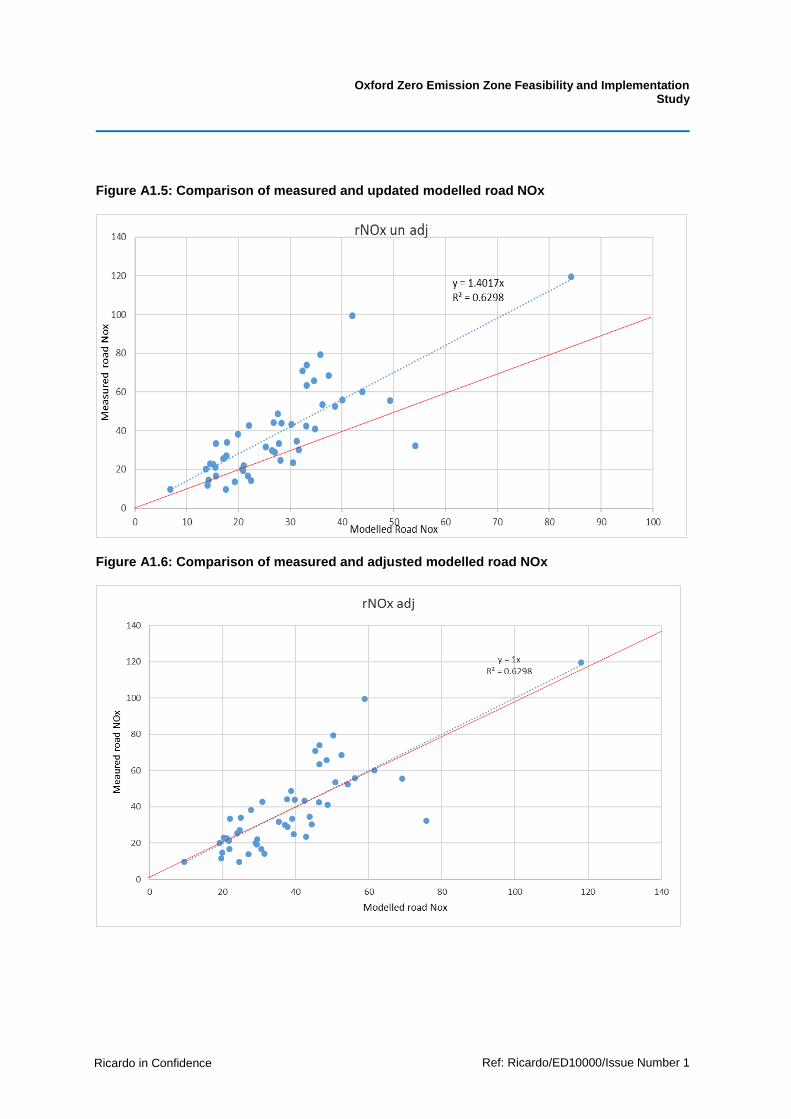
Oxford Zero Emission Zone Feasibility and Implementation Study
Ricardo in Confidence Ref: Ricardo/ED10000/Issue Number 1
Ricardo Energy & Environment
Figure A1.5: Comparison of measured and updated modelled road NOx
Figure A1.6: Comparison of measured and adjusted modelled road NOx
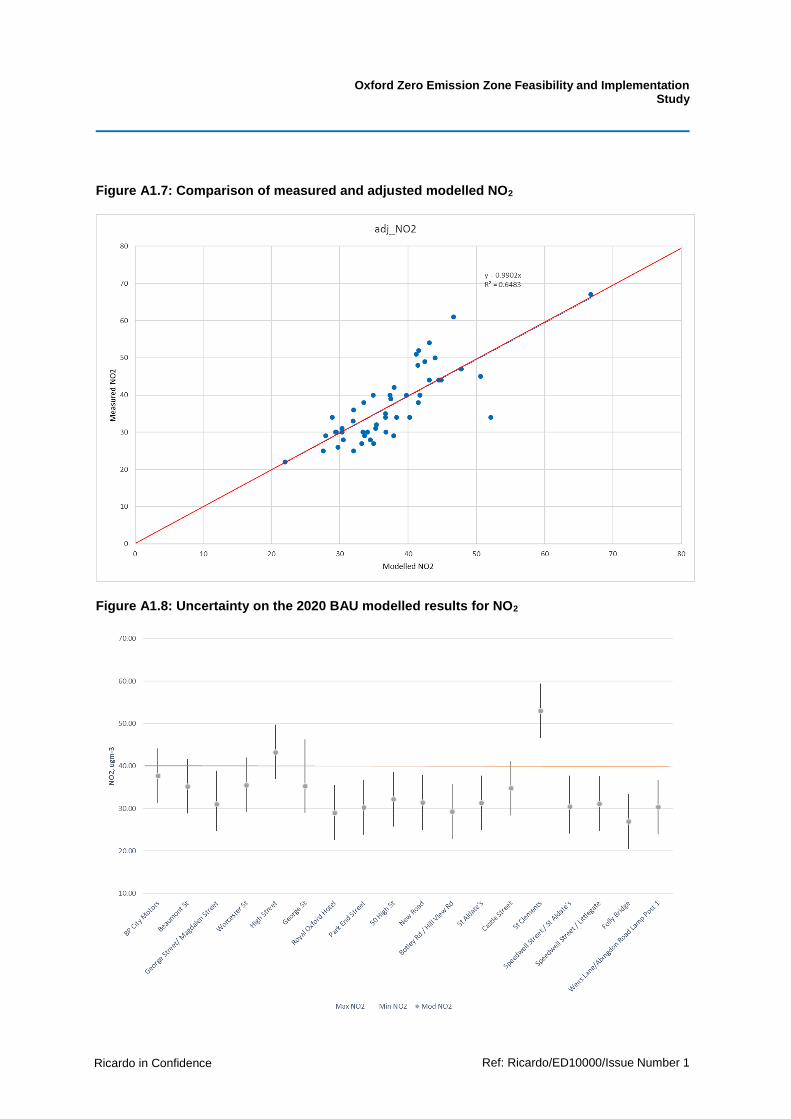
Oxford Zero Emission Zone Feasibility and Implementation Study
Ricardo in Confidence Ref: Ricardo/ED10000/Issue Number 1
Ricardo Energy & Environment
Figure A1.7: Comparison of measured and adjusted modelled NO2
Figure A1.8: Uncertainty on the 2020 BAU modelled results for NO2
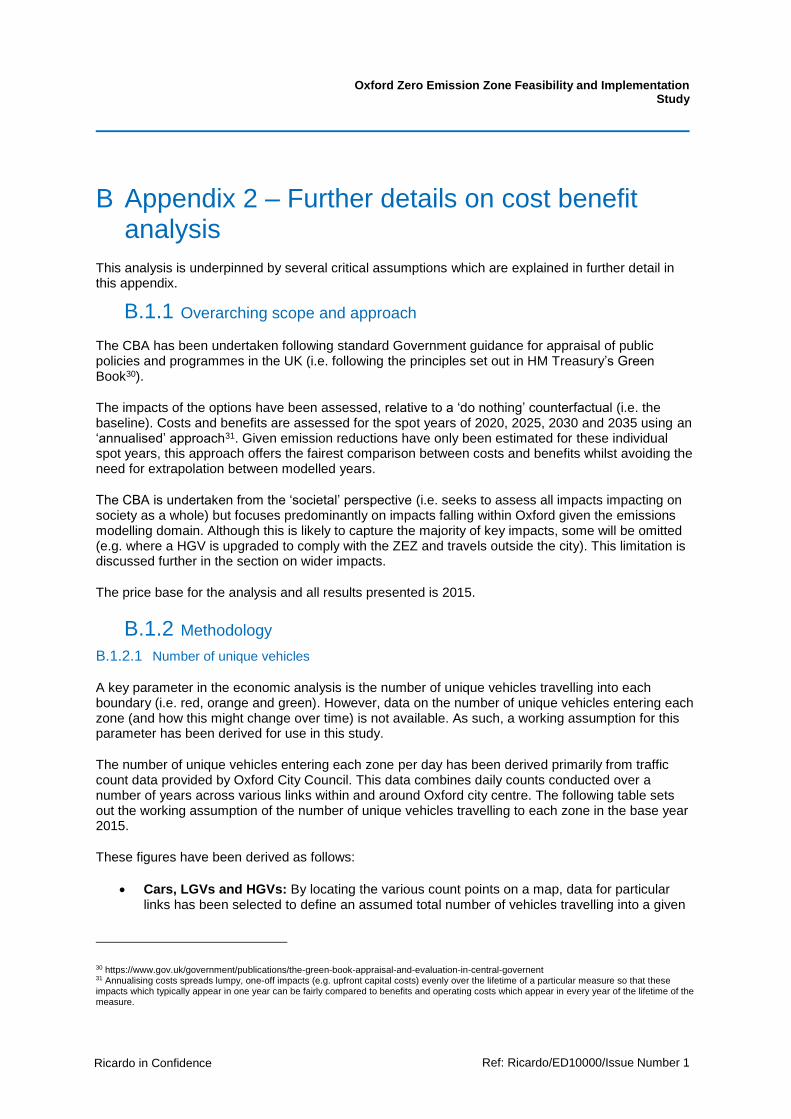
Oxford Zero Emission Zone Feasibility and Implementation Study
Ricardo in Confidence Ref: Ricardo/ED10000/Issue Number 1
Ricardo Energy & Environment
B Appendix 2 – Further details on cost benefit analysis
This analysis is underpinned by several critical assumptions which are explained in further detail in this appendix.
B.1.1 Overarching scope and approach
The CBA has been undertaken following standard Government guidance for appraisal of public policies and programmes in the UK (i.e. following the principles set out in HM Treasury’s Green Book30).
The impacts of the options have been assessed, relative to a ‘do nothing’ counterfactual (i.e. the baseline). Costs and benefits are assessed for the spot years of 2020, 2025, 2030 and 2035 using an ‘annualised’ approach31. Given emission reductions have only been estimated for these individual spot years, this approach offers the fairest comparison between costs and benefits whilst avoiding the need for extrapolation between modelled years.
The CBA is undertaken from the ‘societal’ perspective (i.e. seeks to assess all impacts impacting on society as a whole) but focuses predominantly on impacts falling within Oxford given the emissions modelling domain. Although this is likely to capture the majority of key impacts, some will be omitted (e.g. where a HGV is upgraded to comply with the ZEZ and travels outside the city). This limitation is discussed further in the section on wider impacts.
The price base for the analysis and all results presented is 2015.
B.1.2 Methodology
B.1.2.1 Number of unique vehicles
A key parameter in the economic analysis is the number of unique vehicles travelling into each boundary (i.e. red, orange and green). However, data on the number of unique vehicles entering each zone (and how this might change over time) is not available. As such, a working assumption for this parameter has been derived for use in this study.
The number of unique vehicles entering each zone per day has been derived primarily from traffic count data provided by Oxford City Council. This data combines daily counts conducted over a number of years across various links within and around Oxford city centre. The following table sets out the working assumption of the number of unique vehicles travelling to each zone in the base year 2015.
These figures have been derived as follows:
• Cars, LGVs and HGVs: By locating the various count points on a map, data for particular links has been selected to define an assumed total number of vehicles travelling into a given
30 https://www.gov.uk/government/publications/the-green-book-appraisal-and-evaluation-in-central-governent 31 Annualising costs spreads lumpy, one-off impacts (e.g. upfront capital costs) evenly over the lifetime of a particular measure so that these impacts which typically appear in one year can be fairly compared to benefits and operating costs which appear in every year of the lifetime of the measure.
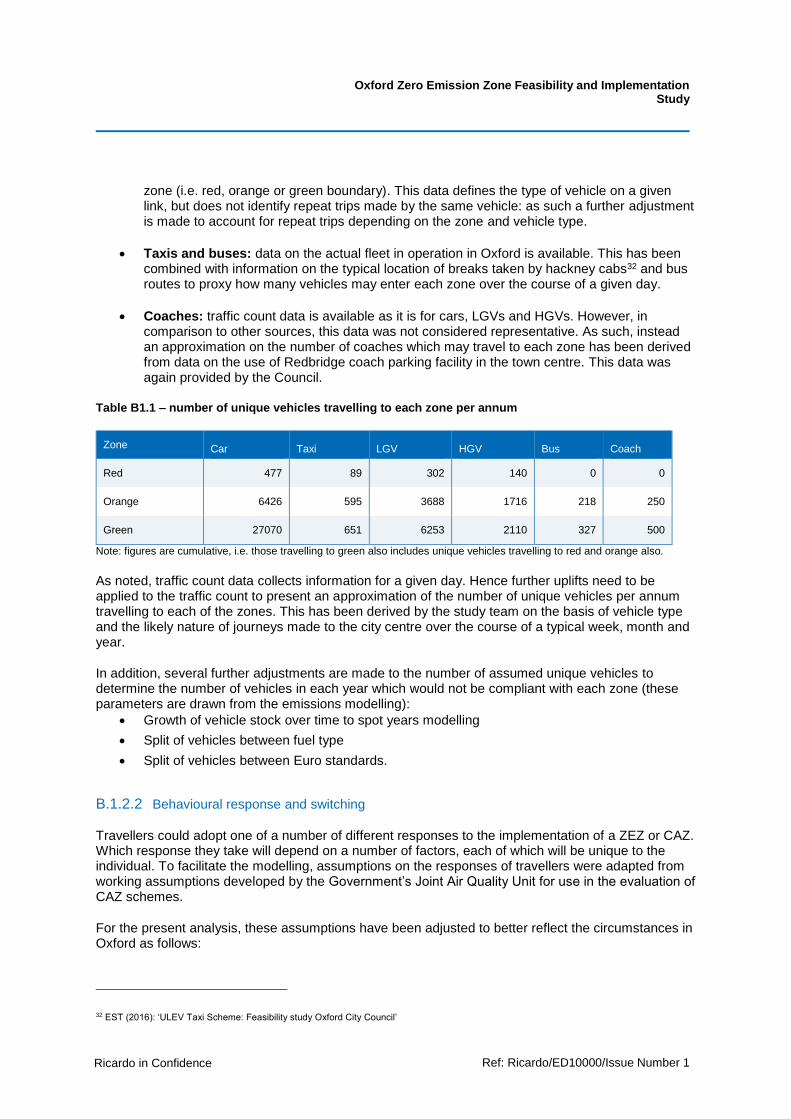
Oxford Zero Emission Zone Feasibility and Implementation Study
Ricardo in Confidence Ref: Ricardo/ED10000/Issue Number 1
Ricardo Energy & Environment
zone (i.e. red, orange or green boundary). This data defines the type of vehicle on a given link, but does not identify repeat trips made by the same vehicle: as such a further adjustment is made to account for repeat trips depending on the zone and vehicle type.
• Taxis and buses: data on the actual fleet in operation in Oxford is available. This has been combined with information on the typical location of breaks taken by hackney cabs32 and bus routes to proxy how many vehicles may enter each zone over the course of a given day.
• Coaches: traffic count data is available as it is for cars, LGVs and HGVs. However, in comparison to other sources, this data was not considered representative. As such, instead an approximation on the number of coaches which may travel to each zone has been derived from data on the use of Redbridge coach parking facility in the town centre. This data was again provided by the Council.
Table B1.1 – number of unique vehicles travelling to each zone per annum
Zone Car Taxi LGV HGV Bus Coach
Red 477 89 302 140 0 0
Orange 6426 595 3688 1716 218 250
Green 27070 651 6253 2110 327 500
Note: figures are cumulative, i.e. those travelling to green also includes unique vehicles travelling to red and orange also.
As noted, traffic count data collects information for a given day. Hence further uplifts need to be applied to the traffic count to present an approximation of the number of unique vehicles per annum travelling to each of the zones. This has been derived by the study team on the basis of vehicle type and the likely nature of journeys made to the city centre over the course of a typical week, month and year.
In addition, several further adjustments are made to the number of assumed unique vehicles to determine the number of vehicles in each year which would not be compliant with each zone (these parameters are drawn from the emissions modelling):
• Growth of vehicle stock over time to spot years modelling
• Split of vehicles between fuel type
• Split of vehicles between Euro standards.
B.1.2.2 Behavioural response and switching
Travellers could adopt one of a number of different responses to the implementation of a ZEZ or CAZ. Which response they take will depend on a number of factors, each of which will be unique to the individual. To facilitate the modelling, assumptions on the responses of travellers were adapted from working assumptions developed by the Government’s Joint Air Quality Unit for use in the evaluation of CAZ schemes.
For the present analysis, these assumptions have been adjusted to better reflect the circumstances in Oxford as follows:
32 EST (2016): ‘ULEV Taxi Scheme: Feasibility study Oxford City Council’
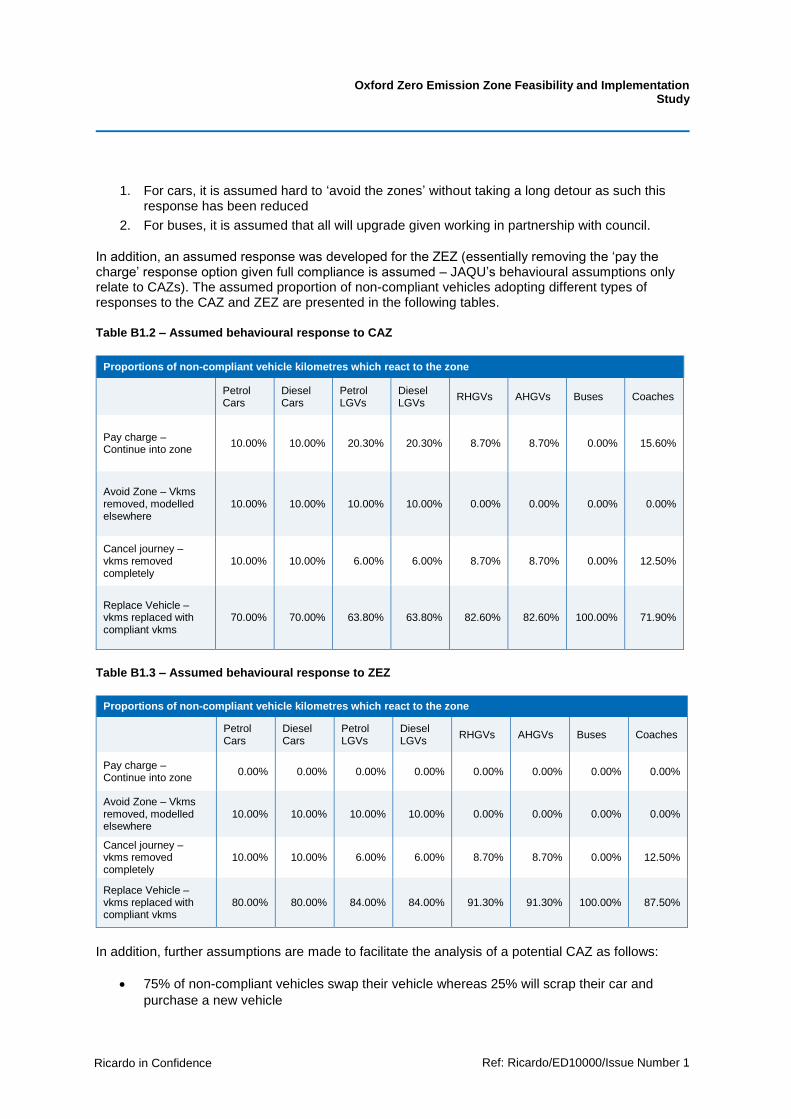
Oxford Zero Emission Zone Feasibility and Implementation Study
Ricardo in Confidence Ref: Ricardo/ED10000/Issue Number 1
Ricardo Energy & Environment
1. For cars, it is assumed hard to ‘avoid the zones’ without taking a long detour as such this response has been reduced
2. For buses, it is assumed that all will upgrade given working in partnership with council.
In addition, an assumed response was developed for the ZEZ (essentially removing the ‘pay the charge’ response option given full compliance is assumed – JAQU’s behavioural assumptions only relate to CAZs). The assumed proportion of non-compliant vehicles adopting different types of responses to the CAZ and ZEZ are presented in the following tables.
Table B1.2 – Assumed behavioural response to CAZ
Proportions of non-compliant vehicle kilometres which react to the zone
Petrol Cars
Diesel Cars
Petrol LGVs
Diesel LGVs
RHGVs AHGVs Buses Coaches
Pay charge – Continue into zone
10.00% 10.00% 20.30% 20.30% 8.70% 8.70% 0.00% 15.60%
Avoid Zone – Vkms removed, modelled elsewhere
10.00% 10.00% 10.00% 10.00% 0.00% 0.00% 0.00% 0.00%
Cancel journey – vkms removed completely
10.00% 10.00% 6.00% 6.00% 8.70% 8.70% 0.00% 12.50%
Replace Vehicle – vkms replaced with compliant vkms
70.00% 70.00% 63.80% 63.80% 82.60% 82.60% 100.00% 71.90%
Table B1.3 – Assumed behavioural response to ZEZ
Proportions of non-compliant vehicle kilometres which react to the zone
Petrol Cars
Diesel Cars
Petrol LGVs
Diesel LGVs
RHGVs AHGVs Buses Coaches
Pay charge – Continue into zone
0.00% 0.00% 0.00% 0.00% 0.00% 0.00% 0.00% 0.00%
Avoid Zone – Vkms removed, modelled elsewhere
10.00% 10.00% 10.00% 10.00% 0.00% 0.00% 0.00% 0.00%
Cancel journey – vkms removed completely
10.00% 10.00% 6.00% 6.00% 8.70% 8.70% 0.00% 12.50%
Replace Vehicle – vkms replaced with compliant vkms
80.00% 80.00% 84.00% 84.00% 91.30% 91.30% 100.00% 87.50%
In addition, further assumptions are made to facilitate the analysis of a potential CAZ as follows:
• 75% of non-compliant vehicles swap their vehicle whereas 25% will scrap their car and
purchase a new vehicle

Oxford Zero Emission Zone Feasibility and Implementation Study
Ricardo in Confidence Ref: Ricardo/ED10000/Issue Number 1
Ricardo Energy & Environment
• Of those diesel cars which are swapped: 75% of swapped for a compliant petrol car and 25%
for a compliant diesel car.
• Those who swap their vehicle will swap their vehicle with the cheapest compliant vehicle of
the relevant vehicle type.
o This is apart from Euro 5 diesel cars upgrading to petrol which will swap to the
equivalent standard of petrol as we assume no one within the zone upgrades to a
lower euro standard.
• All business activity is replaced: Therefore only cancelled journeys made by private
consumers will be lost because cancelled business journeys are assumed to be replaced with
new business journeys.
For the ZEZ, it is simply assumed that all vehicles upgrade to battery electric vehicles, given this is typically the lowest cost option. In practice a range of alternatives may be available with different costs and impacts and the choice of alternative will be based on a range of factors, including feasibility and appropriateness of alternatives.
B.1.2.3 Technology costs
The model only includes the additional costs of operating a compliant over a non-compliant vehicle: e.g. in the case of a ZEV, the additional capital costs of the ZEV over a conventional fuelled vehicle is combined with savings in operating and fuel costs to produce a relative cost estimate.
For each vehicle type we have collected and analysed the costs of purchasing and operating zero-emission, new conventional and used conventional vehicles. A key source for the capex and opex costs of new ZEV and conventional vehicles was a study by Ricardo33. Data on the cost of used cars was drawn from Parkers online database34.
For the ZEZ and CAZ an assumption is made regarding the vehicle standard purchased to ensure compliance, and the type of non-compliant vehicle displaced:
• ZEZ: For simplicity, all ZEVs adopted are assumed to be BEVs. The costs of these vehicles is compared to the purchase of a new conventional fuelled Euro 6 / VI vehicle reflecting the most common conventional fuelled vehicle in the fleet
• CAZ: 75% of non-compliant vehicle owners are assumed to switch from a Euro 3 petrol or Euro 5 / V diesel to the cheapest compliant vehicle, which in the early years of the assessment period is assumed to be either a used Euro 4 petrol or used Euro 6 / VI diesel vehicle. The remaining 25% of non-compliant vehicle owners are assumed to scrap these vehicles in favour of a new, compliant vehicle.
As the assessment period progresses, the age, costs and availability of used vehicles from different Euro standards is adjusted in the assumptions around the switching behaviour of vehicle owners.
B.1.2.4 Air quality effects
Air pollution has a range of associated detrimental impacts, including on human health and the natural and built environments. To be able to capture these impacts in CBA and understand their magnitude,
33 Ricardo study for TfL (2014): ‘Environmental Support to the Development of a London Low Emission Vehicle Roadmap’ (unpublished) 34 http://www.parkers.co.uk/
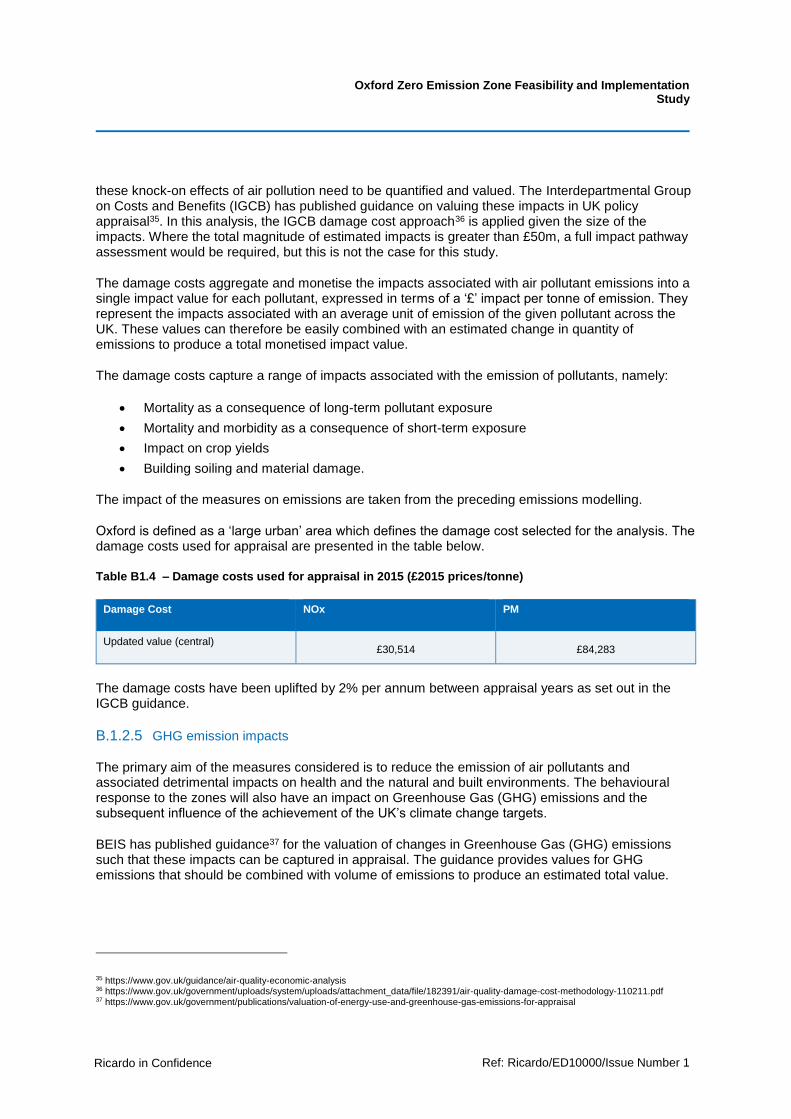
Oxford Zero Emission Zone Feasibility and Implementation Study
Ricardo in Confidence Ref: Ricardo/ED10000/Issue Number 1
Ricardo Energy & Environment
these knock-on effects of air pollution need to be quantified and valued. The Interdepartmental Group on Costs and Benefits (IGCB) has published guidance on valuing these impacts in UK policy appraisal35. In this analysis, the IGCB damage cost approach36 is applied given the size of the impacts. Where the total magnitude of estimated impacts is greater than £50m, a full impact pathway assessment would be required, but this is not the case for this study.
The damage costs aggregate and monetise the impacts associated with air pollutant emissions into a single impact value for each pollutant, expressed in terms of a ‘£’ impact per tonne of emission. They represent the impacts associated with an average unit of emission of the given pollutant across the UK. These values can therefore be easily combined with an estimated change in quantity of emissions to produce a total monetised impact value.
The damage costs capture a range of impacts associated with the emission of pollutants, namely:
• Mortality as a consequence of long-term pollutant exposure
• Mortality and morbidity as a consequence of short-term exposure
• Impact on crop yields
• Building soiling and material damage.
The impact of the measures on emissions are taken from the preceding emissions modelling.
Oxford is defined as a ‘large urban’ area which defines the damage cost selected for the analysis. The damage costs used for appraisal are presented in the table below.
Table B1.4 – Damage costs used for appraisal in 2015 (£2015 prices/tonne)
Damage Cost NOx PM
Updated value (central) £30,514 £84,283
The damage costs have been uplifted by 2% per annum between appraisal years as set out in the IGCB guidance.
B.1.2.5 GHG emission impacts
The primary aim of the measures considered is to reduce the emission of air pollutants and associated detrimental impacts on health and the natural and built environments. The behavioural response to the zones will also have an impact on Greenhouse Gas (GHG) emissions and the subsequent influence of the achievement of the UK’s climate change targets.
BEIS has published guidance37 for the valuation of changes in Greenhouse Gas (GHG) emissions such that these impacts can be captured in appraisal. The guidance provides values for GHG emissions that should be combined with volume of emissions to produce an estimated total value.
35 https://www.gov.uk/guidance/air-quality-economic-analysis 36 https://www.gov.uk/government/uploads/system/uploads/attachment_data/file/182391/air-quality-damage-cost-methodology-110211.pdf 37 https://www.gov.uk/government/publications/valuation-of-energy-use-and-greenhouse-gas-emissions-for-appraisal
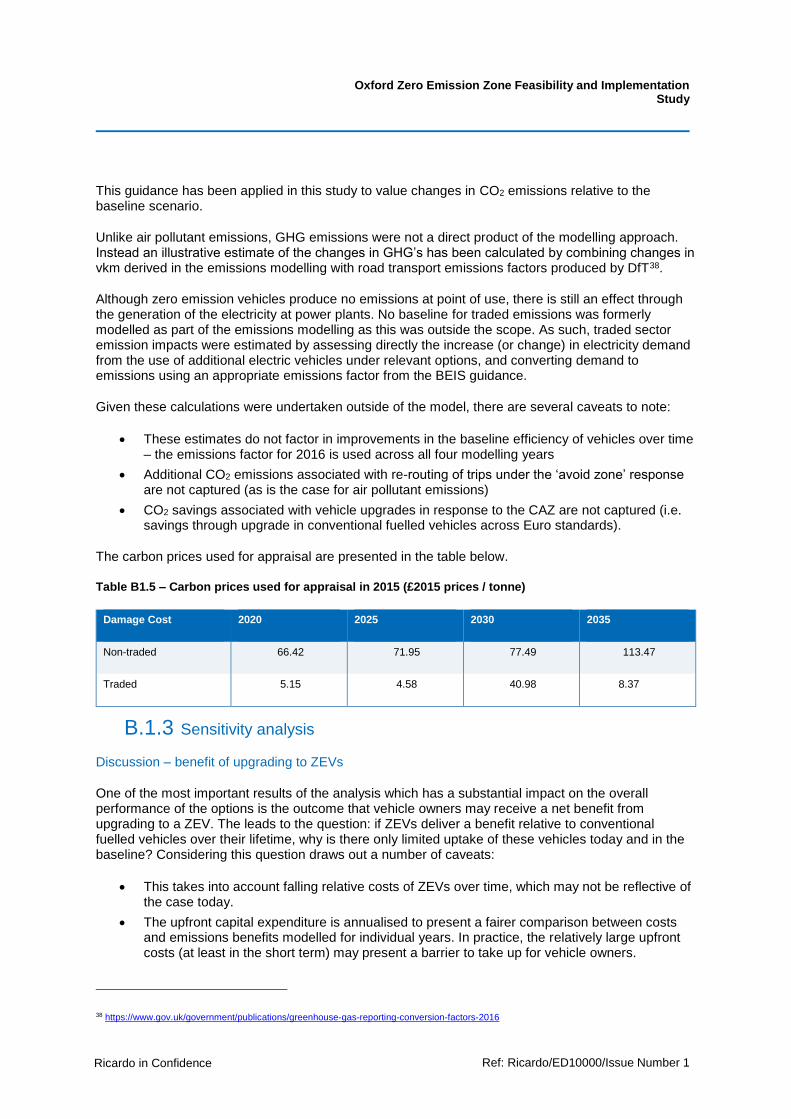
Oxford Zero Emission Zone Feasibility and Implementation Study
Ricardo in Confidence Ref: Ricardo/ED10000/Issue Number 1
Ricardo Energy & Environment
This guidance has been applied in this study to value changes in CO2 emissions relative to the baseline scenario.
Unlike air pollutant emissions, GHG emissions were not a direct product of the modelling approach. Instead an illustrative estimate of the changes in GHG’s has been calculated by combining changes in vkm derived in the emissions modelling with road transport emissions factors produced by DfT38.
Although zero emission vehicles produce no emissions at point of use, there is still an effect through the generation of the electricity at power plants. No baseline for traded emissions was formerly modelled as part of the emissions modelling as this was outside the scope. As such, traded sector emission impacts were estimated by assessing directly the increase (or change) in electricity demand from the use of additional electric vehicles under relevant options, and converting demand to emissions using an appropriate emissions factor from the BEIS guidance.
Given these calculations were undertaken outside of the model, there are several caveats to note:
• These estimates do not factor in improvements in the baseline efficiency of vehicles over time – the emissions factor for 2016 is used across all four modelling years
• Additional CO2 emissions associated with re-routing of trips under the ‘avoid zone’ response are not captured (as is the case for air pollutant emissions)
• CO2 savings associated with vehicle upgrades in response to the CAZ are not captured (i.e. savings through upgrade in conventional fuelled vehicles across Euro standards).
The carbon prices used for appraisal are presented in the table below.
Table B1.5 – Carbon prices used for appraisal in 2015 (£2015 prices / tonne)
Damage Cost 2020 2025 2030 2035
Non-traded 66.42 71.95 77.49 113.47
Traded 5.15 4.58 40.98 8.37
B.1.3 Sensitivity analysis
Discussion – benefit of upgrading to ZEVs
One of the most important results of the analysis which has a substantial impact on the overall performance of the options is the outcome that vehicle owners may receive a net benefit from upgrading to a ZEV. The leads to the question: if ZEVs deliver a benefit relative to conventional fuelled vehicles over their lifetime, why is there only limited uptake of these vehicles today and in the baseline? Considering this question draws out a number of caveats:
• This takes into account falling relative costs of ZEVs over time, which may not be reflective of the case today.
• The upfront capital expenditure is annualised to present a fairer comparison between costs and emissions benefits modelled for individual years. In practice, the relatively large upfront costs (at least in the short term) may present a barrier to take up for vehicle owners.
38 https://www.gov.uk/government/publications/greenhouse-gas-reporting-conversion-factors-2016
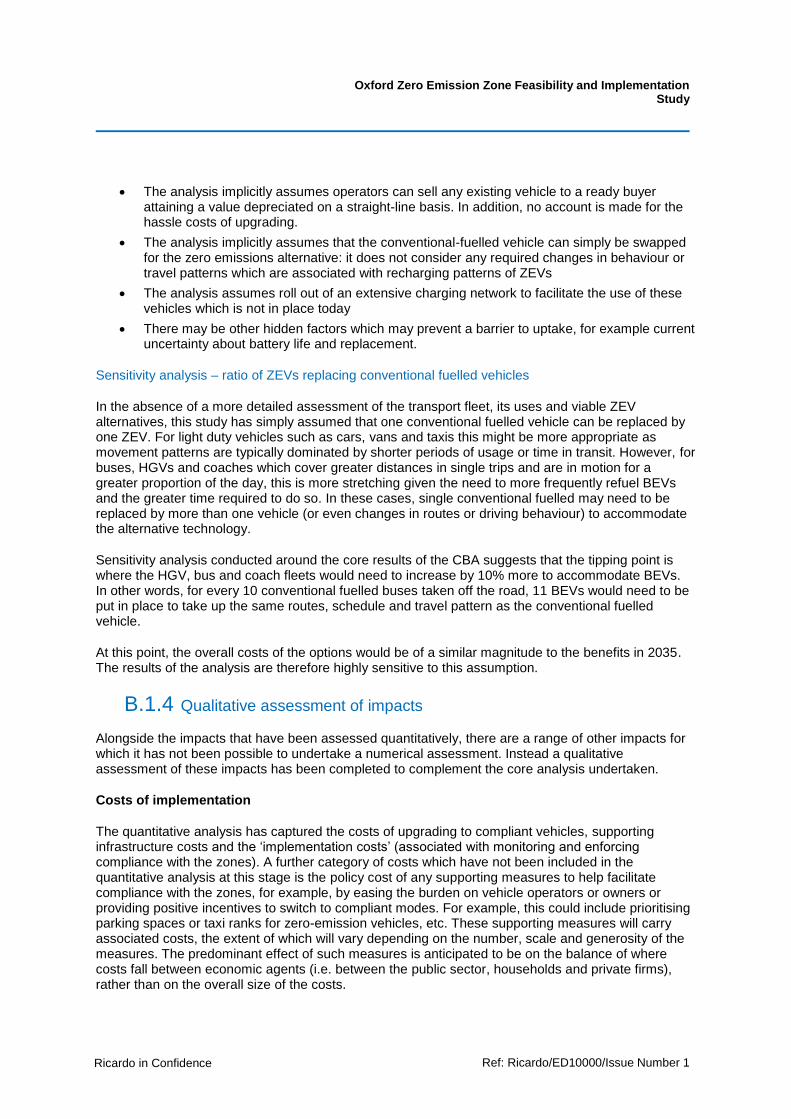
Oxford Zero Emission Zone Feasibility and Implementation Study
Ricardo in Confidence Ref: Ricardo/ED10000/Issue Number 1
Ricardo Energy & Environment
• The analysis implicitly assumes operators can sell any existing vehicle to a ready buyer attaining a value depreciated on a straight-line basis. In addition, no account is made for the hassle costs of upgrading.
• The analysis implicitly assumes that the conventional-fuelled vehicle can simply be swapped for the zero emissions alternative: it does not consider any required changes in behaviour or travel patterns which are associated with recharging patterns of ZEVs
• The analysis assumes roll out of an extensive charging network to facilitate the use of these vehicles which is not in place today
• There may be other hidden factors which may prevent a barrier to uptake, for example current uncertainty about battery life and replacement.
Sensitivity analysis – ratio of ZEVs replacing conventional fuelled vehicles
In the absence of a more detailed assessment of the transport fleet, its uses and viable ZEV alternatives, this study has simply assumed that one conventional fuelled vehicle can be replaced by one ZEV. For light duty vehicles such as cars, vans and taxis this might be more appropriate as movement patterns are typically dominated by shorter periods of usage or time in transit. However, for buses, HGVs and coaches which cover greater distances in single trips and are in motion for a greater proportion of the day, this is more stretching given the need to more frequently refuel BEVs and the greater time required to do so. In these cases, single conventional fuelled may need to be replaced by more than one vehicle (or even changes in routes or driving behaviour) to accommodate the alternative technology.
Sensitivity analysis conducted around the core results of the CBA suggests that the tipping point is where the HGV, bus and coach fleets would need to increase by 10% more to accommodate BEVs. In other words, for every 10 conventional fuelled buses taken off the road, 11 BEVs would need to be put in place to take up the same routes, schedule and travel pattern as the conventional fuelled vehicle.
At this point, the overall costs of the options would be of a similar magnitude to the benefits in 2035. The results of the analysis are therefore highly sensitive to this assumption.
B.1.4 Qualitative assessment of impacts
Alongside the impacts that have been assessed quantitatively, there are a range of other impacts for which it has not been possible to undertake a numerical assessment. Instead a qualitative assessment of these impacts has been completed to complement the core analysis undertaken.
Costs of implementation
The quantitative analysis has captured the costs of upgrading to compliant vehicles, supporting infrastructure costs and the ‘implementation costs’ (associated with monitoring and enforcing compliance with the zones). A further category of costs which have not been included in the quantitative analysis at this stage is the policy cost of any supporting measures to help facilitate compliance with the zones, for example, by easing the burden on vehicle operators or owners or providing positive incentives to switch to compliant modes. For example, this could include prioritising parking spaces or taxi ranks for zero-emission vehicles, etc. These supporting measures will carry associated costs, the extent of which will vary depending on the number, scale and generosity of the measures. The predominant effect of such measures is anticipated to be on the balance of where costs fall between economic agents (i.e. between the public sector, households and private firms), rather than on the overall size of the costs.

Oxford Zero Emission Zone Feasibility and Implementation Study
Ricardo in Confidence Ref: Ricardo/ED10000/Issue Number 1
Ricardo Energy & Environment
Loss of asset value
Where a ZEZ and a CAZ drive accelerated turnover of the vehicle fleet, this could feasibly reduce the value of older, non-compliant vehicles. Users will demand vehicles which are compliant with zone restrictions, reducing demand for non-compliant vehicles. That said, in this case the zones will only affect a proportion of vehicles travelling in the wider Oxfordshire county area (i.e. not all vehicles in the local area need to travel to the zones). Further, given the market for vehicles (in particular second hand vehicles) operates on a national scale, and only a handful of cities are considering introducing zonal restrictions of this type, it is envisaged that any such ‘cost’ to non-compliant vehicle owners would be small.
Emissions impacts outside the modelling domain
The analysis of emission savings was limited to impacts within Oxford given the scope of the underlying emissions modelling. However, the response to the ZEZ and CAZ could deliver emissions benefits outside this area. For example, zero or low emission vehicles purchased to comply with zones could travel outside this area. This is particularly the case for cars, and to a greater extent HGVs and coaches, which may only undertake a small proportion of their mileage within the city limits. This applies less to the buses and taxis measures which are likely to do the vast proportion of their mileage within the city limits. In addition, trips which are cancelled or completed instead by a different mode may also start outside the zone.
Emissions impact of avoiding zone
One response to the implementation of the ZEZ and CAZ is to ‘avoid’ and travel around the zones on surrounding routes. Although the emissions benefit of the avoided travel in the zone has been captured, the subsequent impact on additional emissions outside the zone associated with this behaviour has not been captured in the analysis. It has not been possible to capture these additional emissions as part of the analysis as detailed traffic modelling tracking the alternative routes taken was not within the scope of this study.
That said, where traffic can follow more free-flowing surrounding routes rather than congested city centre links, any additional emissions and fuel consumption could be assumed to be lower than the savings achieved in the zone. Further, the ‘avoid’ response is assumed to be taken by only 10% of non-compliant vehicles, of which a proportion may mode-switch to a compliant alternative such as travelling by foot, bike or bus with no additional emissions effect.
Travel time and congestion
Where measures increase or reduce road traffic, this will have an impact on congestion. This in turn, affects total time spent travelling, which subsequently impacts on the time available to people to undertake productive activity or leisure, both of which have a value. Where the behavioural response is:
• to avoid the zone, this could increase travel time for the individual and congestion on surrounding routes, but could deliver reductions in congestion within the zones.
• mode switch to for example bus or bike, this could deliver an increase in travel time for the individual but perhaps a reduction in congestion and travel time more generally.
• cancelled journey, this delivers a time savings for both the individual and other commuters through reduced traffic on the roads.
The size of the benefit is limited by the fact that the majority of non-compliant vehicles either upgrade or simply pay the charge, both of which imply no impact on congestion.

Oxford Zero Emission Zone Feasibility and Implementation Study
Ricardo in Confidence Ref: Ricardo/ED10000/Issue Number 1
Ricardo Energy & Environment
Noise
Noise from road traffic can have an effect on health, wellbeing, productivity and the natural environment39. As in the case of air pollution, these subsequent impacts have a cost. Where new, LEV technology reduces noise relative to the technology it replaces, this reduction will deliver an additional benefit associated with these measures. The impacts on noise will in part be influenced by the detail of supporting measures to the zone: e.g. if time restrictions were relaxed on freight delivery and movements allowed out of hours this could increase noise at quiet times.
Affordability for and impacts on local business
The measures considered in the study could impact on local businesses, on both the demand and supply side, and in both positive and negative ways. For example, where businesses are required to upgrade fleet and purchase new LEVs (or undertake retro-fits to existing vehicles), this places an additional cost on businesses who will be forced to retire vehicles early. This could have an impact on the ongoing viability of businesses where these costs are large. This cost is included in the core quantitative analysis in the costs of upgrading vehicles, however any knock-on effect to the number of businesses operating has not.
That said, the most vulnerable will be smaller businesses operating vehicle fleets in Oxford centre: larger (in particular nationwide) firms have a larger base over which to spread costs and many local businesses may not operate vehicles, or may do so through third parties (e.g. in terms of deliveries). As such businesses may only face a fraction of the costs of upgrading vehicles where delivery firms spread these costs over all their customer base. Further, where these new vehicles consume less fuel, this will provide an operating cost saving to businesses. What is not captured is any distributional effects beneath the aggregated effects which impact on the viability of individual companies.
On the demand side, improvements in air quality generally, upgrades to buses and the PR benefit to local businesses of undertaking environmental measures may all serve to improve the attractiveness of Oxford and the city centre as a place to visit, bringing in additional custom for local businesses.
Affordability for individuals
Similar to the impacts for businesses, individual households may also be anticipated to incur a proportion of the costs of complying with the ZEZ and the CAZ. Households will be particularly affected where restrictions are placed on private car travel, and also (but to a lesser extent) through measures placed on LGVs (there is mixed ownership between businesses and individuals which will spread costs) and on buses, HGVs and coaches (who have a wider customer base over which costs can be spread).
In addition, the spread of costs will not be even: costs will predominantly fall on those households who operate non-compliant vehicles. Households operating compliant vehicle will not have to incur costs. Although strategies are taken to mitigate the costs of upgrading vehicles (e.g. avoiding zone, mode shift), where it is the case the older, non-compliant vehicles are owned and operated by lower income households, the zones could place a greater burden on these households.
In practice, the balance of costs will critically depend on the supporting measures: given there is no detail as yet on what these could be, it is not possible to draw definitive conclusions on affordability for households.
39 https://www.gov.uk/guidance/noise-pollution-economic-analysis
Oxford Zero Emission Zone Feasibility and Implementation Study
Ricardo in Confidence Ref: Ricardo/ED10000/Issue Number 1
Ricardo Energy & Environment
Non air-pollution related health impacts
Compliance with the zones can have two positive impacts on health:
• A reduction in traffic directly reduces the risk of road traffic accidents
• Where users switch to active travel modes such as bike or foot, this has positive exercise benefits.
Technology development and deployment
The deployment of new and innovative technology helps to drive down the costs of this technology in the long-run, as feedback loops improve product design and costs are shared across a wider population base. In this case, the deployment of LEVs in Oxford will serve to help this cause. However, given the scale of deployment any impact on the over-arching cost of LEVs is likely to be small.
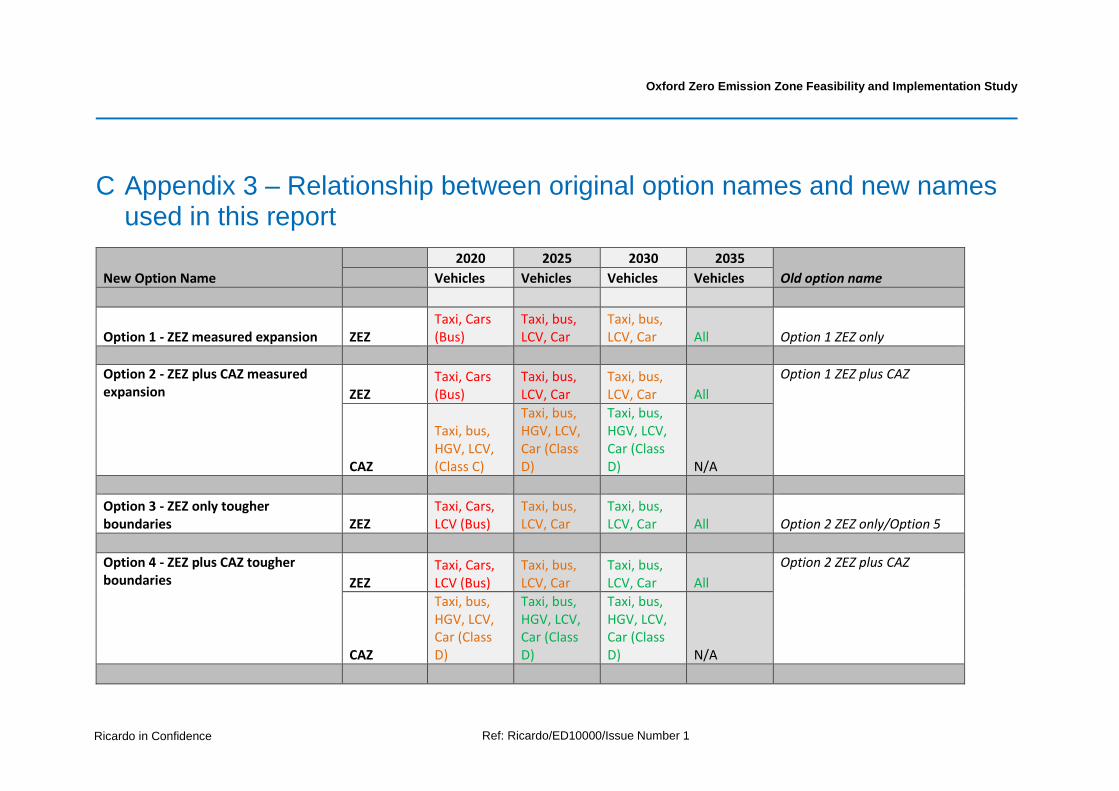
Oxford Zero Emission Zone Feasibility and Implementation Study
Ricardo in Confidence Ref: Ricardo/ED10000/Issue Number 1
Ricardo Energy & Environment
C Appendix 3 – Relationship between original option names and new names used in this report
New Option Name
2020 2025 2030 2035
Old option name Vehicles Vehicles Vehicles Vehicles
Option 1 - ZEZ measured expansion ZEZ Taxi, Cars (Bus)
Taxi, bus, LCV, Car
Taxi, bus, LCV, Car All Option 1 ZEZ only
Option 2 - ZEZ plus CAZ measured expansion ZEZ
Taxi, Cars (Bus)
Taxi, bus, LCV, Car
Taxi, bus, LCV, Car All
Option 1 ZEZ plus CAZ
CAZ
Taxi, bus, HGV, LCV, (Class C)
Taxi, bus, HGV, LCV, Car (Class D)
Taxi, bus, HGV, LCV, Car (Class D) N/A
Option 3 - ZEZ only tougher boundaries ZEZ
Taxi, Cars, LCV (Bus)
Taxi, bus, LCV, Car
Taxi, bus, LCV, Car All Option 2 ZEZ only/Option 5
Option 4 - ZEZ plus CAZ tougher boundaries ZEZ
Taxi, Cars, LCV (Bus)
Taxi, bus, LCV, Car
Taxi, bus, LCV, Car All
Option 2 ZEZ plus CAZ
CAZ
Taxi, bus, HGV, LCV, Car (Class D)
Taxi, bus, HGV, LCV, Car (Class D)
Taxi, bus, HGV, LCV, Car (Class D) N/A
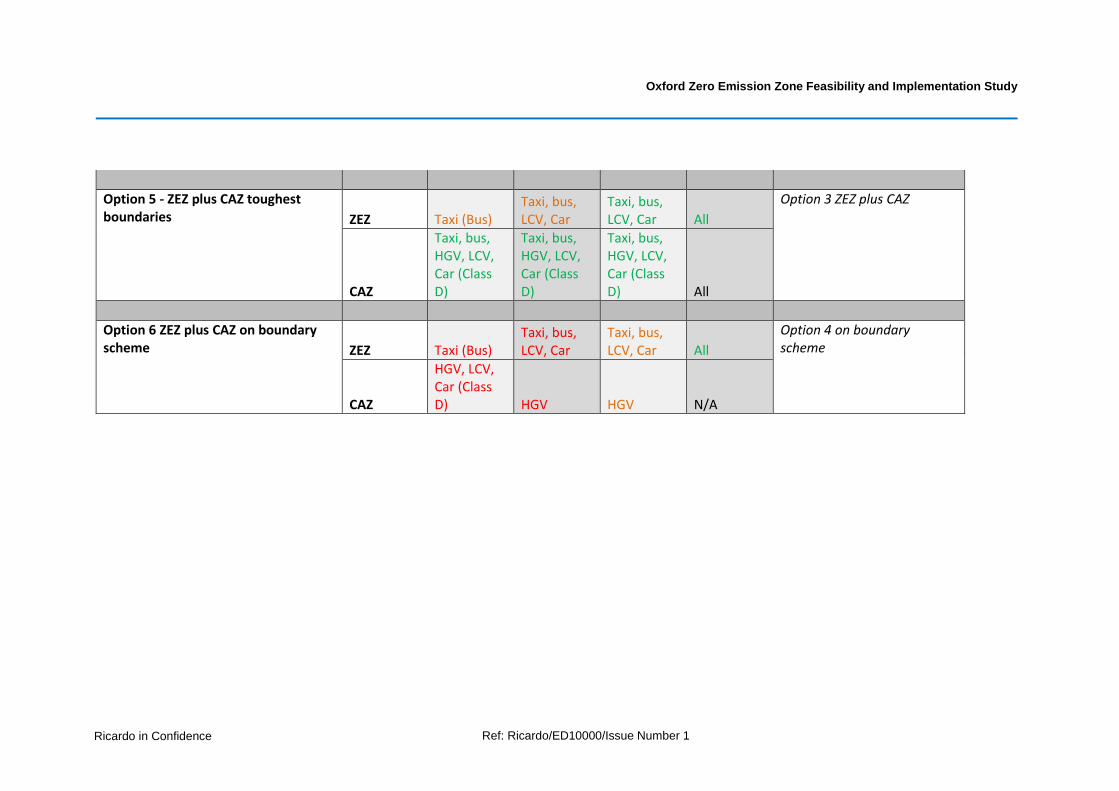
Oxford Zero Emission Zone Feasibility and Implementation Study
Ricardo in Confidence Ref: Ricardo/ED10000/Issue Number 1
Ricardo Energy & Environment
Option 5 - ZEZ plus CAZ toughest boundaries ZEZ Taxi (Bus)
Taxi, bus, LCV, Car
Taxi, bus, LCV, Car All
Option 3 ZEZ plus CAZ
CAZ
Taxi, bus, HGV, LCV, Car (Class D)
Taxi, bus, HGV, LCV, Car (Class D)
Taxi, bus, HGV, LCV, Car (Class D) All
Option 6 ZEZ plus CAZ on boundary scheme ZEZ Taxi (Bus)
Taxi, bus, LCV, Car
Taxi, bus, LCV, Car All
Option 4 on boundary scheme
CAZ
HGV, LCV, Car (Class D) HGV HGV N/A
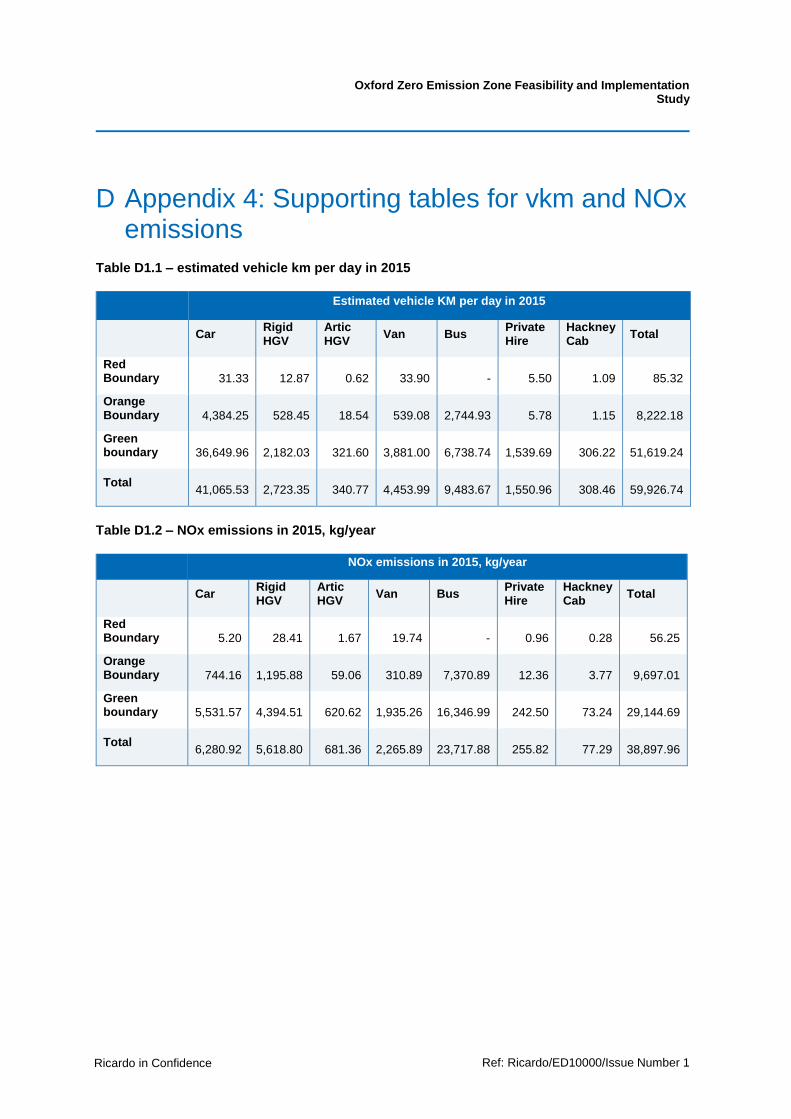
Oxford Zero Emission Zone Feasibility and Implementation Study
Ricardo in Confidence Ref: Ricardo/ED10000/Issue Number 1
Ricardo Energy & Environment
D Appendix 4: Supporting tables for vkm and NOx emissions
Table D1.1 – estimated vehicle km per day in 2015
Estimated vehicle KM per day in 2015
Car Rigid HGV
Artic HGV
Van Bus Private Hire
Hackney Cab
Total
Red Boundary
31.33
12.87
0.62
33.90
-
5.50
1.09
85.32
Orange Boundary
4,384.25
528.45
18.54
539.08
2,744.93
5.78
1.15
8,222.18
Green boundary
36,649.96
2,182.03
321.60
3,881.00
6,738.74
1,539.69
306.22
51,619.24
Total
41,065.53
2,723.35
340.77
4,453.99
9,483.67
1,550.96
308.46
59,926.74
Table D1.2 – NOx emissions in 2015, kg/year
NOx emissions in 2015, kg/year
Car Rigid HGV
Artic HGV
Van Bus Private Hire
Hackney Cab
Total
Red Boundary
5.20
28.41
1.67
19.74
-
0.96
0.28
56.25
Orange Boundary
744.16
1,195.88
59.06
310.89
7,370.89
12.36
3.77
9,697.01
Green boundary
5,531.57
4,394.51
620.62
1,935.26
16,346.99
242.50
73.24
29,144.69
Total
6,280.92
5,618.80
681.36
2,265.89
23,717.88
255.82
77.29
38,897.96
Oxford Zero Emission Zone Feasibility and Implementation Study
Ricardo in Confidence Ref: Ricardo/ED10000/Issue Number 1
Ricardo Energy & Environment
E Appendix 5 - Glossary
AADT Annual Average Daily Traffic
ANPR Automatic Number Plate Recognition
AQAP Air Quality Action Plan
AQMA Air Quality Management Area
BAU Business as usual
BEIS Department for Business, Energy & Industrial Strategy
BEV Battery electric vehicles
CAZ Clean Air zone
CBA Cost-benefit analysis
CO2 Carbon dioxide
E-REV Extended-range electric vehicle
EST Energy savings trust
EV Electric vehicle
FCEV Hydrogen fuel cell electric vehicles
DfT Department for transport
GHG Greenhouse Gas
HGV Heavy Goods Vehicle
IGCB Interdepartmental Group on Costs and Benefits’
JAQU Joint Air Quality Unit
LEZ Low emission zone
LGVs Light Goods Vehicles
MCA Multi criteria assessment
NAEI National Atmospheric Emission Inventory
NO2 Nitrogen dioxide
NOx Nitrogen oxide
NPV Net present value
OTS Oxford Transport Strategy (OTS)
PHEV Plug-in hybrid electric vehicles
PM Particulate matter
TfL Transport for London
TRO Traffic regulation order
Vkm Vehicle kilometres

Oxford Zero Emission Zone Feasibility and Implementation Study
Ricardo in Confidence Ref: Ricardo/ED10000/Issue Number 1
Ricardo Energy & Environment
ZEV Zero emission vehicle
ZEZ Zero Emission Zone

The Gemini Building Fermi Avenue Harwell Didcot Oxfordshire OX11 0QR United Kingdom
t: +44 (0)1235 753000 e: [email protected]