ownership trends in bse 100-index companies from 2000 ... fileownership trends in bse 100-index...
TRANSCRIPT

© 2016. Nahila Nazir & Amarjeet Kaur Malhotra. This is a research/review paper, distributed under the terms of the Creative Commons Attribution-Noncommercial 3.0 Unported License http://creativecommons.org/licenses/by-nc/3.0/), permitting all non-commercial use, distribution, and reproduction in any medium, provided the original work is properly cited.
Global Journal of HUMAN-SOCIAL SCIENCE: E Economics Volume 16 Issue 2 Version 1.0 Year 2016 Type: Double Blind Peer Reviewed International Research Journal Publisher: Global Journals Inc. (USA) Online ISSN: 2249-460x & Print ISSN: 0975-587X
Ownership Trends in BSE 100-Index Companies from 2000 – 2014: Evidence and Implications
By Nahila Nazir & Amarjeet Kaur Malhotra Ansal University
Abstract- Ownership and control of corporations under the watchful stewardship and surveillance of their boards have a significant influence in shaping corporate behavior and the equitable management of relationships between and among themselves, the society and communities they serve, and the governments of the countries they operate in. This paper tracks the movements in corporate ownership in India among its top companies indexed in BSE-100 in the first decade of the new millennium and moving forward in to the second. The paper is organized as follows: section I provides a brief overview of the development of the corporate format of business organizations; section II provides literature related to the topic and describes the sample and its categorization for analysis,; section III methodology; and section IV sets out the findings, interpretation and conclusions.
Keywords: corporate governance, ownership structure, BSE, trend analysis.
GJHSS-E Classification : FOR Code: 149999
OwnershipTrendsinBSE100IndexCompaniesfrom20002014EvidenceandImplications
Strictly as per the compliance and regulations of:

Ownership Trends in BSE 100-Index Companies from 2000 – 2014: Evidence and Implications
Nahila Nazir α & Amarjeet Kaur Malhotra σ
Abstract- Ownership and control of corporations under the watchful stewardship and surveillance of their boards have a significant influence in shaping corporate behavior and the equitable management of relationships between and among themselves, the society and communities they serve, and the governments of the countries they operate in. This paper tracks the movements in corporate ownership in India among its top companies indexed in BSE-100 in the first decade of the new millennium and moving forward in to the second. The paper is organized as follows: section I provides a brief overview of the development of the corporate format of business organizations; section II provides literature related to the topic and describes the sample and its categorization for analysis,; section III methodology; and section IV sets out the findings, interpretation and conclusions. Keywords: corporate governance, ownership structure, BSE, trend analysis.
I. Introduction
orporate governance as a subject has gained strong rise globally both in scientific and cultural community as well as in organization level. The
separation of ownership and control is exactly what creates the necessity for corporate and business governance, which include mechanisms to ensure advisable decision making and earnings maximization. Ownership structure is an important aspect of corporate governance system. Berle and Means 1932 call focus on the prevalence of broadly held corporations in the United States in which ownership of capital is dispersed among small shareholders, but still control is concentrated in the hands of professionals. Jensen and Meckling (1976) or Grossman and Hart (1980) indicated that the modern field of corporate and business finance is rolling out around the round the same image of a broadly held corporation.
Looking back at the evolutionary background of the corporation as known today one could detect at least three major defining trends. First was the artificial creation of the corporate entity by the legal practice, followed launch of limited liability, the popularity of the corporations' to spend money on and hold stock of another firm, and lastly, the switch from democratic to plutocratic voting rights leaving one vote per shareholder to one vote per share and thence to even
Author α:
Research Scholar, School of Management Studies, Ansal University, Gurgaon. e-mail: [email protected] Author σ:
Professor and Dean, School of Management Studies, Ansal
University, Gurgaon.
more skewed differential voting rights. The next was the introduction of the publicly traded (bought and sold) corporation representing a paradigm change in the manner business could be scaled up, where owners of the slice of the organization (represented by the percentage of shares hold) neither got claims to the property (net of liabilities) with their company in kind nor the compulsion to be permanently connected with their shareholdings; they could leave by selling their stocks disposing them off or otherwise. The developments of the organization board itself and its role, accountability and responsibility is the third defining component in modern corporate governance. However, the board is 'elected' by the shareholders but once so elected the board is practically its own arbiter in all matters associated with the company. With the demise of the lively, small time entrepreneurial investor-manager and the ascent of the generally unaggressive absentee shareholders in the organization format of business generally, professional management took over that function subject to the guidance and oversight of the board. The focus of this study is to analyze the trend of ownership structure for the period 2001-2014.
II. Literature Review
Ownership structure has important implications for corporate governance and protection of minority shareholders’ interest. Concentrated ownership structures and affiliation of companies with business groups is a common feature of Asian economies (Claessens and Fan, 2002). Influential legal scholars like Adolf Berle (1931), Merrick Dodd (1932), Lynn Stout (2002, 2012), Lucian Bebchuk (2005, 2006), Stephen Bainbridge (2002, 2005) and Leo Strine, Jr. (2006), have been debating the pros and cons of higher shareholder engagement in corporate and business decision making but as of now the absentee shareholders in many jurisdictions need to be satisfied largely using their (theoretical) right of having a say in the election of the directors to the board and thereafter expecting their interests would be reasonably protected. Shareholder primacy is influenced by the ownership structures of the organization. Within the confines of the modern corporation, both accountability and responsibility are heavily influenced by ownership structure. Ownership structure can also settle/interviene firm strategy and behavior (Wright, et al, 1996) and can influence boardroom dynamics and stakeholder management
C
V
olum
e XVI Issue
II V
ersio
n I
53
( E)
Globa
l Jo
urna
l of H
uman
Soc
ial Sc
ienc
e
-
Year
2016
© 2016 Global Journals Inc. (US)

(Goodstein and Boecker, 1991), executive compen-sation (David, Kochhar and Levitas, 1998; Balasubra-manian, et al, 2013), and R&D investment (Baysinger, Kosnik and Turk, 1991). Knowledge of ownership patterns and trends can thus lead us to more nuanced knowledge of organizational behavior and its own predictability.
a) Ownership Trends around the World
Research on firm ownership has often been controlled by studies centered on the United States and the United Kingdom both with dispersed and concentrated ownership structures. Earlier studies by La Porta, et al (1999) of other economies and recently by Aguilera et al (2011) of companies in emerging marketplaces have found concentrated ownership as a general pattern in most other world economies. The La Porta research which included companies from 27 developed countries found that only 30% of the companies showed dispersed ownership. Japan, in effect qualified as concentrated ownership geography because of predominant inter-corporate holdings even after they returned dispersed ownership because of direct ownership not being higher than 20% which was made the study cut-off criterion. Significant ownership concentration, either in the form of holdings by corporate bodies, individuals or the state in their study of corporations in South America was found by Aguilera et al (2011).
b)
Classification of Shareholders
Data in this study is analysed under two major categories of shareholders
namely (i) Promoters, (ii)
Non Promoters Holding sub divided into two other categories namely (iii) Non Promoters Institutional Holding, (iii) Non Promoters Non- Institutional Holding.
i. Promoters Holding
Holdings into various categories provide insight into control in the company. Promoters are the entities that floated the company and to a large extent have seats on Board of Directors or the Management. Relatives of the Promoters who hold shares also fall under this class and are termed the Promoter Group. Promoter Holdings show the extent of control Promoters have over running of the business.
ii. Non Promoters Shareholders other than promoters are known
as public shareholders. Public shareholding pattern consists of institutional and non-institutional investors. iii. Non Promoters’ Institutional Holding
Institutional investors include the pension funds, money managers, mutual funds, insurance companies, investment banks and commercial trusts. They buy large quantities of shares leaving high impact on the stock market’s movements. They are considered knowledgeable and experienced. Hence, their footprints are generally followed by small investors. iv. Non Promoters’ Non Institutional Holding
Non institutional investors are those who carry their investments through a broker, bank, and real estate agent and so on. They are generally common people or organizations managing money on their own.
III. Methodology
a) Results In the research study, the long term trend is
analyzed of the selected variables related Ownership structure. The descriptive analysis of the variables is done and represented. In descriptive analysis of the variables, the measure of central tendency (mean), distribution, minimum and maximum values are estimated for each variable and are represented in the tables below.
i. Promoters Holding
Company Mean min max
Mangalore Refinery & Petrochemicals Ltd. 85.1514 68.22 88.58 Steel Authority Of India Ltd. 84.9886 80.00 85.82 Godrej Industries Ltd. 80.2914 68.22 88.61 Bharat Electronics Ltd. 75.8000 75.02 75.86 Oil & Natural Gas Corpn. Ltd. 75.2043 68.94 84.11
© 2016 Global Journals Inc. (US)
V
olum
e XVI Issue
II V
ersio
n I
54
( E)
Globa
l Jo
urna
l of H
uman
Soc
ial Sc
ienc
e
s
-
Year
2016
Ownership Trends in BSE 100-Index Companies from 2000 – 2014: Evidence and Implications
Table 1.1 : Average promoters holding of the firms in BSE 100 Index for the period 2000-2014
A time series analysis of ownership structures in corporate India for the period 2000-2014 is presented in this section. The research design of the study is descriptive. In the research study the secondary data of different variables related to ownership structure in the Index BSE-100 in Indian stock marketwas extracted from the Prowess databases from CMIE related to the years ended 31 March 2000 to 2014. The descriptive analysis of the variables is done and represented. In descriptive analysis of the variables, the measure of central tendency (mean, median), distribution, minimum and maximum values are estimated. While the focus of this paper is the publicly traded companies, it would be helpful also to recognise the phenomenal growth in the overall corporate sector in the last 15 years to show the trend of ownership structure in India.
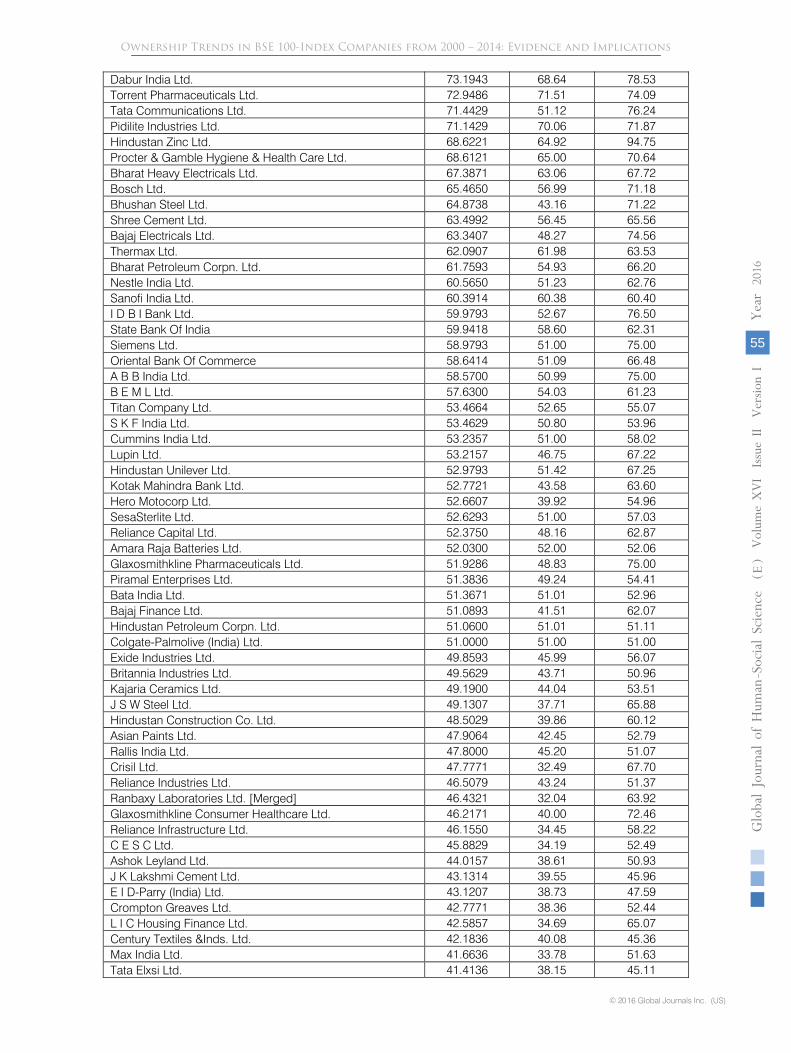
Dabur India Ltd. 73.1943 68.64 78.53 Torrent Pharmaceuticals Ltd. 72.9486 71.51 74.09 Tata Communications Ltd. 71.4429 51.12 76.24 Pidilite Industries Ltd. 71.1429 70.06 71.87 Hindustan Zinc Ltd. 68.6221 64.92 94.75 Procter & Gamble Hygiene & Health Care Ltd. 68.6121 65.00 70.64 Bharat Heavy Electricals Ltd. 67.3871 63.06 67.72 Bosch Ltd. 65.4650 56.99 71.18 Bhushan Steel Ltd. 64.8738 43.16 71.22 Shree Cement Ltd. 63.4992 56.45 65.56 Bajaj Electricals Ltd. 63.3407 48.27 74.56 Thermax Ltd. 62.0907 61.98 63.53 Bharat Petroleum Corpn. Ltd. 61.7593 54.93 66.20 Nestle India Ltd. 60.5650 51.23 62.76 Sanofi India Ltd. 60.3914 60.38 60.40 I D B I Bank Ltd. 59.9793 52.67 76.50 State Bank Of India 59.9418 58.60 62.31 Siemens Ltd. 58.9793 51.00 75.00 Oriental Bank Of Commerce 58.6414 51.09 66.48 A B B India Ltd. 58.5700 50.99 75.00 B E M L Ltd. 57.6300 54.03 61.23 Titan Company Ltd. 53.4664 52.65 55.07 S K F India Ltd. 53.4629 50.80 53.96 Cummins India Ltd. 53.2357 51.00 58.02 Lupin Ltd. 53.2157 46.75 67.22 Hindustan Unilever Ltd. 52.9793 51.42 67.25 Kotak Mahindra Bank Ltd. 52.7721 43.58 63.60 Hero Motocorp Ltd. 52.6607 39.92 54.96 SesaSterlite Ltd. 52.6293 51.00 57.03 Reliance Capital Ltd. 52.3750 48.16 62.87 Amara Raja Batteries Ltd. 52.0300 52.00 52.06 Glaxosmithkline Pharmaceuticals Ltd. 51.9286 48.83 75.00 Piramal Enterprises Ltd. 51.3836 49.24 54.41 Bata India Ltd. 51.3671 51.01 52.96 Bajaj Finance Ltd. 51.0893 41.51 62.07 Hindustan Petroleum Corpn. Ltd. 51.0600 51.01 51.11 Colgate-Palmolive (India) Ltd. 51.0000 51.00 51.00 Exide Industries Ltd. 49.8593 45.99 56.07 Britannia Industries Ltd. 49.5629 43.71 50.96 Kajaria Ceramics Ltd. 49.1900 44.04 53.51 J S W Steel Ltd. 49.1307 37.71 65.88 Hindustan Construction Co. Ltd. 48.5029 39.86 60.12 Asian Paints Ltd. 47.9064 42.45 52.79 Rallis India Ltd. 47.8000 45.20 51.07 Crisil Ltd. 47.7771 32.49 67.70 Reliance Industries Ltd. 46.5079 43.24 51.37 Ranbaxy Laboratories Ltd. [Merged] 46.4321 32.04 63.92 Glaxosmithkline Consumer Healthcare Ltd. 46.2171 40.00 72.46 Reliance Infrastructure Ltd. 46.1550 34.45 58.22 C E S C Ltd. 45.8829 34.19 52.49 Ashok Leyland Ltd. 44.0157 38.61 50.93 J K Lakshmi Cement Ltd. 43.1314 39.55 45.96 E I D-Parry (India) Ltd. 43.1207 38.73 47.59 Crompton Greaves Ltd. 42.7771 38.36 52.44 L I C Housing Finance Ltd. 42.5857 34.69 65.07 Century Textiles &Inds. Ltd. 42.1836 40.08 45.36 Max India Ltd. 41.6636 33.78 51.63 Tata Elxsi Ltd. 41.4136 38.15 45.11
V
olum
e XVI Issue
II V
ersio
n I
55
( E)
Globa
l Jo
urna
l of H
uman
Soc
ial Sc
ienc
e
-
Year
2016
© 2016 Global Journals Inc. (US)
Ownership Trends in BSE 100-Index Companies from 2000 – 2014: Evidence and Implications

Ramco Cements Ltd. 41.3186 34.31 42.62
Atul Ltd. 40.3643 33.19 50.62
Bharat Forge Ltd. 39.9729 34.32 46.74
Aditya Birla Nuvo Ltd. 39.0157 26.68 57.23
Arvind Ltd. 38.9657 15.41 51.22
BalrampurChini Mills Ltd. 38.9407 31.82 47.07
Cipla Ltd. 38.8529 36.80 40.96
Gujarat State Fertilizers & Chemicals Ltd. 37.8414 37.84 37.85
I F C I Ltd. 37.0200 0.00 55.53
Raymond Ltd. 36.2750 28.42 41.45
Jain Irrigation Systems Ltd. 34.7636 27.46 72.27
Tata Motors Ltd. 33.8129 25.35 41.73
Escorts Ltd. 33.1471 26.78 41.98
Finolex Cables Ltd. 33.0562 28.01 35.86
Bajaj Holdings &Invst. Ltd. 32.7257 28.57 40.17
Tata Global Beverages Ltd. 32.4821 28.60 35.36
Tata Power Co. Ltd. 32.3629 31.22 33.41
Essar Oil Ltd. 31.2250 15.96 62.09
Tata Chemicals Ltd. 29.9679 27.06 31.60
Tata Steel Ltd. 29.5043 26.22 33.95
Trent Ltd. 29.4286 25.18 32.61
A C C Ltd. 29.0614 0.00 50.30
Hindalco Industries Ltd. 28.9679 21.38 37.00
N C C Ltd. 28.7714 19.56 48.22
Lakshmi Machine Works Ltd. 27.5379 21.44 30.62
Voltas Ltd. 27.5286 20.04 30.61
Great Eastern Shipping Co. Ltd. 27.1893 19.14 30.50
M R F Ltd. 26.3621 25.19 27.33
Dr. Reddy'S Laboratories Ltd. 26.2800 25.14 31.48
Satyam Computer Services Ltd. [Merged] 25.3133 8.74 42.67
Mahindra & Mahindra Ltd. 24.8671 22.09 29.20
Grasim Industries Ltd. 23.8071 20.39 25.55
H D F C Bank Ltd. 23.2457 19.38 28.27
Infosys Ltd. 20.2664 15.94 29.15
Federal Bank Ltd. 0.0000 0.00 0.00
Housing Development Finance Corpn. Ltd. 0.0000 0.00 0.00
Larsen & Toubro Ltd. 0.0000 0.00 0.00
In the research study, the trends of promoter’s holding in the 100 companies selected for the study in BSE-100 Index is analyzed and it is found that, Mangalore Refinery & Petrochemicals Ltd. is having the highest average promoters holding of (85.15 percent) in last 15 years followed by Steel Authority Of India Ltd. (84.98 percent), and Godrej Industries Ltd. (80.29 percent). The companies having no promoters holding
are Larsen & Toubro Ltd., Housing Development Finance Corpn. Ltd. and Federal Bank Ltd. The companies with lowest percentage of promoters holding are Infosys Ltd. (20.26 percent), H D F C Bank Ltd. (23.24 percent).and Grasim Industries Ltd. (23.80 percent). The frequency distribution is shown below in Table 1.2.
Average Promoters Holding
Frequency
Percent
less than 10%
3 3.00%
10 - 20%
0 0.00%
20 - 30%
16
16.00%
30 - 40%
16
16.00%
40 – 50%
23
23.00%
more than 50%
42
42.00%
Total
100
100.00%
© 2016 Global Journals Inc. (US)
V
olum
e XVI Issue
II V
ersio
n I
56
( E)
Globa
l Jo
urna
l of H
uman
Soc
ial Sc
ienc
e
s
-
Year
2016
Table 1.2 : Frequency distribution of firm’s w.r.t average promoters holding for the period 2000-2014
Ownership Trends in BSE 100-Index Companies from 2000 – 2014: Evidence and Implications

In the research study, it is also found that among the 100 companies selected for the study in BSE 100 index, 42percent of firms in BSE 100 index are having average promoters holding of more than 50 percent, 23 percent of the firms are having average promoters holding in the range of 40 - 50 percent of holding, 16percent of the firms are found to have
average promoters holding of 30 - 40 percent of holding, 16 percent of firms are found to have average promoters holding in the range of 20 - 30 percent of holding, 0percent of the firms are found to have average promoters holding of 10 - 20 percent of holding and 3 percent of the firms are having the average promoters holding less than less than 10 percent of holding.
The Frequency Distribution is also shown with the help of Graph shown in Figure 1.
ii. Non Promoters Holding
Company Mean min max
Housing Development Finance Corpn. Ltd. 100.0000 100.00 100.00
Larsen & Toubro Ltd. 98.2050 95.87 100.00
Federal Bank Ltd. 97.0386 84.69 100.00
I F C I Ltd. 92.0671 44.47 100.00
M R F Ltd. 73.6350 72.67 74.80
Great Eastern Shipping Co. Ltd. 72.7000 69.30 80.85
Voltas Ltd. 72.4700 69.39 79.96
Lakshmi Machine Works Ltd. 72.4621 69.38 78.56
Mahindra & Mahindra Ltd. 71.6621 64.15 77.91
Satyam Computer Services Ltd. [Merged] 71.0400 46.20 86.96
N C C Ltd. 70.9300 51.78 80.41
A C C Ltd. 70.8507 49.70 100.00
Trent Ltd. 70.5700 67.39 74.82
Infosys Ltd. 70.0500 64.31 80.50
Tata Chemicals Ltd. 70.0293 68.40 72.93
Tata Steel Ltd. 69.7736 65.67 73.77
Grasim Industries Ltd. 69.3929 60.05 79.61
Tata Global Beverages Ltd. 67.3079 63.24 71.39
Bajaj Holdings &Invst. Ltd. 66.8607 59.56 71.42
Escorts Ltd. 66.8493 58.02 73.22
Tata Power Co. Ltd. 66.6050 64.31 67.95
H D F C Bank Ltd. 66.3186 55.13 78.00
Hindalco Industries Ltd. 65.7486 53.74 78.61
Jain Irrigation Systems Ltd. 65.0507 27.73 72.32
Finolex Cables Ltd. 64.4823 60.16 71.99
Dr. Reddy'S Laboratories Ltd. 64.1429 55.61 74.24
Raymond Ltd. 62.8921 57.18 71.58
Gujarat State Fertilizers & Chemicals Ltd. 62.1557 62.15 62.16
BalrampurChini Mills Ltd. 61.0550 52.92 68.18
Arvind Ltd. 60.8800 48.78 84.59
Cipla Ltd. 60.6993 59.03 63.11
0.00%10.00%20.00%30.00%40.00%50.00%
less than 10%
10 -20%
20 -30%
30 -40%
40 –50%
more than 50%
V
olum
e XVI Issue
II V
ersio
n I
57
( E)
Globa
l Jo
urna
l of H
uman
Soc
ial Sc
ienc
e
-
Year
2016
© 2016 Global Journals Inc. (US)
Table 1.3 : Average non promoters holding of the firms in BSE 100 Index for the period 2000-2014
Ownership Trends in BSE 100-Index Companies from 2000 – 2014: Evidence and Implications

Bharat Forge Ltd. 60.0207 53.25 65.68
Reliance Infrastructure Ltd. 59.8079 41.78 100.00
Atul Ltd. 59.6336 49.38 66.80
Aditya Birla Nuvo Ltd. 59.2379 40.33 73.32
Ramco Cements Ltd. 58.6779 57.38 65.68
Tata Elxsi Ltd. 58.5821 54.89 61.85
Max India Ltd. 58.3329 48.36 66.22
Century Textiles &Inds. Ltd. 57.5621 54.63 59.45
L I C Housing Finance Ltd. 57.3129 34.92 65.30
Tata Motors Ltd. 57.2657 44.41 74.65
Crompton Greaves Ltd. 57.0479 47.56 61.64
J K Lakshmi Cement Ltd. 56.4579 53.42 60.44
E I D-Parry (India) Ltd. 56.4550 51.45 61.26
C E S C Ltd. 54.0764 47.43 65.80
Glaxosmithkline Consumer Healthcare Ltd. 53.7821 27.54 60.00
Ranbaxy Laboratories Ltd. [Merged] 52.3143 34.29 67.96
Crisil Ltd. 52.2207 32.30 67.51
Rallis India Ltd. 52.1979 48.93 54.80
Asian Paints Ltd. 52.0907 47.21 57.54
Reliance Industries Ltd. 51.4493 44.92 56.76
Hindustan Construction Co. Ltd. 51.3286 39.88 60.12
Kajaria Ceramics Ltd. 50.8071 46.49 55.95
J S W Steel Ltd. 50.6850 34.11 61.95
State Bank Of India 50.5921 32.40 100.00
Britannia Industries Ltd. 50.4364 49.04 56.28
Exide Industries Ltd. 50.1379 43.93 54.01
Colgate-Palmolive (India) Ltd. 49.0000 49.00 49.00
Hindustan Petroleum Corpn. Ltd. 48.9400 48.89 48.99
Bajaj Finance Ltd. 48.9071 37.93 58.49
Bata India Ltd. 48.6329 47.04 48.99
Piramal Enterprises Ltd. 48.6129 45.58 50.76
Ashok Leyland Ltd. 48.3150 45.24 50.41
Glaxosmithkline Pharmaceuticals Ltd. 48.0714 25.00 51.17
Amara Raja Batteries Ltd. 47.9700 47.94 48.00
Hero Motocorp Ltd. 47.3386 45.04 60.08
Reliance Capital Ltd. 47.3236 37.12 51.84
Kotak Mahindra Bank Ltd. 47.0621 36.39 56.26
Hindustan Unilever Ltd. 47.0164 32.75 48.58
Lupin Ltd. 46.7829 32.78 53.25
SesaSterlite Ltd. 46.7707 36.64 49.00
Cummins India Ltd. 46.7607 41.97 49.00
S K F India Ltd. 46.5350 46.04 49.19
Titan Company Ltd. 46.5321 44.93 47.34
B E M L Ltd. 42.3657 38.76 45.97
A B B India Ltd. 41.4293 25.00 49.00
Oriental Bank Of Commerce 41.3586 33.52 48.91
Siemens Ltd. 41.0186 25.00 48.99
I D B I Bank Ltd. 40.0179 23.50 47.33
Sanofi India Ltd. 39.6086 39.60 39.62
Nestle India Ltd. 39.4350 37.24 48.77
Bharat Petroleum Corpn. Ltd. 38.2364 33.79 45.07
Thermax Ltd. 37.9071 36.47 38.02
Bajaj Electricals Ltd. 36.6571 25.44 51.72
Shree Cement Ltd. 36.5000 34.44 43.54
© 2016 Global Journals Inc. (US)
V
olum
e XVI Issue
II V
ersio
n I
58
( E)
Globa
l Jo
urna
l of H
uman
Soc
ial Sc
ienc
e
s
-
Year
2016
Ownership Trends in BSE 100-Index Companies from 2000 – 2014: Evidence and Implications

Bhushan Steel Ltd. 35.1262 28.78 56.84
Bosch Ltd. 34.5329 28.82 43.00
Bharat Heavy Electricals Ltd. 32.6086 32.27 36.94
Procter & Gamble Hygiene & Health Care Ltd. 31.3850 29.36 35.00
Hindustan Zinc Ltd. 31.3736 5.24 35.08
Pidilite Industries Ltd. 28.8543 28.12 29.94
Essar Oil Ltd. 28.2664 9.46 79.88
Torrent Pharmaceuticals Ltd. 27.0493 25.90 28.49
Dabur India Ltd. 26.8036 21.47 31.36
Tata Communications Ltd. 25.2593 15.09 48.87
Oil & Natural Gas Corpn. Ltd. 24.7950 15.89 31.06
Bharat Electronics Ltd. 24.1957 24.13 24.98
Godrej Industries Ltd. 19.7071 11.39 31.78
Steel Authority Of India Ltd. 15.0014 14.14 19.99
Mangalore Refinery & Petrochemicals Ltd. 14.8486 11.42 31.78
In the research study, the trends of non-promoter’s holding in the 100 companies selected for the study in BSE 100 index is analyzed and it is found that Housing Development Finance Corpn. Ltd. is having the highest non promoters holding of (100 percent) in last 15 years followed by Larsen & Toubro Ltd. (98.20 percent), and Federal Bank Ltd.
(97.04 percent). The companies with lowest percentage of non-promoters holding are Mangalore Refinery & Petrochemicals Ltd. (14.85 percent), Steel Authority Of India Ltd.
(15.0014 percent).
and Godrej Industries Ltd.
(19.7 percent).The frequency distribution is shown below in Table 1.4.
Average Non Promoters Holding Frequency Percent
less than 10%
0 0.00%
10 - 20%
3
3.00%
20 - 30%
7 7.00%
30 - 40%
11
11.00%
40 – 50%
22
22.00%
more than 50%
57
57.00%
Total
100
100.00%
In the research study, it is also found that among the 100 companies selected for the study in BSE 100 index, 57percent of firms in BSE 100 index are having average non-promoters holding of more than 50 percent of holding, 22 percent of the firms are having average non-promoters holding in the range of 40 - 50 percent of holding, 11 percent of the firms are found to
have average non-promoters holding of 30 - 40 percent of holding, 7percent of the firms are found to have average non-promoters holding of 20-30 percent of holding, 3percent of firms are found to have average non-promoters holding in
the range of 10 - 20 percent of
holding and there is no holding of average non-promoters holding less than 10percent of holding.
The Frequency Distribution is also shown with the help of Graph shown in Figure 2.
0.00%10.00%20.00%30.00%40.00%50.00%60.00%
less than
10%
10 -20%
20 -30%
30 -40%
40 –50%
more than 50%
V
olum
e XVI Issue
II V
ersio
n I
59
( E)
Globa
l Jo
urna
l of H
uman
Soc
ial Sc
ienc
e
-
Year
2016
© 2016 Global Journals Inc. (US)
Table 1.4 : Frequency distribution of firm’s w.r.t average non- promoters holding for the period 2000-2014
Ownership Trends in BSE 100-Index Companies from 2000 – 2014: Evidence and Implications
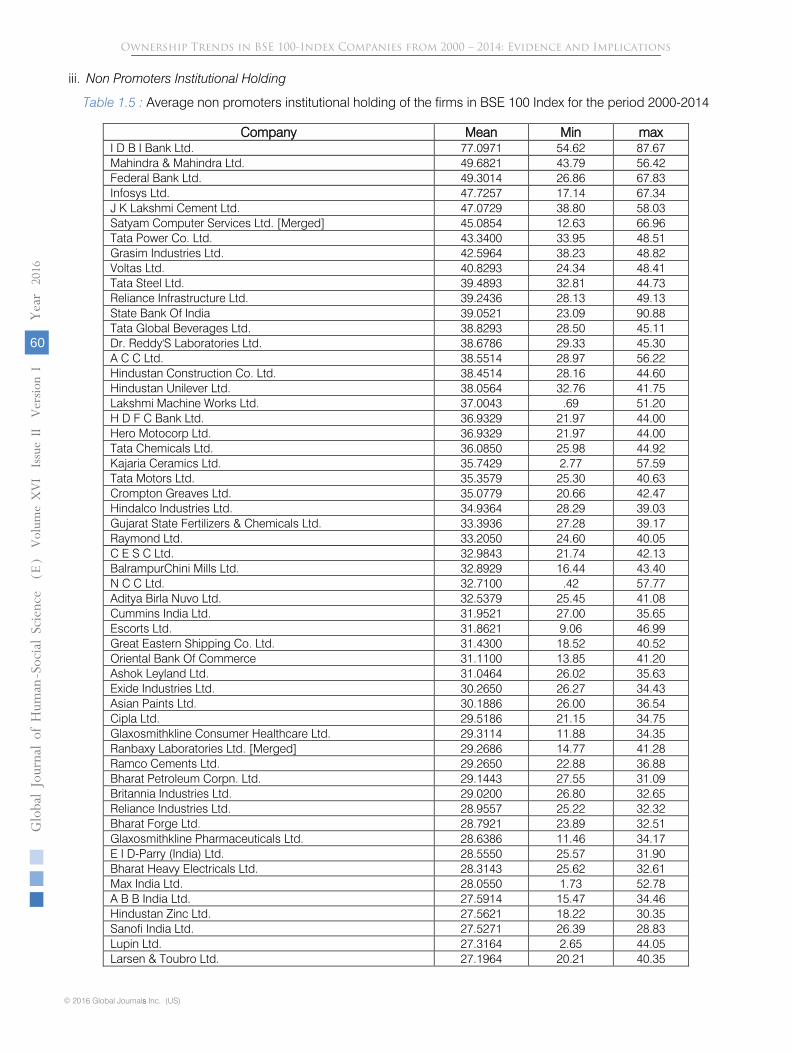
iii. Non Promoters Institutional Holding
Company Mean Min max I D B I Bank Ltd. 77.0971 54.62 87.67 Mahindra & Mahindra Ltd. 49.6821 43.79 56.42 Federal Bank Ltd. 49.3014 26.86 67.83 Infosys Ltd. 47.7257 17.14 67.34 J K Lakshmi Cement Ltd. 47.0729 38.80 58.03 Satyam Computer Services Ltd. [Merged] 45.0854 12.63 66.96 Tata Power Co. Ltd. 43.3400 33.95 48.51 Grasim Industries Ltd. 42.5964 38.23 48.82 Voltas Ltd. 40.8293 24.34 48.41 Tata Steel Ltd. 39.4893 32.81 44.73 Reliance Infrastructure Ltd. 39.2436 28.13 49.13 State Bank Of India 39.0521 23.09 90.88 Tata Global Beverages Ltd. 38.8293 28.50 45.11 Dr. Reddy'S Laboratories Ltd. 38.6786 29.33 45.30 A C C Ltd. 38.5514 28.97 56.22 Hindustan Construction Co. Ltd. 38.4514 28.16 44.60 Hindustan Unilever Ltd. 38.0564 32.76 41.75 Lakshmi Machine Works Ltd. 37.0043 .69 51.20 H D F C Bank Ltd. 36.9329 21.97 44.00 Hero Motocorp Ltd. 36.9329 21.97 44.00 Tata Chemicals Ltd. 36.0850 25.98 44.92 Kajaria Ceramics Ltd. 35.7429 2.77 57.59 Tata Motors Ltd. 35.3579 25.30 40.63 Crompton Greaves Ltd. 35.0779 20.66 42.47 Hindalco Industries Ltd. 34.9364 28.29 39.03 Gujarat State Fertilizers & Chemicals Ltd. 33.3936 27.28 39.17 Raymond Ltd. 33.2050 24.60 40.05 C E S C Ltd. 32.9843 21.74 42.13 BalrampurChini Mills Ltd. 32.8929 16.44 43.40 N C C Ltd. 32.7100 .42 57.77 Aditya Birla Nuvo Ltd. 32.5379 25.45 41.08 Cummins India Ltd. 31.9521 27.00 35.65 Escorts Ltd. 31.8621 9.06 46.99 Great Eastern Shipping Co. Ltd. 31.4300 18.52 40.52 Oriental Bank Of Commerce 31.1100 13.85 41.20 Ashok Leyland Ltd. 31.0464 26.02 35.63 Exide Industries Ltd. 30.2650 26.27 34.43 Asian Paints Ltd. 30.1886 26.00 36.54 Cipla Ltd. 29.5186 21.15 34.75 Glaxosmithkline Consumer Healthcare Ltd. 29.3114 11.88 34.35 Ranbaxy Laboratories Ltd. [Merged] 29.2686 14.77 41.28 Ramco Cements Ltd. 29.2650 22.88 36.88 Bharat Petroleum Corpn. Ltd. 29.1443 27.55 31.09 Britannia Industries Ltd. 29.0200 26.80 32.65 Reliance Industries Ltd. 28.9557 25.22 32.32 Bharat Forge Ltd. 28.7921 23.89 32.51 Glaxosmithkline Pharmaceuticals Ltd. 28.6386 11.46 34.17 E I D-Parry (India) Ltd. 28.5550 25.57 31.90 Bharat Heavy Electricals Ltd. 28.3143 25.62 32.61 Max India Ltd. 28.0550 1.73 52.78 A B B India Ltd. 27.5914 15.47 34.46 Hindustan Zinc Ltd. 27.5621 18.22 30.35 Sanofi India Ltd. 27.5271 26.39 28.83 Lupin Ltd. 27.3164 2.65 44.05 Larsen & Toubro Ltd. 27.1964 20.21 40.35
© 2016 Global Journals Inc. (US)
V
olum
e XVI Issue
II V
ersio
n I
60
( E)
Globa
l Jo
urna
l of H
uman
Soc
ial Sc
ienc
e
s
-
Year
2016
Table 1.5 : Average non promoters institutional holding of the firms in BSE 100 Index for the period 2000-2014
Ownership Trends in BSE 100-Index Companies from 2000 – 2014: Evidence and Implications

B E M L Ltd. 25.9936 13.11 36.73
Trent Ltd. 25.6921 1.98 37.76
Arvind Ltd. 25.4743 6.73 40.92
Bajaj Holdings &Invst. Ltd. 25.0743 19.68 30.00
Crisil Ltd. 25.0471 18.52 30.18
J S W Steel Ltd. 25.0050 17.52 38.35
SesaSterlite Ltd. 24.8857 14.24 31.47
L I C Housing Finance Ltd. 24.4057 .99 34.33
S K F India Ltd. 23.9329 11.76 32.49
Piramal Enterprises Ltd. 23.8736 14.18 34.82
Bosch Ltd. 23.3136 18.53 30.70
Century Textiles &Inds. Ltd. 23.0421 17.47 26.80
Jain Irrigation Systems Ltd. 22.7586 2.86 37.63
Rallis India Ltd. 22.1593 11.66 32.02
I F C I Ltd. 22.1107 14.07 28.55
Bata India Ltd. 22.0929 11.80 31.14
Siemens Ltd. 21.8007 11.60 27.09
Hindustan Petroleum Corpn. Ltd. 20.7771 2.96 41.38
Colgate-Palmolive (India) Ltd. 19.7500 9.69 26.95
Thermax Ltd. 19.6443 7.67 24.15
Reliance Capital Ltd. 19.4736 1.89 32.90
Nestle India Ltd. 19.3943 16.73 23.51
Housing Development Finance Corpn. Ltd. 19.3386 1.48 33.35
Finolex Cables Ltd. 19.2600 12.23 27.46
Dabur India Ltd. 18.7236 11.43 24.88
Atul Ltd. 17.3650 5.99 30.77
Bharat Electronics Ltd. 17.3286 8.15 20.61
Titan Company Ltd. 16.2014 8.05 24.10
Pidilite Industries Ltd. 16.1379 11.89 19.25
Kotak Mahindra Bank Ltd. 16.0021 1.64 30.46
Bajaj Electricals Ltd. 15.9736 7.12 20.94
M R F Ltd. 15.5786 12.81 28.38
Torrent Pharmaceuticals Ltd. 15.4493 8.81 19.58
Tata Communications Ltd. 14.1379 9.36 19.14
Amara Raja Batteries Ltd. 13.7471 1.70 26.60
Bajaj Finance Ltd. 12.8093 .17 25.70
Shree Cement Ltd. 12.2815 4.48 14.91
Tata Elxsi Ltd. 11.3921 .07 24.84
Steel Authority Of India Ltd. 11.3407 8.06 16.79
Oil & Natural Gas Corpn. Ltd. 10.9071 2.48 17.52
Procter & Gamble Hygiene & Health Care Ltd. 10.2814 6.48 14.59
Bhushan Steel Ltd. 6.1454 2.51 24.64
Godrej Industries Ltd. 6.1179 .87 14.80
Essar Oil Ltd. 5.9979 2.18 14.08
Mangalore Refinery & Petrochemicals Ltd. 3.4500 .29 20.99
In the research study, the trends of non-promoter’s institutional holding
in the 100 companies
selected for the study in BSE 100 index is analyzed and it is found that I D B I Bank Ltd. is having the highest average
Non Promoters Institutional Holding of (77.097
percent) in last 15 years followed by Mahindra& Mahindra Ltd. (49.68 percent), and Federal Bank Ltd. (49.30 percent). The companies with lowest percentage of non-promoters institutional holding are Mangalore Refinery & Petrochemicals Ltd. (3.45 percent), Essar Oil Ltd. (5.997 percent) and Godrej Industries Ltd. (6.11 percent). The frequency distribution is shown below in Table 1.6.
V
olum
e XVI Issue
II V
ersio
n I
61
( E)
Globa
l Jo
urna
l of H
uman
Soc
ial Sc
ienc
e
-
Year
2016
© 2016 Global Journals Inc. (US)
Ownership Trends in BSE 100-Index Companies from 2000 – 2014: Evidence and Implications

Average Non Promoters Institutional Holding Frequency Percent
less than 10% 4 4.00% 10 - 20% 23 23.00% 20 - 30% 35 35.00% 30 - 40% 29 29.00% 40 – 50% 8 8.00%
more than 50% 1 1.00% Total 100 100.00%
In the research study, it is also found that among the 100 companies selected for the study in BSE 100 index, only 1percent of firms in BSE 100 index are having average non-promoters institutional holding of more than 50 percent of holding, 8 percent of the firms are having average non-promoters institutional holding in the range of 40 - 50 percent of holding, 29 percent of the firms are found to have average non-promoters
institutional holding of 30 - 40 percent of holding, 35 percent of firms are found to have average non-promoters institutional holding in the range of 20 - 30 percent of holding, 23 percent of firms are found to have average non-promoters institutional holding in the range of 10 - 20 percent of holding and 4 percent of the firms are having the average non promoters institutional holding less than 10 percent of holding.
The Frequency Distribution is also shown with the help of Graph shown in Figure 3.
iv. Non Promoters Non Institutional Holding
Company Mean min max M R F Ltd. 58.0586 46.28 60.75 Federal Bank Ltd. 47.7364 29.22 73.14 Tata Elxsi Ltd. 47.1929 34.17 61.78 Larsen & Toubro Ltd. 46.0314 41.56 55.91 Lakshmi Machine Works Ltd. 45.2679 37.64 53.98 Finolex Cables Ltd. 45.2238 39.04 48.75 Trent Ltd. 44.8800 30.93 72.84 I F C I Ltd. 44.3407 26.33 57.60 Atul Ltd. 42.2721 32.49 52.10 Bajaj Holdings &Invst. Ltd. 41.7907 33.44 51.75 Great Eastern Shipping Co. Ltd. 41.2700 29.40 58.59 N C C Ltd. 38.2221 20.23 61.48 Bajaj Finance Ltd. 36.1014 19.11 53.68 Arvind Ltd. 35.4086 19.03 62.48 Escorts Ltd. 34.9929 25.63 48.97 Kajaria Ceramics Ltd. 34.8071 18.44 48.87
0.00%5.00%
10.00%15.00%20.00%25.00%30.00%35.00%
less than 10%
10 -20%
20 -30%
30 –40%
40 -50%
more than 50%
© 2016 Global Journals Inc. (US)
V
olum
e XVI Issue
II V
ersio
n I
62
( E)
Globa
l Jo
urna
l of H
uman
Soc
ial Sc
ienc
e
s
-
Year
2016
Table 1.6 : Frequency distribution of firm’s w.r.t average promoters holding for the period 2000-2014
Table 1.7 : Average non promoters non Institutional holding of the firms in BSE 100 Index for the period 2000-2014
Ownership Trends in BSE 100-Index Companies from 2000 – 2014: Evidence and Implications
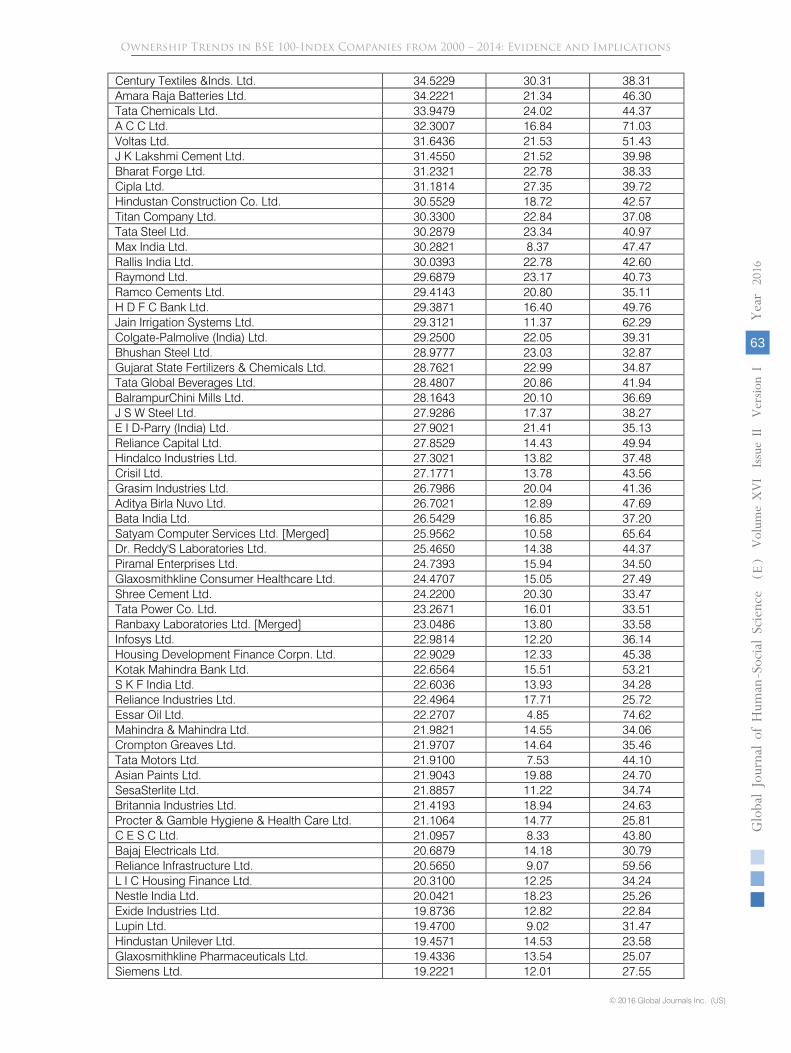
Century Textiles &Inds. Ltd. 34.5229 30.31 38.31 Amara Raja Batteries Ltd. 34.2221 21.34 46.30 Tata Chemicals Ltd. 33.9479 24.02 44.37 A C C Ltd. 32.3007 16.84 71.03 Voltas Ltd. 31.6436 21.53 51.43 J K Lakshmi Cement Ltd. 31.4550 21.52 39.98 Bharat Forge Ltd. 31.2321 22.78 38.33 Cipla Ltd. 31.1814 27.35 39.72 Hindustan Construction Co. Ltd. 30.5529 18.72 42.57 Titan Company Ltd. 30.3300 22.84 37.08 Tata Steel Ltd. 30.2879 23.34 40.97 Max India Ltd. 30.2821 8.37 47.47 Rallis India Ltd. 30.0393 22.78 42.60 Raymond Ltd. 29.6879 23.17 40.73 Ramco Cements Ltd. 29.4143 20.80 35.11 H D F C Bank Ltd. 29.3871 16.40 49.76 Jain Irrigation Systems Ltd. 29.3121 11.37 62.29 Colgate-Palmolive (India) Ltd. 29.2500 22.05 39.31 Bhushan Steel Ltd. 28.9777 23.03 32.87 Gujarat State Fertilizers & Chemicals Ltd. 28.7621 22.99 34.87 Tata Global Beverages Ltd. 28.4807 20.86 41.94 BalrampurChini Mills Ltd. 28.1643 20.10 36.69 J S W Steel Ltd. 27.9286 17.37 38.27 E I D-Parry (India) Ltd. 27.9021 21.41 35.13 Reliance Capital Ltd. 27.8529 14.43 49.94 Hindalco Industries Ltd. 27.3021 13.82 37.48 Crisil Ltd. 27.1771 13.78 43.56 Grasim Industries Ltd. 26.7986 20.04 41.36 Aditya Birla Nuvo Ltd. 26.7021 12.89 47.69 Bata India Ltd. 26.5429 16.85 37.20 Satyam Computer Services Ltd. [Merged] 25.9562 10.58 65.64 Dr. Reddy'S Laboratories Ltd. 25.4650 14.38 44.37 Piramal Enterprises Ltd. 24.7393 15.94 34.50 Glaxosmithkline Consumer Healthcare Ltd. 24.4707 15.05 27.49 Shree Cement Ltd. 24.2200 20.30 33.47 Tata Power Co. Ltd. 23.2671 16.01 33.51 Ranbaxy Laboratories Ltd. [Merged] 23.0486 13.80 33.58 Infosys Ltd. 22.9814 12.20 36.14 Housing Development Finance Corpn. Ltd. 22.9029 12.33 45.38 Kotak Mahindra Bank Ltd. 22.6564 15.51 53.21 S K F India Ltd. 22.6036 13.93 34.28 Reliance Industries Ltd. 22.4964 17.71 25.72 Essar Oil Ltd. 22.2707 4.85 74.62 Mahindra & Mahindra Ltd. 21.9821 14.55 34.06 Crompton Greaves Ltd. 21.9707 14.64 35.46 Tata Motors Ltd. 21.9100 7.53 44.10 Asian Paints Ltd. 21.9043 19.88 24.70 SesaSterlite Ltd. 21.8857 11.22 34.74 Britannia Industries Ltd. 21.4193 18.94 24.63 Procter & Gamble Hygiene & Health Care Ltd. 21.1064 14.77 25.81 C E S C Ltd. 21.0957 8.33 43.80 Bajaj Electricals Ltd. 20.6879 14.18 30.79 Reliance Infrastructure Ltd. 20.5650 9.07 59.56 L I C Housing Finance Ltd. 20.3100 12.25 34.24 Nestle India Ltd. 20.0421 18.23 25.26 Exide Industries Ltd. 19.8736 12.82 22.84 Lupin Ltd. 19.4700 9.02 31.47 Hindustan Unilever Ltd. 19.4571 14.53 23.58 Glaxosmithkline Pharmaceuticals Ltd. 19.4336 13.54 25.07 Siemens Ltd. 19.2221 12.01 27.55
V
olum
e XVI Issue
II V
ersio
n I
63
( E)
Globa
l Jo
urna
l of H
uman
Soc
ial Sc
ienc
e
-
Year
2016
© 2016 Global Journals Inc. (US)
Ownership Trends in BSE 100-Index Companies from 2000 – 2014: Evidence and Implications

Thermax Ltd. 18.2650 13.87 30.35 I D B I Bank Ltd. 17.9079 9.43 23.33 Ashok Leyland Ltd. 17.2714 13.44 19.52 B E M L Ltd. 16.3757 9.24 25.66 Cummins India Ltd. 14.8121 13.35 16.56 Oil & Natural Gas Corpn. Ltd. 13.8886 12.58 17.16 A B B India Ltd. 13.8393 8.40 20.19 Godrej Industries Ltd. 13.5900 9.92 26.83 Pidilite Industries Ltd. 12.7200 10.69 16.33 Hero Motocorp Ltd. 12.4021 8.34 21.25 Sanofi India Ltd. 12.0850 10.80 13.23 Hindustan Zinc Ltd. 12.0371 1.73 33.45 Torrent Pharmaceuticals Ltd. 11.6021 7.78 19.68 State Bank Of India 11.5407 8.30 17.60 Mangalore Refinery & Petrochemicals Ltd. 11.3993 7.86 23.88 Bosch Ltd. 11.2200 8.68 14.09 Tata Communications Ltd. 11.1243 2.40 33.30 Hindustan Petroleum Corpn. Ltd. 10.8843 7.24 16.13 Oriental Bank Of Commerce 10.2479 6.09 19.67 Bharat Petroleum Corpn. Ltd. 9.0957 2.71 17.52 Dabur India Ltd. 8.0814 6.44 10.46 Bharat Electronics Ltd. 6.8693 3.95 15.99 Bharat Heavy Electricals Ltd. 4.2979 1.80 6.66 Steel Authority Of India Ltd. 3.6614 2.22 6.12
In the research study, the trends of non-
promoter’s non institutional holding in the 100 companies selected for the study in BSE 100 index is analyzed and it is found that M R F Ltd. (58.06 percent), is having the highest average non promoters non institutional holding of (58.06 percent) in last 15 years followed by Federal Bank Ltd. (47.73 percent), and Tata
Elxsi Ltd. (47.19 percent). The companies with lowest percentage of non-promoters non institutional holding are Bharat Heavy Electricals Ltd. (4.297 percent), Bharat Electronics Ltd. (6.87 percent) and Dabur India Ltd. (8.08 percent). The frequency distribution is shown below in Table 1.8.
Average Non Promoters Non Institutional Holding
Frequency
Percent
less than 10%
5 5.00%
10 - 20%
24
24.00%
20 - 30%
42
42.00%
30 - 40%
18
18.00%
40 – 50%
10
10.00%
more than 50%
1 1.00%
Total
100
100.00%
In the research study, it is also found that among the 100 companies selected for the study in BSE 100 index, only 1 percent of firms in BSE 100 Index are having average non-promoters non institutional holding of more than 50 percent of holding, 10 percent of the firms are having average non-promoters non institutional holding in the range of 40 - 50 percent of holding, 18 percent of the firms are found to have average non-promoters non institutional holding of 30 - 40 percent of holding, 42 percent of firms are found to have average non-promoters non institutional holding in the range of 20 - 30 percent of holding, 24 percent of firms are found to have average non-promoters non institutional holding
in the range of 10 - 20 percent of holding and 5 percent of the firms are having the average non promoters non institutional holding less than 10 percent of holding.
© 2016 Global Journals Inc. (US)
V
olum
e XVI Issue
II V
ersio
n I
64
( E)
Globa
l Jo
urna
l of H
uman
Soc
ial Sc
ienc
e
s
-
Year
2016
Table 1.8 : Frequency distribution of firm’s w.r.t average non promoter non institutional holding for the period 2000-2014
Ownership Trends in BSE 100-Index Companies from 2000 – 2014: Evidence and Implications

IV. Conclusion In this study, there is empirical confirmation of
the predominance of concentrated ownership and control in corporate India. Out of the BSE 100-Index companies the number of dominant ownership entities (promoters), nearly 42percent of firms are having more than 50 percent of shareholding which indicates that there is concentration of ownership in the hands of promoters. Such entrenchment and control offers immense potential to the owners/controllers for tunneling and personal enrichment at the expense of absentee shareholders.
However, only 1 percent of firms are having more than 50 percent of average non promoters institutional holding as well as average non promoters non institutional holding. 35 percent of firms are found to have average non promoters institutional holding in the range of 20 – 30 percent of shareholding. In case of average non promoters non institutional holding it is found that 42 percent of firms are having 20-30% of shareholding. It indicates that institutional as well as retail shareholders don’t have the majority powers. In line with the trends in other developed markets, non-institutional retail shareholdings are on the declining mode in the country. In the BSE 100-Index companies, much of these holdings were picked up by the promoters to boost their entrenchment and as a defense against hostile takeovers.
References Références Referencias
1. Aguilera, R., Kabbach de Castro, L., Lee, J., You, J. (2011). Corporate Governance in Emerging Markets.
In G. Morgan and R. Whitley (Ed.), Capitalisms and Capitalism in the 21st Century. Oxford: Oxford University Press.
2. Bainbridge, Stephen M (2002). Director Primacy: The Means and Ends of corporate Governance. University of California School of Law, Research Paper no. 02–06.
3. Bainbridge, Stephen M (2005). Director Primacy and Shareholder Disempowerment, University of
California. Los Angeles School of Law. Law & Economics Research Paper no. 05–25.
4. Balasubramanian, N., Barua S. K. and Karthik D. (2013).Corporate Governance Issues in Executive Compensation – The Indian Experience: 2008 – 2012, Research Paper, National Stock Exchange of India, Mumbai; Indian Institute of Management Bangalore – Centre for Corporate Governance and Citizenship, Bangalore; Indian Institute of Management Ahmedabad.
5. Baysinger, B. D, Kosnik, R. D., & Turk, T. A. (1991). Effects of Board and Ownership Structure on Corporate R&D Strategy. Academy Of Management Journal, 34(1), 205-214.
6. Bebchuk, L. A. (2005).The Case for Increasing Shareholder Power. Harvard Law Review, 118, 833–917.
7. Bebchuk, L. A. (2006). Letting Shareholders Set the Rules. Harvard Law Review, 119, 1784–181.
8. Berle, A. & Means G. (1932). The Modern Corporation and Private Property: the 1967 revision. Harcourt, Brace & World, Inc., New York.
9. Claessens S. & Joseph P.H. (2002). Corporate Governance in Asia: A Survey. International Review of Finance, 3:2, 105–129.
10. David, P., Kochhar, R., & Levitas, E. (1998). Research Notes- The Effect of Institutional Investors on the Level and Mix of CEO Compensation. Academy Of Management Journal, 41(2), 200-208.
11. Dodd, E. M. (1932). For Whom Are Corporate Managers Trustees?. Harvard Law Review, 45, 7, 1145-1163.
12. Goodstein, J. & Boeker, W. (1991).Turbulence at the Top: A New Perspective on Governance Structure Changes and Strategic Change. Academy Of Management Journal, 34(2), 306-330.
13. Grossman, S., & Oliver, H.(1988). One share-one vote and the market for corporate control. Journal of Financial Economics20, 175-202.
14. Jensen, M. & William, M. (1976). Theory of the firm: Managerial behavior, agency costs, and ownership structure. Journal of Financial Economics 3, 305-360.
0.00%
10.00%
20.00%
30.00%
40.00%
50.00%
less than 10%
10 - 20% 20 - 30% 30 - 40% 40 – 50% more than 50%
V
olum
e XVI Issue
II V
ersio
n I
65
( E)
Globa
l Jo
urna
l of H
uman
Soc
ial Sc
ienc
e
-
Year
2016
© 2016 Global Journals Inc. (US)
The Frequency Distribution is also shown with the help of graph shown in figure 4.
Ownership Trends in BSE 100-Index Companies from 2000 – 2014: Evidence and Implications

15. La Porta, R., Lopez-de-Silanes, F., & Shleifer, A. (1999). Corporate Ownership around the World. Journal of Finance, 54, 2, 471-517.
16. Stout, L. A. (2002). Bad and Not So Bad Arguments for Shareholder Primacy. Southern California Law Review, 75, 1189 – 1209.
17. Strine Jr., Leo, E. (2006). Towards a True Corporate Republic: A Traditionalist Response to Lucian’s Solution for Improving Corporate America. Harvard Law and Economics Discussion Paper, No 541.
18. Wright, P., Ferris, S. P., Sarin, A. & Awasthi, V. (1996). Impact of Corporate Insider, Blockholder and Institutional Equity Ownership on Firm Risk Taking. Academy Of Management Journal, 39, 2, 441-463.
© 2016 Global Journals Inc. (US)
V
olum
e XVI Issue
II V
ersio
n I
66
( E)
Globa
l Jo
urna
l of H
uman
Soc
ial Sc
ienc
e
s
-
Year
2016
Ownership Trends in BSE 100-Index Companies from 2000 – 2014: Evidence and Implications