ownership structure and risk in publicly held and
TRANSCRIPT
HAL Id: hal-00918543https://hal-unilim.archives-ouvertes.fr/hal-00918543
Submitted on 16 Dec 2013
HAL is a multi-disciplinary open accessarchive for the deposit and dissemination of sci-entific research documents, whether they are pub-lished or not. The documents may come fromteaching and research institutions in France orabroad, or from public or private research centers.
L’archive ouverte pluridisciplinaire HAL, estdestinée au dépôt et à la diffusion de documentsscientifiques de niveau recherche, publiés ou non,émanant des établissements d’enseignement et derecherche français ou étrangers, des laboratoirespublics ou privés.
Ownership Structure and Risk in Publicly Held andPrivately Owned Banks
Thierno Amadou Barry, Laetitia Lepetit, Amine Tarazi
To cite this version:Thierno Amadou Barry, Laetitia Lepetit, Amine Tarazi. Ownership Structure and Risk in PubliclyHeld and Privately Owned Banks. Journal of Banking and Finance, Elsevier, 2011, 35 (5), pp.1237-1340. �10.1016/j.jbankfin.2010.10.004�. �hal-00918543�

Electronic copy available at: http://ssrn.com/abstract=1460703
1
OWNERSHIP STRUCTURE AND RISK IN PUBLICLY HELD
AND PRIVATELY OWNED BANKS
Thierno Amadou Barry, Laetitia Lepetit and Amine Tarazi1
Université de Limoges, LAPE, 5 rue Félix Eboué, 87031 Limoges Cedex, France
November 2009
Abstract
Using detailed ownership data for a sample of European commercial banks, we
analyze the link between ownership structure and risk in both privately owned and
publicly held banks. We consider five categories of shareholders (managers/directors,
institutional investors, non-financial companies, individuals/families, and banks), a
breakdown specific to our dataset. Controlling for various factors, we find that
ownership structure is significant in explaining risk differences but that such findings
mainly hold for privately owned banks. On the whole, a higher equity stake of either
individuals/families or banking institutions is associated with a decrease in asset risk
and default risk. Also, institutional investors and non-financial companies seem to
impose the riskiest strategies when they hold higher stakes. We further find no
significant differences in asset risk and default risk between publicly-held and
privately-owned banks. Moreover, for public banks, changes in ownership structure
do not affect risk taking. Market forces seem to align the risk-taking behavior of
public banks and the ownership structure is no more a determinant to explain risk
differences. An exception is that higher stakes of banking institutions in public banks
are associated with lower credit and default risk.
Keywords: Ownership structure, bank risk, European banks, Market Discipline
JEL Classification: G21, G32
1 Corresponding authors: Tel: +33-555-14-92-08, [email protected] (T. Barry);
[email protected] (L. Lepetit); [email protected] (A. Tarazi).

Electronic copy available at: http://ssrn.com/abstract=1460703
2
1. Introduction
The last three decades have been characterized by repeated banking crises (the
financial crisis of 2008, the US savings and loans debacle of the eighties, the 1994-95
Mexican crisis, the 1997 Asian and 1998 Russian financial crises…). Such episodes
highlight the inherently unstable nature of banking and the tendency that banks have
towards excessive risk taking. In this paper, we aim to focus on one of the driving
forces behind the risk-taking incentives of banks, namely shareholders’ behavior and
their incentives to take higher risk. The issue of ownership structure is of particular
interest for the banking industry as several factors interact and alter governance, such
as the quality of bank regulation and supervision and the opacity of bank assets.
Moreover, banking systems faced major changes during the last 20 years. With
financial deregulation and market integration, the scope of activities of banks has
been completely reshaped ranging from traditional intermediation products to an array
of new businesses. These trends led to substantial consolidation in the banking
industry and consequently to significant changes in ownership and capital structure.
Also, institutional ownership of common stock has increased substantially over the
past twenty years. This might also imply changes in corporate governance and in
banks’ behavior in terms of risk taking.
However, it is also well known that because of greater separation of ownership
and control, firms with publicly held equity face different agency problems than
privately held firms. Furthermore, for publicly traded banks, risk-taking incentives
can be influenced by market forces. On the one hand, the market is expected to
monitor or to influence the risk behavior of banks and therefore the impact of
ownership changes on risk cannot be assessed without considering incentives driven
by financial markets in terms of discipline (Bliss and Flannery, 2002; Flannery,
2001). In the new Basel Capital Accord, market discipline is one of the three pillars,
along with capital regulation (first pillar) and banking supervision (second pillar). The
idea is to rely on market forces to enhance banking supervision or to mitigate
shareholders’ risk taking incentives and consequently market discipline is expected to
play an important role for publicly held banks and to some extent for private banks
that are strongly reliant on market debt. On the other hand, banks that are prone to
become public might have different objectives in terms of growth and risk-return
strategies. Public equity is more liquid than private equity and can thus be raised at

Electronic copy available at: http://ssrn.com/abstract=1460703
3
lower cost. Hence, if publicly owned banks’ purpose to access capital markets is to
finance faster growth opportunities, they are more likely to take on more risk than
privately owned banks.
To our knowledge there has been no research on whether risk might be
different for privately-owned banks and publicly-held banks under specific ownership
profiles. Kwan (2004), working on a sample of US bank holding companies (BHC),
finds that loan quality and earnings variability are not different between traded BHCs
and privately held BHCs. One of our aims in this paper is to assess the risk-taking
behavior of banks by combining the two interrelated dimensions of ownership
structure and market discipline.
It has been stressed in the theoretical and empirical literature that agency
problems and risk-taking behavior are different according to the nature of the
shareholder. A first issue is the conflict of interest between managers and
shareholders identified by Jensen and Meckling (1976). Theory indicates that
shareholders with a diversified portfolio are motivated to take more risk for a higher
expected return whereas managers take less risk to protect their position and personal
benefits, and preserve their acquired human capital (Galai and Masulis, 1976; Jensen
and Meckling, 1976; Demsetz and Lehn, 1985; Esty, 1998). Empirically, Saunders et
al (1990) are the first to test the relationship between banks’ ownership structure and
their risk-taking incentives. They find a positive relationship between managerial
stock ownership (proportion of stock held by managers) and risk taking. Moreover,
they find that banks controlled by shareholders take more risk than banks controlled
by managers. A number of studies, following Saunders et al. (1990), find a significant
effect of ownership concentration on risk-taking but without any consensus on the
sign of such a relationship. If some studies find a negative relationship, others obtain
U-shaped relationships (or inverse U-shaped) between ownership concentration and
risk (Gorton and Rosen, 1995; Chen, et al., 1998; Anderson and Fraser, 2000). U-
shaped relationships between ownership and risk taking could be explained by
managers’ entrenchment. Moreover, Sullivan and Spong (2007) show that stock
ownership by hired managers is positively linked with bank risk, meaning that under
certain conditions hired managers operate their bank more closely in line with
stockholder interests.
Another issue well developed in the literature is the comparison of the
performance (profitability and asset quality) of state-owned banks compared to their

4
private counterparts. Agency costs within government bureaucracy can result in weak
managerial incentives and misallocation of resources. According to the agency cost
view, managers exert less effort than their private counterparts or divert resources for
personal benefits, such as, for example, career concerns. For the political view of state
ownership, government-owned banks are inefficient because of the politicians’
deliberate policy of transferring resources to their supporters (Shleifer, 1998; Shleifer
and Vishny, 1986). It has been underlined that state-owned banks have poorer loan
quality and higher default risk than private-owned banks (Berger et al., 2005; Iannotta
et al., 2007). Iannota et al, 2007 also highlight that mutual banks and government-
owned banks appear as less profitable than private-owned banks. Moreover, they find
that government-owned banks have poorer loan quality and higher default risk, while
mutual banks have better loan quality and lower asset risk than both private-owned
and government-owned banks. In addition, some papers have shown that foreign-
owned banks exhibit a higher performance than other banks, particularly in
developing countries (Claessens et al., 2001; Bonin et al, 2005; Micco et al., 2007).
Beside the issues of the manager owner conflict and the differences between
state-owned and private-owned firms, there are other aspects that are well developed
in the literature on non-financial firms but not in the literature on financial firms.
First, institutional investors (investment companies, investment advisors, pension
funds…) who exercise significant voting power can shape the nature of corporate risk
taking. In terms of shareholding size, expertise in processing information and
monitoring managers, such investors are very different from atomistic individual
investors. Institutional investors can exert greater control for reasons of economies of
scale in corporate supervision. Pound (1988) highlights that institutional investors can
exercise a control at a lower cost as they have more experience. There is also the
possibility, however, that managers and institutional investors form an alliance, so
that insider interests could take priority over the maximization of firm value. At the
same time, as institutional investors have a diversified portfolio of investments, they
may have lower incentives to exercise control. Empirical evidence (Acker and
Athanassakos, 2003), based on non-financial firms, does not provide conclusive
results on the effect of control by institutional investors on firm value. Second,
family-owned firms are perceived as less willing to take risk but also as less
profitable. More generally, firms with large, undiversified owners such as founding
families may forgo maximum profits because their wealth is not sufficiently
5
diversified. Families also limit executive management positions to family members,
suggesting a restricted labor pool from which to obtain qualified and capable talent,
potentially leading to competitive disadvantages relatively to non-family-owned firms
(Morck et al, 2000). However, James (1999) posits that families have longer
investment horizons leading to greater investment efficiency. Stein (1988, 1989)
shows that the presence of shareholders with relatively long investment horizons can
mitigate the incentives for myopic investment decisions by managers. Regarding the
banking industry, few papers analyze this issue. Laeven (1999) considers different
forms of bank ownership including state-owned, foreign-owned, company-owned and
family-owned banks but not banks owned by institutional investors. Working on a
panel of Asian banks before the Asian crisis of 1997, he finds that family-owned
banks were among the most risky banks together with company-owned banks whereas
foreign-owned banks took little risk relatively to other banks.
The objective of this paper is to extend the current literature which analyzes
how ownership structure affects bank risk taking and profitability in several
directions. First, we work on a broader classification of shareholders by considering
the equity held by managers, individuals/families, non-financial companies, but also
the equity held by institutional investors and by banks. Second, we consider the
proportion of equity held by each category of owner instead of using dummy
variables to divide ownership into mutually exclusive categories as in most of the
previous studies on bank ownership (Berger et al., 2005; Bonin et al., 2005; Boubakri
et al., 2005; Williams and Nguyen, 2005). We are therefore able to measure the level
of ownership dispersion/concentration within each of the five categories of
shareholders we consider. We can hence check if the level of ownership dispersion
matters when assessing the relationship between ownership structure and bank
risk/profitability. Working with continuous variables instead of binary variables also
enables us to analyze how the interaction of equity held by different types of
shareholders influences the risk-taking behavior of banks. It allows us to study the
link between ownership structure and risk more thoroughly by dealing with the issue
of possible coalitions among different categories or groups. Nevertheless, for
consistency with previous studies we also study the link between risk and the nature
of the main shareholder. Third, by investigating the link between ownership structure
and risk for both listed (publicly held) and non-listed (privately owned) banks we

6
question the ability of market forces to influence bank risk-taking behavior (market
discipline) under different ownership arrangements. Fourth, previous studies that use
a detailed breakdown of the stakes held by different categories of owners were mostly
dedicated to US banks and could not consider as many categories of shareholders
because ownership of banks by non-financial companies is not permitted. By working
on European banks we are therefore able to introduce an additional category, non-
financial firms, which the literature considers as playing a very controversial role in
influencing the management of financial institutions. Studies on European banks have
focused on the nature of ownership (public, private, mutual, cooperative…) rather
than on the structure of ownership in private banks. In this paper we consider only
one category of banks. We focus on commercial banks because they are assumed to
have homogeneous objective functions, and to our knowledge this is the first study
that looks into the relationship between ownership structure and risk for European
commercial banks.
We work on a panel of European banks through the period 1999-2005. Our
results show that different ownership structures imply different levels of risk and
profitability, but such findings mainly hold for privately owned banks. Publicly-held
banks with different ownership structures do not present different levels of risk and
profitability, suggesting that market forces might be aligning the risk behavior of such
banks.
The remainder of the paper is structured as follows. Section 2 describes our
data and variables. Section 3 presents the methodology and the hypotheses tested. The
empirical results are discussed in section 4. Section 5 reports robustness checks and
discusses further issues. Section 6 concludes the paper.
2. Data, variables and descriptive statistics
2.1 Data collection and sample definition
The annual data used in this paper are taken from Bankscope Fitch IBCA
which provides information on financial statements and ownership structure for
financial institutions worldwide. We collect the percentage of stocks held by
shareholders by considering the following items: managers/directors, institutional
investors, non-financial companies, self ownership, individual/family investors,
banks, foundations/research institutes, government, unnamed private shareholders and

7
other unnamed shareholders. Bankscope Fitch IBCA also provides for listed banks
data on the percentage of stocks held by the public. We use a sample consisting of an
unbalanced panel of annual report data from 1999 to 2005 for a set of European
commercial banks established in 16 Western European countries: Austria, Belgium,
Denmark, Finland, France, Germany, Greece, Ireland, Italy, Luxembourg,
Netherlands, Portugal, Spain, Sweden, Switzerland and United-Kingdom2. As argued
above, we do not consider other types of banks (cooperative, mutual…) to ensure that
all the banks in our sample follow the same profit maximization objective
(homogeneous objective function). We identify in Bankscope 1586 commercial banks
for which income statements and balance sheets are provided for the period 1999-
20053. We delete all the banks with less than five consecutive years of time series
observations4, which leaves us with 688 banks. Out of this number of banks, we
isolate 320 banks for which detailed data on direct ownership are available for the
years 2001, 2003 and 2005 in the annual financial statement5. Eventually, we apply
other selection criteria and end up with a smaller sample of banks. First, we only
consider banks with a stable ownership structure by comparing the proportion of
equity held by the main shareholders over the period 1999-2005. This restriction is
important to accurately analyze the impact of ownership structure on the performance
and risk of banks. Since our aim is to focus on the influence of different categories of
shareholders on management, we need to exclude short run ownership and hit and run
strategies that will not shape the behavior of management and therefore bank
risk/profitability in a given direction. We hence only keep banks for which the
ownership shares of the main category of shareholders fluctuate by less than 10%
over the considered period. 249 banks are consistent with this criterion which enables
us to work on a firm-level homogeneous sample. The final sample consists of 249
2 Norway is excluded from our analysis because no banks provide data consistent with the criteria we
use to build and clean our database. 3 All the banks in our sample publish their annual financial statements at the end of the calendar year.
We consider local Generally Accepted Accounting Principles (GAAP) for all our sample period. 4 This condition enables us to accurately compute the standard deviations of some variables to define
risk indicators. 5 Each annual financial statement provides information on the ownership structure of banks for the
current year and the previous two years. The report of the year 2001 therefore gives information on the
ownership structure of the years 1999, 2000 and 2001. In our study, we consider the direct owner that
can be different from the ultimate owner (for example 20% of a bank’s stocks can be owned by a firm
(direct owner) in which a family might have a stake of 10%...). We use direct ownership in order to
consider the different categories that directly exert control. We do not consider the ultimate owners
because Bankscope only provides information on such owners since 2004 and only for shareholders
with stakes higher than 25%.

8
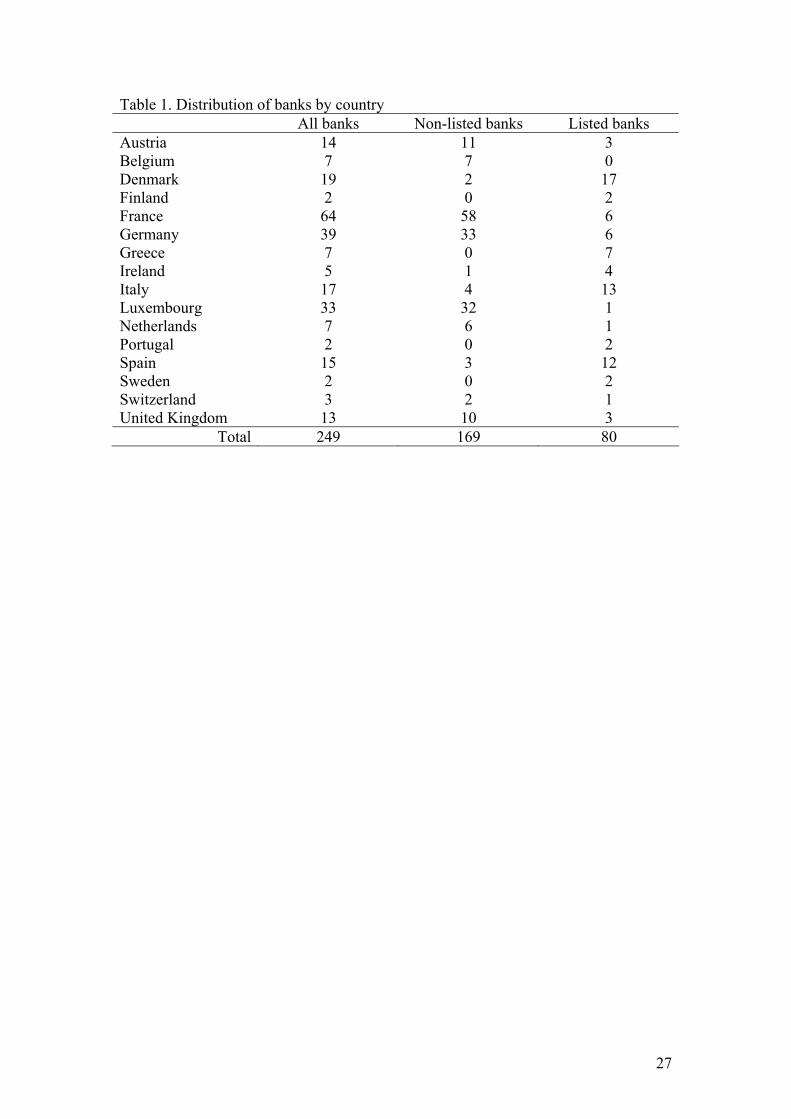
European commercial banks within which 80 are listed publicly traded banks6 (see
Table 1 for further details on the distribution of banks by country). Among these
banks, 191 banks have a major shareholder with a stake above 50% throughout the
whole sample period and 58 banks (out of which 44 are listed) exhibit ownership
shares by the main shareholder fluctuating by less than 10%. We also consider a
subsample that satisfies the criteria that the sum of the different shares that are
displayed in Bankscope is at least equal to 99%7. This criterion leaves us with 198
banks, within which 29 are listed. We test the robustness of our results by running our
estimations on both the large sample of 249 banks and on the restricted sample of 198
banks. We also conduct estimations on the sample of 191 banks for which we have a
major shareholder with a stake above 50% to be consistent with previous studies.
Insert Table 1 here
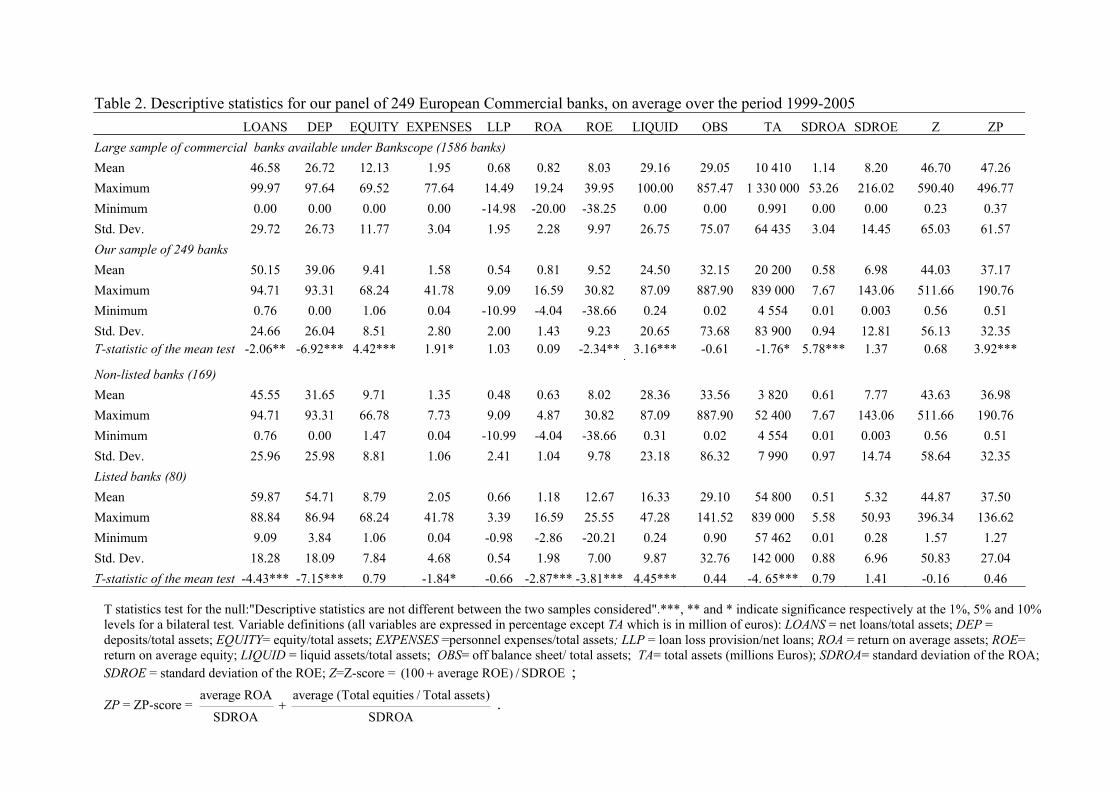
Table 2 presents some descriptive statistics for both our sample of 249 banks
and the largest sample of 1586 commercial banks available under Bankscope Fitch
IBCA for our period of analysis. We use data from consolidated accounts if available
and from unconsolidated accounts otherwise.
Insert Table 2 here
2.2 Risk variables
We consider different measures of asset risk and default risk commonly used
in the literature. We compute three standard measures of risk for each bank
throughout the period under study based on annual accounting data: the standard
deviation of the return on average assets (SDROA), the standard deviation of the
return on average equity (SDROE)8, and the mean of the ratio of loan loss provisions
to net loans (M_LLP). We also compute default risk measures. First we use the “Z-
score” proposed by Boyd and Graham (1986) which indicates the probability of
6 Our full dataset contains 137 listed banks. We need to delete: (i) 7 banks with less than five years of
time series observations; (ii) 31 banks for which ownership is not detailed in the three reports provided
for the years 2001, 2003 and 2005; (iii) 19 banks that exhibit a change in ownership structure between
1999 and 2005. 7 The data on ownership structure provided by Bankscope (% share of each type of owner) do not
always add up to 100%, particularly for listed banks because we do not always have the percentage
held by the public. 8 We define average equity and average assets at time t as: (amount outstanding at time t + amount
outstanding at time t-1)/2.

9
failure of a given bank (Z)9. Higher values of Z-scores imply lower probabilities of
failure. Second, we use the ZP Score (ZP) as in Goyeau and Tarazi (1992) and Lepetit
et al. (2008) and its two additive components10
(ZP1 and ZP2). ZP1 is a measure of
bank portfolio risk whereas ZP2 is a measure of leverage risk.
Table 2 provides statistics for some of our measures of asset risk and default
risk, on average for the whole sample of banks, and for the panel of non-listed and
listed banks. Mean tests show that we do not have significant differences in risk
between our two samples of publicly-owned and privately-owned banks. These results
are consistent with Kwan (2004) who works on a panel of US banks. However, unlike
his findings our sample of European public banks exhibits, on average, a higher
profitability than our sample of European private banks. A higher profitability for
listed banks could be explained by the fact that such banks can raise additional equity
capital at lower transaction costs, which enables them to generate faster growth in
equity and assets and ultimately to become larger. These banks might benefit from
economies of scale and generate higher profit per unit of risk than private banks.
2.3 Ownership variables
In our study, we code the ownership structure based on the stockholder
information contained in the BankScope database. As our aim is to analyze how the
interaction of equity held by different types of shareholders influences the risk-taking
behavior of banks, we have to consider as many categories of owners as we can.
However, we only keep the categories of owners for which we are able to identify
their nature, behavior and incentives to take risk. We therefore exclude three
categories of owners provided by BankScope: public, unnamed private shareholders
and other unnamed shareholders. We also require each category of owner to hold
equity in at least five banks. These criteria lead us to exclude three categories of
owners, which are self owned, foundation and government11
.
Consequently, we end up with five categories of owners that are considered in
our study: (i) managers/directors (MANAGER); (ii) non-financial companies
(COMPANY); (iii) individual/family investors (FAMILY); (iv) banks (BANK); and (v)
9 )Z (100 average ROE / SDROE= + , where ROE and SDROE are expressed in percentage.
10 ZP=ZP1 + ZP2 = average ROA average(Totalequities / Totalassets)
SDROA SDROA+ .
11 Few European banks have equity held by governments, and those that do are mostly German
cooperative banks which we do not consider in our sample.
10
institutional investors - insurance company, financial companies and mutual &
pension funds - (INSTITUT). We create five variables which report for each bank in
our sample the proportion of equity held by each category of owner. This approach
allows us to measure the dispersion of ownership and also to analyze the influence of
different combinations of shareholders on bank risk and profitability. It also enables
us to account for possible coalitions among different categories of shareholders.
Table A1 in the appendix gives, per country, the distribution of banks for
which the ownership variables are different from zero as well as the average
percentage of stock held by the different categories of owners. Tables 3, 4 and 5
provide some statistics about the ownership structure of our 249 sample banks. Table
3 shows that the major category of shareholders, in our sample of 249 European
commercial banks, are other banking institutions with an average of 81.52% of equity.
Banks that hold equity in another bank exhibit on average higher stakes in non-listed
banks than in listed banks. Non-financial companies and institutional investors are
also strongly involved in our sample banks as they hold equity in respectively 78 and
55 banks out of the 249 banks of our sample. Non-financial companies hold on
average a higher percentage of equity (39.48%) than institutional investors (35.40%).
A closer look shows that non-financial companies and institutional investors are more
often involved in listed banks but they hold a higher proportion of total equity in non-
listed banks. Individuals/families are involved in a relatively few number of listed and
non-listed banks (25 banks) ; they are more often involved in listed banks but they
hold a higher proportion of equity in privately-owned banks (50.39%) than in
publicly-held banks (5.87%). The category managers/directors holds equity in only 8
banks out of which 7 are listed banks and the average proportion of stocks they hold is
very low (9.51%) compared to the other types of owners.
Table 4 displays the distribution of our sample of non-listed and listed banks
according to the percentage of equity held by each category of shareholder. The
proportion of equity of each category of owner (except managers/directors) are well
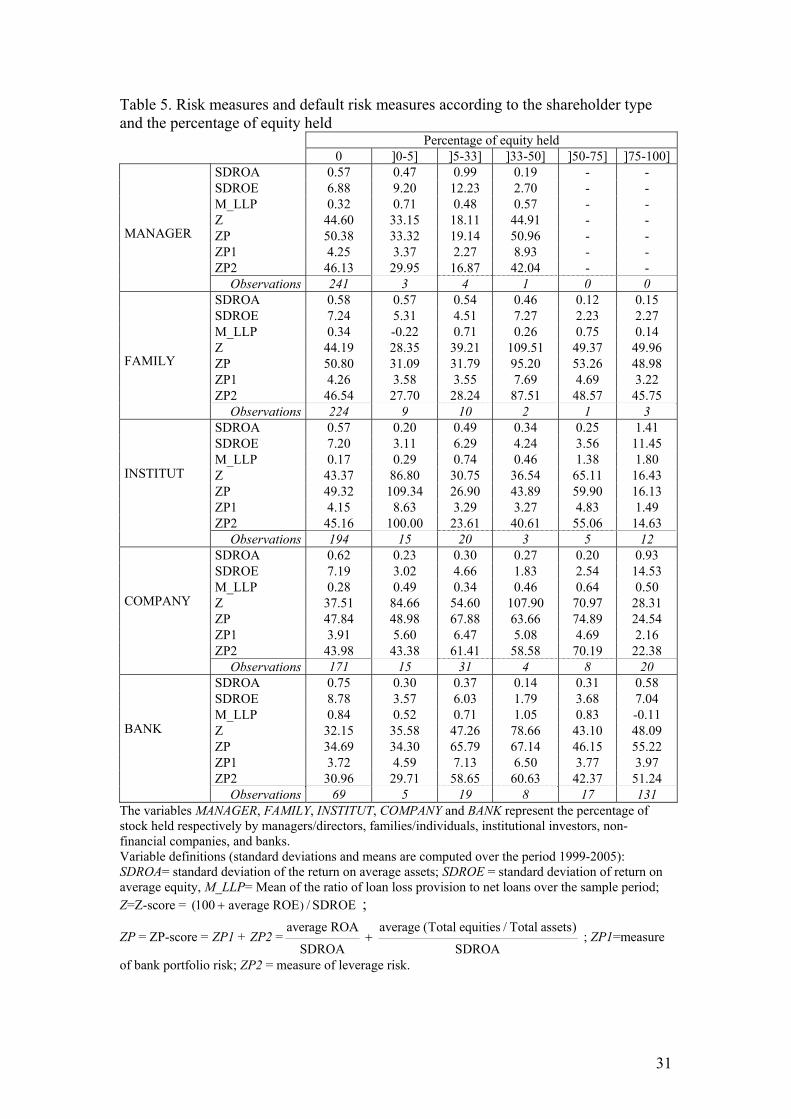
distributed in the interval ]0-100]. In Table 5, we also present the mean of each risk
and default indicator for each of our five categories of owners according to the
proportion of equity they hold. Table 5 shows strong heterogeneity among different
types of shareholders, allowing us to analyze the behavior of banks depending on their
ownership structure.

11
We also compare asset risk, default risk, profitability and asset growth of
public and private banks when held by the same main category of shareholders12
(see
Figure 1). While Figure 1 shows differences in asset risk and profitability between
listed and non-listed banks for a given shareholder type, these differences are not
statistically significant. Interestingly, however, we find that public banks exhibit
higher average asset growth rate than private banks, regardless of the category of the
main shareholder. These results suggest that, as discussed above, public banks might
actually choose to raise equity more easily and at lower cost to generate faster growth.
Insert Tables 3, 4 and 5 and Figure 1 here
We further measure the ownership dispersion/concentration of our sample of
European commercials banks in order to analyze its possible impact on the risk-taking
behavior of banks. The effects of ownership concentration on firm performance are
theoretically complex and empirically ambiguous. Several approaches have been
proposed to explain the ambiguity of the relationship between ownership
concentration and firm performance. Shleifer and Vishny (1986) and Aghion and
Tirole (1997) show that a concentrated ownership might improve the performance of
firms by increasing monitoring and alleviating the free-rider problem in takeovers.
But other theoretical works show that large shareholders might exercise control rights
in order to create private benefits and sometimes to expropriate smaller investors
(Shleifer and Vishny, 1997). Another potential cost of concentration may result if
managerial initiative is repressed by excessive monitoring (Burkart et al., 1997).
Our data provide the proportions of total equity held by different categories of
owners but not the stakes held by each investor at the individual level. We therefore
need to check if the level of ownership dispersion within each of the five categories of
shareholders we consider matters or not when assessing the relationship between
ownership structure and bank risk/profitability. For this purpose we measure
ownership dispersion/concentration by computing a Herfindahl index for each of our
five categories of shareholders13
(HERF_MANAGER, HERF_FAMILY,
12 The main category of shareholders is defined as the one with the highest level of equity holding.
13 For example, for the category INSTITUT, we compute for each bank i the variable OSj defined by the
ratio of the percentage of equity held by each institutional investor j to the total percentage of equity
held by all the institutional investors. We then compute our Herfindahl index as n
2
j=1jOS∑ (j represents

12
HERF_INSTITUT, HERF_COMPANY and HERF_BANK). Table 6 highlights that, on
average, ownership is relatively well concentrated for all the categories of
shareholders. This is consistent with the studies of La Porta et al. (1999) and Becht
and Roell (1999) who highlight that ownership structure of firms across the world
present a relatively high degree of ownership concentration. Tables 6 and 7 show that
the category MANAGER presents the highest level of ownership concentration with a
Herfindahl index of 0.948 and on average 1.12 shareholders per bank. The category
BANK also exhibits a relatively high level of ownership concentration followed by
FAMILY and INSTITUT. The category with the highest number of shareholders per
bank is COMPANY, with an average of 4.25 shareholders and a maximum of 66
shareholders involved in the same bank.
Table 8 shows no significant differences in terms of risk and profitability
between banks with a relatively high level of concentration for the categories of
FAMILY, INSTITUT and COMPANY and those with a relatively low level of
ownership concentration in these categories. At first sight, there seems to be no
impact of ownership concentration/dispersion on the risk-taking behavior of banks.
When banks hold equity in other banks and their stakes are very concentrated, we find
that asset risk and profitability are significantly higher compared to banks with a more
dispersed bank ownership.
Insert Tables 6, 7 and 8 here
Finally, we compare our sample of commercial banks with the larger
population of European commercial banks contained in Bankscope by looking at
possible differences between the importance of each category of owner in our sample
of 249 banks and those of the largest sample of 905 banks for which Bankscope Fitch
IBCA provides information on the ownership structure in 2005. The frequencies of
banks for which each category of owner holds a positive percentage of equity in our
sample (see Table 3) are not significantly different from those of the largest sample of
905 banks (see Table A2 in appendix)14
. However, the average percentage of equity
the category of shareholders INSTITUT and n the total number of institutional investors that hold equity
in the bank i). For example if we have for bank i two institutional investors holding 10% of total equity
and 45% of total equity, our Herfindahl index will take the value of 0.70, indicating a relatively high
level of concentration for the category INSTITUT.
14 The mean tests performed are available from the authors on request.

13
held by the five categories of owners that we consider is higher in our sample of 249
banks than in the larger sample of 905 banks. This difference could be explained by
our choice to restrict our analysis to banks with a stable ownership structure
throughout our sample period. Investors who hold a stable stake in financial firms
might be more strongly involved in equity than investors with more diversified
portfolios and/or shorter investment horizons.
3. Method and hypotheses tested
Our objective is first to analyze if commercial banks with different ownership
structures present significant differences in risk and profitability. Second, we also
investigate whether market discipline can influence the relationship between
ownership structure and risk. We therefore test two hypotheses by considering two
specifications.
Hypothesis 1: Different ownership structures imply different levels of risk and
profitability.
We use the following econometric model to test hypothesis 1:
Model 1
i 0 1 i 2 i 3 i 4 i 5 i
6 i 7 i 8 i 9 i
15
10 i j j i
j 1
Y MANAGER FAMILY COMPANY BANK LISTED
M_LNTA M_OEQUITY M_DEPOSIT LAMBDA
LAMBDA*LISTED COUNTRY=
= α + α +α + α + α +α+ α + α + α + α+ α + γ + ε∑
where: Yi is either a measure of asset risk (SDROA, SDROE and M_LLP), default
risk (Z, ZP, ZP1 and ZP2) or a measure of profitability (the mean of the return on
average assets -M_ROA - and the mean of the return on average equity - M_ROE-)15
;
MANAGER, FAMILY, COMPANY and BANK represent the percentage of stock held
respectively by managers/directors, families/individuals, non-financial companies,
and banks; LISTED is a dummy variable which takes the value of one if the bank is
listed on the stock market and zero otherwise; M_LNTA is the mean of the natural
logarithm of total assets; M_OEQUITY is the mean of the ratio of equity to total assets
15 We do not include an independent variable reflecting asset risk when we consider profitability as the
dependent variable because we have a high degree of colinearity between our ownership variables and
asset risk.

14
orthogonalized with TA; M_DEPOSIT is the mean of the ratio of deposits to total
assets; LAMBDA is the inverse Mills ratio estimated for each bank from the first-stage
Probit model; COUNTRY is a country dummy variable.
We consider five categories of owners that may influence the risk-taking
behavior of banks (MANAGER, FAMILY, COMPANY, BANK and INSTITUT). In our
specification, we remove INSTITUT from Model 1 in order to use institutional
investors as a benchmark ownership share. The theoretical link between risk and
institutional ownership is the most settled. As institutional investors hold shares in
sufficiently diversified investment portfolios, they are assumed to favor all positive
net present value investments at the individual bank level. As shareholders,
institutional investors are indifferent to the riskiness of an investment in a specific
bank and are only concerned about expected return. By removing INSTITUT from our
set of independent variables, we are able to analyze, with Model 1, if a shift in
ownership from institutional investors to another category of owners results in an
increase or a decrease in risk and profitability (see Appendix 2 for details). The
excluded shareholder group INSTITUT is the benchmark against which the signs and
the magnitudes of the coefficients on the four other ownership shares are evaluated.
The theory regarding the attitude of individuals and families toward risk
stipulates that their portfolio is less diversified than those of other shareholders,
particularly institutional investors, and they therefore have incentives to take less risk
because if the bank fails they lose more compared to other shareholders. We therefore
expect that a shift in equity from institutional investors (INSTITUT) to
individuals/families (FAMILY) implies a decrease in risk16
( 2α negative).
Previous studies that analyzed the incentives of managers/directors to take risk
were mostly dedicated to US firms. Most studies have shown that when a
manager/director holds a small share of the bank’s equity, she/he may have incentives
to take less risk. If the bank fails, she/he loses both her reputation and human capital
investment. Our MANAGER variable is very close to the proxy used by Saunders et al.
(1990) which is computed as the number of shares held by executive and directors
divided by the total number of shares outstanding. Note that the underlying
16 We give here the expected sign for the measures of asset risk (SDROA, SDROE and M_LLP). We
expect the opposite sign for the default risk measures (Z and ZP) as a lower Z-score value implies a
higher probability of failure.

15
assumption in the literature is that a low proportion of stocks held by managers is
associated with a low share of the bank’s stocks in the managers’ non-human wealth.
Also, a higher proportion of stocks held by managers is assumed to align their interest
with those of shareholders as long as the larger investment in the bank’s stocks does
not prevent them from holding diversified portfolios. In our study, we do not have
information about managers’ wealth and the level of diversification of their
investment portfolio. We assume that the portfolio of managers is less diversified than
those of our benchmark, institutional investors. We therefore expect a negative
coefficient for the variable MANAGER ( 1α negative).
We also consider shares held by non-financial companies (COMPANY). Banks
with a large portion of stocks held by firms are prone to increase the riskiness of loans
granted to owners. Moreover, if a bank is behind an industrial group, the group
management will have incentives to manipulate the bank to maximize the wealth of
ultimate owners. Therefore, banks that are controlled by firms might have incentives
to encourage riskier strategies than other categories such as families and individuals.
Also, it could be argued that non-financial companies might hold sufficiently
diversified asset portfolios just like institutional investors. If this is the case, their risk
incentives could be aligned with those of institutional investors. However our data do
not provide information on the structure of their investment portfolios. The impact on
bank risk of a shift in equity from institutional investors to non-financial companies is
therefore undetermined ( 3α non significant or positive/negative).
The fourth category of shareholders is represented by banks (BANK). As we
can see in Tables 3 and 4, banks hold important stakes in other banks. When a bank
owns another bank, the important risk-return relationship and strategies are expected
to be at the parent company, and not at its subsidiary firm. However, banks as a
shareholder might encourage relatively conservative risk-taking strategies at the
individual bank level for both safety net reasons and reputation concerns. In the event
of financial distress or failure, the parent bank is expected to support its subsidiary
which can be costly. We expect a negative coefficient for the variable BANK ( 4α
negative).
Control variables are introduced to account for size differences (natural
logarithm of total assets M_LNTA), business differences (deposits to total assets

16
M_DEP) and leverage differences (equity to total assets M_EQUITY). Alternative
control variables (the ratio of loans to total assets and the ratio of net non-interest
income to net operating income), are also introduced to check for robustness. Because
M_LNTA and M_EQUITY are highly correlated, the leverage ratio is orthogonalized
with total assets (M_OEQUITY). As the information on the ownership structure of our
sample of banks is invariant through time (1999-2005 period) and as our measure of
asset risk and default risk are computed using the standard deviations of ROA and
ROE, we conduct cross-section regressions. We therefore compute the means of our
three control variables over the whole sample period. We also control for possible
country specific effects by including country dummies (COUNTRY).
We further check if publicly-held banks behave differently compared to
privately-owned banks, by including in Model 1 a dummy variable, LISTED, which
takes the value of one if the bank is listed on the stock market and zero otherwise.
This dummy variable is expected to capture differences in risk and profitability for
listed and non-listed banks. Market exposure is expected to influence the behavior of
publicly-held firms. However, the effect of market exposure on risk is unclear. On the
one hand, market discipline should impose strong incentives on banks to conduct their
business in a safe, sound and efficient manner, including an incentive to maintain a
high level of equity capital to face potential future losses. On the other hand, publicly-
held banks can have access to additional equity at a lower cost than privately-owned
banks. Public banks might consequently have a greater ability to become larger and
make acquisitions. They also have a higher degree of freedom to manage their equity
and meet the regulatory capital requirement, which gives them more flexibility to
invest in risky projects with a higher expected return. Market forces might therefore
impose a higher risk-adjusted return for public banks. The expected sign associated to
the variable LISTED is therefore undetermined ( 5α non significant or
positive/negative).
We might potentially have two endogeneity problems in our regressions, one
with our ownership variables, which are continuous, and another one with the binary
variable LISTED. We deal with these two problems separately.
Some studies (Demsetz and Lehn, 1985; Himmelberg et al., 1999, Gugler and
Weigland, 2003) raise the problem that ownership might be endogenous as it might be
influenced by the level of performance and risk of the firm. In our study, it can be

17
argued that investors can be attracted by banks with different risk levels. Some
investors might simply choose to invest in banks with higher risk profiles in order to
maximize their utility. We test for the presence of an endogeneity bias in the
estimated equation for the three ownership variables for which we might encounter
such a problem (COMPANY, BANK and INSTITUT) by using the Hausman test. We
consider several instrumental variables related to the legal environment of the banking
system and to the nature of the bank’s activities17
. We verify that for each of our
ownership variables, we have at least one instrument which is not weak. The
Hausman tests show that the endogeneity problem is not a major issue18
, which
implies that OLS should be an efficient estimator.
The choice for a bank to become public or remain private also raises potential
endogeneity issues in our econometric specification. Indeed, banks will make their
choice to become listed on a stock market or remain private on the basis of the
expected future changes in growth and profitability. We account for a possible
endogeneity of the choice to be public or private by using the Heckman (1979) two-
stage approach as in Givoly et al. (2007) and Nichols et al. (2009). In a first stage, we
use a Probit model to determine the variables that influence the choice of the bank to
be publicly or privately owned. We then use the estimates of the Probit model to
compute the inverse Mills ratio for each sample bank (LAMBDA)19
. In the second
stage, we introduce the inverse Mills ratio as a control variable in Model 1. By
including LAMBDA in Model 1, we control for the correlation between LISTED and
the second stage errors to obtain consistent coefficient estimates. We also introduce
17 We consider several instrumental variables. First, we differentiate the banking systems according to
their legal environment. We use the database of La Porta et al. (1998) which groups the countries into
four general legal families: English common law origin; countries of French civil law origin; countries
of German civil law origin; and countries of Scandinavian civil law origin. Second, we classify the
banks of our sample according to the nature of their activities (proportion of subsidiaries abroad, focus
or diversification, extent of loan activities in the balance sheet, …). The strategies pursued by banks
will not change much over time and might influence the choice of shareholders. 18 The Hausman tests show that the null hypothesis of exogeneity is not rejected for INSTITUT (except
for SDROA and Z), COMPANY (except for SDROA) and BANK (except for ZP1 and ROE). 19 We use mean tests to compare balance sheet and income statement characteristics between listed and
non-listed banks (as in Table 2). We retain 11 ratios out of the 24 initially examined ratios which are
significantly different between listed and non-listed banks: consumer loans/total assets, total earning
assets/total assets, total deposits/total assets, cash/total assets, ROA, liquid assets/total assets, net
loans/total assets, asset growth rate, market funding/total assets, equity/total assets. These variables are
used to model the selection of public versus private status. The results from the Probit model are
available from the authors on request. The Pseudo R-square statistic indicates that the model explains
almost 68% of the cross-sectional variation in the choice of public-private status within our sample.

18
an interaction variable combining LISTED and LAMBDA to allow the coefficient to
vary between listed and non-listed banks.
The second objective of our paper is to further investigate the issue of market
discipline. We test the extent to which market forces influence the behavior of public
banks under different ownership structures. As discussed above, two different effects
can be expected from market discipline on the behavior of public banks: (i) a decrease
in risk if market forces moderate the incentives of banks dominated by institutional
investors or other shareholder categories rationally inclined to take higher risks; (ii) an
increase in risk if market forces align the objectives of public banks to generate faster
growth and to obtain a higher risk-adjusted return. As market forces might line-up the
objective of listed banks, we expect that their ownership structure will no more affect
their risk level. These two opposite effects of market forces on the risk behavior of
public banks lead us to test the two following alternative hypotheses:
Hypothesis 2a: Market discipline can mitigate risk in public banks that are owned or
controlled by shareholder categories that would otherwise be inclined to take higher
risk in a private bank.
Hypothesis 2b: Different ownership structures do not imply different levels of risk
and profitability for publicly-held banks.
For this purpose, we estimate an augmented model that captures the interaction
between the different categories of owners20
(FAMILY, COMPANY, BANK and
INSTITUT) and the dummy variable LISTED which indicates if a bank is listed or not.
We therefore use the following model to test the alternative hypotheses 2a and 2b:
Model 2
i 0 1 i 2 i 3 i 4 i
5 i 6 i 7 i 8 i
9 i 10 11 i 12 i
15
j j i
j 1
Y FAMILY COMPANY BANK FAMILY*LISTED
COMPANY*LISTED BANK*LISTED M_LNTA M_OEQUITY
M_DEPOSIT LISTED LAMBDA LAMBDA*LISTED
COUNTRY=
= β + β +β + β + β+β + β + β + β+ β +β + β + β+ γ + ε∑
20 As managers hold stocks in only one non-listed bank, we cannot consider the variable MANAGER in
Model 2.
19
As in Model 1, we use INSTITUT as a benchmark. Again, as we remove
INSTITUT from the set of independent variables, the estimated coefficient of each
interaction variable refers to a substitution between each ownership component and
the INSTITUT component (see Appendix 2 for details).
Interaction variables measure the impact of market exposure on the
relationship between the proportion of equity held by each category of owner and the
dependent variable. A negative and significant value of the sum of the coefficients of
the variable COMPANY and the interaction variable COMPANY*LISTED
( 2 5 0β +β < ) will indicate that a shift in equity from institutional investors to non-
financial companies is associated with a decrease in risk for listed banks. Such a result
will be consistent with our hypothesis 2a. If the sum of these two coefficients is not
significantly different from zero, then our model will highlight that a change in the
ownership structure of listed banks will not affect their risk level, which is consistent
with hypothesis 2b.
4. Results
Tables 9 and 10 show the results obtained for Models 1 and 2. Because, as
discussed above, we do not face strong endogeneity issues, we use OLS estimation
techniques with the Heckman correction21
. We also correct for heteroskedasticity
following White’s methodology. As we remove the ownership component
“institutional investors” from Models 1 and 2, the estimated coefficient associated to
each ownership component has to be interpreted as the effect of a substitution
between this component and the INSTITUT component (see Appendix 2 for details).
Our results are consistent with hypothesis 1. We find that the portion of total
equity held by different categories of shareholders is significant in explaining risk and
profitability differences (see Table 9).
First, as expected, our results show that higher portions of total stock held by
individuals/families (compensated in our approach by a decrease in the INSTITUT
component) are associated with lower asset risk and credit risk. But, interestingly, we
also find that a shift in equity from institutional investors to individuals/families is not
significantly associated with a decrease in profitability. As argued above, such
21 We also estimate Models 1 and 2 without the Heckman correction when the inverse Mills ratio
(LAMBDA) is not significant. The results regarding our variables of interest are unchanged.

20
shareholders hold less diversified portfolios than institutional investors and are often
involved in the management of such banks. Regarding our default risk measures, the
results show that a higher stake of individuals/families is associated with a lower
probability of default (Z).
Second, we find that the coefficients associated to the variable BANK are not
significant when the dependent variables are asset risk measures (SDROA and
SDROE) or profitability measures (ROA and ROE). These results indicate that a shift
in equity from institutional investors to banks does not imply a different level of asset
risk and profitability. Also, we find a negative and significant relationship at the ten
percent level between the BANK ownership component and the credit risk measure
(M_LLP). This result might support the hypothesis that, as shareholders, banking
institutions encourage relatively conservative risk-taking strategies but only for
traditional lending activities. In addition, our results show that default risk (Z) is lower
when the portion of shares held by such banking institutions increases.
Third, we do not find any significant coefficient associated to the variable
COMPANY. A shift in equity from institutional investors to non-financial companies
does not imply a change in asset risk, default risk and profitability. Such a result
suggests that institutional investors and non-financial companies might have similar
risk-return objectives.
Lastly, we find a significant and negative relationship between the variable
MANAGER and our credit risk measure (M_LLP). A shift in ownership from
institutional investors to managers is associated to a lower level of credit risk but our
results also highlight a higher probability of default (Z). Meanwhile, we find that a
higher involvement of managers in equity has a positive impact on profitability.
However, it should be noted that our data do not allow us to infer any accurate
relationship between manager involvement and risk. As shown in Table 3 and Table
A2, managers rarely hold stocks in their own company in our sample. Moreover, 7 out
of the 8 banks in which they have a stake are listed banks.
Regarding the influence of market forces on bank performance, the coefficient
associated to the variable LISTED in Model 1 is not significant. At first sight, there
seems to be no significant difference in risk and profitability between listed and non
listed banks suggesting that market forces might not strongly influence the risk
behavior of listed banks in a specific way.

21
Insert Table 9 here
We further investigate the issue of market discipline with Model 2 by
considering the interaction between the portion of equity held by each category of
owner and the exposure of banks to market forces (see Table 10)22
.
First, for non-listed banks, we find a negative and significant relationship
between FAMILY and two of our risk measures (SDROE and M_LLP). Therefore, the
above result indicating lower asset risk when families/individuals hold a higher
proportion of stocks (compensated by a decrease in INSTITUT) holds for non-listed
banks.
Second, our results highlight that, for listed banks, a shift in equity from
institutional investors to non-financial companies or individuals/families does not
imply a change in asset risk, default risk and profitability (except for SDROA for
FAMILY, but only at the 7.64% level). These results are consistent with hypothesis 2b
that changes in the ownership structure of listed banks do not lead to changes in risk.
Meanwhile, our results show that a decrease in the proportion of equity held by
institutional investors, offset by an increase in equity held by banks, implies a lower
credit risk and probability of default, but only for listed banks. Market forces might
therefore moderate the risk taking of banks with higher stakes by banking institutions
when they are listed.
Insert Table 10 here
On the whole, our analysis shows that different ownership structures imply
different levels of bank risk, which is consistent with hypothesis 1. We find that a
higher involvement of either individuals/families or banking institutions implies a
decrease in asset risk and default risk, which is not offset by lower profitability. Our
results also show that a shift in equity from institutional investors to non-financial
companies does not involve any changes in asset risk, default risk and profitability
suggesting identical risk-return preferences of both categories of shareholders. When
we further take into account the impact of market exposure, we find that changes in
the ownership structure of publicly-held banks do not strongly affect risk. However,
22 We do not include MANAGER in Model 2 because, in our sample, only one bank involving
managerial shareholding is not listed (see Table 3).

22
to some extent, credit risk and default risk are lower in listed banks when equity
stakes are transferred from institutional investors to banking institutions.
5. Deeper investigation and robustness checks23
In order to further examine issues related to the influence of ownership
structure on the risk-taking behavior of banks, we carry out a deeper investigation of
our sample.
Ownership Dispersion/Concentration within each category of shareholders
We account for ownership dispersion/concentration. We estimate the impact of
the dispersion/concentration of ownership by augmenting Model 1 with interaction
variables involving the different categories of owners (MANAGER, FAMILY,
INSTITUT, COMPANY and BANK) and their respective Herfindahl index
(HERF_MANAGER, HERF_FAMILY, HERF_INSTITUT, HERF_COMPANY and
HERF_BANK). The results are presented in Table A3. Our results show that the
degree of ownership concentration of families/individuals, industrial companies and
banking institutions does not influence the relationship between ownership changes
and the risk-taking behavior of banks. We also run our estimations on the two sub-
samples of non-listed and listed banks24
. Our results show that ownership
concentration does not matter in the relationship between ownership structure and
bank risk for both listed and non-listed banks. We only find, for non-listed banks, that
a higher involvement of families/individuals associated to a higher ownership
concentration implies a decrease in asset risk, but no change in profitability.
Size effect
We also conduct our estimations separately for large banks (total assets > 1
billion Euros) and small banks (total assets < 1 billion Euros) to further check for size
effects on the relationship between ownership structure and banks’ behavior in terms
of risk taking. Tables A4 and A5 in the appendix present the results obtained for
23 Some of the estimation results discussed in this section are not presented in the paper but are
available from the authors on request. 24 We do not include MANAGER in these estimations because there is only one non-listed bank in
which managers/directors hold equity.

23
Model 125
. Shifts in equity are significant in explaining risk differences for both
samples of large and small banks. A shift in equity from institutional investors to
individuals/families implies lower asset risk and lower default risk for both small and
large banks. Moreover, a higher involvement of individuals/families in small banks
leads to a higher level of profitability suggesting higher efficiency in management.
Also, our results show that a shift in equity from institutional investors to non-
financial companies does not involve a change in asset risk, profitability and default
risk for large banks, whereas it implies a decrease in asset risk for small banks.
Reliance on market debt
We further test the impact of market exposure on the risk-taking behavior of
banks under different ownership structure profiles by using another proxy. We
consider that a bank heavily reliant on market debt is likely to be influenced by
market forces even if it is not listed on a stock market. We therefore construct a
dummy variable based on the ratio of market debt plus uninsured deposits to total
assets. We consider that banks with a ratio higher than the median of the sample can
be effectively disciplined by the market. We run our Model 2 by using this dummy
variable to construct the interaction variables (see Table A6 in appendix). We find
that a shift in equity from institutional investors to individual/families implies lower
asset and default risk for banks which have a relatively low ratio of market debt. Our
results also show that changes in the ownership structure of banks which are strongly
reliant on market debt do not affect asset and default risk. These results are consistent
with our hypothesis that market forces align the risk-taking behavior of banks.
Nature of main shareholder
Finally, to be consistent with previous studies on ownership in banking, we
also classify banks according to the nature of their main category of shareholders. The
objective of using such a classification is to analyze if the risk-taking behavior of
banks is different according to the nature of the main category of shareholders. We
run a differently specified regression on our subsample of 191 banks in which the
major shareholder holds more than 50% of total equity. We have in our sample of 249
banks: (i) 0 manager-owned bank; (ii) 4 family and individual-owned banks; (iii) 14
25 The distribution of banks according to the percentage of equity held by each category of shareholder
does not allow us to accurately run Model 2 for the sub-samples of small and large banks.

24
institutional investor-owned banks; (iv) 22 company-owned banks, and (v) 126 bank-
owned banks (see Table 4). We create the following four dummy variables which take
the value of one when ownership is higher than 50% of total equity and 0 otherwise:
FAMILY_OWNED, INSTITUT_OWNED, COMPANY_OWNED and BANK_OWNED.
We do not consider manager-owned banks in our estimations because no banks have a
majority of equity held by this category of shareholders (see Table 4). Table A7 in the
appendix shows the results of the estimations26
. Our results show that banks which are
majority-owned by families/individuals exhibit a lower asset risk level (SDROE and
M_LLP) but not a lower profitability. We also find that banks which are majority-
owned by other banking institutions exhibit a lower credit risk.
In addition, we also estimate the same model by considering that there is a
majority ownership when a category of owner holds a percentage of total equity
strictly above 33%. Our findings are unaltered for the variables of interest. Our results
therefore highlight that both the degree of involvement of shareholders and the nature
of the main category of shareholders influence the attitude of banks toward risk.
Robustness checks
Several robustness checks are also performed. First, we estimate Model 1 and
Model 2 using the restricted sample of 198 banks for which the sum of the different
equity components is at least equal to 99%. We consider this restricted sample to
ensure that our results are not biased by the fact that some information regarding
ownership structure might be missing or not reported in the Bankscope dataset that we
use. We also estimate Models 1 and 2 on a subsample from which we exclude
observations with a value of zero for the proportion of equity held by institutional
investors. Our conclusions remain unchanged.
Second, we estimate Model 1 on the two sub-samples of privately-owned and
publicly-held banks. Our results regarding our ownership variables are unchanged.
We find that a shift in equity from institutional investors to individuals/families
implies a decrease in asset risk and default risk whereas a higher involvement of non-
financial companies does not imply any changes in risk and profitability. For listed
banks, our results show that bank ownership structure changes do not affect risk
26 The limited number of banks for which we have a majority owner and our specific regression
specification which is reliant on dummy variables do not allow us to introduce interaction variables as
in Model 2.

25
taking, except that risk is lower when equity stakes are transferred from institutional
investors to banking institutions.
Third, we also run separate regressions introducing our ownership variables
one by one along with the control variables. We find that a higher involvement of
institutional investors implies a higher probability of default for both listed and non-
listed banks. Our results also show that a higher involvement of individuals/families
implies a lower asset risk, but only for non-listed banks. A higher proportion of equity
held by either non-financial companies or banking institutions does not affect risk
taking, both for privately-owned and publicly-held banks.
Fourth, we also perform a number of robustness checks that are specification
related. Other control variables to account for business differences are introduced in
the estimations such as the ratio of loans to total assets and the ratio of net non-
interest income to net operating income. Our conclusions regarding the inclusion of
the ownership variables remain unchanged.
6. Summary and concluding remarks
The objective of this study is to analyze if different ownership structures are
associated with different levels of risk and profitability in both privately owned and
publicly held banks. We differentiate five categories of shareholders that are assumed
to have different risk-taking incentives (managers/directors, institutional investors,
non-financial companies, individuals/families, and banks). We use the proportion of
equity held by institutional investors as a benchmark ownership share to evaluate the
impact of changes in ownership structure on risk and profitability. Our aim is also to
assess if publicly held and privately owned banks respond differently to such changes
in terms of risk and profitability. We hence analyze the influence of market discipline
by testing if ownership structure changes imply different levels of risk and
profitability for listed banks.
Working on a panel of European commercial banks and using both asset risk
and default risk measures, we find that changes in ownership structure are significant
in explaining risk differences. However, by investigating the relationship further we
note that such findings are mainly accurate for privately owned banks.
Specifically, we show that a shift in equity from institutional investors to
either individuals/families or banking institutions implies a decrease in asset risk and
default risk, but no change in profitability. This result is consistent with the conjecture

26
that because individuals/families hold less diversified portfolios than institutional
investors, they have incentives to take less risk. Regarding banking institutions, when
their stakes in other banks are higher, they seem to encourage relatively conservative
risk-taking strategies in their subsidiaries possibly for reputation concerns.
Meanwhile, our results show that a shift in equity from institutional investors to non-
financial companies does not involve changes in risk and profitability; this suggests
that institutional investors and non-financial companies have similar risk-return
objectives in the banks they are involved in. We also note that the level of ownership
concentration/dispersion within each category of shareholders does not influence the
relationship between ownership structure and risk.
We further find no significant differences in asset risk and default risk
between publicly-held and privately-owned banks. Moreover, unlike for private
banks, for public banks ownership structure changes do not affect risk taking. Market
forces seem to align the risk-taking behavior of public banks and the ownership
structure is no more a determinant to explain risk differences. Our results merely
highlight that a higher involvement of banking institutions in public banks implies a
lower exposure to credit risk and a lower probability of default. As bank supervisors
provide guidelines for banks on safety and soundness, a close look at both the
ownership structure and the nature of equity (public and tradable/ private and non
tradable) could be important.
27
Table 1. Distribution of banks by country
All banks Non-listed banks Listed banks
Austria 14 11 3
Belgium 7 7 0
Denmark 19 2 17
Finland 2 0 2
France 64 58 6
Germany 39 33 6
Greece 7 0 7
Ireland 5 1 4
Italy 17 4 13
Luxembourg 33 32 1
Netherlands 7 6 1
Portugal 2 0 2
Spain 15 3 12
Sweden 2 0 2
Switzerland 3 2 1
United Kingdom 13 10 3
Total 249 169 80
28
Table 2. Descriptive statistics for our panel of 249 European Commercial banks, on average over the period 1999-2005
LOANS DEP EQUITY EXPENSES LLP ROA ROE LIQUID OBS TA SDROA SDROE Z ZP
Large sample of commercial banks available under Bankscope (1586 banks)
Mean 46.58 26.72 12.13 1.95 0.68 0.82 8.03 29.16 29.05 10 410 1.14 8.20 46.70 47.26
Maximum 99.97 97.64 69.52 77.64 14.49 19.24 39.95 100.00 857.47 1 330 000 53.26 216.02 590.40 496.77
Minimum 0.00 0.00 0.00 0.00 -14.98 -20.00 -38.25 0.00 0.00 0.991 0.00 0.00 0.23 0.37
Std. Dev. 29.72 26.73 11.77 3.04 1.95 2.28 9.97 26.75 75.07 64 435 3.04 14.45 65.03 61.57
Our sample of 249 banks
Mean 50.15 39.06 9.41 1.58 0.54 0.81 9.52 24.50 32.15 20 200 0.58 6.98 44.03 37.17
Maximum 94.71 93.31 68.24 41.78 9.09 16.59 30.82 87.09 887.90 839 000 7.67 143.06 511.66 190.76
Minimum 0.76 0.00 1.06 0.04 -10.99 -4.04 -38.66 0.24 0.02 4 554 0.01 0.003 0.56 0.51
Std. Dev. 24.66 26.04 8.51 2.80 2.00 1.43 9.23 20.65 73.68 83 900 0.94 12.81 56.13 32.35
T-statistic of the mean test -2.06** -6.92*** 4.42*** 1.91* 1.03 0.09 -2.34** 3.16*** -0.61 -1.76* 5.78*** 1.37 0.68 3.92***
Non-listed banks (169)
Mean 45.55 31.65 9.71 1.35 0.48 0.63 8.02 28.36 33.56 3 820 0.61 7.77 43.63 36.98
Maximum 94.71 93.31 66.78 7.73 9.09 4.87 30.82 87.09 887.90 52 400 7.67 143.06 511.66 190.76
Minimum 0.76 0.00 1.47 0.04 -10.99 -4.04 -38.66 0.31 0.02 4 554 0.01 0.003 0.56 0.51
Std. Dev. 25.96 25.98 8.81 1.06 2.41 1.04 9.78 23.18 86.32 7 990 0.97 14.74 58.64 32.35
Listed banks (80)
Mean 59.87 54.71 8.79 2.05 0.66 1.18 12.67 16.33 29.10 54 800 0.51 5.32 44.87 37.50
Maximum 88.84 86.94 68.24 41.78 3.39 16.59 25.55 47.28 141.52 839 000 5.58 50.93 396.34 136.62
Minimum 9.09 3.84 1.06 0.04 -0.98 -2.86 -20.21 0.24 0.90 57 462 0.01 0.28 1.57 1.27
Std. Dev. 18.28 18.09 7.84 4.68 0.54 1.98 7.00 9.87 32.76 142 000 0.88 6.96 50.83 27.04
T-statistic of the mean test -4.43*** -7.15*** 0.79 -1.84* -0.66 -2.87*** -3.81*** 4.45*** 0.44 -4. 65*** 0.79 1.41 -0.16 0.46
T statistics test for the null:"Descriptive statistics are not different between the two samples considered".***, ** and * indicate significance respectively at the 1%, 5% and 10%
levels for a bilateral test. Variable definitions (all variables are expressed in percentage except TA which is in million of euros): LOANS = net loans/total assets; DEP =
deposits/total assets; EQUITY= equity/total assets; EXPENSES =personnel expenses/total assets; LLP = loan loss provision/net loans; ROA = return on average assets; ROE=
return on average equity; LIQUID = liquid assets/total assets; OBS= off balance sheet/ total assets; TA= total assets (millions Euros); SDROA= standard deviation of the ROA;
SDROE = standard deviation of the ROE; Z=Z-score = )(100 average ROE / SDROE+ ;
ZP = ZP-score = average ROA average (Total equities / Total assets)
SDROA SDROA+ .

29
Table 3. Number of banks for which the ownership variables are different from zero and
percentage of stock held by the different categories of owners
MANAGER a FAMILY INSTITUT COMPANY BANK
=0 >0
=0
>0 =0 >0
=0
>0
=0
>0
Whole sample (249 banks)
Number of
banks
(%)
241
(96.78)
8
(3.22)
224
(89.95)
25
(10.05)
194
(77.91)
55
(22.09)
171
(68.67)
78
(31.33)
69
(27.71)
180
(72.29)
Mean 9.51
21.90
35.40
39.48
81.52
Max. 33.72
100
100
100
100
Min. 0.40
0.02
0.03
0.08
0.69
Percentage
of equity
Std 11.16
31.33
37.83
38.33
30.73
Non-listed banks (169 banks)
Number of
banks
(%)
168
(99.5)
1
(0.5)
160
(94.68)
9
(5.32)
151
(89.35)
18
(10.65)
135
(79.89)
34
(20.11)
34
(79.89)
135
(23.74)
Mean 16.48
50.39
71.86
66.31
93.73
Max. 16.48
100
100
100
100
Min. 16.48
0.07
0.63
0.10
20.86
Percentage
of equity
Std -
38.52
38.98
37.45
17.88
Listed banks (80 banks)
Number of
banks
(%)
73
(91.25)
7
(8.75)
64
(80.00)
16
(20.00)
43
(53.75)
37
(46.25)
36
(45.00)
44
(55.00)
35
(43.75)
45
(56.25)
Mean 8.51
5.87
16.16
19.8
44.87
Max. 33.72
17.14
79.86
99.97
99.9
Min. 0.4
0.02
0.03
0.08
0.69
Percentage
of equity
Std 11.67
4.25
18
24.81
32.19
Five categories of owners are considered: (i) managers/directors (MANAGER); (ii) non-financial companies
(COMPANY); (iii) individual/family investors (FAMILY); (iv) banks (BANK); and (v) institutional investors -
insurance company, financial companies and mutual & pension funds - (INSTITUT). a For example, in the whole sample, we have 241 banks in which managers do not hold equity and 8 banks in which
managers hold equity. We also present the percentage of banks for which the variable MANAGER is equal to zero
(96.78), as well as the percentage of equity held on average by the managers in the 8 banks in which they have a stake
(9.51%).

30
Table 4. Distribution of our sample of privately-owned and publicly-owned banks
according to the percentage of equity held by each category of shareholder
Percentage of equity held
0 ]0-5] ]5-33] ]33-50] ]50-75] ]75-100]
Number of non listed banks (total of 169 banks)
MANAGER 168 0 1 0 0 0
FAMILY 160 1 2 2 1 3
INSTITUT 151 3 1 1 3 11
COMPANY 135 2 7 2 5 17
BANK 34 0 4 5 4 122
Number of listed banks (total of 80 banks)
MANAGER 73 3 3 1 0 0
FAMILY 64 8 8 0 0 0
INSTITUT 43 12 19 2 2 1
COMPANY 36 13 24 2 3 3
BANK 34 0 4 5 4 122
Five categories of owners are considered: (i) managers/directors (MANAGER); (ii) non-financial
companies (COMPANY); (iii) individual/family investors (FAMILY); (iv) banks (BANK); and (v)
institutional investors - insurance company, financial companies and mutual & pension funds -
(INSTITUT).
31
Table 5. Risk measures and default risk measures according to the shareholder type
and the percentage of equity held Percentage of equity held
0 ]0-5] ]5-33] ]33-50] ]50-75] ]75-100]
SDROA 0.57 0.47 0.99 0.19 - -
SDROE 6.88 9.20 12.23 2.70 - -
M_LLP 0.32 0.71 0.48 0.57 - -
Z 44.60 33.15 18.11 44.91 - -
ZP 50.38 33.32 19.14 50.96 - -
ZP1 4.25 3.37 2.27 8.93 - -
ZP2 46.13 29.95 16.87 42.04 - -
MANAGER
Observations 241 3 4 1 0 0
SDROA 0.58 0.57 0.54 0.46 0.12 0.15
SDROE 7.24 5.31 4.51 7.27 2.23 2.27
M_LLP 0.34 -0.22 0.71 0.26 0.75 0.14
Z 44.19 28.35 39.21 109.51 49.37 49.96
ZP 50.80 31.09 31.79 95.20 53.26 48.98
ZP1 4.26 3.58 3.55 7.69 4.69 3.22
ZP2 46.54 27.70 28.24 87.51 48.57 45.75
FAMILY
Observations 224 9 10 2 1 3
SDROA 0.57 0.20 0.49 0.34 0.25 1.41
SDROE 7.20 3.11 6.29 4.24 3.56 11.45
M_LLP 0.17 0.29 0.74 0.46 1.38 1.80
Z 43.37 86.80 30.75 36.54 65.11 16.43
ZP 49.32 109.34 26.90 43.89 59.90 16.13
ZP1 4.15 8.63 3.29 3.27 4.83 1.49
ZP2 45.16 100.00 23.61 40.61 55.06 14.63
INSTITUT
Observations 194 15 20 3 5 12
SDROA 0.62 0.23 0.30 0.27 0.20 0.93
SDROE 7.19 3.02 4.66 1.83 2.54 14.53
M_LLP 0.28 0.49 0.34 0.46 0.64 0.50
Z 37.51 84.66 54.60 107.90 70.97 28.31
ZP 47.84 48.98 67.88 63.66 74.89 24.54
ZP1 3.91 5.60 6.47 5.08 4.69 2.16
ZP2 43.98 43.38 61.41 58.58 70.19 22.38
COMPANY
Observations 171 15 31 4 8 20
SDROA 0.75 0.30 0.37 0.14 0.31 0.58
SDROE 8.78 3.57 6.03 1.79 3.68 7.04
M_LLP 0.84 0.52 0.71 1.05 0.83 -0.11
Z 32.15 35.58 47.26 78.66 43.10 48.09
ZP 34.69 34.30 65.79 67.14 46.15 55.22
ZP1 3.72 4.59 7.13 6.50 3.77 3.97
ZP2 30.96 29.71 58.65 60.63 42.37 51.24
BANK
Observations 69 5 19 8 17 131
The variables MANAGER, FAMILY, INSTITUT, COMPANY and BANK represent the percentage of
stock held respectively by managers/directors, families/individuals, institutional investors, non-
financial companies, and banks.
Variable definitions (standard deviations and means are computed over the period 1999-2005):
SDROA= standard deviation of the return on average assets; SDROE = standard deviation of return on
average equity, M_LLP= Mean of the ratio of loan loss provision to net loans over the sample period;
Z=Z-score = )(100 average ROE / SDROE+ ;
ZP = ZP-score = ZP1 + ZP2 =average ROA average (Total equities / Total assets)
SDROA SDROA+ ; ZP1=measure
of bank portfolio risk; ZP2 = measure of leverage risk.

32
Table 6. Ownership dispersion by shareholder category
Mean Std. Dev. Minimum Maximum
Whole sample
HERF 0.775 0.297 0.054 1
By shareholder category
HERF_MANAGER 0.948 0.145 0.589 1
HERF_FAMILY 0.654 0.351 0 1
HERF_INSTITUT 0.696 0.349 0 1
HERF_COMPANY 0.777 0.276 0.170 1
HERF_BANK 0.888 0.224 0 1
HERF is the Herfindahl index computed when we consider all the categories of shareholders together.
HERF_j represents the Herfindahl index computed for the category of shareholder j (by considering only
shareholders who hold equity). Our Herfindahl index is defined for each bank i as n 2
j=1jOS∑ , where OSj is
the ratio of the percentage of equity held by each shareholder for the given category j to the total
percentage of equity held by all the shareholder of this category j.
We consider five categories of owners: (i) managers/directors (MANAGER); (ii) non-financial
companies (COMPANY); (iii) individual/family investors (FAMILY); (iv) banks (BANK); and (v)
institutional investors - insurance company, financial companies and mutual & pension funds -
(INSTITUT).
Table 7. Average number of shareholders by category Mean Std. Dev. Minimum Maximum
Whole sample
4.73 8.21 1 87
By Shareholder categories
MANAGER 1.12 0.35 1 2
FAMILY 2.48 2.29 1 8
INSTITUT 2.96 2.81 1 12
COMPANY 4.25 8.66 1 66
BANK 2.13 3.95 1 52
Five categories of owners are considered: (i) managers/directors (MANAGER); (ii) non-financial
companies (COMPANY); (iii) individual/family investors (FAMILY); (iv) banks (BANK); and (v)
institutional investors - insurance company, financial companies and mutual & pension funds -
(INSTITUT).
Table 8. Ownership concentration and bank risk and profitability
Level of concentration MANAGER FAMILY INSTITUT COMPANY BANK
Less Concentrated
(HERF≤ 0.5) - 0.43 0.52 0.32 0.23
More Concentrated
(HERF>0.5) 0.64 0.50 0.56 0.49 0.54
SDROA
T-stat of the mean test - -0.38 -0.10 -1.54 -3.68***
Less Concentrated
(HERF≤ 0.5) - 45.42 34.27 43.38 73.24
More Concentrated
(HERF>0.5) 27.10 41.29 57.11 61.78 45.61
Z
T-stat of the mean test - 0.22 -0.80 -1.15 1.04
Less Concentrated
(HERF≤ 0.5) - 1.08 1.10 0.83 0.46
More Concentrated
(HERF>0.5) 0.82 1.35 1.58 0.94 0.66
M_ROA
T-stat of the mean test t - -0.65 -0.45 -0.61 -1.92*
T statistics test for the null:"Risk and performance are not different for banks with a more or less concentrated
ownership".***, ** and * indicate significance respectively at the 1%, 5% and 10% levels for a bilateral test. The
level of concentration is measured by our Herfindahl index (see definition in Table 6); a category of shareholder is
considered with a more or less concentrated ownership when the Herfindahl index is respectively higher than 0.5
or strictly lower than 0.5. Five categories of owners are considered: (i) managers/directors (MANAGER); (ii) non-
financial companies (COMPANY); (iii) individual/family investors (FAMILY); (iv) banks (BANK); and (v)
institutional investors - insurance company, financial companies and mutual & pension funds - (INSTITUT).

33
Table 9. Influence of ownership structure on the risk-taking behavior and profitability of banks (Model 1), cross-section OLS regressions
Risk measures Default Risk measures Profitability measures
SDROA SDROE M_LLP Z ZP ZP1 ZP2 M_ROA M_ROE
CONSTANT 0.200 -3.866 3.456* 38.95 15.63 -2.772 18.40 2.877*** 23.56***
(0.27) (-0.32) (1.83) (1.28) (0.34) (-0.47) (0.45) (3.56) (3.33)
MANAGER 0.00364 -0.0233 -0.0295* -0.853* -0.576 -0.0654 -0.511 0.0225** 0.299**
(0.34) (-0.14) (-1.68) (-1.83) (-1.09) (-0.99) (-1.07) (2.54) (2.39)
FAMILY -0.00455* -0.0834*** -0.0179** 0.408** 0.141 -0.00318 0.144 -0.000763 0.00369
(-1.72) (-2.77) (-2.27) (2.16) (0.77) (-0.19) (0.84) (-0.21) (0.11)
COMPANY -0.00285 0.0369 -0.00973 0.181 -0.00877 -0.0149 0.00613 -0.00196 -0.00268
(-1.12) (0.54) (-1.15) (1.31) (-0.07) (-1.04) (0.05) (-0.58) (-0.07)
BANK -0.00142 -0.0267 -0.0120* 0.230* 0.0942 -0.00269 0.0969 -0.000967 -0.00681
(-0.68) (-1.05) (-1.77) (1.75) (0.73) (-0.17) (0.83) (-0.41) (-0.28)
M_LNTA 0.0660* 1.189* -0.113 -4.439** -3.657 0.0899 -3.747 -0.0916** -0.347
(1.94) (1.89) (-1.24) (-2.17) (-1.20) (0.32) (-1.30) (-2.11) (-1.06)
M_OEQUITY 0.0660*** -0.00333 -0.0561** -0.262 -0.889 -0.101 -0.788 0.0460** -0.126
(6.65) (-0.04) (-2.16) (-0.59) (-1.49) (-1.64) (-1.41) (2.50) (-1.36)
M_DEPOSIT -0.00237 -0.00944 -0.0114 0.157 0.0907 -0.0655*** 0.156 -0.00697** -0.101***
(-1.11) (-0.25) (-1.29) (0.74) (0.33) (-2.94) (0.60) (-2.32) (-3.75)
LISTED 0.270 4.585 -0.411 3.652 28.92 8.927* 20.00 -0.447 0.913
(0.60) (0.85) (-0.55) (0.17) (0.91) (1.97) (0.72) (-1.08) (0.21)
LAMBDA 0.0463 1.209 -0.109 1.066 6.554 0.0387 6.516 -0.180*** -2.108***
(1.02) (1.46) (-0.55) (0.36) (1.42) (0.10) (1.48) (-2.85) (-3.27)
LAMBDA*LISTED -0.188 -3.912 -0.112 2.215 -16.18 -5.897* -10.28 0.164 -1.725
(-0.52) (-0.82) (-0.31) (0.16) (-0.72) (-1.81) (-0.52) (0.43) (-0.55)
COUNTRY DUMMIES Yes Yes Yes Yes Yes Yes Yes Yes Yes
Number of obs. 244 244 241 242 244 244 244 244 243
R2 0.296 0.0848 0.105 0.119 0.0571 0.153 0.0542 0.304 0.226
***, ** and * indicate significance at the 1%, 5% and 10% levels respectively. t-statistics are corrected for heteroskedasticity following White’s methodology.
Variable definitions (standard deviations and means are computed over the period 1999-2005): SDROA= standard deviation of the return on average assets; SDROE
= standard deviation of the return on average equity , M_LLP = mean of the ratio of loan loss provisions to net loans; Z = Z-score; ZP = ZP-score; ZP1=measure of
bank portfolio risk; ZP2 = measure of leverage risk; M_ROA= mean of the return on average asset; M_ROE= mean of the return on average equity; M_LNTA= mean
of the natural logarithm of total asset; M_OEQUITY = mean of the ratio of equity to total assets orthogonalized with TA; M_DEPOSIT = mean of the ratio of deposits
to total assets; LISTED = a dummy variable which takes the value of one if the bank is listed on the stock market and zero otherwise; LAMBDA is the inverse Mills
ratio estimated for each bank from the first-stage Probit model. The variables MANAGER, FAMILY, COMPANY and BANK represent the percentage of stock held
respectively by managers/directors, families/individuals, non-financial companies and banks. We also include dummy variables to account for country specific
effects.

34
Table10. Influence of ownership structure on the risk-taking behavior and profitability of listed and non-listed banks (Model 2), cross-section OLS regressions
Risk measures Default Risk measures Profitability measures
SDROA SDROE M_LLP Z ZP ZP1 ZP2 M_ROA M_ROE
CONSTANT 0( )β 0.336
(0.47)
-2.878
(-0.24)
3.869*
(1.89)
59.19*
(1.83)
4.433
(0.09)
-4.294
(-0.68)
8.728
(0.20)
2.772***
(3.59)
24.25***
(3.29)
-0.00466 -0.0810** -0.0209* 0.283 0.283 0.0146 0.268 0.000322 -0.000599 FAMILY 1( )β
(-1.55) (-2.49) (-1.95) (1.59) (1.64) (1.15) (1.65) (0.08) (-0.02)
-0.00311 0.0487 -0.0129 0.0828 0.0878 -0.000719 0.0885 -0.00104 -0.00737 COMPANY 2( )β
(-0.95) (0.58) (-1.16) (0.51) (0.62) (-0.06) (0.66) (-0.27) (-0.15)
-0.00210 -0.0315 -0.0147 0.0881 0.234 0.0147 0.219 -0.000351 -0.0175 BANK 3( )β
(-0.75) (-1.00) (-1.51) (0.62) (1.63) (1.07) (1.65) (-0.12) (-0.56)
-0.0182 -0.131 0.0133 0.317 -2.054 -0.226 -1.828 -0.0141 -0.0331 FAMILY*LISTED 4( )β
(-1.38) (-0.73) (0.66) (0.45) (-1.33) (-1.00) (-1.37) (-0.74) (-0.18)
-0.000409 -0.0719 0.0111 0.209 -0.179 -0.0332 -0.145 -0.00396 -0.00591 COMPANY*LISTED 5( )β
(-0.09) (-0.82) (1.08) (0.83) (-0.67) (-0.99) (-0.60) (-0.66) (-0.11)
0.00195 0.0290 0.00854 0.481 -0.445* -0.0532 -0.391* -0.00254 0.0235 BANK*LISTED 6( )β
(0.43) (0.55) (0.86) (1.56) (-1.68) (-1.55) (-1.67) (-0.47) (0.47)
0.0656* 1.183* -0.114 -4.434** -3.908 0.0614 -3.970 -0.0902** -0.309 M_LNTA 7( )β
(1.93) (1.90) (-1.24) (-2.16) (-1.29) (0.23) (-1.38) (-2.07) (-0.93)
0.0659*** -0.00594 -0.0573** -0.317 -0.833 -0.0944 -0.738 0.0463** -0.129 M_OEQUITY 8( )β
(6.67) (-0.06) (-2.25) (-0.73) (-1.38) (-1.54) (-1.31) (2.49) (-1.40)
-0.00209 -0.00657 -0.0108 0.192 0.0658 -0.0687*** 0.134 -0.00702** -0.0978*** M_DEPOSIT 9( )β
(-0.96) (-0.17) (-1.23) (0.88) (0.24) (-2.92) (0.51) (-2.25) (-3.53)
0.188 4.235 -0.992 -22.65 52.67 11.93** 40.74 -0.255 0.0594 LISTED 10( )β
(0.44) (0.76) (-0.90) (-1.00) (1.31) (2.00) (1.17) (-0.52) (0.01)
0.0472 1.180 -0.104 1.210 6.397 0.0135 6.384 -0.181*** -2.085*** LAMBDA 11( )β
(1.04) (1.46) (-0.52) (0.41) (1.37) (0.04) (1.44) (-2.83) (-3.23)
-0.182 -3.403 -0.148 2.604 -17.01 -5.922* -11.09 0.177 -1.612 LAMBDA*LISTED 12( )β
(-0.53) (-0.76) (-0.43) (0.18) (-0.78) (-1.84) (-0.57) (0.47) (-0.51)
COUNTRY DUMMIES Yes Yes Yes Yes Yes Yes Yes Yes Yes
Risk level to reject 1 4
0β + β = 0.0764* 0.228 0.626 0.376 0.249 0.346 0.240 0.458 0.856
Risk level to reject 2 5 0β + β = 0.311 0.603 0.723 0.159 0.700 0.289 0.788 0.347 0.745
Risk level to reject 3 6 0β + β = 0.965 0.951 0.0786* 0.0432** 0.342 0.245 0.369 0.519 0.879
Number of obs. 244 244 241 242 244 244 244 244 243
R2 0.298 0.0908 0.107 0.128 0.0616 0.159 0.0582 0.302 0.222
***, ** and * indicate significance at the 1%, 5% and 10% levels respectively. t-statistics are corrected for heteroskedasticity following White’s methodology.
Variable definitions (standard deviations and means are computed over the period 1999-2005): SDROA= standard deviation of the return on average assets; SDROE = standard deviation of the return
on average equity , M_LLP = mean of the ratio of loan loss provisions to net loans; Z = Z-score; ZP = ZP-score; ZP1=measure of bank portfolio risk; ZP2 = measure of leverage risk; M_ROA= mean
of the return on average asset; M_ROE= mean of the return on average equity; M_LNTA= mean of the natural logarithm of total asset; M_OEQUITY = mean of the ratio of equity to total assets orthogonalized
with TA; M_DEPOSIT = mean of the ratio of deposits to total assets; LISTED = a dummy variable which takes the value of one if the bank is listed on the stock market and zero otherwise;
LAMBDA is the inverse Mills ratio estimated for each bank from the first-stage Probit model. The variables FAMILY, COMPANY and BANK represent the percentage of stock held respectively by
families/individuals, non-financial companies and banks. We also include dummy variables to account for country specific effects.

35
Figure 1. Asset risk, default risk, profitability and asset growth rate for public and
private banks according to their main category of shareholder
0
0.5
1
1.5
2
2.5
FAMILY INSTITUT COMPANY BANK
Main category of shareholder
Pro
fita
bilit
y (
M_R
OA
)
LISTED NON LISTED
Note: We use the mode to determine the main category of shareholder of each bank; t represents the T-statistic of the
bilateral mean test between listed and non-listed banks for banks with the same main category of shareholder. ***, ** and *
indicate significance at the 1%, 5% and 10% levels respectively. We consider five categories of owners: (i)
managers/directors (MANAGER); (ii) non-financial companies (COMPANY); (iii) individual/family investors (FAMILY);
(iv) banks (BANK); and (v) institutional investors - insurance company, financial companies and mutual & pension funds -
(INSTITUT).
0
0.1
0.2
0.3
0.4
0.5
0.6
0.7
0.8
0.9
1
FAMILY INSTITUT COMPANY BANK
M a i n c a t e gor y of sha r e hol de r
Asset
risk (
sd
roa)
LISTED NON LISTED
t=0.96
t=-0.60
t=-1.47
t=-0.63
t=-1.39
t=0.08
t=1.40 t=-0.37
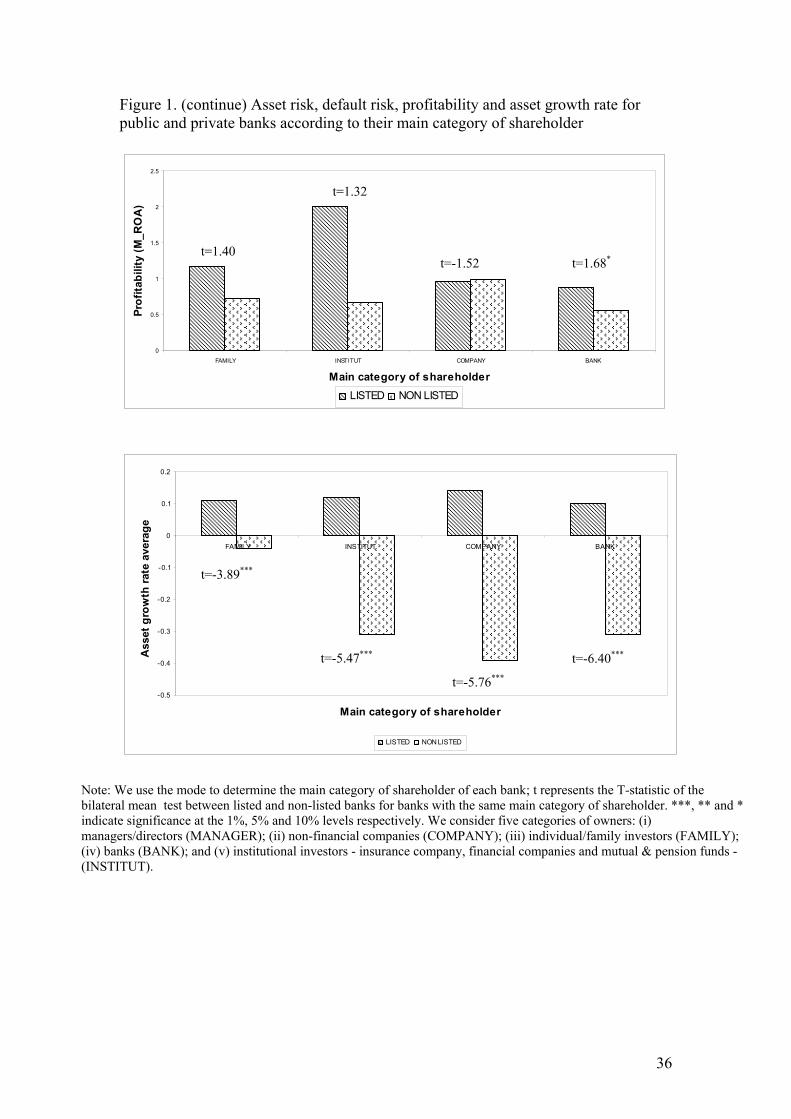
36
Figure 1. (continue) Asset risk, default risk, profitability and asset growth rate for
public and private banks according to their main category of shareholder
0
0.5
1
1.5
2
2.5
FAMILY INSTITUT COMPANY BANK
Main category of shareholder
Pro
fita
bilit
y (
M_R
OA
)
LISTED NON LISTED
-0.5
-0.4
-0.3
-0.2
-0.1
0
0.1
0.2
FAMILY INSTITUT COMPANY BANK
Main category of shareholder
Asset
gro
wth
rate
avera
ge
LISTED NON LISTED
t=-5.76***
Note: We use the mode to determine the main category of shareholder of each bank; t represents the T-statistic of the
bilateral mean test between listed and non-listed banks for banks with the same main category of shareholder. ***, ** and *
indicate significance at the 1%, 5% and 10% levels respectively. We consider five categories of owners: (i)
managers/directors (MANAGER); (ii) non-financial companies (COMPANY); (iii) individual/family investors (FAMILY);
(iv) banks (BANK); and (v) institutional investors - insurance company, financial companies and mutual & pension funds -
(INSTITUT).
t=1.40
t=1.32
t=-1.52 t=1.68*
t=-3.89***
t=-5.47***t=-6.40***

37
References
Acker, L., Athanassakos, G., 2003. A simultaneous equations analysis of analysts'
forecast bias, analyst following and institutional ownership. Journal of Business
Finance and Accounting, 30, 1017-1042.
Aghion, Ph., Tirole, J., 1997. Formal and real authority in organizations. Journal of
Political Economy, 55, 1-27.
Anderson, R.C, Fraser, D.R, 2000. Corporate Control, Bank Risk Taking, and the
Health of the Banking Industry. Journal of Banking and Finance, 24, 1383-1398.
Berger A., Clarke, G., Cill R., Klapper, L., Udell G., 2005. Corporate governance and
bank performance: A joint analysis of the static, selection, and dynamic effects of
domestic, foreign, and state ownership. Journal of Banking and Finance, 29, 2179-
2221.
Bliss, R., Flannery, M., 2002. Market discipline in the governance of U.S. Bank
Holding Companies: monitoring vs. influencing. European Finance Review, 6 (3),
361-395.
Bonin, J.P., Hasan, I., Wachtel, P., 2005. Bank performance, efficiency and ownership
in transition countries. Journal of Banking and Finance, 29, 31-54.
Boubakri, N., Cosset, J.C., Fischer K., Guedhami O., 2005. Privatization and Bank
Performance in developing countries. Journal of Banking and Finance, 29, 2015-
2041.
Boyd, J.H., Graham, S.L, 1986. Risk, Regulation and Bank Holding Company
Expansion. Quaterly Review, Federal Reserve Bank of Mineapolis.
Burkart, M., Gromb, D., Panunzi, F., 1997. Large shareholders, monitoring and the
value of the firm. Quaterly Journal of Economics, 112, 693-728.
Chen, C.R., Steiner,T.L, Whyte, A.M, 1998. Risk-taking Behavior and Management
Ownership in Depository Institutions. Journal of Financial Research, 21,1-16.
Claessens, S., Demirguc-kunt, A., Huizinga, H., 2001. How does foreign entry affect
the domestic banking market ? Journal of Banking and Finance, 25, 891-911.
Demsetz, H., Lehn, K, 1985. The Structure of Corporate Ownership: Causes and
Consequences. Journal of Political Economics, 93, 1155-1177.
Esty, B., 1998. The impact of Contingent Liability on Commercial Bank Risk Taking.
Journal of Financial Economics, 47, 189-218.
Flannery, M. J., 2001. The faces of market discipline, Journal of Financial Services
Research, 20(2-3), 107-119.

38
Galai, D., Masulis, R., 1976. The Option Pricing Model and the Risk Factor of Stock.
Journal
of Financial Economics, 3 ,53-81.
Givoly, D., Hayn, C., Katz, S., Does public ownership of equity improve earnings
quality? Accounting Review, Forthcoming.
Gorton, G., Rosen, R.,1995. Corporate Control, Portfolio Choice, and the Decline of
Banking. Journal of Finance, 50, 509-527.
Goyeau, D., Tarazi A., 1992. Evaluation du risqué de défaillance bancaire en Europe.
Revue d’Economie Politique, 102, 249-280.
Gugler, K., Weigland, J., 2003. Is ownership endogenous?, Applied Economics
Letters, 10, 483-486.
Heckman, J., 1979. Sample selection bias as a specification error. Econometrica, 47,
153-161.
Himmelberg, C., Hubbard, R., Palia, D, 1999. Understanding the determinants of
managerial ownership and the link between ownership and performance, Journal of
Financial Economics, 53, 353-384.
Iannota, G., Giacomo, N., Sironi, A., 2007. Ownership Structure, Risk and
Performance in the European Banking Industry. Journal of Banking and Finance, 31,
2127-2149.
James, H., 1999. Owner as manager, extended horizon and the family firm.
International Journal of the Economics of Business, 6, 41-56
Jensen, M.C., Meckling, W.H., 1976. Theory of the firm: Managerial behavior,
Agency cost and Ownership structure. Journal of Financial Economics, 3, 305-360.
Knopf, J.K., Teal, J., 1996. Risk-taking behavior in the U.S thrift industry: ownership
structure and regulatory changes. Journal of Banking and Finance, 1, 3-11.
Kwan, HK., 2004. Risk and Return of Publicly held versus Privately Owned banks.
FRBNY Economic Policy Review.
Laeven, L., 1999. Risk and efficiency in East Asian banks. World Bank Discussion
Paper n°2255.
La Porta, R., Lopez-de-Silanes, F., Shleifer, A., Vishny, R., 1999. Corporate
ownership around the world. Journal of Finance, 54, 471-517.
La Porta, R., Lopez-de-Silanes, F., Shleifer, A., Vishny, R., 1998. Law and Finance,
Journal of Political Economy, 106(6), 1113,-1155.
39
Lepetit, L., Nys, E., Rous, P., Tarazi, A., 2008. Bank Income Structure and Risk: An
Empirical Analysis of European Banks, Journal of Banking and Finance, 32, 1452-
1467.
Micco,A., Ugo, P., Monica, Y., 2007. Bank ownership and performance: Does politics
matter? Journal of Banking and Finance, 31, 219-241.
Morck, R., Stangeland, D., Yeung, B., 2000. Inherited wealth, corporate control, and
economic growth: The Canadian disease, in: Morck, R. (Ed.), Concentrated Corporate
Ownership, National Bureau of Economic Research Conference Volume, University
of Chicago Press.
Nichols, D., Wahlen, J., Wieland, M., 2009. Publicly-traded versus privately-held:
implications for conditional conservatism in bank accounting. Review of Accounting
Studies, 14(1), 88-122.
Pound J., 1988. Proxy contests and the efficiency of shareholder oversight. Journal of
Financial Economics, 10, 53-83
Saunders, A., Strock, E., Travlos, N., 1990. Ownership Structure, Deregulation, and
Bank Risk Taking. Journal of Finance, 45(2), 643-654.
Shleifer A., 1998. State versus private ownership. Journal of Economic Perspective,
12, 133-150.
Shleifer A., Vishny R.W., 1998. The grabbing hand: government pathologies and their
cures, Harvard University Press, MA.
Shleifer A., Vishny R.W., 1997. A survey of corporate governance. Journal of
Finance, 52, 737-783.
Shleifer, A., Vishny, R., 1986. Large Shareholders and Corporate Control. Journal of
Political Economy, 94, 461-488.
Stein, JC., 1989. Efficient capital markets, inefficient firms: A model of myopic
corporate behavior. Quarterly Journal of Economics, 104, 655-669.
Stein, JC., 1988 .Takeover threats and managerial myopia. Journal of Political
Economy, 96, 61-68.
Sullivan, R., Spong, K.R, 2007. Managerial Wealth, Ownership Structure, and Risk in
Commercial Banks. Journal of Financial Intermediation, 16, 229-248.
Williams, J., Nguyen, N., 2005. Financial liberalization, crisis, and restructuring: A
comparative study of bank performance and bank governance in South East Asia.
Journal of Banking and Finance, 29, 2119-2154.

40
Appendix 1
Table A1 Distribution per country of the number of banks for which the ownership
variables are different from zero and the percentage of stock held by the different
categories of owners
MANAGER FAMILY INSTITUT COMPANY BANK
0 0 2 5 11 Austria
(0,00) (0,00) (87,00) (60,73) (74.72)
1 1 1 2 4 Belgium
(16,48) (37,71) (100,00) (64.37) (99.99)
2 4 8 4 6 Denmark
(5,60) (6,22) (19,55) (12,02) (36.56)
0 1 2 2 2 Finland
(0,00) (10,44) (21,84) (7,15) (29.50)
2 1 7 16 57 France
(3,36) (0,07) (37,23) (48,89) (88.94)
1 2 6 8 25 Germany
(2,00) (60,66) (86,09) (77,82) (92.94)
1 2 3 2 2 Greece
(5,96) (12,94) (28,57) (29,97) (13.89)
0 0 2 4 2 Irland
(0,00) (0,00) (15,80) (6.84) (55.55)
0 5 7 10 14 Italy
(0,00) (3,23) (15,55) (23.62) (61.92)
0 1 4 3 28 Luxembourg
(0,00) (66,87) (51,66) (66.70) (98.53)
0 0 0 1 7 Netherlands
(0,00) (0,00) (0,00) (10.20) (87.60)
0 0 2 1 1 Portugal
(0,00) (0,00) (32,76) (15.94) (16.41)
1 4 6 11 12 Spain
(33,72) (17,51) (21,50) (14.54) (53.68)
0 0 2 2 0 Sweden
(0,00) (0,00) (14,54) (17.29) (0,00)
0 2 0 3 1 Switzerland
(0,00) 15,77 (0,00) (66.18) (69.00)
0 2 3 4 8 United Kingdom
(0,00) (50.14) (15,00) (60.60) (83.62)
Total 8 25 55 78 180
For each country, the first line indicates the number of banks for which the ownership variables are
different from zero, and the second line, in brackets, indicates the percentage of stock held by the
different categories of owners.
For example, in Belgium, we have 1 bank in which managers/directors hold equity, and these
managers/directors hold on average 16.48 of the total equity.

41
Table A2. Descriptive statistics of the ownership variables for the large sample of 905
banks for which Bankscope Fitch IBCA provide information on the ownership
structure in 2005
MANAGERa FAMILY INSTITUT COMPANY BANK
=0 >0 =0 >0 =0 >0 =0 >0 =0 >0
Number of
banks
891
(98.46)
14
(1.54)
845
(93.38)
60
(6.62)
724
(80)
181
(20)
649
(71.72)
256
(28.28)
289
(31.94)
616
(68.06)
Percentage
of equity 0 0.192 0 2.769 0 9.664 0 18.097 0 62.316
Five categories of owners are considered: (i) managers/directors (MANAGER); (ii) non-financial
companies (COMPANY); (iii) individual/family investors (FAMILY); (iv) banks (BANK); and (v)
institutional investors - insurance company, financial companies and mutual & pension funds -
(INSTITUT). a For example, in the broad sample, we have 891 banks for which managers do not hold equity and 14
banks for which managers do hold equity. We also present the percentage of banks for which the
variable MANAGER is not equal to zero (1.54%) as well as the percentage of equity held on average by
the 14 managers who hold a stake (0.192%)

42
Table A3. Influence of ownership structure and ownership dispersion on the risk-taking behavior of banks, cross-section OLS regressions
Risk measures Default Risk measures Profitability measures
SDROA SDROE M_LLP Z ZP ZP1 ZP2 M_ROA M_ROE -0.0284 -6.519 3.489* 38.28 15.27 -2.848 18.12 2.814*** 23.05***
CONSTANT (-0.04) (-0.54) (1.80) (1.21) (0.33) (-0.47) (0.44) (3.43) (3.14)
0.674*** 7.696*** 0.0000831 -2.400 -3.674 -0.535* -3.139 0.114* 0.414 MANAGER
(15.55) (11.48) (0.00) (-1.35) (-1.52) (-1.97) (-1.44) (1.67) (0.43)
-0.00179 -0.0565 -0.0162** -0.0223 -0.241 -0.0343 -0.207 -0.00384 -0.0402 FAMILY
(-0.52) (-1.47) (-2.05) (-0.04) (-0.51) (-0.86) (-0.48) (-0.61) (-1.03)
0.00228 -0.0357 -0.0152 0.0743 -0.0171 0.0148 -0.0319 -0.00589 0.0121 COMPANY
(0.54) (-0.47) (-1.37) (0.22) (-0.06) (0.47) (-0.13) (-0.82) (0.25)
-0.00583** -0.0688* -0.00348 0.935 0.593 -0.00322 0.597 -0.00307 -0.0474 BANK
(-2.11) (-1.71) (-0.31) (1.60) (1.01) (-0.16) (1.02) (-0.91) (-1.19)
-0.677*** -7.768*** -0.0271 1.591 3.116 0.460 2.656 -0.0917 -0.133 MANAGER*HERF_MANAGER
(-14.97) (-10.86) (-0.38) (0.76) (1.20) (1.54) (1.13) (-1.30) (-0.14)
-0.00565 -0.0424 -0.00299 0.895 0.784 0.0610 0.723 0.00681 0.0896 FAMILY*HERF_FAMILY
(-0.70) (-0.46) (-0.22) (0.61) (0.81) (0.76) (0.81) (0.53) (0.90)
-0.00572 0.0819 0.00616 0.128 0.0168 -0.0330 0.0497 0.00444 -0.0163 COMPANY*HERF_COMPANY
(-1.10) (0.57) (0.48) (0.34) (0.05) (-0.86) (0.16) (0.54) (-0.23)
0.00443* 0.0444 -0.00881 -0.726 -0.513 0.000431 -0.514 0.00229 0.0424 BANK*HERF_BANK
(1.92) (1.33) (-0.90) (-1.19) (-0.80) (0.02) (-0.81) (0.79) (1.29)
0.0638* 1.135* -0.110 -3.932** -3.274 0.104 -3.378 -0.0933** -0.359 M_LNTA
(1.87) (1.88) (-1.19) (-2.14) (-1.06) (0.35) (-1.16) (-2.14) (-1.09)
0.0656*** -0.0148 -0.0553** -0.182 -0.833 -0.100 -0.733 0.0454** -0.132 M_OEQUITY
(6.64) (-0.15) (-2.07) (-0.43) (-1.38) (-1.63) (-1.30) (2.44) (-1.38)
-0.00167 0.000154 -0.0130 0.0389 0.00860 -0.0652*** 0.0738 -0.00638** -0.0924*** M_DEPOSIT
(-0.81) (0.00) (-1.44) (0.27) (0.03) (-2.73) (0.30) (-2.04) (-3.14)
0.229 4.484 -0.367 8.779 32.71 8.985* 23.73 -0.433 0.891 LISTED
(0.50) (0.80) (-0.48) (0.43) (1.04) (1.93) (0.87) (-1.03) (0.20)
0.0505 1.242 -0.120 0.439 6.170 0.0529 6.117 -0.177*** -2.047*** LAMBDA
(1.09) (1.47) (-0.58) (0.14) (1.27) (0.14) (1.32) (-2.73) (-3.06)
-0.174 -3.660 -0.130 -0.525 -18.29 -5.978* -12.31 0.168 -1.699 LAMBDA*LISTED
(-0.48) (-0.76) (-0.35) (-0.04) (-0.81) (-1.78) (-0.62) (0.44) (-0.54)
COUNTRY DUMMIES Yes Yes Yes Yes Yes Yes Yes Yes Yes
Number of obs. 244 244 241 242 244 244 244 244 243
R2 0.313 0.0960 0.108 0.148 0.0644 0.154 0.0623 0.306 0.231
***, ** and * indicate significance, respectively, at the 1%, 5% and 10%levels respectively. t-statistics are corrected for heteroskedasticity following White’s methodology.
Variable definitions (standard deviations and means are computed over the period 1999-2005): SDROA= standard deviation of the return on average assets; SDROE = standard deviation of the return
on average equity , M_LLP = mean of the ratio of loan loss provisions to net loans; Z = Z-score; ZP = ZP-score; ZP1=measure of bank portfolio risk; ZP2 = measure of leverage risk; M_ROA= mean
of the return on average asset; M_ROE= mean of the return on average equity; M_LNTA= mean of the natural logarithm of total asset; M_OEQUITY = mean of the ratio of equity to total assets
orthogonalized with TA; M_DEPOSIT = mean of the ratio of deposits to total assets; LISTED = a dummy variable which takes the value of one if the bank is listed on the stock market and zero
otherwise; LAMBDA is the inverse Mills ratio estimated for each bank from the first-stage Probit model. The variables MANAGER, FAMILY, COMPANY and BANK represent the percentage of stock
held respectively by managers/directors, families/individuals, non-financial companies and banks. HERF_J represents the Herfindahl index computed to measure the ownership
dispersion for the category of shareholder J (see Table 6 for a definition). We also include dummy variables to account for country specific effects.

43
Table A4: Influence of ownership structure on the risk-taking behavior and profitability of large banks (Model 1), cross-section OLS regressions
Risk measures Default Risk measures Profitability measures
SDROA SDROE M_LLP Z ZP ZP1 ZP2 M_ROA M_ROE
CONSTANT 0.300 3.445 0.181 4.822 -24.90 -2.520 -22.38 3.445*** 43.79***
(0.29) (0.19) (0.07) (0.13) (-0.44) (-0.29) (-0.47) (3.55) (4.29)
FAMILY -0.00592* -0.125** -0.00219 0.741*** 0.0199 -0.0345 0.0544 -0.00182 -0.0719*
(-1.93) (-2.25) (-0.36) (2.76) (0.07) (-0.78) (0.23) (-0.56) (-1.96)
COMPANY -0.000298 0.0875 0.00434 0.281 -0.288 -0.0383 -0.250 -0.00450 -0.0606
(-0.09) (0.73) (0.62) (1.41) (-1.43) (-1.20) (-1.46) (-0.98) (-0.90)
BANK -0.00196 -0.0387 0.000536 0.538** -0.0881 -0.0283 -0.0598 -0.00235 -0.0693***
(-1.38) (-1.08) (0.18) (2.28) (-0.42) (-0.78) (-0.34) (-1.08) (-2.85)
M_LNTA 0.0447 0.601 0.0516 -2.953 -0.329 -0.0668 -0.262 -0.114** -1.342***
(0.88) (0.70) (0.44) (-1.35) (-0.11) (-0.16) (-0.11) (-2.37) (-2.68)
M_OEQUITY 0.0564*** -0.162 -0.0579*** 0.349 0.275 -0.0262 0.302 0.0570*** -0.0766
(4.55) (-0.72) (-2.85) (0.63) (0.30) (-0.21) (0.38) (4.43) (-0.47)
M_DEPOSIT -0.00190 -0.0306 -0.00728 0.0763 -0.143 -0.0625** -0.0808 -0.00662** -0.118***
(-0.57) (-0.47) (-0.49) (0.43) (-0.61) (-2.04) (-0.38) (-2.21) (-3.00)
LISTED 0.338 3.985 0.807 25.76 58.60 10.37 48.24 -0.796 -7.725
(0.59) (0.49) (0.67) (1.20) (1.49) (1.57) (1.46) (-1.54) (-1.37)
LAMBDA 0.0813 2.532 0.0561 -3.217 1.931 0.0378 1.893 -0.168*** -3.039***
(1.21) (1.62) (0.15) (-1.12) (0.38) (0.05) (0.43) (-2.64) (-3.21)
LAMBDA*LISTED -0.274 -3.839 -0.447 -0.919 -36.27 -7.058 -29.21 0.306 1.021
(-0.59) (-0.61) (-0.93) (-0.07) (-1.38) (-1.60) (-1.32) (0.65) (0.25)
COUNTRY DUMMIES Yes Yes Yes Yes Yes Yes Yes Yes Yes
Number of obs. 151 151 150 150 151 151 151 151 150
R2 0.259 0.148 0.103 0.289 0.144 0.205 0.136 0.378 0.233
***, ** and * indicate significance at the 1%, 5% and 10% levels respectively. t-statistics are corrected for heteroskedasticity following White’s methodology.
Variable definitions (standard deviations and means are computed over the period 1999-2005): SDROA= standard deviation of the return on average assets;
SDROE = standard deviation of the return on average equity , M_LLP = mean of the ratio of loan loss provisions to net loans; Z = Z-score; ZP = ZP-score;
ZP1=measure of bank portfolio risk; ZP2 = measure of leverage risk; M_ROA= mean of the return on average asset; M_ROE= mean of the return on average
equity; M_LNTA= mean of the natural logarithm of total asset; M_OEQUITY = mean of the ratio of equity to total assets orthogonalized with TA; M_DEPOSIT =
mean of the ratio of deposits to total assets; LISTED = a dummy variable which takes the value of one if the bank is listed on the stock market and zero otherwise;
LAMBDA is the inverse Mills ratio estimated for each bank from the first-stage Probit model. The variables FAMILY, COMPANY and BANK represent the
percentage of stock held respectively by families/individuals, non-financial companies and banks. We also include dummy variables to account for country
specific effects.

44
Table A5 Influence of ownership structure on the risk-taking behavior and profitability of small banks (Model 1), cross-section OLS regressions
Risk measures Default Risk measures Profitability measures
SDROA SDROE M_LLP Z ZP ZP1 ZP2 M_ROA M_ROE
CONSTANT 2.171* 12.99 8.449** -226.3*** -208.4** -16.05** -192.4** 2.126 5.490
(1.73) (1.41) (2.27) (-3.13) (-2.62) (-2.19) (-2.58) (1.12) (0.42)
FAMILY -0.0286** -0.296*** -0.0357 5.077*** 4.520*** 0.344*** 4.176*** 0.0328** 0.252**
(-2.61) (-3.18) (-0.97) (6.05) (5.86) (7.15) (5.62) (2.36) (2.09)
COMPANY -0.00914** -0.0651** -0.0203 0.339 0.309 0.00116 0.308 0.00130 0.0338
(-2.31) (-2.37) (-1.58) (1.54) (1.27) (0.08) (1.30) (0.29) (1.00)
BANK -0.00259 -0.0374 -0.0179 0.0919 0.309 0.0241 0.285 0.000652 0.0306
(-0.78) (-1.53) (-1.52) (0.57) (1.58) (1.42) (1.54) (0.17) (0.91)
M_LNTA 0.00454 0.786 -0.372* -4.794 -5.169 -0.155 -5.014 -0.258* -0.779
(0.05) (1.29) (-1.74) (-0.80) (-0.73) (-0.25) (-0.74) (-1.70) (-0.73)
M_OEQUITY 0.0679*** 0.0612 -0.0723 -0.589 -2.073 -0.150* -1.923 0.0245 -0.190
(4.57) (0.98) (-1.33) (-0.66) (-1.57) (-1.70) (-1.49) (0.70) (-1.38)
M_DEPOSIT -0.00468 -0.0286 -0.0121 0.532 0.753 -0.0633 0.816 -0.00690 -0.119***
(-1.63) (-1.24) (-1.11) (1.23) (1.15) (-1.63) (1.27) (-1.18) (-2.92)
LISTED -0.479 0.450 -1.844 -32.06 -2.338 2.973 -5.311 -0.249 8.212
(-0.87) (0.10) (-1.25) (-0.82) (-0.05) (0.72) (-0.11) (-0.32) (1.10)
LAMBDA -0.00960 -0.106 -0.232 5.079 12.04 -0.145 12.18 -0.221* -1.758**
(-0.13) (-0.21) (-1.10) (1.12) (1.39) (-0.34) (1.43) (-1.95) (-2.06)
LAMBDA*LISTED 0.924** 9.024* 0.669 -49.80 -36.79 -2.027 -34.76 -0.324 -13.90
(2.15) (1.86) (0.59) (-1.14) (-0.80) (-0.52) (-0.79) (-0.34) (-1.52)
COUNTRY DUMMIES Yes Yes Yes Yes Yes Yes Yes Yes Yes
Number of obs. 93 93 91 92 93 93 93 93 93
R2 0.500 0.208 0.193 0.183 0.127 0.177 0.125 0.342 0.267
***, ** and * indicate significance at the 1%, 5% and 10% levels respectively. t-statistics are corrected for heteroskedasticity following White’s methodology.
Variable definitions (standard deviations and means are computed over the period 1999-2005): SDROA= standard deviation of the return on average assets;
SDROE = standard deviation of the return on average equity , M_LLP = mean of the ratio of loan loss provisions to net loans; Z = Z-score; ZP = ZP-score;
ZP1=measure of bank portfolio risk; ZP2 = measure of leverage risk; M_ROA= mean of the return on average asset; M_ROE= mean of the return on average
equity; M_LNTA= mean of the natural logarithm of total asset; M_OEQUITY = mean of the ratio of equity to total assets orthogonalized with TA; M_DEPOSIT =
mean of the ratio of deposits to total assets; LISTED = a dummy variable which takes the value of one if the bank is listed on the stock market and zero
otherwise; LAMBDA is the inverse Mills ratio estimated for each bank from the first-stage Probit model. The variables FAMILY, COMPANY and BANK represent
the percentage of stock held respectively by families/individuals, non-financial companies and banks. We also include dummy variables to account for country
specific effects.

45
Table A6: Market discipline and influence of ownership structure on risk and profitability, cross-section OLS regressions Risk measures Default Risk measures Profitability measures
SDROA SDROE M_LLP Z ZP ZP1 ZP2 M_ROA M_ROE
0.435 4.764 2.128** 57.09*** 90.72** 6.317** 84.41** 1.880*** 15.62*** CONSTANT ( 0β )
(0.84) (0.75) (2.50) (2.80) (2.47) (2.42) (2.37) (3.55) (3.52)
-0.00466 -0.0810** -0.0209* 0.283 0.283 0.0146 0.268 0.000322 -0.000599 FAMILY ( 1β )
(-1.38) (-2.66) (-1.86) (1.93) (0.83) (-0.80) (0.99) (-0.17) (-0.37)
-0.00253 -0.0109 -0.0112 0.119 -0.00461 -0.0246 0.0200 -0.000389 -0.0321 COMPANY ( 2β )
(-0.78) (-0.26) (-1.05) (0.67) (-0.03) (-1.37) (0.12) (-0.10) (-0.67)
-0.000124 -0.0177 -0.00933 0.161 0.0473 -0.00462 0.0519 -0.000950 -0.0129 BANK ( 3β )
(-0.05) (-0.64) (-1.07) (1.03) (0.33) (-0.26) (0.41) (-0.37) (-0.49)
0.0240 -0.388 -0.0120 -3.613* -1.963 -0.315 -1.647 -0.0344 -0.558** FAMILY*DISCIPLINE ( 4β )
(0.96) (-0.62) (-0.26) (-1.89) (-0.82) (-1.10) (-0.75) (-0.91) (-2.07)
-0.00105 0.112 0.00815 0.155 -0.0597 -0.00250 -0.0572 -0.00369 0.0391 COMPANY*DISCIPLINE ( 5β )
(-0.24) (0.73) (0.62) (0.69) (-0.21) (-0.06) (-0.22) (-0.58) (0.71)
-0.00296 -0.00628 -0.00204 0.139 0.0663 -0.0390 0.105 -0.00187 -0.0392 BANK*DISCIPLINE ( 6β )
(-0.91) (-0.15) (-0.22) (0.70) (0.21) (-0.90) (0.38) (-0.46) (-1.07)
0.0569** 0.857** -0.0658 -5.144*** -6.686** -0.311 -6.374** -0.0591* -0.0817 M_LNTA ( 8β )
(2.26) (2.16) (-1.11) (-2.77) (-2.14) (-1.45) (-2.10) (-1.66) (-0.29)
0.0647*** 0.0123 -0.0527** -0.216 -0.892 -0.121* -0.771 0.0482*** -0.141 M_OEQUITY ( 9β )
(7.14) (0.17) (-1.97) (-0.52) (-1.56) (-1.79) (-1.46) (2.77) (-1.57)
-0.000872 -0.0280 -0.00514 0.0456 -0.200 -0.0229 -0.177 -0.00384 -0.0133 M_DEPOSIT ( 10β )
(-0.24) (-0.70) (-0.82) (0.24) (-1.01) (-1.27) (-0.94) (-1.07) (-0.39)
0.0360 -1.983 -0.339 -4.698 8.936 1.971 6.965 0.395 2.535 DISCIPLINE ( 7β )
(0.17) (-0.60) (-0.48) (-0.38) (0.38) (0.51) (0.34) (1.06) (0.89)
COUNTRY DUMMIES Yes Yes Yes Yes Yes Yes Yes Yes Yes
Risk level to reject 1 4 0β + β = 0.419 0.460 0.528 0.0859* 0.455 0.253 0.506 0.356 0.0364**
Risk level to reject 2 5 0β + β = 0.291 0.488 0.745 0.102 0.788 0.467 0.858 0.483 0.874
Risk level to reject 3 6 0β + β = 0.137 0.438 0.0123** 0.0466** 0.706 0.324 0.554 0.384 0.0763*
Number of obs. 247 247 244 245 247 247 247 247 246
R2 0.296 0.0869 0.106 0.124 0.0529 0.116 0.0509 0.305 0.150
***, ** and * indicate significance at the 1%, 5% and 10% levels respectively. t-statistics are corrected for heteroskedasticity following White’s methodology.
Variable definitions (standard deviations and means are computed over the period 1999-2005): SDROA= standard deviation of the return on average assets; SDROE = standard deviation of the return
on average equity , M_LLP = mean of the ratio of loan loss provisions to net loans; Z = Z-score; ZP = ZP-score; ZP1=measure of bank portfolio risk; ZP2 = measure of leverage risk; M_ROA= mean
of the return on average asset; M_ROE= mean of the return on average equity; M_LNTA= mean of the natural logarithm of total asset; M_OEQUITY = mean of the ratio of equity to total assets
orthogonalizedwith TA; M_DEPOSIT = mean of the ratio of deposits to total assets; DISCIPLINE = a dummy variable which takes the value of one if the bank holds more than the median value of
the ratio of market debt plus uninsured deposits to total assets and zero otherwise; The variables FAMILY, COMPANY and BANK represent the percentage of stock held respectively by
families/individuals, non-financial companies and banks. We also include dummy variables to account for country specific effects.

46
Table A7. Influence of the nature of the main shareholder on risk, probability of default, and profitability (Model 1), cross-section OLS
regressions
Risk measures Default Risk measures Profitability measures
SDROA SDROE M_LLP Z ZP ZP1 ZP2 M_ROA M_ROE
CONSTANT -0.0482 -8.277 2.869 60.14* 29.07 -2.010 31.08 2.818*** 23.40***
(-0.07) (-0.69) (1.57) (1.94) (0.63) (-0.34) (0.75) (3.66) (3.53)
FAMILY_OWNED -0.220 -5.555** -1.106** 8.898 1.354 -1.233 2.587 -0.257 -2.039
(-1.10) (-2.39) (-2.30) (0.60) (0.10) (-1.12) (0.21) (-0.87) (-0.84)
COMPANY_OWNED -0.146 4.054 -0.574 2.658 -4.438 -1.519 -2.919 -0.161 -0.564
(-0.73) (0.72) (-0.92) (0.19) (-0.36) (-1.18) (-0.25) (-0.61) (-0.19)
BANK_OWNED -0.0262 -1.045 -0.762* 10.39 4.429 -0.450 4.879 -0.0942 -1.138
(-0.16) (-0.53) (-1.72) (0.89) (0.40) (-0.33) (0.49) (-0.54) (-0.63)
M_LNTA 0.0635* 1.177* -0.120 -4.390** -3.671 0.0831 -3.754 -0.0900** -0.310
(1.90) (1.84) (-1.33) (-2.19) (-1.23) (0.30) (-1.33) (-2.08) (-0.96)
M_OEQUITY 0.0663*** 0.00803 -0.0531** -0.293 -0.926 -0.102* -0.823 0.0459** -0.127
(6.84) (0.09) (-1.99) (-0.71) (-1.57) (-1.74) (-1.49) (2.53) (-1.39)
M_DEPOSIT -0.00222 -0.00505 -0.0113 0.137 0.0754 -0.0671*** 0.142 -0.00701** -0.101***
(-1.04) (-0.13) (-1.30) (0.68) (0.28) (-3.06) (0.56) (-2.32) (-3.78)
LISTED 0.308 5.368 -0.300 -2.363 25.70 8.642* 17.06 -0.438 0.949
(0.69) (0.97) (-0.42) (-0.12) (0.83) (1.93) (0.62) (-1.07) (0.23)
LAMBDA 0.0447 1.262 -0.124 1.048 6.424 0.00419 6.420 -0.181*** -2.102***
(0.99) (1.42) (-0.62) (0.35) (1.40) (0.01) (1.46) (-2.84) (-3.23)
LAMBDA*LISTED -0.207 -4.171 -0.159 4.145 -14.89 -5.779* -9.110 0.158 -1.696
(-0.59) (-0.89) (-0.46) (0.30) (-0.67) (-1.79) (-0.47) (0.42) (-0.54)
COUNTRY DUMMIES Yes Yes Yes Yes Yes Yes Yes Yes Yes
Number of obs. 244 244 241 242 244 244 244 244 243
R2 0.289 0.0744 0.0924 0.104 0.0549 0.153 0.0520 0.301 0.221
***, ** and * indicate significance, respectively, at the 1%, 5% and 10%levels respectively. t-statistics are corrected for heteroskedasticity following White’s methodology.
Variable definitions (standard deviations and means are computed over the period 1999-2005): SDROA= standard deviation of the return on average assets; SDROE =
standard deviation of the return on average equity , M_LLP = mean of the ratio of loan loss provisions to net loans; Z = Z-score; ZP = ZP-score; ZP1=measure of bank
portfolio risk; ZP2 = measure of leverage risk; M_ROA= mean of the return on average asset; M_ROE= mean of the return on average equity; M_LNTA= mean of the natural
logarithm of total asset; M_OEQUITY = mean of the ratio of equity to total assets orthogonalized with TA; M_DEPOSIT = mean of the ratio of deposits to total assets;
LISTED = a dummy variable which takes the value of one if the bank is listed on the stock market and zero otherwise; LAMBDA is the inverse Mills ratio estimated for each
bank from the first-stage Probit model. We also include dummy variables to account for country specific effects. FAMILY-OWNED, COMPANY-OWNED and BANK-
OWNED are dummy variables which take the value of one when ownership is at least equal to 50% of total equity and 0 otherwise.
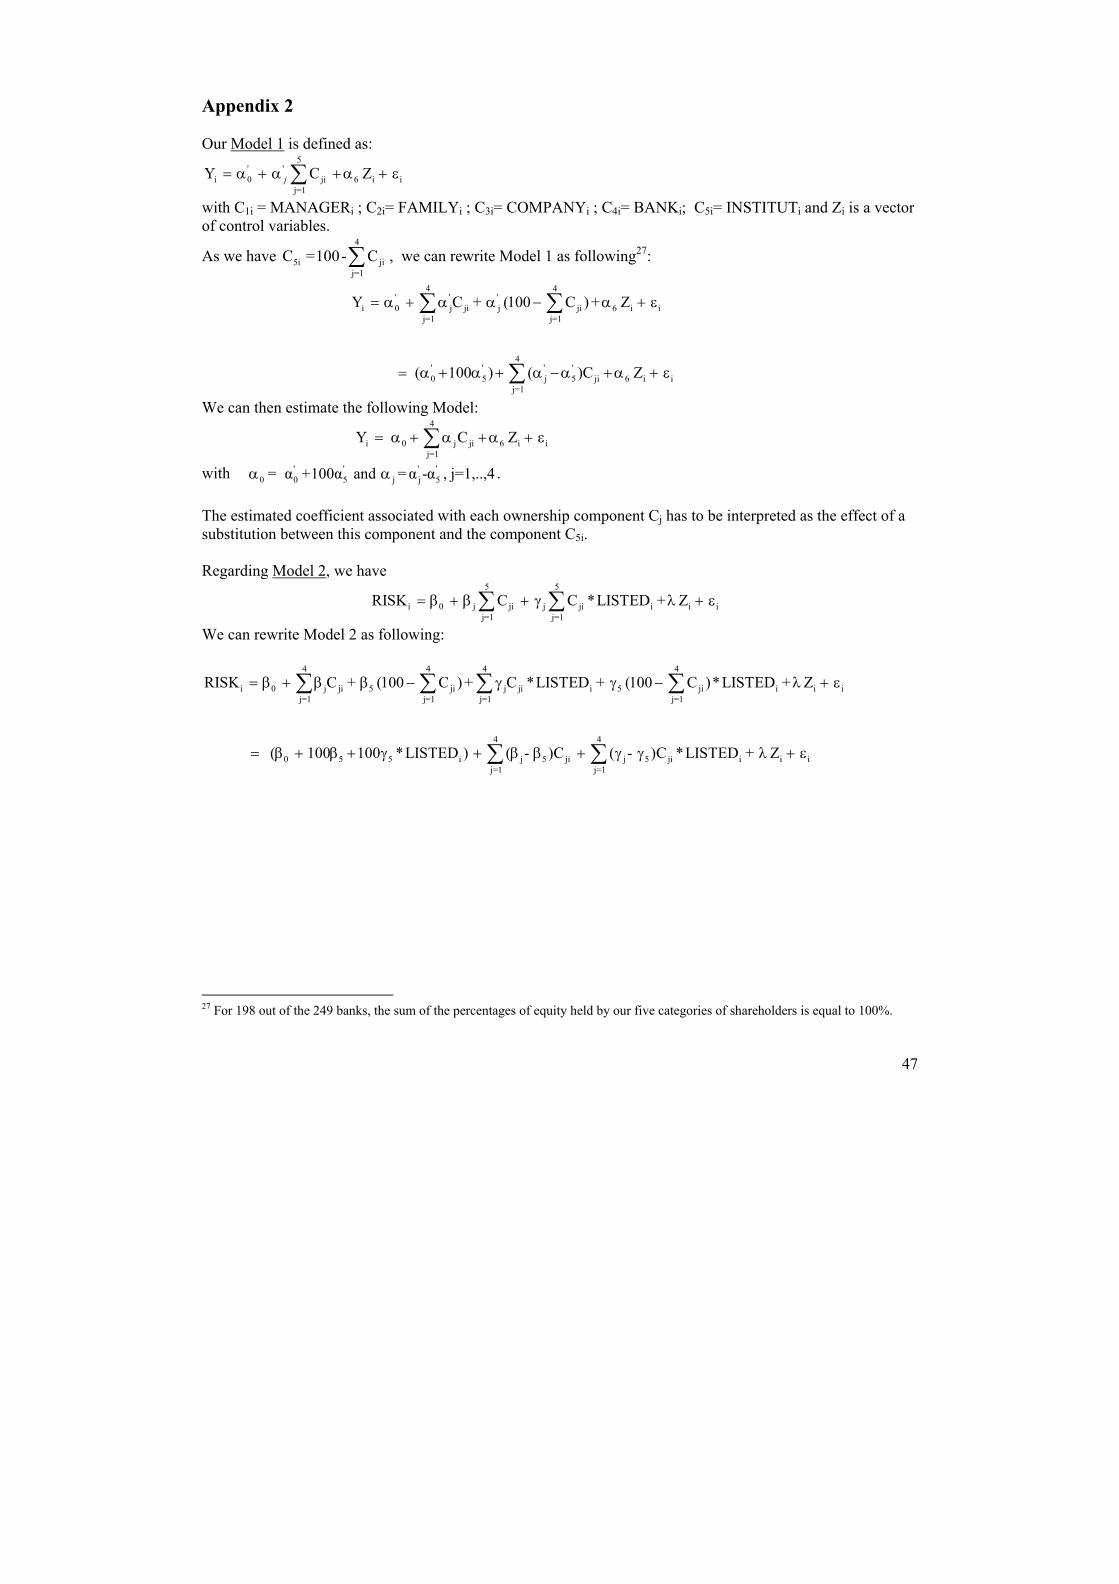
47
Appendix 2
Our Model 1 is defined as: 5
' '
i 0 ji 6 i i
j=1
Y C Zj= α + α +α + ε∑
with C1i = MANAGERi ; C2i= FAMILYi ; C3i= COMPANYi ; C4i= BANKi; C5i= INSTITUTi and Zi is a vector
of control variables.
As we have 4
5i ji
j=1
C =100- C∑ , we can rewrite Model 1 as following27
:
4 4' ' '
i 0 j ji j ji 6 i i
j=1 j=1
4' ' ' '
0 5 j 5 ji 6 i i
j=1
Y C + (100 C ) + Z
( 100 ) ( )C Z
= α + α α − α + ε
= α + α + α −α +α + ε
∑ ∑∑
We can then estimate the following Model:
4
i 0 j ji 6 i i
j=1
Y C Z= α + α +α + ε∑
with ' ' ' '
0 0 5 j j 5= α +100α and =α -α , j=1,..,4α α .
The estimated coefficient associated with each ownership component Cj has to be interpreted as the effect of a
substitution between this component and the component C5i.
Regarding Model 2, we have
5 5
i 0 j ji j ji i i i
j=1 j=1
RISK C C *LISTED + Z= β + β + γ λ + ε∑ ∑
We can rewrite Model 2 as following:
4 4 4 4
i 0 j ji 5 ji j ji i 5 ji i i i
j=1 j=1 j=1 j=1
4 4
0 5 5 i j 5 ji j 5 ji i i i
j=1 j=1
RISK C + (100 C ) + C *LISTED + (100 C )*LISTED + Z
( 100 100 *LISTED ) ( - )C ( - )C *LISTED + Z
= β + β β − γ γ − λ + ε
= β + β + γ + β β + γ γ λ + ε
∑ ∑ ∑ ∑∑ ∑
27 For 198 out of the 249 banks, the sum of the percentages of equity held by our five categories of shareholders is equal to 100%.