owner michael grottke approvers eric david klaudia … · ist-1999-55017 software reliability model...
TRANSCRIPT

IST-1999-55017
Software Reliability Model Study
Deliverable A.2
Owner Michael Grottke
Approvers Eric David
Klaudia Dussa-Zieger
Status Approved
Date 01/06/01

Contents
1 Introduction 31.1 Project overview . . . . . . . . . . . . . . . . . . . . . . . . . . . . . . . . . 31.2 This document . . . . . . . . . . . . . . . . . . . . . . . . . . . . . . . . . . 3
2 Important concepts in software reliability engineering 4
3 A unifying view on some software reliability growth models 63.1 Jelinski-Moranda de-eutrophication model . . . . . . . . . . . . . . . . . . . 63.2 Goel-Okumoto model . . . . . . . . . . . . . . . . . . . . . . . . . . . . . . . 73.3 Models with a time-varying testing-effort . . . . . . . . . . . . . . . . . . . . 73.4 Musa basic execution time model . . . . . . . . . . . . . . . . . . . . . . . . 83.5 Characteristics of the fault exposure ratio . . . . . . . . . . . . . . . . . . . 93.6 Musa-Okumoto logarithmic model . . . . . . . . . . . . . . . . . . . . . . . . 123.7 Enhanced Non-Homogeneous Poisson Process (ENHPP)
model . . . . . . . . . . . . . . . . . . . . . . . . . . . . . . . . . . . . . . . 133.8 Block coverage model . . . . . . . . . . . . . . . . . . . . . . . . . . . . . . . 153.9 Hypergeometric model for systematic testing . . . . . . . . . . . . . . . . . . 173.10 Conclusions . . . . . . . . . . . . . . . . . . . . . . . . . . . . . . . . . . . . 20
4 Linking additional information to software reliability growth models 244.1 Physical interpretation of model parameters . . . . . . . . . . . . . . . . . . 24
4.1.1 Physical interpretation of the parameters of the Musa basic model andthe Musa-Okumoto model . . . . . . . . . . . . . . . . . . . . . . . . 24
4.1.2 Relating the fault density to characteristics of the software and thesoftware development process . . . . . . . . . . . . . . . . . . . . . . 25
4.2 Bayesian software reliability growth models . . . . . . . . . . . . . . . . . . . 264.3 Parametric regression models for survival times . . . . . . . . . . . . . . . . 29
4.3.1 Models with time-invariant covariates . . . . . . . . . . . . . . . . . . 294.3.2 Models with time-varying covariates . . . . . . . . . . . . . . . . . . . 30
5 Different kinds of failure and testing data 325.1 Failures with different severities . . . . . . . . . . . . . . . . . . . . . . . . . 325.2 Current and past data from the same test cycle . . . . . . . . . . . . . . . . 325.3 Failure and testing data from different types of testing . . . . . . . . . . . . 335.4 Failure and testing data from different test phases . . . . . . . . . . . . . . . 345.5 Failure and testing data from different test cycles . . . . . . . . . . . . . . . 35
References 37
IST-1999-55017 SRModelStudy.pdf Page 2 of 41

1 Introduction
1.1 Project overview
The PETS project is a two-year research and development effort on the part of a consortiumof three industrial and one academic bodies, partially funded by the European Commissionunder the Fifth Framework Agreement (CRAFT project). The objective of PETS is todevelop a new, enhanced statistical model which predicts the reliability of SW programsbased on test and software maturity results. This new model will be implemented as aprototype which allows small and medium enterprises, especially small software companies,to predict the reliability of their developed and tested software in an easy and efficientmanner with a higher accuracy than currently possible.
1.2 This document
In this document existing software reliability growth models are studied. The second chapterdiscusses some important concepts in the field of software reliability engineering and alsodescribes the rationale for the way in which the software reliability growth models are com-pared in chapter 3. Since one of the goals of the PETS project is to include process maturitydata in a software reliability growth model, chapter 4 explains different existing approachesfor linking additional information to software reliability growth models. Chapter 5 discussesthe important question whether one model can be used for analyzing all testing-effort andfailure data of a software product or if some distinction has to be made either be using moremodels or by transforming some of the data collected.
IST-1999-55017 SRModelStudy.pdf Page 3 of 41

2 Important concepts in software reliability engineer-
ing
Software reliability is defined as the probability of failure-free software operation in a definedenvironment for a specified period of time. A failure is the departure of software behaviorfrom user requirements. This dynamic phenomenon has to be distinguished from the staticfault (or bug) in the software code, which causes the failure occurrence as soon as it isactivated during program execution.
Since software does not deprecate like hardware, the reliability of software stays constantover time if no changes are made to the code or to the environmental conditions includingthe user behavior. However, if each time after a failure has been experienced the underlyingfault is detected and perfectly fixed, then the reliability of software will increase with time.Typically this is the situation during the testing phase(s). As each failure occurrence initiatesthe removal of a fault, the number of failures that have been experienced by time t, denoted byM(t), can be regarded as a reflected image of reliability growth. Models trying to explain anddescribe the behavior of M(t) are called software reliability growth models (SRGMs). EachSRGM implicitly assumes a certain functional form of M(t). Using the failure times t1, t2, ...or the times between failures ∆t1,∆t2, ... collected during a testing project, the parametersof a SRGM can be estimated. The mean value function µ(t) of a SRGM represents theexpected number of failures experienced by time t according to the model. The derivativeof the mean value function with respect to time, dµ(t)
dt, is named failure intensity λ(t). It
represents the limit of the expected number of failures experienced in time interval [t; t+∆t)for ∆t approaching zero.
The failure intensity should not be mistaken for the hazard rate of the application,z(∆t | ti−1), the probability density for the ith failure being experienced at ti−1 + ∆t condi-tional that the (i−1)st failure has occurred at ti−1. In the field of survival analysis the hazardrate of a component is often denoted by λ(t) [10, 11, ch. 9]. Moreover, some researchersin software reliability call the program hazard rate “failure rate r(t)” [54, p. 53] or even“failure intensity λ(t)” [47, p. 88]. The fact that the program hazard rate z(∆t | ti−1) isindeed equal to the failure intensity at time ti−1 + ∆t for software reliability growth modelsof the Poisson type [41, p. 259] may contribute to this confusion. This study follows theterminology used in [41].
Many software reliability growth models do not only specify the hazard rate of the entireapplication, but also the hazard rate of an individual fault. If each fault is equally dangerous(with respect to its activation frequency, not in regard to the damage caused), then the timeuntil failure occurrence has the same probability density fa(t). The per-fault hazard rate of
each fault is then za(t) = fa(t)1−Fa(t)
, where Fa(t) =∫ t
0fa(x)dx. Therefore, the per-fault hazard
rate is a measure for the probability that a particular fault will instantaneously cause afailure, given that it has not been activated so far.1
The nature of the failure generating process depends on characteristics of the softwareproduct and the way in which it is used. The assumptions of many software reliability growth
1For more information on the basic concepts in software reliability engineering, please refer to [29] or to[41, pp. 3 -29].
IST-1999-55017 SRModelStudy.pdf Page 4 of 41

models basically mean that the relative frequencies with which the different functions areused are stable over time. I.e., the different parts of the software are not tested en bloc,but the next test case to be executed is always drawn randomly from the set of specifiedtest cases. Furthermore, if the reliability measure shall be extrapolated to what users willperceive then the relative frequencies of the functions should coincide with the expectedfrequencies prevailing after release. This methodology is named operational testing in short.While its supporters contend that it does not only bring about data which can be used forassessment of the current reliability but also results in detection of those faults that reallymatter in terms of occurrence probability [39], critics have argued that it is less efficient thansystematic testing techniques [43] and often not feasible for a number of reasons (cf. the listof arguments in [19]). Simulation studies [9, 21] as well as analytical examinations [13] ofthe different testing strategies could not prove that one of them is superior to the other.
Like the large majority of industrial organizations [13], the SMEs participating at thePETS project do not employ operational testing. Therefore, it has to be studied if the stan-dard software reliability models can be applied to data collected during systematic testing.As a first step, in chapter 3 different models are compared with respect to their buildingblocks. On the one hand the identification of a similar structure helps in unifying the mod-els. On the other hand the elements can be interpreted separately. This gives a deeperunderstanding of the models’ assumptions and may guide practitioners in model selection oreven in the creation of new models.
IST-1999-55017 SRModelStudy.pdf Page 5 of 41

3 A unifying view on some software reliability growth
models
3.1 Jelinski-Moranda de-eutrophication model
The de-eutrophication model developed by Jelinski and Moranda [24] in 1972 was one of thefirst software reliability growth models. It consists of some simple assumptions:
1. At the beginning of testing, there are u0 faults in the software code with u0 being anunknown but fixed number.
2. Each fault is equally dangerous with respect to the probability of its instantaneouslycausing a failure. Furthermore, the hazard rate of each fault does not change overtime, but remains constant at φ.
3. The failures are not correlated, i.e. given u0 and φ the times between failures(∆t1,∆t2, ... ∆tu0) are independent.
4. Whenever a failure has occurred, the fault that caused it is removed instantaneouslyand without introducing any new fault into the software.
As a consequence of these assumptions, the program hazard rate after removal of the (i−1)st
fault is proportional to the number of faults remaining in the software with the hazard rateof one fault, za(t) = φ, being the constant of proportionality:
z(∆t | ti−1) = φ[u0 −M(ti−1)] = φ[u0 − (i− 1)] (1)
The Jelinski-Moranda model belongs to the binomial type of models as classified by Musaet al. [41, pp. 250 - 252]. For these models, the failure intensity function is the product ofthe inherent number of faults and the probability density of the time until activation of asingle fault, fa(t), i.e.:
dµ(t)
dt= u0fa(t) = u0φ exp(−φt) (2)
Therefore, the mean value function is
µ(t) = u0[1− exp(−φt)]. (3)
It can easily be seen from equations (2) and (3) that the failure intensity can also be expressedas
dµ(t)
dt= φ[u0 − µ(t)]. (4)
According to equation (4) the failure intensity of the software at time t is proportionalto the expected number of faults remaining in the software; again, the hazard rate of anindividual fault is the constant of proportionality. This equation can be considered the“heart” of the Jelinski-Moranda model. Moreover, many software reliability growth modelscan be expressed in a form corresponding to equation (4). Their difference often lies in whatis assumed about the per-fault hazard rate and how it is interpreted. The models in thefollowing sections are presented with respect to this viewpoint.
IST-1999-55017 SRModelStudy.pdf Page 6 of 41
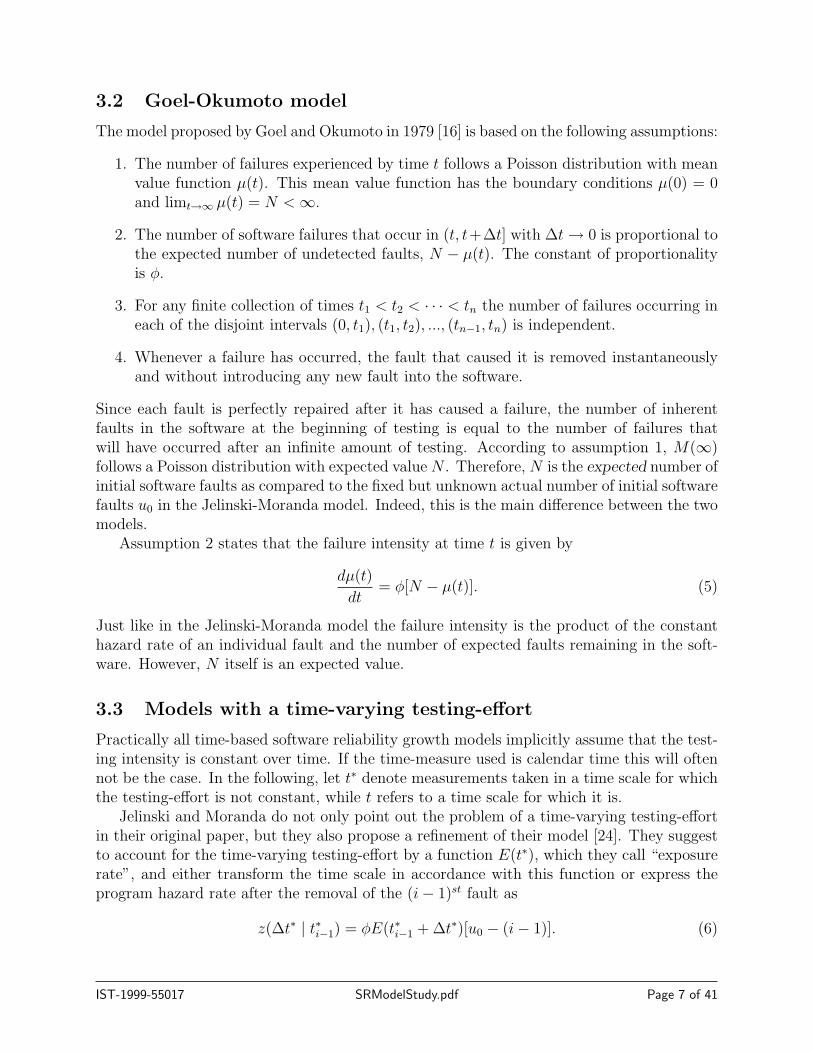
3.2 Goel-Okumoto model
The model proposed by Goel and Okumoto in 1979 [16] is based on the following assumptions:
1. The number of failures experienced by time t follows a Poisson distribution with meanvalue function µ(t). This mean value function has the boundary conditions µ(0) = 0and limt→∞ µ(t) = N <∞.
2. The number of software failures that occur in (t, t+∆t] with ∆t→ 0 is proportional tothe expected number of undetected faults, N − µ(t). The constant of proportionalityis φ.
3. For any finite collection of times t1 < t2 < · · · < tn the number of failures occurring ineach of the disjoint intervals (0, t1), (t1, t2), ..., (tn−1, tn) is independent.
4. Whenever a failure has occurred, the fault that caused it is removed instantaneouslyand without introducing any new fault into the software.
Since each fault is perfectly repaired after it has caused a failure, the number of inherentfaults in the software at the beginning of testing is equal to the number of failures thatwill have occurred after an infinite amount of testing. According to assumption 1, M(∞)follows a Poisson distribution with expected valueN . Therefore, N is the expected number ofinitial software faults as compared to the fixed but unknown actual number of initial softwarefaults u0 in the Jelinski-Moranda model. Indeed, this is the main difference between the twomodels.
Assumption 2 states that the failure intensity at time t is given by
dµ(t)
dt= φ[N − µ(t)]. (5)
Just like in the Jelinski-Moranda model the failure intensity is the product of the constanthazard rate of an individual fault and the number of expected faults remaining in the soft-ware. However, N itself is an expected value.
3.3 Models with a time-varying testing-effort
Practically all time-based software reliability growth models implicitly assume that the test-ing intensity is constant over time. If the time-measure used is calendar time this will oftennot be the case. In the following, let t∗ denote measurements taken in a time scale for whichthe testing-effort is not constant, while t refers to a time scale for which it is.
Jelinski and Moranda do not only point out the problem of a time-varying testing-effortin their original paper, but they also propose a refinement of their model [24]. They suggestto account for the time-varying testing-effort by a function E(t∗), which they call “exposurerate”, and either transform the time scale in accordance with this function or express theprogram hazard rate after the removal of the (i− 1)st fault as
z(∆t∗ | t∗i−1) = φE(t∗i−1 + ∆t∗)[u0 − (i− 1)]. (6)
IST-1999-55017 SRModelStudy.pdf Page 7 of 41

This second approach leads to the failure intensity function
dµ(t∗)
dt∗= φE(t∗)[u0 − µ(t∗)] (7)
and to the mean value function
µ(t∗) = u0
[1− exp
(−φ
∫ t∗
0
E(x)dx
)]. (8)
In 1986, Yamada, Ohtera and Narihisa [59] extended the Goel-Okumoto model following thesame line of thoughts as Jelinski and Moranda. They modified its assumption 2 by statingthat the ratio between the expected number of software failures occurring in (t∗, t∗+∆t∗] with∆t∗ → 0 and the current testing-effort expenditures w(t∗) is proportional to the expectednumber of undetected faults, N − µ(t∗). Therefore,
dµ(t∗)
dt∗= φw(t∗)[N − µ(t∗)] (9)
and
µ(t∗) = N
[1− exp
(−φ
∫ t∗
0
w(x)dx
)]= N [1− exp (−φW (t∗))] , (10)
where W (t∗) =∫ t∗
0w(x)dx.
Comparing equations (7) and (9) to equations (4) and (5), respectively, shows that thehazard rate of each fault remaining in the software - φE(t∗) or φw(t∗) - is not constant intime t∗, but varies due to the changing intensity of testing. Unlike Jelinski and Moranda,Yamada et al. propose particular functional forms for the testing-effort function. In [59] theydiscuss the exponential density function w(t∗) = αβ exp(−βt∗) and the Rayleigh densityfunction w(t∗) = 2αβt∗ exp(−βt∗2), while in [58] the more general Weibull density functionw(t∗) = mαβt∗m−1 exp (−βt∗m) is used. Huang, Kuo and Chen [23] suggest the logistic
density function w(t∗) = αβγ exp(−γt∗)
(1+β exp(−γt∗))2as an alternative.
Again, including w(t∗) in equation (9) is equivalent to transforming the time scale with
t = W (t∗) and considering µ(t) = µ(W (t∗)) and dµ(t)dt
= dµ(W (t∗))dW (t∗)
, because setting
dµ(W (t∗))
dW (t∗)= φ[N − µ(W (t∗))] (11)
leads todµ(W (t∗))
dt∗
dW (t∗)dt∗
=dµ(W (t∗))
dt∗1
w(t∗)= φ[N − µ(W (t∗))], (12)
which is equivalent to equation (9).
3.4 Musa basic execution time model
Assuming a certain distributional form of the testing-effort and introducing it into a softwarereliability growth model or using it to transform the time scale is only one approach to dealing
IST-1999-55017 SRModelStudy.pdf Page 8 of 41

with a time-varying testing-effort. If the time spent on testing could be measured in unitswhich ensure that the testing-effort is approximately constant, these data could be directlyfed into the original software reliability model. Musa’s basic execution time model [37]developed in 1975 was the first one to explicitly require that the time measurements are inactual CPU time utilized in executing the application under test (named “execution time”τ in short).2
Although it was not originally formulated like that the model can be classified by threecharacteristics [41, p. 251]:
1. The number of failures that can be experienced in infinite time is finite.
2. The distribution of the number of failures observed by time τ is of Poisson type.
3. The functional form of the failure intensity in terms of time is exponential.
It shares these attributes with the Goel-Okumoto model, and the two models are mathe-matically equivalent.
In addition to the use of execution time, a difference lies in the interpretation of theconstant per-fault hazard rate φ. Musa [37] split φ up in two constant factors, the linearexecution frequency f and the so-called fault exposure ratio K:3
dµ(τ)
dτ= fK[N − µ(τ)]. (13)
f can be calculated as the average object instruction execution rate of the computer, r, di-vided by the number of source code instructions of the application under test, IS, timesthe average number of object instructions per source code instruction, Qx: f = r
ISQx
[41, pp. 121 - 124]. The fault exposure ratio relates the fault velocity f [N − µ(τ)], thespeed with which defective parts of the code would be passed if all the statements wereconsecutively executed [41, p. 121], to the failure intensity experienced. Therefore, it canbe interpreted as the average number of failures occurring per fault remaining in the codeduring one linear execution of the program.
3.5 Characteristics of the fault exposure ratio
In the context of Musa’s basic execution time model K is assumed to be constant over time.Moreover, data published by Musa in 1979 and also listed in [41, p. 123] suggest that thefault exposure ratio might not vary considerably over a wide range of software systems: For13 projects with known program sizes between 5,700 and 2,445,000 object instructions thefault exposure ratio took values between 1.41 · 10−7 and 10.6 · 10−7 with an average value of
2The execution time τ can be considered a specific example for a time measure t with constant testing-effort.
3In a generalized version of his model, Musa also included the fault reduction factor B, the average rateof fault reduction to failure occurrence, and the testing compression factor C, the ratio of execution timerequired in the operational phase to execution time required in the test phase [37, 41, p. 178]. However,without additional information the parameters in the equation dµ(τ)
dτ = BCfK[N−µ(τ)] cannot be identified.Therefore, most authors do not consider B and C, i.e. they implicitly set them to 1.
IST-1999-55017 SRModelStudy.pdf Page 9 of 41
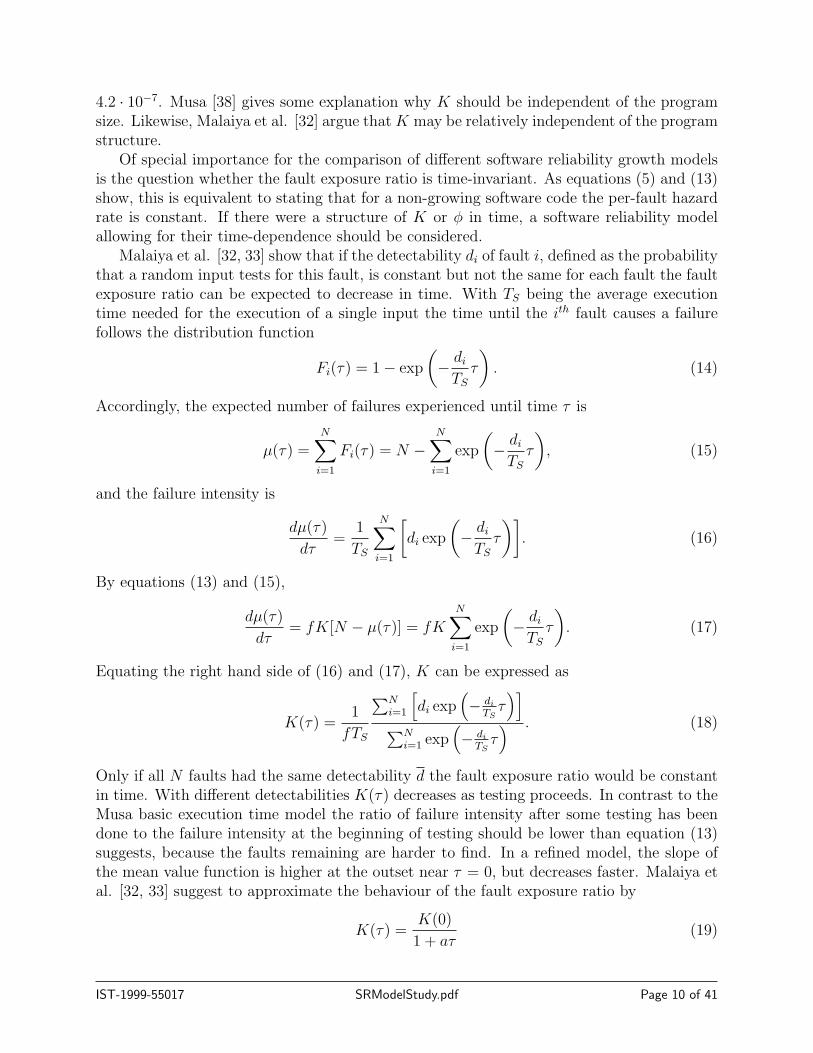
4.2 · 10−7. Musa [38] gives some explanation why K should be independent of the programsize. Likewise, Malaiya et al. [32] argue thatK may be relatively independent of the programstructure.
Of special importance for the comparison of different software reliability growth modelsis the question whether the fault exposure ratio is time-invariant. As equations (5) and (13)show, this is equivalent to stating that for a non-growing software code the per-fault hazardrate is constant. If there were a structure of K or φ in time, a software reliability modelallowing for their time-dependence should be considered.
Malaiya et al. [32, 33] show that if the detectability di of fault i, defined as the probabilitythat a random input tests for this fault, is constant but not the same for each fault the faultexposure ratio can be expected to decrease in time. With TS being the average executiontime needed for the execution of a single input the time until the ith fault causes a failurefollows the distribution function
Fi(τ) = 1− exp
(− di
TS
τ
). (14)
Accordingly, the expected number of failures experienced until time τ is
µ(τ) =N∑
i=1
Fi(τ) = N −N∑
i=1
exp
(− di
TS
τ
), (15)
and the failure intensity is
dµ(τ)
dτ=
1
TS
N∑i=1
[di exp
(− di
TS
τ
)]. (16)
By equations (13) and (15),
dµ(τ)
dτ= fK[N − µ(τ)] = fK
N∑i=1
exp
(− di
TS
τ
). (17)
Equating the right hand side of (16) and (17), K can be expressed as
K(τ) =1
fTS
∑Ni=1
[di exp
(− di
TSτ)]
∑Ni=1 exp
(− di
TSτ) . (18)
Only if all N faults had the same detectability d the fault exposure ratio would be constantin time. With different detectabilities K(τ) decreases as testing proceeds. In contrast to theMusa basic execution time model the ratio of failure intensity after some testing has beendone to the failure intensity at the beginning of testing should be lower than equation (13)suggests, because the faults remaining are harder to find. In a refined model, the slope ofthe mean value function is higher at the outset near τ = 0, but decreases faster. Malaiya etal. [32, 33] suggest to approximate the behaviour of the fault exposure ratio by
K(τ) =K(0)
1 + aτ(19)
IST-1999-55017 SRModelStudy.pdf Page 10 of 41

where a depends on the detectability profile of the faults in the application under test.Examination of data from real projects yields the following results [32, 33]:
1. As testing proceeds and the fault density D(τ) = N−µ(τ)ISQx
decreases within a testingproject the fault exposure ratio decreases indeed. However, at a fault density of about2 to 4 faults per KLOC (thousand lines of code) a minimum is reached. For smaller faultdensities, K(D) starts to rise again. Of course, there are variations of this behaviorfor different projects, and there is considerable noise in the data.
2. In a diagram depicting for several projects the fault exposure ratio estimated usingMusa’s basic execution time model in dependence on the average fault density of therespective application under test a similar curve is obtained. K(D) takes its minimumat about 2 faults per KLOC.
Since the fault density decreases as testing proceeds, the behavior of K(D) implies that K(τ)and the per-fault hazard rate fK(τ) also have the shape of a so-called bathtub curve. In thefield of hardware reliability, such a hazard rate is often assumed for systems or components[30]: Due to “infant mortality” the hazard rate starts out at high values at the beginningof the lifetime before it stabilizes at an approximately constant value during the operationalphase; wear-out is responsible for an increasing hazard rate at the end of the lifetime.
However, one has to bear in mind that fK(τ) is the hazard rate not of the entire appli-cation, but of one individual fault. For a Poisson process model the program hazard rate∆τ time units after the last failure occurrence at τi−1 is equal to the failure intensity atτi−1 + ∆τ [41, p. 259]:
z(∆τ | τi−1) = λ(τi−1 + ∆τ) (20)
In the context of what could be called a “refined Musa basic execution time model withtime-varying fault exposure ratio” the program hazard rate becomes
z(∆τ | τi−1) = fK(τ)[N − µ(τ)], (21)
the product of the per-fault hazard-rate fK(τ) and the expected number of faults remainingin the software code. Due to the second factor the program hazard rate tends to decrease intime. With the bathtub-shaped fK(τ) the decrease is even amplified at the outset of testinguntil K(τ) reaches its minimum. In contrast the trend is partly offset from then on. Thefewer faults there are in the software the more dangerous each individual fault becomes. Onepossible explanation is that testing gets relatively more efficient than what the assumptionof random testing implies [33]: the testers try to avoid the execution of redundant test casesand specifically test those areas of the software that have not been executed before or thatare still supposed to be error-prone.
To model the observed behavior of K, equation (19) should be modified. Malaiya et al.[32, 33] suggest to extend it by a factor that leads to an increasing K for low fault densities:
K(τ) =K(0)
1 + aτ
N
N − µ(τ)(22)
As noted before, Musa introduced the constant testing compression factor C - defined asthe ratio of execution time required in the operational phase to execution time required in
IST-1999-55017 SRModelStudy.pdf Page 11 of 41

the test phase [41, p. 178] - to take care of the higher efficiency of testing as compared tonormal use of the software in a generalization of his basic model [37]. It seems necessaryto let C increase with time, because the fraction of redundant executions gets larger in theoperational phase the more and more operations of the software have already been used.Still, the concept of C can be interpreted as a first attempt to account for pretty much thesame influences as the factor N
N−µ(τ)in the fault exposure ratio (22) proposed by Malaiya et
al.
3.6 Musa-Okumoto logarithmic model
Interestingly, the fault exposure ratio in equation (22) leads to another standard softwarereliability growth model: The failure intensity
dµ(τ)
dτ= f
K(0)
1 + aτ
N
N − µ(τ)[N − µ(τ)] = fK(0)N
1
1 + aτ(23)
belongs to the mean value function
µ(τ) =fK(0)N
aln(1 + aτ). (24)
This is the functional form of the Musa-Okumoto logarithmic model [42] :
µ(τ) = β0 ln(1 + β1τ). (25)
Like Musa’s basic execution time model the “logarithmic Poisson execution time model”(as it was originally dubbed) by Musa and Okumoto is based on failure data measured inexecution time. Its assumptions are as follows [12, 41, 42]:
1. At time τ = 0 no failures have been observed, i.e. P (M(0) = 0) = 1.
2. The failure intensity decreases exponentially with the expected number of failures
observed, i.e. λ(τ) = β0β1 exp(−µ(τ)
β0
), where β0β1 is the initial failure intensity and
β−10 is dubbed failure intensity decay parameter.
3. The number of failures observed by time τ , M(τ), follows a Poisson process.
As the derivation of the Musa-Okumoto logarithmic model by the fault exposure ratio hasshown, the exponentially decreasing failure intensity implies that the per-fault hazard ratehas the shape of a bathtub curve.
Expressing the fault exposure ratio of the logarithmic model not in terms of time but interms of the fault density [26, 27] can be the starting-point for a physical interpretation ofthe parameters β0 and β1 [8, 31] - see section 4.1.1.
IST-1999-55017 SRModelStudy.pdf Page 12 of 41

3.7 Enhanced Non-Homogeneous Poisson Process (ENHPP)model
Another aspect of testing used to explain why the per-fault hazard rate (and, consequently,the fault exposure ratio) should be time-dependent is the development of test coverage. Testcoverage c(t) can be defined as follows [17]:
c(t) =Number of potential fault sites sensitized through testing by time t
Total number of potential fault sites under consideration(26)
Potential fault sites are structural or functional program elements that may contain faults.Specifically, code constructs like blocks, decisions, c-uses and p-uses [22] may be consideredas potential faults sites. If the number of fault sites is large, c(t) can be regarded as acontinuous, non-decreasing function.
It is obvious that the rate at which failures occur during testing depends on the testers’ability to execute test cases that sensitize fault sites not tested before. The hazard rate ofthe faults remaining in the software at time t can also be viewed as the danger of them beingdetected.
In 1996 Gokhale, Philip, Marinos and Trivedi [17] introduced the enhanced non-homo-geneous Poisson process (ENHPP) model as a unifying framework for finite failure NHPPmodels. Its assumptions are as follows:
1. The N faults inherent in the software at the beginning of testing are uniformly dis-tributed over the potential fault sites.
2. At time t the probability that a fault present at the fault site sensitized at that momentcauses a failure is cd(t).
3. The development of test coverage as a function of time is given by c(t) withlimt→∞ c(t) = k ≤ 1.
4. Whenever a failure has occurred, the fault that caused it is removed instantaneouslyand without introducing any new fault into the software.
The expected portion of inherent faults that have caused a failure by time t depends on thedevelopment of coverage and on the time-varying activation probability cd(t):
µ(t) = N
∫ t
0
cd(x)c′(x)dx (27)
If the activation probability is a constant value cd over time, then equation (27) simplifies to
µ(t) = c(t)N , (28)
where N = Ncd ≤ N is the number of faults expected to have been exposed at full coverage.The failure intensity can be expressed as
dµ(t)
dt= c′(t)N =
c′(t)
1− c(t)[N − c(t)N ] =
c′(t)
1− c(t)[N − µ(t)]. (29)
Equation (29) is a generalization of equation (5) with respect to two elements:
IST-1999-55017 SRModelStudy.pdf Page 13 of 41

1. Not all faults in the software can necessarily be detected, even if full coverage has beenobtained. However, cd and N cannot be separately identified; it is only possible toestimate the number of detectable faults, N .
2. The per-fault (i.e. per-detectable-fault) hazard rate may change over time. Its vari-ation is explained by the development of test coverage achieved. If c(0) = 0 and
limt→∞ c(t) = 1, then c′(t)1−c(t)
can be interpreted as the hazard rate zc(t) of the distribu-tion function of the time to full coverage.
By plugging different distributions for c(t) into (29) various standard software reliabilitygrowth models can be obtained. Specifically, Gokhale et al. [17] discuss the followingdistributions:
1. The hazard rate of the exponential function c(t) = 1 − exp(−φt) is the constant φ.Assuming this form for the growth of coverage in time obviously leads to the Goel-Okumoto model.
2. By using the Weibull function c(t) = 1 − exp (−φtγ) with hazard rate zc(t) = φγtγ−1
a model dubbed “Goel generalized NHPP model” [15], “generalized Goel-Okumotomodel” [17] or simply “Weibull model” [12] is obtained. This model should not bemistaken for the Goel-Okumoto model extended by a Weibull testing effort (cf. section3.3), in which the constant hazard rate φ of the Goel-Okumoto model is not replacedwith the hazard rate of the Weibull distribution but augmented by the Weibull densityfunction. The generalized Goel-Okumoto model can be used to model the often foundsituation that the failure rate initially increases at the outset of testing and thendecreases; however, it also includes the exponential Goel-Okumoto model as a specialcase for γ = 1.
3. For the S-shaped coverage function c(t) = 1 − (1 + φt) exp(−φt) with hazard rate
zc(t) = φ2t1+φt
the resulting software reliability model is the one introduced by Ohba [45]for the number of faults removed when there is a delay between failure occurrence andfault removal.
Basically, any NHPP software reliability model with a finite number of failures to be experi-enced by infinite time can be fit into this framework. Mathematically, it is even possible todetermine functions c(t) that lead to NHPP models of the infinite failure category. E.g., the
Musa-Okumoto logarithmic model with c′(τ)1−c(τ)
= fK(0)1+aτ
NN−µ(τ)
= fK(0)1+aτ
NN−Nc(τ)
= fK(0)1+aτ
11−c(τ)
can be obtained by choosing c(τ) = fK(0)a
ln(1 + aτ). However, this c(τ) cannot be regardedas a test coverage function, because limτ→∞ c(τ) = k ≤ 1 is not satisfied.
While the merit of the ENHPP model lies in the comparison and unification of varioussoftware reliability growth models based on an equation of the form dµ(t)
dt= ψ(t)[N − µ(t)],
the interpretation of ψ(t) as solely depending on the time-varying test coverage seems toneglect other aspects. Test coverage is undoubtedly one driver of the failure occurrences.Experiments by Wong, Horgan, London and Mathur indicate that the correlation betweenblock coverage and fault detection effectiveness is higher than the correlation between thenumber of test cases (and thus the testing time) and the fault detection effectiveness [56].
IST-1999-55017 SRModelStudy.pdf Page 14 of 41

Similarly, minimizing the number of test cases in a test set while keeping the all-uses coverageconstant caused only relatively small reductions in the fault detection effectiveness [57].However, at different points in time the same amount of additional test coverage has not tobe expected to yield the same number of failures. A study of different testing techniquesundertaken by Hamlet and Taylor [21] shows that sampling from domains of the applicationunder test which are likely to be failure-prone rather than trying to attain extensive coverageseems to be a promising strategy for efficiently detecting faults. Moreover, it can easily beproved that after full coverage has been obtained there may still remain faults in the softwarethat have not yet caused a failure. This means that even without any gain in additionalcoverage during testing, failures may occur. Therefore, test coverage cannot be the onlydriver of the expected number of cumulative failures.
3.8 Block coverage model
Piwowarski, Ohba and Caruso [48] formulated a model for block coverage in dependence ofthe number of test cases executed during functional testing, which can easily be extended tobecome a model of the number of failures experienced in terms of time. The model is basedon the following assumptions:
1. The program under test consists of G blocks.
2. Per test case p of these blocks are sensitized on average.
3. The p blocks are always chosen from the entire population. The fact that a block hasalready been sensitized does not diminish its chances of being sensitized in future.
Let the random variable ∆Qi denote the number of blocks newly executed by the ith testcase. According to the assumptions it follows a hypergeometric distribution with discreteprobability function
P (∆Qi = ∆qi | qi−1) =
(G− qi−1
∆qi
) (qi−1
p−∆qi
)(Gp
) , (30)
where qi−1 =∑i−1
j=1 ∆qj is the number of blocks actually covered by the first (i−1) test cases.The numerator consists of the product of the number of possible ways to choose ∆qi newblocks out of G − qi−1 blocks uncovered so far and the number of possible ways to choosethe remaining p−∆qi blocks out of the qi−1 blocks sensitized before. This is divided by thenumber of ways in which p blocks can be picked out of the G blocks the program consists of.
The expected value of ∆Qi given qi−1 is therefore [44, p. 177]
E(∆Qi | qi−1) =p
G[G− qi−1]. (31)
If the actual value of the random variable Qi−1 has not yet been observed, the unconditionalexpected value of ∆Qi has to be used:
E(∆Qi) =p
G[G− E(Qi−1)] (32)
IST-1999-55017 SRModelStudy.pdf Page 15 of 41
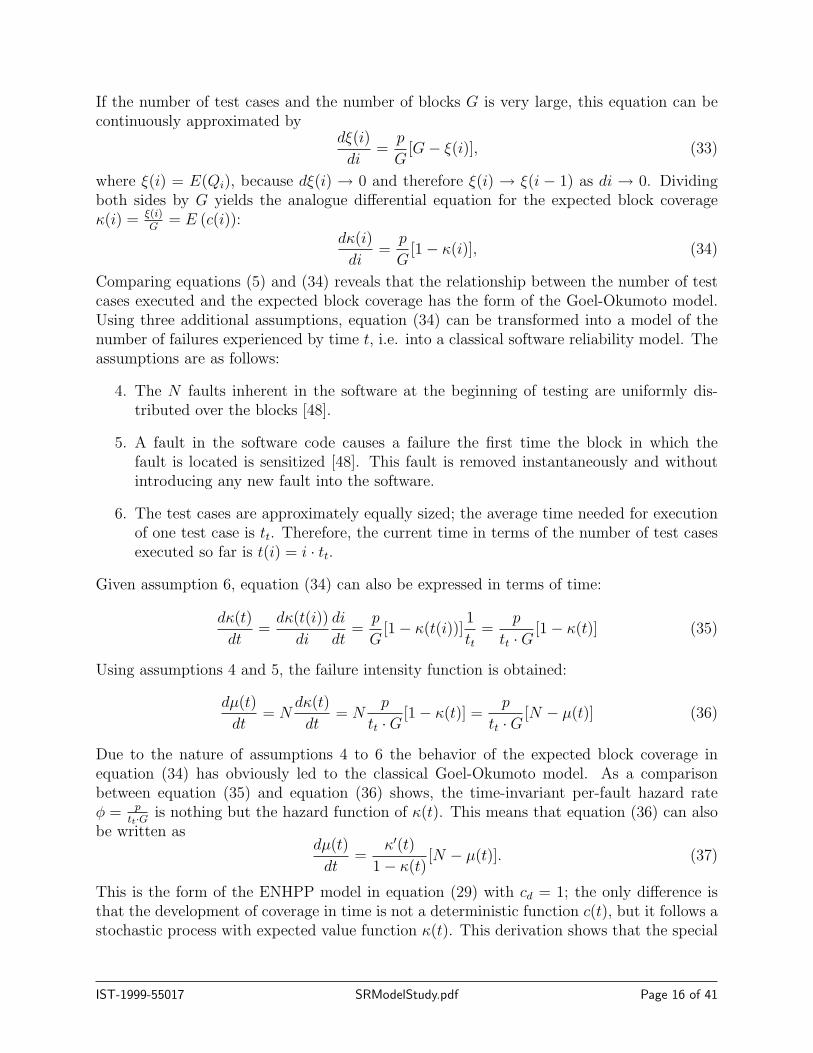
If the number of test cases and the number of blocks G is very large, this equation can becontinuously approximated by
dξ(i)
di=
p
G[G− ξ(i)], (33)
where ξ(i) = E(Qi), because dξ(i) → 0 and therefore ξ(i) → ξ(i − 1) as di → 0. Dividingboth sides by G yields the analogue differential equation for the expected block coverageκ(i) = ξ(i)
G= E (c(i)):
dκ(i)
di=
p
G[1− κ(i)], (34)
Comparing equations (5) and (34) reveals that the relationship between the number of testcases executed and the expected block coverage has the form of the Goel-Okumoto model.Using three additional assumptions, equation (34) can be transformed into a model of thenumber of failures experienced by time t, i.e. into a classical software reliability model. Theassumptions are as follows:
4. The N faults inherent in the software at the beginning of testing are uniformly dis-tributed over the blocks [48].
5. A fault in the software code causes a failure the first time the block in which thefault is located is sensitized [48]. This fault is removed instantaneously and withoutintroducing any new fault into the software.
6. The test cases are approximately equally sized; the average time needed for executionof one test case is tt. Therefore, the current time in terms of the number of test casesexecuted so far is t(i) = i · tt.
Given assumption 6, equation (34) can also be expressed in terms of time:
dκ(t)
dt=dκ(t(i))
di
di
dt=
p
G[1− κ(t(i))]
1
tt=
p
tt ·G[1− κ(t)] (35)
Using assumptions 4 and 5, the failure intensity function is obtained:
dµ(t)
dt= N
dκ(t)
dt= N
p
tt ·G[1− κ(t)] =
p
tt ·G[N − µ(t)] (36)
Due to the nature of assumptions 4 to 6 the behavior of the expected block coverage inequation (34) has obviously led to the classical Goel-Okumoto model. As a comparisonbetween equation (35) and equation (36) shows, the time-invariant per-fault hazard rateφ = p
tt·G is nothing but the hazard function of κ(t). This means that equation (36) can alsobe written as
dµ(t)
dt=
κ′(t)
1− κ(t)[N − µ(t)]. (37)
This is the form of the ENHPP model in equation (29) with cd = 1; the only difference isthat the development of coverage in time is not a deterministic function c(t), but it follows astochastic process with expected value function κ(t). This derivation shows that the special
IST-1999-55017 SRModelStudy.pdf Page 16 of 41

case of a time-invariant per-fault hazard rate in equation (29) is obtained for the (ratherinefficient) sampling of fault sites with replacement. Furthermore, this hazard rate can beinterpreted as the percentage of fault sites newly or repeatedly sensitized per test case (i.e.the probability that a certain fault site is chosen) divided by the average duration of onetest case execution. Therefore, it is the percentage of sensitized fault sites per time unit.
3.9 Hypergeometric model for systematic testing
Building on earlier work [50, 55], Rivers [49] and Rivers and Vouk [51] derived a hypergeomet-ric model for the number of failures experienced at each stage of testing when the constructstested are removed from the population, i.e. when there is no retest of constructs coveredbefore. The constructs under study may be program size metrics like statements, blocks,paths, c-uses, p-uses, etc. The authors also consider the number of test cases executed andeven execution time or calendar time.
The model is based on the following assumptions:
1. For the program under test there are G constructs to be executed.
2. At the ith stage of testing ∆qi constructs are covered. ∆qi is an exogenous variable.
3. Constructs that have been covered are removed from the population. Before the ith
stage there are G− qi−1 constructs remaining with qi−1 =∑i−1
j=1 ∆qj.
4. The N faults inherent in the software at the beginning of testing are uniformly dis-tributed throughout the code.
5. Even when all G constructs have been tested not all faults have necessarily caused afailure. This means that there are faults which are not detectable under a given testingstrategy. On the other hand, there may be more constructs (e.g. p-uses or test cases)that lead to the detection of the same fault. The factor gi ≡ g(Qi
K) is introduced to
relate the number of faults remaining in the software at the beginning of the ith testingstage to the number of constructs whose execution causes the activation of one of thefaults. gi therefore accounts for the “visibility” of the faults. Since it also depends onthe testers’ choice of constructs to be considered in the first place, Rivers and Voukcall it “testing efficiency”.
6. If one of those constructs activating a fault is executed a failure occurs. The fault isremoved instantaneously and without introducing any new fault into the software.
7. The order of test case execution is ignored.
8. There is a minimal coverage cmin = qmin
G> 0 obtained by the execution of a typical test
case. µmin is the number of failures to be expected at this minimal feasible coverage.If some of the constructs cannot be executed at all, there is also a maximum feasiblecoverage cmax = qmax
G.
IST-1999-55017 SRModelStudy.pdf Page 17 of 41
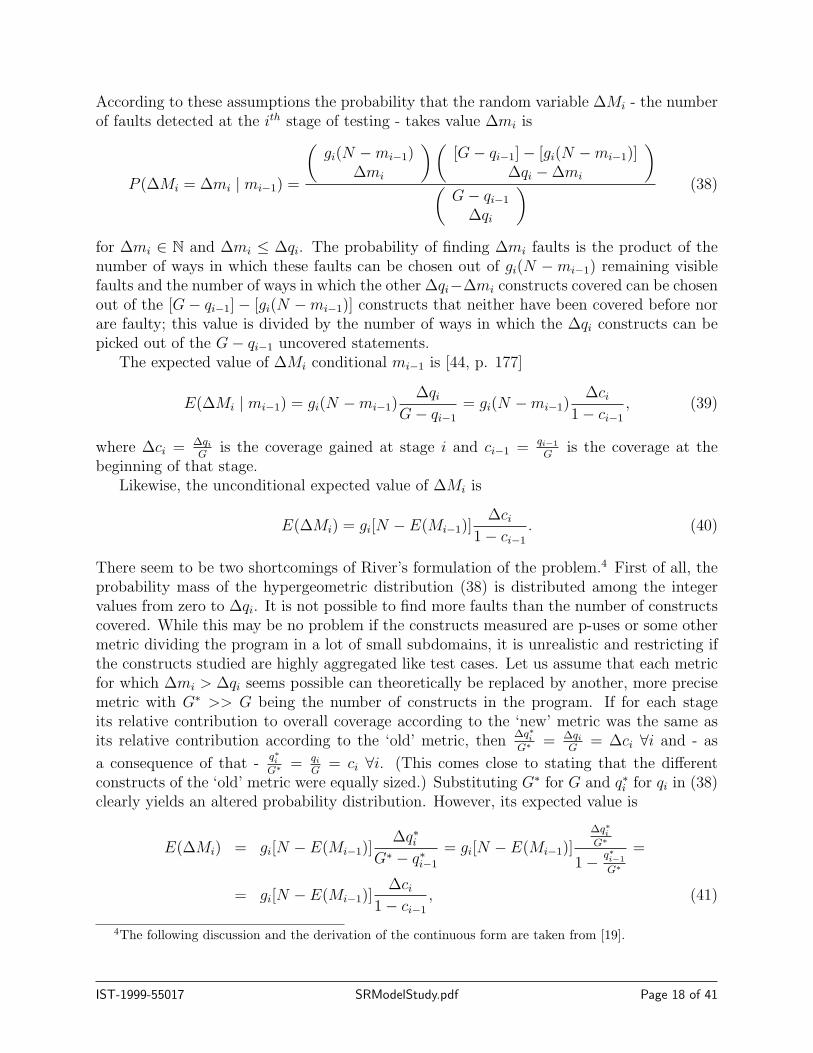
According to these assumptions the probability that the random variable ∆Mi - the numberof faults detected at the ith stage of testing - takes value ∆mi is
P (∆Mi = ∆mi | mi−1) =
(gi(N −mi−1)
∆mi
) ([G− qi−1]− [gi(N −mi−1)]
∆qi −∆mi
)(G− qi−1
∆qi
) (38)
for ∆mi ∈ N and ∆mi ≤ ∆qi. The probability of finding ∆mi faults is the product of thenumber of ways in which these faults can be chosen out of gi(N −mi−1) remaining visiblefaults and the number of ways in which the other ∆qi−∆mi constructs covered can be chosenout of the [G− qi−1]− [gi(N −mi−1)] constructs that neither have been covered before norare faulty; this value is divided by the number of ways in which the ∆qi constructs can bepicked out of the G− qi−1 uncovered statements.
The expected value of ∆Mi conditional mi−1 is [44, p. 177]
E(∆Mi | mi−1) = gi(N −mi−1)∆qi
G− qi−1
= gi(N −mi−1)∆ci
1− ci−1
, (39)
where ∆ci = ∆qi
Gis the coverage gained at stage i and ci−1 = qi−1
Gis the coverage at the
beginning of that stage.Likewise, the unconditional expected value of ∆Mi is
E(∆Mi) = gi[N − E(Mi−1)]∆ci
1− ci−1
. (40)
There seem to be two shortcomings of River’s formulation of the problem.4 First of all, theprobability mass of the hypergeometric distribution (38) is distributed among the integervalues from zero to ∆qi. It is not possible to find more faults than the number of constructscovered. While this may be no problem if the constructs measured are p-uses or some othermetric dividing the program in a lot of small subdomains, it is unrealistic and restricting ifthe constructs studied are highly aggregated like test cases. Let us assume that each metricfor which ∆mi > ∆qi seems possible can theoretically be replaced by another, more precisemetric with G∗ >> G being the number of constructs in the program. If for each stageits relative contribution to overall coverage according to the ‘new’ metric was the same asits relative contribution according to the ‘old’ metric, then
∆q∗iG∗ = ∆qi
G= ∆ci ∀i and - as
a consequence of that -q∗iG∗ = qi
G= ci ∀i. (This comes close to stating that the different
constructs of the ‘old’ metric were equally sized.) Substituting G∗ for G and q∗i for qi in (38)clearly yields an altered probability distribution. However, its expected value is
E(∆Mi) = gi[N − E(Mi−1)]∆q∗i
G∗ − q∗i−1
= gi[N − E(Mi−1)]
∆q∗iG∗
1− q∗i−1
G∗
=
= gi[N − E(Mi−1)]∆ci
1− ci−1
, (41)
4The following discussion and the derivation of the continuous form are taken from [19].
IST-1999-55017 SRModelStudy.pdf Page 18 of 41

just the same as equation (40).A second restriction of (38) is that the testing efficiency gi has to be chosen such that
gi(N−mi−1) is an integer value. Therefore, gi cannot easily be assigned a continuous functionof test coverage. To resolve this problem, in equation (38) gi(N−mi−1) should be replaced bya discrete random variable Xi with probability function f(xi) satisfying f(xi) = 0 ∀ xi 6∈ Nand E(Xi) = gi(N −mi−1) ∀i. The resulting equation
P (∆Mi = ∆mi | mi−1) =
(Xi
∆mi
) ([G∗ − q∗i−1]−Xi
∆q∗i −∆mi
)(G∗ − q∗i−1
∆q∗i
) (42)
still has expected value (41).Equation (41) can be used as a starting-point for deriving the mean value function µ(c),
i.e. the expected cumulative number of faults found when 100 · c % coverage has beenachieved, because E(∆Mi) = ∆E(Mi) = ∆µi.
Since all qi as well as all q∗i have to take integer values, (40) and (41) are only definedfor ∆ci and ci−1 being a multiple of G−1 or G∗−1, respectively. However, for G∗ >> G orG∗ →∞ the change in coverage attained at any stage may approach zero, because 1
G∗ → 0.At the limit the coverage measure c can take any value between zero and one.
It is therefore possible to transform the difference equation (41) into a differential equationby considering ∆ci → dci → 0 and - as a consequence - ci → ci−1 and µi → µi−1. For anycoverage value c ∈ (0, 1),
dµ(c) = g(c)[N − µ(c)]dc
1− c. (43)
From this a continuous approximation of the mean value function can be obtained[49, pp. 38 - 39]:
µ(c) = N − (N − µmin) exp
− c∫cmin
g(ς)
1− ςdς
. (44)
cmin and µmin denote the minimum meaningful coverage and the expected number of failuresobserved for this coverage, respectively (cf. assumption 8).
Rivers considers different functional forms of testing efficiency g(c) and derives the meanvalue function for each of these special cases [49, pp. 40 - 42]:
1. Assuming a constant testing efficiency, i.e. setting g(c) = α yields
µ(c) = N − (N − µmin)
(1− c
1− cmin
)α
. (45)
2. Using the linear testing efficiency g(c) = α(1− c) results in
µ(c) = N − (N − µmin) exp (−α(c− cmin)) . (46)
IST-1999-55017 SRModelStudy.pdf Page 19 of 41
Clearly, this formulation for the dependence between the number of failures experiencedand test coverage is analogous to the Goel-Okumoto model for the number of failureoccurrences by time t. In addition to using a different exogenous variable the functionhas been translated by vector (cmin, µmin).
If the coverage achieved was proportional to testing time t, i.e. c(t) = βt, the classical(translated) Goel-Okumoto model µ(t) = N − (N − µmin) exp (−φ(t− tmin)) withφ = αβ and tmin = cmin
βwould be obtained.
3. In the case of the unimodal testing efficiency g(c) = (αγqγ−1) (1 − c) the followingmean value function is obtained:
µ(c) = N − (N − µmin) exp (−α(cγ − cγmin)) . (47)
It corresponds to the mean value function of the generalized Goel-Okumoto modelmentioned in section 3.7. Again, the consideration of minimal meaningful coverage andnumber of failures leads to a translation by vector (cmin, µmin). Assuming that coverageis proportional to testing time leads to its (translated) time-dependent formulationµ(c) = N − (N − µmin) exp (−φ(tγ − tγmin)), where φ = αβγ and tmin = cmin
β.
In Rivers’ and Vouk’s model, the number of constructs covered (and consequently the testcoverage, too) is an exogenous variable. The mean value function is some function of thistest coverage.
However, the mean value function can also be expressed in terms of time. Let c(t) be anon-decreasing function of time with limt→∞ c(t) → k ≤ 1. Dividing both sides of equation(43) by dt then results in the extended model
dµ(t)
dt= g(c(t))[N − µ(t)]
dc(t)dt
1− c(t)=
c′(t)
1− c(t)g(c(t))[N − µ(t)]. (48)
3.10 Conclusions
Comparison of the models discussed this chapter shows several similarities:First of all, for some models (the ones of binomial type [41, p. 251]) the number of
faults inherent at the beginning of testing is a fixed but unknown value u0, whereas for othermodels (the ones of Poisson type [41, p. 251]) it is a random variable following a Poissondistribution with mean value N . Based on collected failure times the two types of modelscannot be distinguished. Furthermore, if only some fraction cd of the (expected) numberof inherent faults can be detected, cd and N (or u0) cannot be separately identified. Onlythe (expected) number of detectable faults - u0 or N - can be estimated. In the followingdiscussion ν denotes either u0 or N or u0 or N .
Moreover, many models can be written in the form dµ(t)dt
= ψ(t)[ν − µ(t)]. The differencelies in the mathematical formulation of ψ(t) as well as in its interpretation.
1. The first approach observes the testers’ performance in causing the software to fail.It consists of two elements: Their ability to increase test coverage and their skill in
IST-1999-55017 SRModelStudy.pdf Page 20 of 41

detecting faults in the parts of the code covered, which can also be viewed as the abilityto achieve code coverage “in the right way”.
The influence of both effects are contained in the extended Rivers-Vouk model (48).A step towards a unifying model is to account for a time-varying testing-effort in thetime scale t∗ via the transformation t = W (t∗), which also leads to the inclusion of theterm w(t∗) on the righthand side. Moreover, test coverage c can be seen as a functionof the number of test cases executed, i, which depends on the transformed time W (t∗).Furthermore, by substituting κ = E(c) for c it is possible to allow for both stochastictest coverage growth and deterministic test coverage growth, for which κ = E(c) = c.The following extended equation is obtained:
dµ(W (t∗))
dt∗= w(t∗)
κ′(i(W (t∗)))
1− κ(i(W (t∗)))g(κ(i(W (t∗))))[ν − µ(W (t∗))] (49)
This model can be seen as the generalization of the Jelinski-Moranda model (4), theGoel-Okumoto model (5), the Jelinski-Moranda model with a time-varying testing-effort (7), the Goel-Okumoto model with a time-varying testing-effort (9), the ENHPPmodel (29), the original block coverage model (34), the extended block coverage model(36), the original Rivers-Vouk model (43) and the extended Rivers-Vouk model (48).
Of course, in the specific models not all elements of the generalized model are included.First of all, models may start out with an exogenous variable that is considered en-dogenous in the general model. In the original Rivers-Vouk model, for example, bothcalendar time and a time measure with constant testing-effort are not included, be-cause the percentage of constructs tested (which is either the percentage of test casesexecuted or some white box test coverage) is the input variable. Furthermore, modelsmay leave out stages in between. E.g., the ENHPP does not relate the time to thenumber of test cases but directly to a white box coverage measure. Moreover, themodel by Rivers and Vouk is the only one to take into account testing-efficiency as anadditional effect on the number of failures experienced besides the development of testcoverage; however, testing-efficiency itself is some deterministic function of test cover-age. Figure 1 shows the elements considered by the different models. While an X refersto an element included in the original model, (X) depicts an element incorporated ina model extension discussed in one of the last subsections.
This figure also helps to explain why special cases of the ENHPP and of the Rivers-Vouk model and the extended version of the block coverage model result in the Goel-Okumoto model, which directly relates time to the number of failures experienced inthe specific form of equation (5):
• The ENHPP model with c′(t)1−c(t)
= φ implicitly assumes that the white box testcoverage measure increases with time in a fashion analogous to the Goel-Okumotomodel. Since in the framework of the ENHPP the number of failures is consideredproportional to test coverage, the classical Goel-Okumoto model is obtained.
IST-1999-55017 SRModelStudy.pdf Page 21 of 41

Figure 1: Elements of the generalized model included in different models
• The block coverage model shows that it is the highly inefficient testing strategyof sampling blocks with replacement that leads to the function of test coverage interms of test cases executed which has the form of the Goel-Okumoto model. Thespecific ENHPP model discussed above can therefore be thought of as implicitlyassuming sampling with replacement and a constant duration of each test caseexecution.
• The Rivers-Vouk model does not consider the inefficient sampling with replace-ment, but the highly efficient sampling out of constructs not covered before,which avoids any redundant execution. However, the linear testing efficiencyg(c) = α(1− c) - with an efficiency approaching zero as coverage approaches one -compensates this advantage and gives rise to the Goel-Okumoto model.
2. The second approach sees the number of failure experienced as a result of the tendencyof the faults to show themselves, which is expressed by the fault exposure ratio K.As shown above, K can be thought to be influenced by two effects: the change inthe detectabilities of the faults and the development of the testers’ efficiency. Sincethe fault exposure ratio is the ratio between the per-fault hazard rate and the linearexecution frequency f , it is necessary to determine f if not only relative values of Kare to be discussed.
Both approaches consider similar phenomenons from different points of view. However, sincethe interpretations of the majority of models sees the testers in an active role, more modelsfit into the first framework.
The aim of the unifying view on software reliability growth models developed in this chap-ter was to clarify the different effects driving the number of failures observed during testing.On the one hand, using the generalized model (49) it is possible to specify functional formsfor each of these effects and build up a new model in that way. On the other hand, existing
IST-1999-55017 SRModelStudy.pdf Page 22 of 41

models that fit in the framework can be analyzed and chosen if their interpretation seemsto agree with the real-world conditions of the testing process. For example, as shown abovethe Goel-Okumoto either implies a highly inefficient testing strategy or a highly inefficienttesting efficiency. If neither of them seem to be that poor in the testing process studied, theGoel-Okumoto probably should not be the model of choice.
IST-1999-55017 SRModelStudy.pdf Page 23 of 41
4 Linking additional information to software reliability
growth models
One of the goals of the PETS project is to include information about the software devel-opment process and the software testing process in one or more software reliability growthmodels. In this chapter different existing approaches for linking additional data to softwarereliability growth models are studied.
4.1 Physical interpretation of model parameters
For some software reliability growth models it is possible to relate their parameters to char-acteristics of the software development and the debugging process. There are several advan-tages of this approach [31]:
1. The parameters of the software reliability growth model can be estimated when failuredata have not yet been collected. These so-called “static” estimates permit the “earlyprediction” [29] of software reliability before testing starts.
2. It is a well-known fact that there is considerable noise in connection with the observedinter-failure times. Especially at the early stage of testing, when only few failure dataare available, the “dynamic” parameter estimates calculated using the test data canbe unstable or even outside the region of meaningful values. If this happens, the staticestimates can be substituted for the dynamic estimates.
3. While sometimes there exist equations for direct computation of the parameter valuesoften numerical techniques have to be used. Generally, the convergence of such tech-niques will be faster if the starting values chosen are closer to the actual values. Thestatic estimates might be a reasonable choice.
4. Since the parameters have an interpretation with respect to the software developmentor test process the effect of changes in these processes to software reliability growth canbe studied. Moreover, the dynamic parameter estimates can be used for an assessmentof process characteristics.
4.1.1 Physical interpretation of the parameters of the Musa basic model andthe Musa-Okumoto model
Malaiya and Denton [31] studied the parameters of the Musa basic model and the Musa-Okumoto model.
For the Musa basic model their interpretation is the one given in sections 3.2 and 3.4:Since experience has shown that only about 5 per cent new faults are introduced duringdebugging of detected faults [41], N is approximately the number of faults inherent in thesoftware at the beginning of testing. φ = fK is the per-fault hazard rate.
As for the logarithmic Musa-Okumoto model, Malaiya and Denton use earlier work byLi and Malaiya [26, 27] to derive the following interpretation of the parameters:
β0 = ISDmin (50)
IST-1999-55017 SRModelStudy.pdf Page 24 of 41

β1 = fKmin exp
(D0
Dmin
− 1
), (51)
where Kmin is the minimal value of the bathtub-shaped fault exposure ratio, Dmin is thefault density for which K attains its minimum and D0 is the initial fault density. Therefore,β0 represents the number of faults inherent in the software at that point of testing whenthe fault exposure starts to rise again, i.e. when testing becomes more efficient. Unfor-tunately, neither Dmin nor Kmin can be directly observed. Based on the studies by Musaet al. [41, pp. 121 - 124] and Malaiya et al. [32, 33] already cited in section 3.5, it seemsappropriate to set Kmin to about 1.4 · 10−7 and Dmin to a value between 2 and 4 defects perKLOC. For an initial fault density D0 larger than 10 faults per KLOC, Malaiya and Denton[31] suggest to set Dmin = D0
3.
Since the parameter N of the Musa basic model is approximately the initial fault contentISD0, early prediction both of this model and the logarithmic Musa-Okumoto model requiresthe determination of the initial fault density D0. An approach to this is described in thenext section.
4.1.2 Relating the fault density to characteristics of the software and the soft-ware development process
Malaiya and Denton [31] introduce a factor multiplicative model for D0:
D0 = C · Fph · Fpt · Fm · Fs, (52)
where the factors on the right side have the following meaning:
• The phase factor Fph takes into account that at the beginning of later test phases a lotof faults have already been removed. Depending on whether the fault density at thebeginning of the unit testing, the subsystem testing, the system testing or the operationtesting phase is to be estimated, Fph takes value 4, 2.5, 1 or 0.35, respectively.
• It is obvious that the initial fault density of the program under test depends on theabilities of the people in the development team. To consider this, the programmingteam factor Fpt is set to 0.4 if the team’s average skill level is high, 1 if it is averageand 2.5 if it is low.
• The process maturity factor Fm is one of the few concepts indirectly relating softwaredevelopment process maturity information to software reliability growth models. Ituses the condensed maturity level of the software developing organization according tothe capability maturity model (CMM) developed at Carnegie Mellon University [46].Malaiya and Denton suggest to set Fm to 1.5, 1, 0.4, 0.1 or 0.05 according to theattained CMM maturity level from 1 to 5.
• In a simple approach to model the dependence of initial fault density on the program-ming language used, Fs is defined as Fs = 1+0.4a, where a is the percentage of softwarecode in assembly language.
IST-1999-55017 SRModelStudy.pdf Page 25 of 41
• The constant of proportionality has to be individually estimated for each software de-veloping company and should be determined using projects with characteristics similarto the ones of the project for which D0 is to be estimated. According to Malaiya andDenton Fs ranges between 6 and 20 faults per KLOC.
Farr [12] mentions another factor multiplicative model developed by the Air Force’s RomeLaboratory. It consists of factors like the application type, the development environment,several requirements and design representation metrics and a number of software implemen-tation metrics. Again, for each factor a mapping of the ordinal or qualitative piece andinformation to an appropriate quantitative value has to be made.
4.2 Bayesian software reliability growth models
The models discussed in chapter 3 follow the frequentist view of statistics, in which modelparameters are considered to be fixed but unknown. When data are available, the param-eters can be estimated using techniques like the maximum likelihood estimation (MLE)(cf. [18, pp. 129 - 140] and [41, pp. 313 - 343]).
There are several disadvantages of this approach:
1. In the absence of failure data no information about the model parameters can beobtained. Therefore, predictions about the number of failures to be experienced bytime t or the reliability of the software at different points in time are not possible.Approaches like the one described in section 4.1 are attempts to overcome this problem.
2. The maximum likelihood method does not make use of structural information that maybe available in addition to the failure data collected. Even if the model parametersare estimated using known facts about the software and its development process, theseestimates are in no way joined to the maximum likelihood estimates obtained fromfailure data. Basically, the analyst has to make a decision for one of the estimates, e.g.for the “early estimates” in case that MLE produces illegal or untrustworthy values[31].
3. Many studies have shown that MLE often results in unstable and illegal parameterestimates, especially when only relatively few failure data are available [8, 36].
4. Uncertainty about the estimates in frequentist approaches can only be expressed in-directly. The so-called “confidence interval” with a confidence level of 100·(1-α)% fora parameter is not the range of values containing the true parameter value with theprobability of 100·(1-α)%; since the parameter is assumed to be fixed but unknown itis either an element of the confidence interval, or it is not. The correct interpretation israther that if the experiment (i.e. the testing of the software and the collection of fail-ure data) was repeated very often, the confidence interval constructed can be expectedto contain the true parameter value in approximately 100·(1-α)% of the samples [18,p. 153]. However, this explanation is not very intuitive.
IST-1999-55017 SRModelStudy.pdf Page 26 of 41

In Bayesian models in the absence of data the parameters are not considered to be fixed atsome unknown value, but they are assumed to follow a prior distribution. Let p(θ) denotethe prior density of the parameter vector θ. The still unknown but observable data y - likefailure times or the number of failures experienced by time t - are linked to the parametersthrough the software reliability growth model. Given certain parameter values, the datafollow a conditional distribution p(y | θ). Since the parameter values are not known, theprior predictive distribution of y is calculated as the integral of the joint distribution of yand θ over the possible values of θ [14, p. 8]:
p(y) =
∫p(y, θ)dθ =
∫p(y | θ)p(θ)dθ (53)
To put it in words, given a software reliability growth model and an assumption about thedistribution of the model parameters, the distribution of quantities to be predicted with themodel can be calculated. For example, it is possible to obtain the distribution of the randomvariable M(t1), the number of failures observed by time t1, and also its expected value µ(t1),which is the mean value function at t1. All this can be done before any failure has beenobserved!
The prior distribution of the model parameters is built on the analyst’s beliefs, whichmay also stem from knowledge of structural information of the software or from experience.However, it may still deviate from reality. As soon as data are available, they should be usedto update the assumed distribution of the model parameters by calculating the conditionaldistribution of the model parameters given the observed data. According to Bayes’ rule thisis [14, p. 8]
p(θ | y) =p(y, θ)
p(y)=
p(y | θ)p(θ)∫p(y | θ)p(θ)dθ
. (54)
It can easily be seen that only the prior density of θ, p(θ), and the likelihood functionL(θ; y) = p(y | θ) is used for obtaining the posterior distribution p(θ | y). Therefore, thisupdated belief about the parameters is a compromise between the initial assumptions andthe evidence of the collected data in connection with the underlying model.
Predictions in the light of data draw on this posterior distribution of θ. For example,after the first failure has been observed at t1, one can use y = {t1} and the prior distributionp(θ) to calculate p(θ | y) via equation (54) and predict the distribution of M(t1 + ∆t), thenumber of failures experienced by t1+∆t, based on the posterior distribution of θ. In general,the posterior predictive distribution of some unknown observable y (like the time until theoccurrence of the next failure) is given by [14, p. 9]:
p(y | y) =
∫p(y, θ | y)dθ =
∫p(y | θ, y)p(θ | y)dθ =
∫p(y | θ)p(θ | y)dθ (55)
A lot of different Bayesian software reliability growth models have been proposed over the lastdecades [53, 54]. Some of them can be considered Bayesian extensions of frequentist modelsassuming certain prior distributions for their parameters. Although it was not formulated inthat way, the Littlewood-Verrall model [28], for example, puts a Gamma prior distributionon the per-fault hazard rate Φ of the Jelinski-Moranda model while leaving the number of
IST-1999-55017 SRModelStudy.pdf Page 27 of 41
faults in the software U degenerate at some value u0 [25]. On the other hand, assuming thatU follows a Poisson distribution with mean N while Φ is fixed at the constant value φ leadsto the Goel-Okumoto model.5
In the past, the prior distributions were often chosen as to ensure mathematical tractabil-ity, e.g. in form of the “conjugate prior distributions” [14, pp. 36 - 38]. The speed withwhich today’s personal computers can execute Markov Chain Monte Carlo methods, like theMetropolis-Hastings algorithm [5] and specifically the Gibbs sampler [4], gives the analystmore freedom in selecting the prior densities and also enables him to analyze more complexmodels.
Linking maturity information, information from models like in section 4.1 and expertopinion about the software development and the software testing process to software relia-bility models with the help of prior distributions seems to be a possible approach. There areseveral options for doing this:
1. The structural information could be used directly for specifying the prior distributionsof some or all of the model parameters. On the one hand, the prior densities derived inthis way could be used instead of “non-informative” prior distributions - prior distribu-tions with flat densities -, which are frequently chosen in the absence of solid conjecturesabout the model parameters. On the other hand, in simulation studies the parametersof the prior densities - so-called “hyperparameters” - are often arbitrarily determined.If maturity information and the like could be linked to the Bayesian models, then theparticular prior distribution used would have a better technical foundation.
Singpurwalla [52] describes a method for incorporating expert knowledge into the priordensities of the parameters of a Weibull distribution for hardware reliability. It alsoenables the analyst to include his views about the expert’s input, e.g. assumed biasor optimism on the part of the expert with respect to the accuracy of his estimations.However, one obstacle to this method may be that practitioners often find it difficultto express their presumptions in terms of model parameters.
2. Another approach may be based on the results in chapter 3: Instead of assuming priordensities for the parameters of a software reliability growth model one could formulateprior distributions for parameters of the individual effects (like the development of testcoverage or the testing efficiency). Probably it is easier to relate structural informationto one of these separate factors. Furthermore, they may be more meaningful for apractitioner than the composite model parameters of a SRGM.
3. Campodonico and Singpurwalla [2, 3] propose to ask an expert about his opinion onthe values of the mean value function at k points in time, where k is the number ofparameters in the SRGM chosen by the analyst. They describe an application of theirmethod to the analysis of the Musa-Okumoto model.
5Originally, the Goel-Okumoto model was not seen in a Bayesian context; the parameters were calculatedusing MLE [16]. The Littlewood-Verrall model was a parametric empirical Bayes model, because some ofits parameters were treated as fixed, unknown quantities and also estimated by the maximum likelihoodmethod [34]. For both of them a fully Bayesian analysis is also possible [34, 54].
IST-1999-55017 SRModelStudy.pdf Page 28 of 41

4.3 Parametric regression models for survival times
Models trying to explain the time until some event of interest occurs by a set of covariateshave been applied to problems in bio-statistics, social sciences and economics [10], but alsoto the field of hardware reliability [35, ch. 17]. However, they have hardly been employed inconnection with software reliability data.
The covariates used can either be time-invariant or time-varying. Models for both casesare discussed in the following two subsections.
4.3.1 Models with time-invariant covariates
There are two different approaches for including time-invariant covariates in a survival model:
1. Transformation models [10] are constructed in analogy to classical regression models:Some transformation of the survival time T of one unit is considered to depend ona function h of the vectors of covariates x and regression parameters β and on adisturbance term ε multiplied by a scale parameter σ:
g(T ) = h(x; β) + σε (56)
A simple choice for h(x; β) is the linear function x′β. Since x′β and ε can take negativevalues if no particular attention is given to their specification while only positive valuesof T are reasonable, g(T ) ought to map T from R+
0 to R. In most practical applicationsg(T ) = ln(T ). Models with the structure
ln(T ) = x′β + σε (57)
are called “accelerated failure time models”.
The functional form of the hazard rate z(t) of the unit depends on the distribution ofε. Among those assumed are the extreme value, the logistic and the standard normaldistribution [10].
2. The semi-parametric proportional hazards model [10, 35, pp. 455 - 458] expresses thehazard rate of a unit as the product of some unspecified, time-varying baseline hazardrate z0(t) and a positive term depending on the covariates x:
z(t | x) = z0(t)h(x; β) (58)
The reason for its name is that the hazard rate of a unit with covariate values x1 attime t is proportional to the hazard rate of another unit with covariate values x2 atthe same point in time, i.e. their ratio is some constant c:
z(t | x1)
z(t | x2)=z0(t)h(x1; β)
z0(t)h(x2; β)=h(x1; β)
h(x2; β)= c (59)
This means that the proportional influence of a covariate does not change in time. Forsome applications this property of the model may be too restrictive, but the model canbe refined by defining different strata [10].
IST-1999-55017 SRModelStudy.pdf Page 29 of 41

In the proportional hazard model by Cox [10, 18, pp. 997 - 999] h(x; β) is chosen tobe exp(x′β):
z(t | x) = z0(t) exp (x′β) (60)
It is possible to show that the linear model of ln(T ) in x with disturbances followingthe extreme value distribution, discussed as one of the transformation models, is aspecial case of the Cox proportional hazard model [10]. Its hazard rate can be writtenas
z(t | x) =1
σt
1σ−1 exp (x′β∗) , (61)
where β∗= −βσ
; this is of the same form as equation (60). However, while the func-tional form of the hazard rate in the transformation models is fully specified - which canalso be seen from equation (61) - the semi-parametric proportional hazard rate modelsnormally do not specify the baseline hazard rate λ0(t). Using the method of maxi-mum partial likelihood estimation, the vector β can be estimated without requiringestimation of λ0(t) [10, 11].
When applying these models to the field of software reliability, the question arises for whatunits the survival time is modelled. In analogy to medicine, where a defined number ofpatients are studied, one might consider each software fault a unit of its own and model thetime until it causes a failure. However, in divergence with a medical survey, the total numberof faults is not known. Therefore, after i failures have occurred, we do not know how manyfaults are remaining in the software. In formulating the likelihood function the term forunits with “censored survival times”, i.e. with times to failure exceeding the period of timeduring which the software has been tested, cannot be specified. Moreover, the objective ofincluding exogenous variables is to model the different behavior of units. Therefore, it wouldbe necessary to classify each fault with respect to factors that may influence the time until itsactivation. Probably this categorization needs information - e.g. about the structure of therespective software component - from the programming team. But it remains questionablewhether the faults could be classified appropriately even then. In any case, for those faultsthat have not yet been detected the values of such covariates are not available.
Another approach to the problem could be the modelling not of the time to failure ofone fault, but of the application itself. Indeed, this is the strategy Pham [47, pp. 210 - 220]proposes (see below section 4.3.2). However, since the covariates then just have influence onthe behavior of the entire program and since only one application is studied at a time, e.g. inthe Cox proportional hazard rate model, the baseline hazard rate and the factor dependingon exogenous variables cannot be separately identified. Therefore it seems that such a modelfor the program hazard rate only makes sense when the covariates are time-varying. Such amodel is discussed in the next section.
4.3.2 Models with time-varying covariates
Besides the time-invariant covariates, like information about the software development envi-ronment used for one release, there are variables that may change during the testing stage,while the failure data are collected (e.g. variables related to the testing-efficiency). Both the
IST-1999-55017 SRModelStudy.pdf Page 30 of 41
accelerated failure time models and the proportional hazard rate models can be extended toinclude such variables. Since a continuous model of the covariate process in time may causedifficulties for the numerical analysis, it should be considered changing at discrete points intime. Moreover, there are problems in connection with internal variables, i.e. covariates thatare generated by the units under study themselves. So far these problems have not beenentirely investigated by researchers. However, it seems that the software faults that havenot been detected do not influence the way in which the software is tested. Therefore, vari-ables representing aspects of the testing process probably are external. (For more detailedinformation on these issues see [10, pp. 331 - 338].)
Pham [47, pp. 210 - 220] describes the “enhanced proportional hazard Jelinski-Moranda”(EPJM) model as an application of the Cox proportional hazard model to software reliability.However, some parts of this concept are in divergence with the proportional hazard model:
1. Probably due to the problems discussed in section 4.3.1 Pham does not model thehazard rate of a single fault but the program hazard rate z(ti | xi) = z(ti−1 + ∆t | xi).In opposition to what it is named, xi = x(ti) does not contain the environmentalfactors of the ith fault, but the covariates coming to effect between the (i − 1)st andthe ith failure occurrence. Therefore, it is a mixture of the covariates for all the faultsstill remaining in the application at ti−1 + ∆t.
2. The baseline hazard rate z0(t) does not remain unspecified, but it is assigned thefunctional form of the the program hazard rate in the Jelinski-Moranda model (1).This results in the equation
z(ti | xi) = φ[u0 − (i− 1)] exp (xi′β) . (62)
Since Pham treats the application like one unit for which n events occur, in the likeli-hood function only the values of the density function at the failure times {t1, t2, ..., tn} haveto be considered; there is no censoring [47, pp. 211 - 212]. However, this raises doubtsabout the possibility of employing maximum partial likelihood estimation as proposed byPham [47, pp. 212 - 213]. For this technique the risk set, i.e. the collection of units that havenot yet left the study due to the event or due to censoring, at each of the failure occurrenceshas to be known. If the entire application is considered to be the only unit, it is questionablewhether the concept of a “risk set” is reasonable at all.
IST-1999-55017 SRModelStudy.pdf Page 31 of 41

5 Different kinds of failure and testing data
Another issue is whether all failures and all testing-efforts can be considered within onesoftware reliability growth model or whether different models should be used for subdomainsof failures and testing intervals. The partitioning of the data would be necessary if the failuretimes in the subsets were created by different mathematical processes and if the factors thatcause the dissimilarities could not be identified and included in an extended model. Thereare various criteria according to which the separation could be made. They are discussed inthe following subsections.
5.1 Failures with different severities
As noted above, software reliability is the probability of failure-free operation of the piece ofsoftware in a defined environment for a specified duration. In this definition the impact of thedeviation from user requirements is not taken into account. Therefore, all failure times arenormally treated equally in software reliability calculations, regardless of their severity. Sincethese range from typographic errors to system crashes, it seems to be a drawback of softwarereliability growth models that no distinction is made. One proposition is to fit one separatesoftware reliability growth model to the failures of each severity class. However, it has beennoted that the smaller number of observations in the sets results in higher variances of themodel parameter estimates and in broader confidence intervals for predictions of softwarereliability and failure intensity [40, p. 68]. This is an important aspect, because generallyinter-failure times are already considerably noisy.
5.2 Current and past data from the same test cycle
Obviously, even for the failure data measured during the same test cycle (see below section5.5), the same test phase (see below chapter 5.4) and the same type of testing (see belowsection 5.3) the last inter-failure times measured are more closely related to the currentfailure rate of the software under test than older observations. While practically all softwarereliability models use all failure data from one test cycle, a model developed by Schneidewindbased on failure counts in equally-sized time periods either ignores the first s−1 failure countsor uses the cumulative number of failures in these s− 1 periods as the first data point [12].This approach should be considered if the (mathematical) process generating the times offailure occurrence changed gradually over time or if there were structural breaks within thetest cycle, e.g. due to the removal of a fault blocking a huge part of the software code. Farr[12] notes that this method could also be used to eliminate learning curve effects. Whilethis might indeed decrease the need for S-shaped software reliability growth models, it seemsthat it destroys valuable information like systematic changes in the testers’ efficiency at thesame time.
IST-1999-55017 SRModelStudy.pdf Page 32 of 41
5.3 Failure and testing data from different types of testing
Since execution time τ , i.e. the CPU time used by the application under test, is not availableat the SMEs participating at the PETS project, another measure of time ensuring an approx-imately constant testing effort had to be chosen. The test plan management tool ProDokdeveloped by imbus AG has been enhanced by the Chair of Statistics and Econometrics ofthe University of Erlangen-Nuremberg to permit the logging of the time intervals in whichthe application under test is executed by a tester. This extension was named Teddi (Testdata determination and interpretation). Still, apart from the “normal” testing, i.e. the exe-cution of the application according to the test specification, there are other types of softwareusage during testing which cannot be totally neglected, because failures potentially couldoccur; however, the failure rates might be quite different. The following types of testing havebeen identified:
• Test preparation:
Sometimes a specified test case can only be executed after additional operations thatascertain that preconditions of the test case are met. E.g., in a customer database it isnot possible to test the deleting of customer records if no customer record has yet beencreated. While an efficient ordering of test cases reduces the need for such preparingactions that are not test cases themselves, they may be necessary even then. Sinceall program usage puts the software under certain stress, failures potentially can occurduring test preparation. However, because it is not directly aimed at detecting faultsone might expect that the failure intensity is smaller than for “normal” testing.
• Failure reproduction:
In order to help the development team in detecting the faults that caused a certainfailure, the failure report should describe as precisely as possible the state of the ap-plication and the tester’s actions that led to the failure occurrence. For being ableto isolate the relevant information the tester sometimes has to repeat parts of a testcase. This means that exactly the same operations are executed another time. Sincethe repeated occurrence of the same failure is not counted and since it is unlikely thata different failure is experienced, such time intervals should be logged separately.
• Retest of supposedly fixed bugs:
After faults have been removed by the development team the testers are often askedto check whether the correcting actions have been successful. It may be expected thatthis re-execution of test cases does not produce any failure. However, some of the faultsmay still be in the software, if the developers were not able to reproduce the failure orfind the defect that caused it. Furthermore, the fault correction may only have beenpartially successful, i.e. the set of inputs activating the fault has been reduced but notto size of zero. Moreover, it is possible that new faults have been spawned. Again,these testing intervals cannot be ignored, but the failure intensity may be supposed tobe smaller than during “normal” testing.
IST-1999-55017 SRModelStudy.pdf Page 33 of 41

• Automated testing:
Test cases cannot only be executed manually, but also automatically with the helpof test tools. The navigation through the application under test and the filling ofinformation in dialogs can be expected to be faster if done by a test script rather thanby a human. Therefore, the failure intensity should be higher than during manualtesting. However, there are counteracting effects. First of all, the test tools themselvesuse CPU resources, which may slow down the application under test. Moreover, a testscript can basically only test for the identity of observed and expected values. I.e.,the programmer of the script has to specify which output variables or which partsof a dialog box to monitor and what to compare them with. A typographic error ina dialog, for example, will not be detected if no matching between the output andthe orthographically correct text has been implemented. Furthermore, in order todetermine or record the expected values the tester often has to execute the applicationmanually at least once. If failures should occur, they are reported right away. Thismeans that only a subset of software faults can cause the first occurrence of a failureduring automated testing.
While the failure intensities during these special types of testing may be supposed to differfrom the failure intensity observed for “normal” testing, the degree and sometimes even theoverall trend of the deviation cannot be determined analytically. In order to make it possibleto analyze the types of testing separately as well as to study the differences in their failureintensities, for each interval during which the software is being tested the type of testingis also logged in Teddi. Please note that one interval can only belong to one of the types:test preparation, (normal) test execution, failure reproduction and retest of supposedly fixedbugs. However, the classification manual–automated test interval is orthogonal to the otherone. I.e., there may be manual test preparation, automated test preparation, manual normaltest execution, automated normal test execution, etc.
Analysis of the data for different projects will show whether it is necessary and reasonableto make the distinction between all these types of testing. Conclusions can only be drawn,however, if there are enough testing intervals from each category available in the data sets.
5.4 Failure and testing data from different test phases
Early software development methodologies, like the waterfall model [1, pp. 99 - 101], con-sidered the software development process to consist of several separate activities that wereexecuted in strict linear succession. Accordingly, testing was done after the software hadbeen completely developed and either lead to its acceptance and distribution or to its rejec-tion and its return to the programming team. A drawback of this model was that deviationsof the product from the requirements and other problems were only detected late in theentire development process.
In newer methodologies, e.g. the V-model [1, pp. 101 - 113], testing takes place at differ-ent stages during software development. Testing phases could occur after the programmingof individual modules or objects (unit testing), after integration of several modules/objects
IST-1999-55017 SRModelStudy.pdf Page 34 of 41
(subsystem testing), after integration of all modules/objects (system testing) and after instal-lation of the software system in an environment corresponding to field conditions (operationtesting).
Some software quality measurement techniques like “Orthogonal Defect Classification”[6, 7] use the development of the shares of different failure and fault types over all the test-ing phases as an indicator of testing progress and risk. Since classical software reliabilityengineering requires testing to be done according to the operational profile, the applicationunder test should be complete; therefore, data from system or - even better - operationtesting should be used. Apart from the fact that often no operational profile can be deter-mined for modules [20] the reduced amount of failure data for small software componentsmakes software reliability growth modelling inappropriate for individual software units [37].Changes in the software code, like the addition of new modules to a system, or changes inenvironmental conditions, e.g. in the usage pattern, lead to alterations in the failure gener-ating process. Therefore, generally only failure data from one testing phase should be usedfor fitting a software reliability growth model. However, some models - the Musa-Okumotomodel, for example [37] - seem to be able to cope with evolving code at least to some extent.Musa, Iannino and Okumoto [41] describe an extended version of Musa’s basic executiontime model for failure data of a program growing at several discrete points in time.
Instead of fitting one curve to failure times from different stages, information about thetesting done and the extent of changes in the code between the phases could be used forearly prediction of the model parameters of the software reliability growth model at the nextstage (cf. section 4.1) or for the estimation of their prior distributions (cf. section 4.2).How thoroughly testing in earlier phases has been done can either be directly determinedfrom test data of these earlier phases or from the number of failures that occur during theacceptance test at the beginning of the new test phase.
5.5 Failure and testing data from different test cycles
In between two test cycles, i.e. the (system) tests for two releases of the same application,various changes have taken place:
• Faults that were detected in the earlier release have been removed by the developmentteam. However, the removal may have been imperfect, and possibly new faults havebeen introduced into the software.
• New functions have been implemented in addition to or as a substitute for functionsavailable in the earlier release.
Again, it does not seem reasonable to feed all the failure data into one model. However, theold data could be used for predicting (the prior distribution of) the initial fault density orthe initial failure intensity of the new release:
• Even if fault correction was imperfect for “old” code the fault density and failureintensity at the beginning of the system testing phase should still be lower than in theprevious release. Moreover, the older the code is the larger the portion of the remainingfaults with low detectabilities should be.
IST-1999-55017 SRModelStudy.pdf Page 35 of 41

• The initial fault density and failure intensity of “new” parts of the code can be es-timated using failure data from the first test cycle, when the whole application wasnew. The detectability profile can be expected to be more uniform than for parts ofthe software that have been tested several times before.
These calculations require that it is possible to distinguish between executions of new andold code. This could be achieved by classifying test cases as newly executed or repeatedlyexecuted.
IST-1999-55017 SRModelStudy.pdf Page 36 of 41

References
[1] Balzert, H.: Lehrbuch der Software-Technik - Software-Management, Software-Qualitatssicherung, Unternehmensmodellierung, Heidelberg, Berlin, 1998
[2] Campodonico, S.; Singpurwalla, N. D.: A Bayesian Analysis of the Logarithmic-PoissonExecution Time Model Based on Expert Opinion and Failure Data, IEEE Trans. Soft-ware Engineering 20 (1994), pp. 677 - 683
[3] Campodonico, S.; Singpurwalla, N. D.: Inference and Predictions From Poisson PointProcesses Incorporating Expert Knowledge, Journal of the American Statistical Asso-ciation 90 (1995), pp. 220 - 226
[4] Casella, G.; George, E. I.: Explaining the Gibbs Sampler, The American Statistician,Vol. 46 (1992), No. 3, pp. 167 - 174
[5] Chib, S.; Greenberg, E.: Understanding the Metropolis-Hastings Algorithm, The Amer-ican Statistician, Vol. 49 (1995), No. 4, pp. 327 - 335
[6] Chillarege, R.: Chapter 9: Orthogonal Defect Classification, in: Lyu, M. R. (ed.):Handbook of Software Reliability Engineering, New York, San Francisico, et al., 1996,pp. 359 - 400
[7] Chillarege, R.; Bhandari, I. S.; Chaar, J. K.; Halliday, M. J.; Moebus, D. S.; Ray, B.K.; Wong, M.-Y.: Orthogonal Defect Classification - A Concept for In-Process Mea-surements, IBM Thomas J. Watson Research Center, Yorktown Heights, N.Y., 1992,URL = http://chillarege.com/odc/articles/odcconcept/odc.html (site visited 2001-05-31)
[8] Denton, J. A.: Accurate Software Reliability Estimation, Thesis, Colorado State Uni-versity, 1999, URL = http://www.cs.colostate.edu/∼denton/jd thesis.pdf (site visited2001-05-31)
[9] Duran, J. W.; Ntafos, S. C.: An Evaluation of Random Testing, IEEE Trans. SoftwareEng. 10 (1984), pp. 438 - 444
[10] Fahrmeir, L.; Hamerle, A.; Tutz, G.: Regressionsmodelle zur Analyse von Verweil-dauern, in: Fahrmeir, L.; Hamerle, A.; Tutz, G. (ed.): Multivariate statistische Ver-fahren, 2nd edition, Berlin, New York, 1996, pp. 301 - 356
[11] Fahrmeir, L.; Tutz, G.: Multivariate Statistical Modelling Based on Generalized LinearModels, New York, Berlin, et al., 1994
[12] Farr, W.: Chapter 3: Software Reliability Modeling Survey, in: Lyu, M. R. (ed.):Handbook of Software Reliability Engineering, New York, San Francisico, et al., 1996,pp. 71 - 117
[13] Frankl, P. G.; Hamlet, R. G.; Littlewood, B.; Strigini, L.: Evaluating Testing Methodsby Delivered Reliability, IEEE Trans. Software Eng. 24 (1998), pp. 587 -601
IST-1999-55017 SRModelStudy.pdf Page 37 of 41

[14] Gelman, A.; Carlin, J. B.; Stern, H. S.; Rubin, D. B.: Bayesian Data Analysis, London,Glasgow, et al., 1995
[15] Goel, A. L.: Software Reliability Models: Assumptions, Limitations, and Applicability,IEEE Trans. Software Eng. 11 (1985), pp. 1411 - 1423
[16] Goel, A. L.; Okumoto, K.: Time-Dependent Error-Detection Rate Model for Soft-ware Reliability and Other Performance Measures, IEEE Trans. Reliability 28 (1979),pp. 206 - 211
[17] Gokhale, S. S.; Philip, T.; Marinos, P. N.; Trivedi, K. S.: Unification ofFinite Failure Non-Homogeneous Poisson Process Models through Test Cover-age, Technical Report 96-36, Center for Advanced Computing and Communica-tion, Department of Electrical and Computer Engineering, Duke University, 1996,URL = ftp://ftp.eos.ncsu.edu/pub/ccsp/papers/ppr9636.PS (site visited 2001-05-31)
[18] Greene, W. H.: Econometric Analysis, 3rd edition, New Jersey, 1997
[19] Grottke, M.; Dussa-Zieger, K.: Systematic vs. Operational Testing: The Necessity forDifferent Failure Models, to appear in: Proc. Fifth Conference on Quality Engineeringin Software Technology, Nuremberg, 2001
[20] Hamlet, R. (D.): Random Testing, Portland State University, Department of Com-puter Science, URL = ftp://ftp.cs.pdx.edu/pub/faculty/hamlet/random.ps.Z (site vis-ited 2001-05-31)
[21] Hamlet, D.; Taylor, R.: Partition Testing Does Not Inspire Confidence, IEEE Trans.Software Eng. 16 (1990), pp. 1402 - 1411
[22] Horgan, J. R.; London, S.; Lyu, M. R.: Achieving Software Quality with Testing Cov-erage Measures, IEEE Computer, Sept. 1994, pp. 60 - 69
[23] Huang, C.-Y.; Kuo, S.-Y.; Chen I.-Y.: Analysis of a Software Reliability Growth Modelwith Logistic Testing-Effort Function, Proc. Eighth International Symposium on Soft-ware Reliability Engineering, Albuquerque, New Mexico, 1997, pp. 378 - 388
[24] Jelinski, Z.; Moranda, P.: Software Reliability Research, in: Freiberger, W. (ed.): Sta-tistical Computer Performance Evaluation, New York, 1972, pp. 465 - 484
[25] Langberg, N.; Singpurwalla, N. D.: A Unification of Some Software Reliability Models,SIAM Journal of Scientific and Statistical Computing 6 (1985), pp. 781 - 790
[26] Li, N.; Malaiya, Y. K.: Empirical Estimation of Fault Exposure Ratio, Technical ReportCS-93-113, Department of Computer Science, Colorado State University, 1993,URL = http://www.cs.colostate.edu/∼ftppub/TechReports/1993/tr-113.pdf (site vis-ited 2001-05-31)
IST-1999-55017 SRModelStudy.pdf Page 38 of 41
[27] Li, N.; Malaiya, Y. K.: Fault Exposure Ratio - Estimation and Applications, TechnicalReport CS-96-130, Department of Computer Science, Colorado State University, 1996,URL = http://www.cs.colostate.edu/∼ftppub/TechReports/1996/tr96-130.pdf (sitevisited 2001-05-31)
[28] Littlewood, B.; Verrall, J. L.: A Bayesian Reliability Growth Model for ComputerScience, Journal of the Royal Statistical Society, Ser. A (Applied Statistics) 22 (1973),pp. 332 - 346
[29] Lyu, M. R.: Chapter 1: Introduction, in: Lyu, M. R. (ed.): Handbook of SoftwareReliability Engineering, New York, San Francisico, et al., 1996, pp. 3 - 25
[30] Lyu, M. R.: Appendix B: Review of Reliability Theory, Analytical Techniques, andBasic Statistics, in: Lyu, M. R. (ed.): Handbook of Software Reliability Engineering,New York, San Francisico, et al., 1996, pp. 747 - 779
[31] Malaiya, Y. K.; Denton, J.: What Do the Software Reliability Growth Model Pa-rameters Represent?, Technical Report CS-97-115, Department of Computer Science,Colorado State University, 1997,URL = http://www.cs.colostate.edu/∼ftppub/TechReports/1997/tr97-115.pdf (sitevisited 2001-05-31)
[32] Malaiya, Y. K.; von Mayrhauser, A.; Srimani, P. K.: The Nature of Fault Exposure Ra-tio, Proc. Third International Symposium on Software Reliability Engineering, ResearchTriangle Park, NC, October 1992, pp. 23 - 32
[33] Malaiya, Y. K.; von Mayrhauser, A.; Srimani, P. K.: An Examination of Fault ExposureRatio, IEEE Trans. Software Eng. 19 (1993), pp. 1087 -1094
[34] Mazzuchi, T. A.; Soyer, R.: A Bayes Empirical-Bayes Model for Software Reliablity,IEEE Trans. Reliability 37 (1988), pp. 248 - 254
[35] Meeker, W. Q.; Escobar, L. A.: Statistical Methods for Reliability Data, New York,Chichester, et al., 1998
[36] Meinhold, R. J.; Singpurwalla, N. D.: Bayesian Analysis of a Commonly Used Modelfor Describing Software Failures, The Statistician 32 (1983) , pp. 168 - 173
[37] Musa, J. D.: A Theory of Software Reliability and Its Application, IEEE Trans. SoftwareEng. 1 (1975), pp. 312 - 327
[38] Musa, J. D.: Rationale for Fault Exposure Ratio K, ACM SIGSOFT Software Engi-neering Notes vol. 16 no. 3 (July 1991), p. 79
[39] Musa, J. D.: Operational Profiles in Software-Reliability Engineering, IEEE Software,March 1993, pp. 14 - 32
[40] Musa, J. D.: Software Reliability Engineering - More Reliable Software, Faster Devel-opment and Testing, New York, St. Louis, et al., 1998
IST-1999-55017 SRModelStudy.pdf Page 39 of 41

[41] Musa, J. D.; Iannino, A.; Okumoto, K.: Software Reliability - Measurement, Prediction,Application, New York, St. Louis, et al., 1987
[42] Musa, J. D.; Okumoto, K.: A Logarithmic Poisson Execution Time Model for SoftwareReliability Measurement, 1984, in: Malaiya, Y. K.; Srimani, P. K. (ed.): Software Re-liability Models - Theoretical Developments, Evaluation & Applications, Los Alamitos,1990, pp. 23 - 31
[43] Myers, G. J.: Methodisches Testen von Programmen, 6th edition, Munchen, Wien, etal., 1999
[44] Newbold, P.: Statistics for Business and Economics, 3rd edition, Englewood Cliffs, 1991
[45] Ohba, M.: Software reliability analysis models, IBM Journal of Research and Develop-ment 28 (1984), pp. 428 - 443
[46] Paulk, M. C.; Weber, C. V.; Garcia, S. M.; Chrissis, M. B.; Bush, M.: Key Practicesof the Capability Maturity Model, Version 1.1, Technical Report CMU/SEI-93-TR-25ESC-TR-93-178, Software Engineering Institute, Carnegie Mellon University, 1993
[47] Pham, H.: Software Reliability, New York, Berlin, et al., 2000
[48] Piwowarski, P.; Ohba, M.; Caruso, J.: Coverage Measurement Experience DuringFunction Test, Proc. Fifteenth International IEEE Conference on Software Engineering(ICSE), 1993, pp. 287 - 301
[49] Rivers, A. T.: Modeling Software Reliability During Non-Operational Testing, Ph.D.thesis, North Carolina State University, 1998, URL = http://renoir.csc.ncsu.edu/Faculty/Vouk/Papers/Rivers/Thesis/Rivers.Thesis.pdf.zip (site visited 2001-05-31)
[50] Rivers, A. T.; Vouk, M. A.: An Empirical Evaluation of Testing Efficiency duringNon-Operational Testing, Proc. Fourth Software Engineering Research Forum, BocaRaton, 1995, pp. 111 - 120, URL = http://renoir.csc.ncsu.edu/Faculty/Vouk/Papers/SERF96.ps (site visited 2001-05-31)
[51] Rivers, A. T.; Vouk, M. A.: Resource-Constrained Non-Operational Testing of Software,Proc. Ninth International Symposium on Software Reliability Engineering, Paderborn,1998, pp. 154 - 163
[52] Singpurwalla, N. D.: An Interactive PC-Based Procedure for Reliability AssessmentIncorporating Expert Opinion and Survival Data, Journal of the American StatisticalAssociation, Vol. 83 (1988), No. 401, pp. 43 - 51
[53] Singpurwalla, N. D.; Wilson, S. P.: Software Reliability Modeling, International Statis-tical Review, Vol. 62 (1994), No. 3, pp. 289 - 317
[54] Singpurwalla, N. D.; Wilson, S. P.: Statistical Methods in Software Engineering - Reli-ability and Risk, New York, Berlin, et al., 1999
IST-1999-55017 SRModelStudy.pdf Page 40 of 41

[55] Vouk, M. A.: Using Reliability Models During Testing With Non-Operational Profiles,1992, URL = http://renoir.csc.ncsu.edu/Faculty/Vouk/Papers/non op testing.ps (sitevisited 2001-05-31)
[56] Wong, E. W.; Horgan, J. R.; London, S.; Mathur, A. P.: Effect of Test Set Size andBlock Coverage on the Fault Detection Effectiveness, Technical Report SERC-TR-153-P, Software Engineering Research Center, 1994,URL = http://www.serc.net/TechReports/files/TR153P.PS (site visited 2001-05-31)
[57] Wong, W. E.; Horgan, J. R.; London, S.; Mathur, A. P.: Effect of Test Set Minimizationon Fault Detection Effectiveness, Proc. Seventeenth International IEEE Conference onSoftware Engineering (ICSE), 1995, pp. 41 - 50
[58] Yamada, S.; Hishitani, J.; Osaki, S.: Software-Reliability Growth with a Weibull Test-Effort: A Model & Application, IEEE Trans. Reliability 42 (1993), pp. 100 - 106
[59] Yamada, S.; Ohtera, H.; Narihisa, H.: Software Reliability Growth Models with Testing-Effort, IEEE Trans. Reliability 35 (1986), pp. 19 - 23
IST-1999-55017 SRModelStudy.pdf Page 41 of 41